Black/African American vs Okinawan Unemployment Among Seniors over 75 years
COMPARE
Black/African American
Okinawan
Unemployment Among Seniors over 75 years
Unemployment Among Seniors over 75 years Comparison
Blacks/African Americans
Okinawans
9.4%
UNEMPLOYMENT AMONG SENIORS OVER 75 YEARS
0.5/ 100
METRIC RATING
266th/ 347
METRIC RANK
8.8%
UNEMPLOYMENT AMONG SENIORS OVER 75 YEARS
28.9/ 100
METRIC RATING
195th/ 347
METRIC RANK
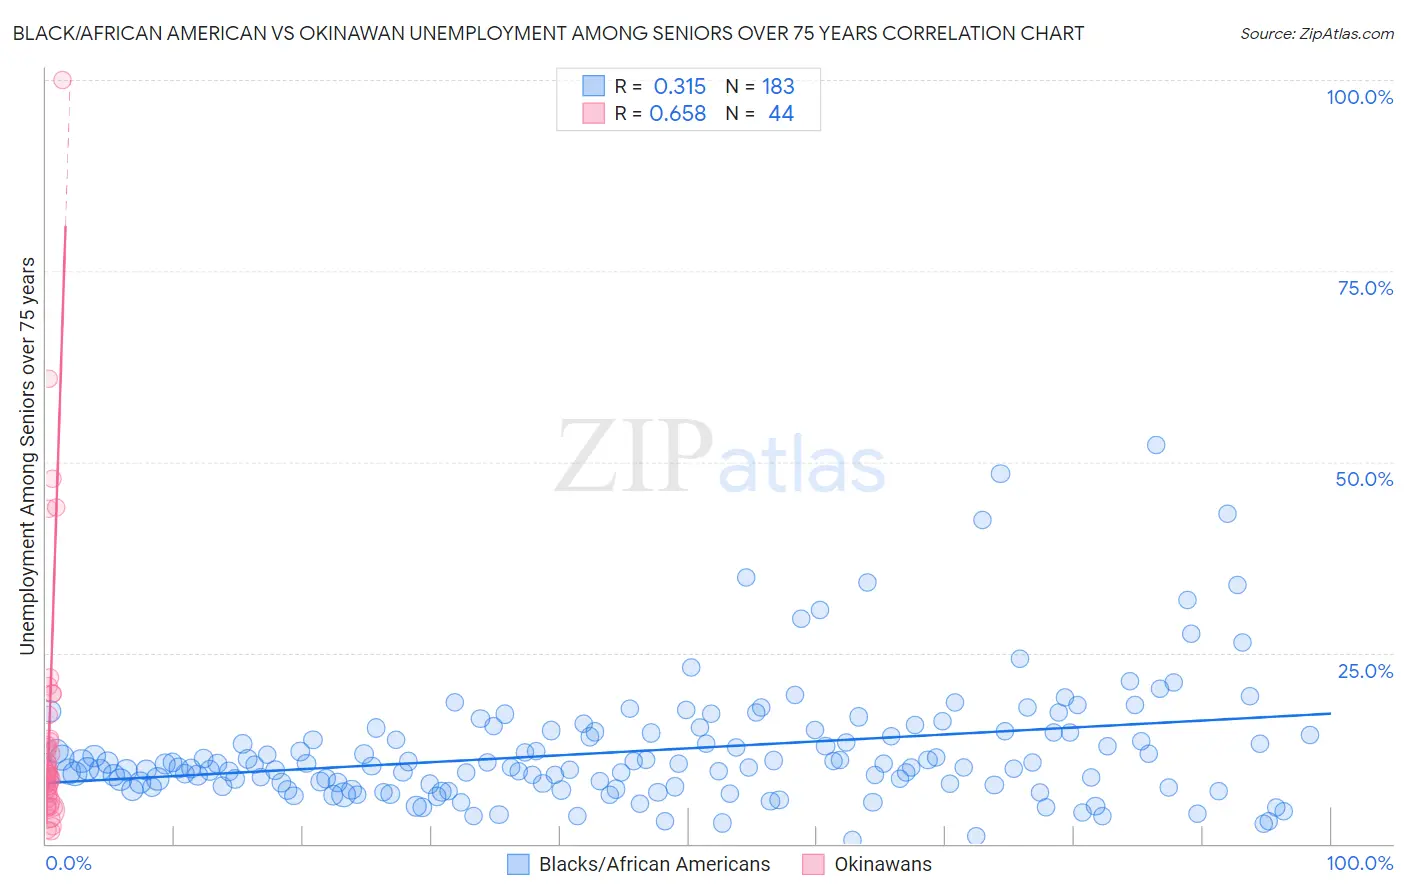
Black/African American vs Okinawan Unemployment Among Seniors over 75 years Correlation Chart
The statistical analysis conducted on geographies consisting of 234,580,439 people shows a mild positive correlation between the proportion of Blacks/African Americans and unemployment rate among seniors over the age of 75 in the United States with a correlation coefficient (R) of 0.315 and weighted average of 9.4%. Similarly, the statistical analysis conducted on geographies consisting of 59,425,969 people shows a significant positive correlation between the proportion of Okinawans and unemployment rate among seniors over the age of 75 in the United States with a correlation coefficient (R) of 0.658 and weighted average of 8.8%, a difference of 5.9%.
Unemployment Among Seniors over 75 years Correlation Summary
| Measurement | Black/African American | Okinawan |
| Minimum | 0.50% | 1.6% |
| Maximum | 52.2% | 100.0% |
| Range | 51.7% | 98.4% |
| Mean | 12.2% | 15.1% |
| Median | 10.2% | 9.1% |
| Interquartile 25% (IQ1) | 7.6% | 6.3% |
| Interquartile 75% (IQ3) | 14.6% | 13.6% |
| Interquartile Range (IQR) | 7.0% | 7.3% |
| Standard Deviation (Sample) | 8.0% | 18.2% |
| Standard Deviation (Population) | 8.0% | 18.0% |
Similar Demographics by Unemployment Among Seniors over 75 years
Demographics Similar to Blacks/African Americans by Unemployment Among Seniors over 75 years
In terms of unemployment among seniors over 75 years, the demographic groups most similar to Blacks/African Americans are Immigrants from Mexico (9.4%, a difference of 0.12%), Greek (9.4%, a difference of 0.28%), Palestinian (9.3%, a difference of 0.32%), Puerto Rican (9.4%, a difference of 0.42%), and Iroquois (9.3%, a difference of 0.45%).
| Demographics | Rating | Rank | Unemployment Among Seniors over 75 years |
| Slovenes | 1.0 /100 | #259 | Tragic 9.3% |
| Immigrants | Cameroon | 1.0 /100 | #260 | Tragic 9.3% |
| Celtics | 0.8 /100 | #261 | Tragic 9.3% |
| Austrians | 0.7 /100 | #262 | Tragic 9.3% |
| Ukrainians | 0.7 /100 | #263 | Tragic 9.3% |
| Iroquois | 0.7 /100 | #264 | Tragic 9.3% |
| Palestinians | 0.6 /100 | #265 | Tragic 9.3% |
| Blacks/African Americans | 0.5 /100 | #266 | Tragic 9.4% |
| Immigrants | Mexico | 0.4 /100 | #267 | Tragic 9.4% |
| Greeks | 0.4 /100 | #268 | Tragic 9.4% |
| Puerto Ricans | 0.3 /100 | #269 | Tragic 9.4% |
| Yaqui | 0.3 /100 | #270 | Tragic 9.4% |
| Bulgarians | 0.3 /100 | #271 | Tragic 9.4% |
| Immigrants | Iraq | 0.3 /100 | #272 | Tragic 9.4% |
| Czechoslovakians | 0.3 /100 | #273 | Tragic 9.4% |
Demographics Similar to Okinawans by Unemployment Among Seniors over 75 years
In terms of unemployment among seniors over 75 years, the demographic groups most similar to Okinawans are Maltese (8.8%, a difference of 0.020%), Immigrants from Guyana (8.8%, a difference of 0.070%), Immigrants from Jamaica (8.9%, a difference of 0.070%), Immigrants from Laos (8.9%, a difference of 0.17%), and Immigrants from Kenya (8.8%, a difference of 0.18%).
| Demographics | Rating | Rank | Unemployment Among Seniors over 75 years |
| Immigrants | Eastern Europe | 34.7 /100 | #188 | Fair 8.8% |
| Immigrants | Haiti | 34.7 /100 | #189 | Fair 8.8% |
| Mexican American Indians | 34.7 /100 | #190 | Fair 8.8% |
| Estonians | 33.3 /100 | #191 | Fair 8.8% |
| Immigrants | Kenya | 31.8 /100 | #192 | Fair 8.8% |
| Immigrants | Guyana | 29.9 /100 | #193 | Fair 8.8% |
| Maltese | 29.2 /100 | #194 | Fair 8.8% |
| Okinawans | 28.9 /100 | #195 | Fair 8.8% |
| Immigrants | Jamaica | 27.7 /100 | #196 | Fair 8.9% |
| Immigrants | Laos | 26.3 /100 | #197 | Fair 8.9% |
| Eastern Europeans | 25.9 /100 | #198 | Fair 8.9% |
| Pakistanis | 25.4 /100 | #199 | Fair 8.9% |
| Osage | 25.4 /100 | #200 | Fair 8.9% |
| Immigrants | Peru | 24.3 /100 | #201 | Fair 8.9% |
| Russians | 24.1 /100 | #202 | Fair 8.9% |