Senegalese vs European Householder Income Over 65 years
COMPARE
Senegalese
European
Householder Income Over 65 years
Householder Income Over 65 years Comparison
Senegalese
Europeans
$53,591
HOUSEHOLDER INCOME OVER 65 YEARS
0.0/ 100
METRIC RATING
294th/ 347
METRIC RANK
$63,779
HOUSEHOLDER INCOME OVER 65 YEARS
95.0/ 100
METRIC RATING
109th/ 347
METRIC RANK
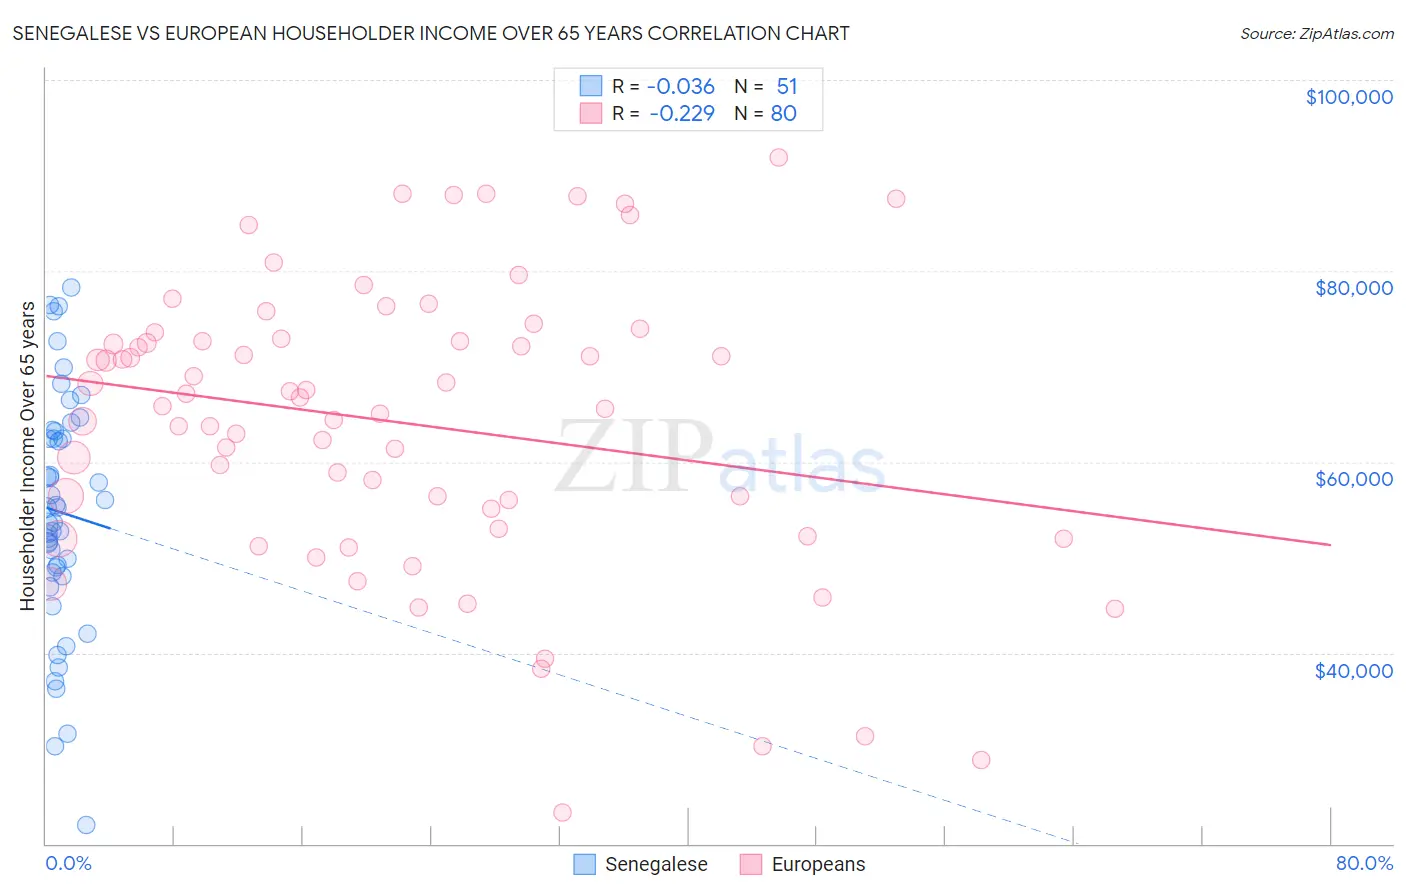
Senegalese vs European Householder Income Over 65 years Correlation Chart
The statistical analysis conducted on geographies consisting of 78,053,259 people shows no correlation between the proportion of Senegalese and household income with householder over the age of 65 in the United States with a correlation coefficient (R) of -0.036 and weighted average of $53,591. Similarly, the statistical analysis conducted on geographies consisting of 557,215,032 people shows a weak negative correlation between the proportion of Europeans and household income with householder over the age of 65 in the United States with a correlation coefficient (R) of -0.229 and weighted average of $63,779, a difference of 19.0%.
Householder Income Over 65 years Correlation Summary
| Measurement | Senegalese | European |
| Minimum | $21,940 | $23,269 |
| Maximum | $78,302 | $91,861 |
| Range | $56,362 | $68,592 |
| Mean | $54,750 | $64,098 |
| Median | $55,203 | $66,247 |
| Interquartile 25% (IQ1) | $48,378 | $54,019 |
| Interquartile 75% (IQ3) | $63,248 | $72,739 |
| Interquartile Range (IQR) | $14,869 | $18,720 |
| Standard Deviation (Sample) | $12,398 | $14,994 |
| Standard Deviation (Population) | $12,276 | $14,900 |
Similar Demographics by Householder Income Over 65 years
Demographics Similar to Senegalese by Householder Income Over 65 years
In terms of householder income over 65 years, the demographic groups most similar to Senegalese are Immigrants from Belize ($53,665, a difference of 0.14%), Shoshone ($53,681, a difference of 0.17%), African ($53,711, a difference of 0.22%), Chickasaw ($53,732, a difference of 0.26%), and Iroquois ($53,737, a difference of 0.27%).
| Demographics | Rating | Rank | Householder Income Over 65 years |
| Immigrants | Barbados | 0.1 /100 | #287 | Tragic $53,766 |
| Paiute | 0.1 /100 | #288 | Tragic $53,762 |
| Iroquois | 0.1 /100 | #289 | Tragic $53,737 |
| Chickasaw | 0.1 /100 | #290 | Tragic $53,732 |
| Africans | 0.0 /100 | #291 | Tragic $53,711 |
| Shoshone | 0.0 /100 | #292 | Tragic $53,681 |
| Immigrants | Belize | 0.0 /100 | #293 | Tragic $53,665 |
| Senegalese | 0.0 /100 | #294 | Tragic $53,591 |
| Immigrants | Central America | 0.0 /100 | #295 | Tragic $53,420 |
| Immigrants | Somalia | 0.0 /100 | #296 | Tragic $53,333 |
| Immigrants | Latin America | 0.0 /100 | #297 | Tragic $53,265 |
| Central American Indians | 0.0 /100 | #298 | Tragic $53,232 |
| Ottawa | 0.0 /100 | #299 | Tragic $53,217 |
| Immigrants | Bahamas | 0.0 /100 | #300 | Tragic $53,174 |
| Yuman | 0.0 /100 | #301 | Tragic $53,110 |
Demographics Similar to Europeans by Householder Income Over 65 years
In terms of householder income over 65 years, the demographic groups most similar to Europeans are Palestinian ($63,800, a difference of 0.030%), Pakistani ($63,844, a difference of 0.10%), Italian ($63,885, a difference of 0.17%), Immigrants from Argentina ($63,885, a difference of 0.17%), and Immigrants from Cameroon ($63,907, a difference of 0.20%).
| Demographics | Rating | Rank | Householder Income Over 65 years |
| Chileans | 95.8 /100 | #102 | Exceptional $63,957 |
| British | 95.7 /100 | #103 | Exceptional $63,940 |
| Immigrants | Cameroon | 95.6 /100 | #104 | Exceptional $63,907 |
| Italians | 95.5 /100 | #105 | Exceptional $63,885 |
| Immigrants | Argentina | 95.5 /100 | #106 | Exceptional $63,885 |
| Pakistanis | 95.3 /100 | #107 | Exceptional $63,844 |
| Palestinians | 95.1 /100 | #108 | Exceptional $63,800 |
| Europeans | 95.0 /100 | #109 | Exceptional $63,779 |
| Immigrants | Zimbabwe | 94.3 /100 | #110 | Exceptional $63,643 |
| Immigrants | Spain | 93.7 /100 | #111 | Exceptional $63,540 |
| Syrians | 93.4 /100 | #112 | Exceptional $63,494 |
| Immigrants | Serbia | 92.7 /100 | #113 | Exceptional $63,387 |
| Immigrants | Saudi Arabia | 92.4 /100 | #114 | Exceptional $63,355 |
| Croatians | 91.4 /100 | #115 | Exceptional $63,225 |
| Guamanians/Chamorros | 91.1 /100 | #116 | Exceptional $63,187 |