Argentinean vs European Householder Income Over 65 years
COMPARE
Argentinean
European
Householder Income Over 65 years
Householder Income Over 65 years Comparison
Argentineans
Europeans
$65,246
HOUSEHOLDER INCOME OVER 65 YEARS
98.9/ 100
METRIC RATING
72nd/ 347
METRIC RANK
$63,779
HOUSEHOLDER INCOME OVER 65 YEARS
95.0/ 100
METRIC RATING
109th/ 347
METRIC RANK
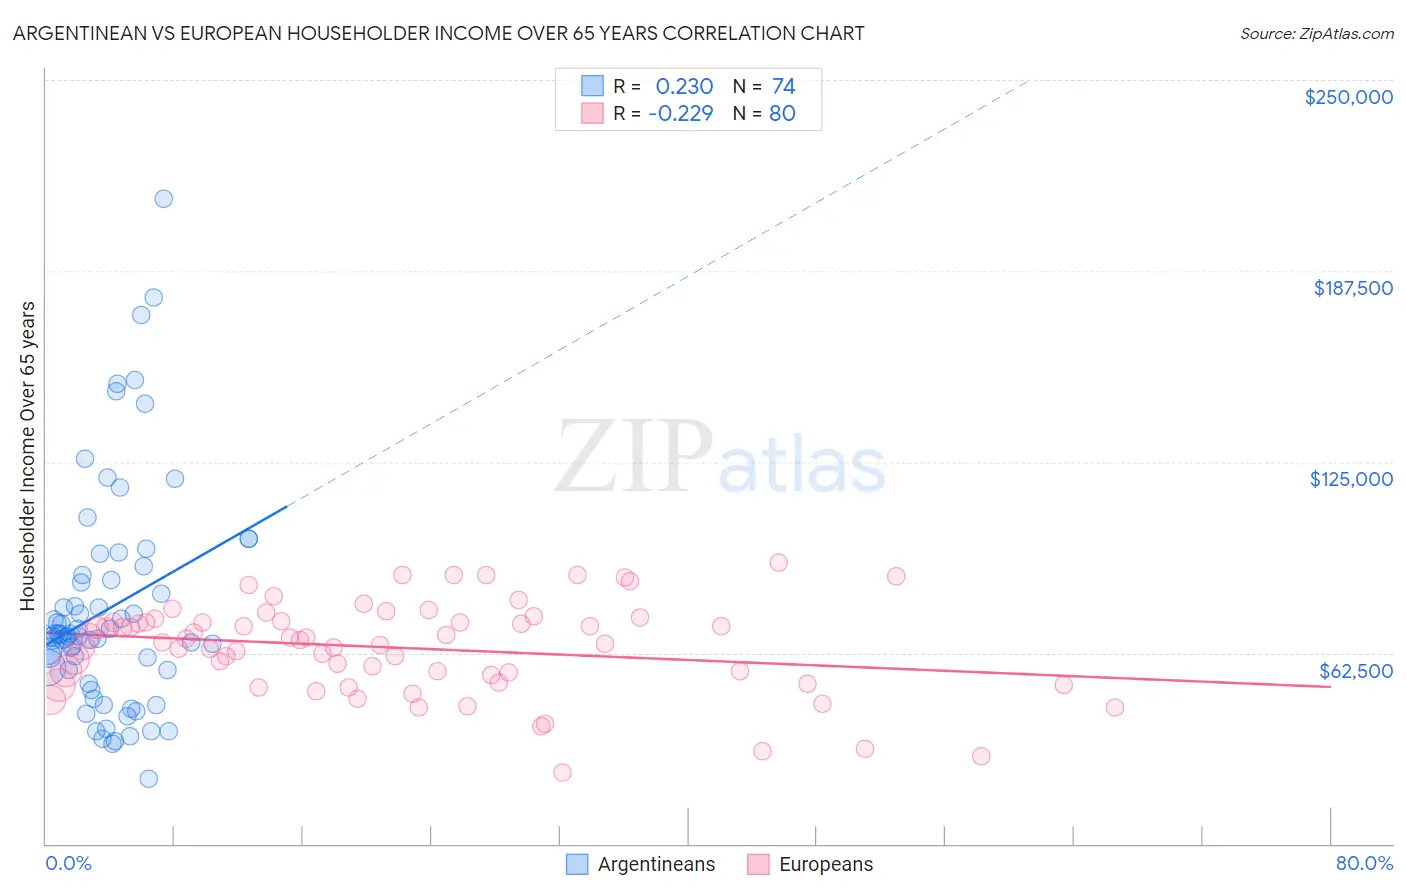
Argentinean vs European Householder Income Over 65 years Correlation Chart
The statistical analysis conducted on geographies consisting of 296,532,812 people shows a weak positive correlation between the proportion of Argentineans and household income with householder over the age of 65 in the United States with a correlation coefficient (R) of 0.230 and weighted average of $65,246. Similarly, the statistical analysis conducted on geographies consisting of 557,215,032 people shows a weak negative correlation between the proportion of Europeans and household income with householder over the age of 65 in the United States with a correlation coefficient (R) of -0.229 and weighted average of $63,779, a difference of 2.3%.
Householder Income Over 65 years Correlation Summary
| Measurement | Argentinean | European |
| Minimum | $21,406 | $23,269 |
| Maximum | $211,250 | $91,861 |
| Range | $189,844 | $68,592 |
| Mean | $76,897 | $64,098 |
| Median | $68,316 | $66,247 |
| Interquartile 25% (IQ1) | $56,796 | $54,019 |
| Interquartile 75% (IQ3) | $87,790 | $72,739 |
| Interquartile Range (IQR) | $30,994 | $18,720 |
| Standard Deviation (Sample) | $36,797 | $14,994 |
| Standard Deviation (Population) | $36,547 | $14,900 |
Similar Demographics by Householder Income Over 65 years
Demographics Similar to Argentineans by Householder Income Over 65 years
In terms of householder income over 65 years, the demographic groups most similar to Argentineans are Immigrants from Ethiopia ($65,238, a difference of 0.010%), Lithuanian ($65,209, a difference of 0.060%), Greek ($65,306, a difference of 0.090%), Mongolian ($65,326, a difference of 0.12%), and Samoan ($65,427, a difference of 0.28%).
| Demographics | Rating | Rank | Householder Income Over 65 years |
| Immigrants | England | 99.3 /100 | #65 | Exceptional $65,715 |
| South Africans | 99.3 /100 | #66 | Exceptional $65,652 |
| Immigrants | Malaysia | 99.1 /100 | #67 | Exceptional $65,497 |
| Egyptians | 99.1 /100 | #68 | Exceptional $65,441 |
| Samoans | 99.1 /100 | #69 | Exceptional $65,427 |
| Mongolians | 99.0 /100 | #70 | Exceptional $65,326 |
| Greeks | 98.9 /100 | #71 | Exceptional $65,306 |
| Argentineans | 98.9 /100 | #72 | Exceptional $65,246 |
| Immigrants | Ethiopia | 98.9 /100 | #73 | Exceptional $65,238 |
| Lithuanians | 98.8 /100 | #74 | Exceptional $65,209 |
| Sierra Leoneans | 98.6 /100 | #75 | Exceptional $65,038 |
| Ethiopians | 98.5 /100 | #76 | Exceptional $64,989 |
| Immigrants | Canada | 98.5 /100 | #77 | Exceptional $64,952 |
| Immigrants | Western Europe | 98.5 /100 | #78 | Exceptional $64,933 |
| Hawaiians | 98.4 /100 | #79 | Exceptional $64,920 |
Demographics Similar to Europeans by Householder Income Over 65 years
In terms of householder income over 65 years, the demographic groups most similar to Europeans are Palestinian ($63,800, a difference of 0.030%), Pakistani ($63,844, a difference of 0.10%), Italian ($63,885, a difference of 0.17%), Immigrants from Argentina ($63,885, a difference of 0.17%), and Immigrants from Cameroon ($63,907, a difference of 0.20%).
| Demographics | Rating | Rank | Householder Income Over 65 years |
| Chileans | 95.8 /100 | #102 | Exceptional $63,957 |
| British | 95.7 /100 | #103 | Exceptional $63,940 |
| Immigrants | Cameroon | 95.6 /100 | #104 | Exceptional $63,907 |
| Italians | 95.5 /100 | #105 | Exceptional $63,885 |
| Immigrants | Argentina | 95.5 /100 | #106 | Exceptional $63,885 |
| Pakistanis | 95.3 /100 | #107 | Exceptional $63,844 |
| Palestinians | 95.1 /100 | #108 | Exceptional $63,800 |
| Europeans | 95.0 /100 | #109 | Exceptional $63,779 |
| Immigrants | Zimbabwe | 94.3 /100 | #110 | Exceptional $63,643 |
| Immigrants | Spain | 93.7 /100 | #111 | Exceptional $63,540 |
| Syrians | 93.4 /100 | #112 | Exceptional $63,494 |
| Immigrants | Serbia | 92.7 /100 | #113 | Exceptional $63,387 |
| Immigrants | Saudi Arabia | 92.4 /100 | #114 | Exceptional $63,355 |
| Croatians | 91.4 /100 | #115 | Exceptional $63,225 |
| Guamanians/Chamorros | 91.1 /100 | #116 | Exceptional $63,187 |