German Russian vs European Householder Income Over 65 years
COMPARE
German Russian
European
Householder Income Over 65 years
Householder Income Over 65 years Comparison
German Russians
Europeans
$55,356
HOUSEHOLDER INCOME OVER 65 YEARS
0.3/ 100
METRIC RATING
256th/ 347
METRIC RANK
$63,779
HOUSEHOLDER INCOME OVER 65 YEARS
95.0/ 100
METRIC RATING
109th/ 347
METRIC RANK
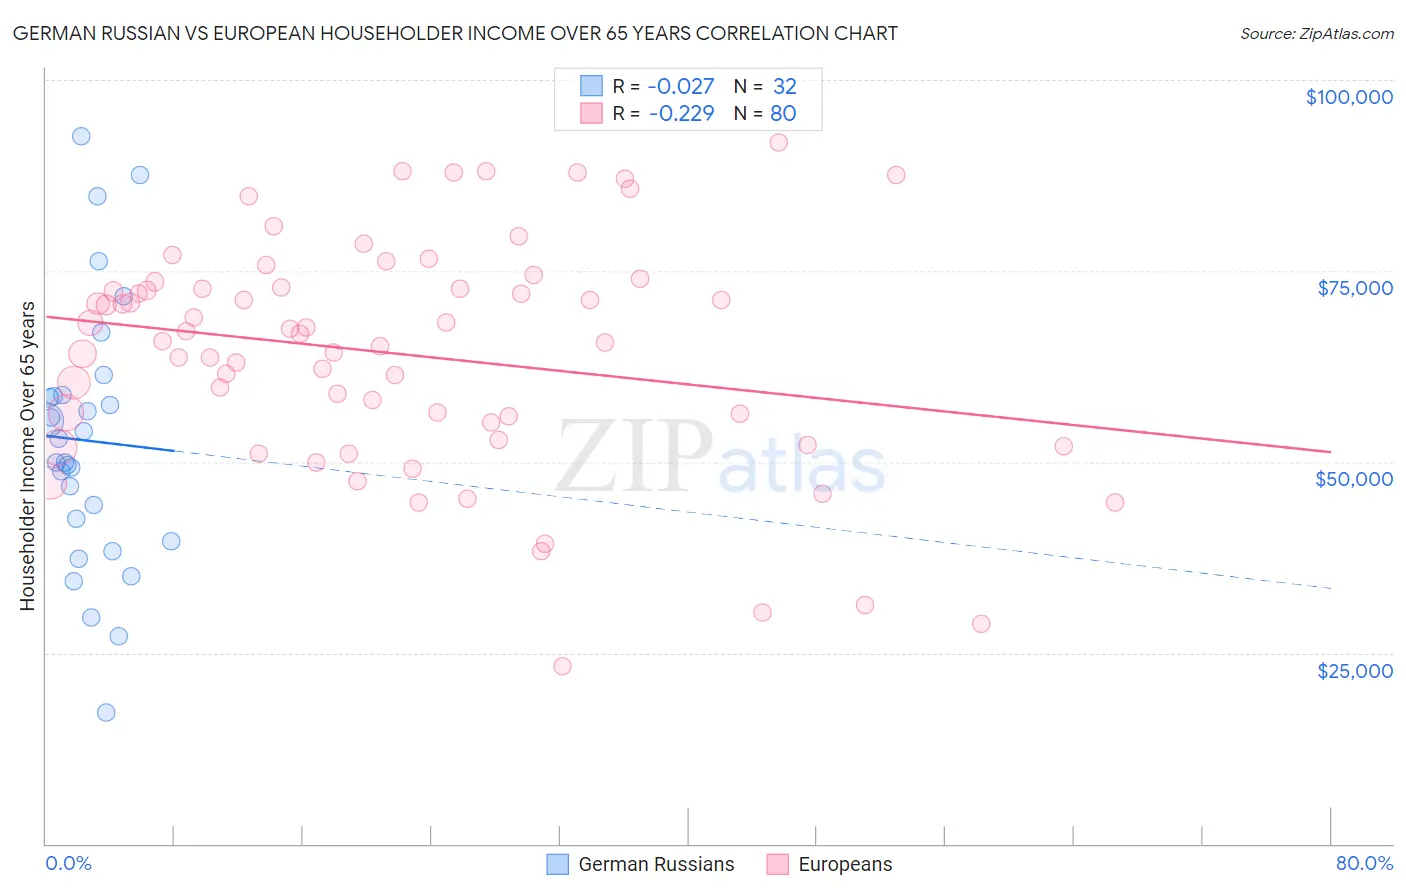
German Russian vs European Householder Income Over 65 years Correlation Chart
The statistical analysis conducted on geographies consisting of 96,303,967 people shows no correlation between the proportion of German Russians and household income with householder over the age of 65 in the United States with a correlation coefficient (R) of -0.027 and weighted average of $55,356. Similarly, the statistical analysis conducted on geographies consisting of 557,215,032 people shows a weak negative correlation between the proportion of Europeans and household income with householder over the age of 65 in the United States with a correlation coefficient (R) of -0.229 and weighted average of $63,779, a difference of 15.2%.
Householder Income Over 65 years Correlation Summary
| Measurement | German Russian | European |
| Minimum | $17,222 | $23,269 |
| Maximum | $92,589 | $91,861 |
| Range | $75,367 | $68,592 |
| Mean | $52,783 | $64,098 |
| Median | $51,516 | $66,247 |
| Interquartile 25% (IQ1) | $41,107 | $54,019 |
| Interquartile 75% (IQ3) | $58,681 | $72,739 |
| Interquartile Range (IQR) | $17,574 | $18,720 |
| Standard Deviation (Sample) | $17,181 | $14,994 |
| Standard Deviation (Population) | $16,911 | $14,900 |
Similar Demographics by Householder Income Over 65 years
Demographics Similar to German Russians by Householder Income Over 65 years
In terms of householder income over 65 years, the demographic groups most similar to German Russians are Trinidadian and Tobagonian ($55,327, a difference of 0.050%), Immigrants from Bangladesh ($55,394, a difference of 0.070%), American ($55,527, a difference of 0.31%), Immigrants from Trinidad and Tobago ($55,598, a difference of 0.44%), and Osage ($55,677, a difference of 0.58%).
| Demographics | Rating | Rank | Householder Income Over 65 years |
| Mexican American Indians | 0.6 /100 | #249 | Tragic $56,089 |
| Immigrants | Bosnia and Herzegovina | 0.5 /100 | #250 | Tragic $55,986 |
| Immigrants | Portugal | 0.5 /100 | #251 | Tragic $55,924 |
| Osage | 0.4 /100 | #252 | Tragic $55,677 |
| Immigrants | Trinidad and Tobago | 0.4 /100 | #253 | Tragic $55,598 |
| Americans | 0.3 /100 | #254 | Tragic $55,527 |
| Immigrants | Bangladesh | 0.3 /100 | #255 | Tragic $55,394 |
| German Russians | 0.3 /100 | #256 | Tragic $55,356 |
| Trinidadians and Tobagonians | 0.3 /100 | #257 | Tragic $55,327 |
| Ecuadorians | 0.2 /100 | #258 | Tragic $54,958 |
| West Indians | 0.2 /100 | #259 | Tragic $54,936 |
| Immigrants | West Indies | 0.2 /100 | #260 | Tragic $54,927 |
| Comanche | 0.2 /100 | #261 | Tragic $54,922 |
| Bangladeshis | 0.1 /100 | #262 | Tragic $54,719 |
| French American Indians | 0.1 /100 | #263 | Tragic $54,699 |
Demographics Similar to Europeans by Householder Income Over 65 years
In terms of householder income over 65 years, the demographic groups most similar to Europeans are Palestinian ($63,800, a difference of 0.030%), Pakistani ($63,844, a difference of 0.10%), Italian ($63,885, a difference of 0.17%), Immigrants from Argentina ($63,885, a difference of 0.17%), and Immigrants from Cameroon ($63,907, a difference of 0.20%).
| Demographics | Rating | Rank | Householder Income Over 65 years |
| Chileans | 95.8 /100 | #102 | Exceptional $63,957 |
| British | 95.7 /100 | #103 | Exceptional $63,940 |
| Immigrants | Cameroon | 95.6 /100 | #104 | Exceptional $63,907 |
| Italians | 95.5 /100 | #105 | Exceptional $63,885 |
| Immigrants | Argentina | 95.5 /100 | #106 | Exceptional $63,885 |
| Pakistanis | 95.3 /100 | #107 | Exceptional $63,844 |
| Palestinians | 95.1 /100 | #108 | Exceptional $63,800 |
| Europeans | 95.0 /100 | #109 | Exceptional $63,779 |
| Immigrants | Zimbabwe | 94.3 /100 | #110 | Exceptional $63,643 |
| Immigrants | Spain | 93.7 /100 | #111 | Exceptional $63,540 |
| Syrians | 93.4 /100 | #112 | Exceptional $63,494 |
| Immigrants | Serbia | 92.7 /100 | #113 | Exceptional $63,387 |
| Immigrants | Saudi Arabia | 92.4 /100 | #114 | Exceptional $63,355 |
| Croatians | 91.4 /100 | #115 | Exceptional $63,225 |
| Guamanians/Chamorros | 91.1 /100 | #116 | Exceptional $63,187 |