Immigrants from Eastern Africa vs Danish Householder Income Over 65 years

COMPARE

Immigrants from Eastern Africa
Race
Ancestry
AfghanAfricanAlaska NativeAlaskan AthabascanAlbanianAleutAlsatianAmericanApacheArabArapahoArgentineanArmenianAssyrian/Chaldean/SyriacAustralianAustrianBahamianBangladeshiBarbadianBasqueBelgianBelizeanBermudanBhutaneseBlackfeetBolivianBrazilianBritishBritish West IndianBulgarianBurmeseCajunCambodianCanadianCape VerdeanCarpatho RusynCelticCentral AmericanCentral American IndianCherokeeCheyenneChickasawChileanChineseChippewaChoctawColombianColvilleComancheCosta RicanCreeCreekCroatianCrowCubanCypriotCzechCzechoslovakianDelawareDominicanDutchDutch West IndianEastern EuropeanEcuadorianEgyptianEnglishEstonianEthiopianEuropeanFijianFilipinoFinnishFrenchFrench American IndianFrench CanadianGermanGerman RussianGhanaianGreekGuamanian/ChamorroGuatemalanGuyaneseHaitianHmongHonduranHopiHoumaHungarianIcelanderIndian (Asian)IndonesianInupiatIranianIraqiIrishIroquoisIsraeliItalianJamaicanJapaneseJordanianKenyanKiowaKoreanLaotianLatvianLebaneseLiberianLithuanianLumbeeLuxembourgerMacedonianMalaysianMalteseMarshalleseMenomineeMexicanMexican American IndianMongolianMoroccanNative HawaiianNavajoNepaleseNew ZealanderNicaraguanNigerianNorthern EuropeanNorwegianOkinawanOsageOttawaPaiutePakistaniPalestinianPanamanianParaguayanPennsylvania GermanPeruvianPimaPolishPortuguesePotawatomiPuebloPuerto RicanPuget Sound SalishRomanianRussianSalvadoranSamoanScandinavianScotch-IrishScottishSeminoleSenegaleseSerbianShoshoneSierra LeoneanSiouxSlavicSlovakSloveneSomaliSouth AfricanSouth AmericanSouth American IndianSoviet UnionSpaniardSpanishSpanish AmericanSpanish American IndianSri LankanSubsaharan AfricanSudaneseSwedishSwissSyrianTaiwaneseThaiTlingit-HaidaTohono O'OdhamTonganTrinidadian and TobagonianTsimshianTurkishU.S. Virgin IslanderUgandanUkrainianUruguayanUteVenezuelanVietnameseWelshWest IndianYakamaYaquiYugoslavianYumanYup'ikZimbabwean
Immigration
NonimmigrantsImmigrantsAfghanistanAfricaAlbaniaArgentinaArmeniaAsiaAustraliaAustriaBahamasBangladeshBarbadosBelarusBelgiumBelizeBoliviaBosnia and HerzegovinaBrazilBulgariaBurma/MyanmarCabo VerdeCambodiaCameroonCanadaCaribbeanCentral AmericaChileChinaColombiaCongoCosta RicaCroatiaCubaCzechoslovakiaDenmarkDominicaDominican RepublicEastern AfricaEastern AsiaEastern EuropeEcuadorEgyptEl SalvadorEnglandEritreaEthiopiaEuropeFijiFranceGermanyGhanaGreeceGrenadaGuatemalaGuyanaHaitiHondurasHong KongHungaryIndiaIndonesiaIranIraqIrelandIsraelItalyJamaicaJapanJordanKazakhstanKenyaKoreaKuwaitLaosLatin AmericaLatviaLebanonLiberiaLithuaniaMalaysiaMexicoMicronesiaMiddle AfricaMoldovaMoroccoNepalNetherlandsNicaraguaNigeriaNorth AmericaNorth MacedoniaNorthern AfricaNorthern EuropeNorwayOceaniaPakistanPanamaPeruPhilippinesPolandPortugalRomaniaRussiaSaudi ArabiaScotlandSenegalSerbiaSierra LeoneSingaporeSomaliaSouth AfricaSouth AmericaSouth Central AsiaSouth Eastern AsiaSouthern EuropeSpainSri LankaSt. Vincent and the GrenadinesSudanSwedenSwitzerlandSyriaTaiwanThailandTrinidad and TobagoTurkeyUgandaUkraineUruguayUzbekistanVenezuelaVietnamWest IndiesWestern AfricaWestern AsiaWestern EuropeYemenZaireZimbabweAzores
Danish
Race
Ancestry
AfghanAfricanAlaska NativeAlaskan AthabascanAlbanianAleutAlsatianAmericanApacheArabArapahoArgentineanArmenianAssyrian/Chaldean/SyriacAustralianAustrianBahamianBangladeshiBarbadianBasqueBelgianBelizeanBermudanBhutaneseBlackfeetBolivianBrazilianBritishBritish West IndianBulgarianBurmeseCajunCambodianCanadianCape VerdeanCarpatho RusynCelticCentral AmericanCentral American IndianCherokeeCheyenneChickasawChileanChineseChippewaChoctawColombianColvilleComancheCosta RicanCreeCreekCroatianCrowCubanCypriotCzechCzechoslovakianDanishDelawareDominicanDutchDutch West IndianEastern EuropeanEcuadorianEgyptianEnglishEstonianEthiopianEuropeanFijianFilipinoFinnishFrenchFrench American IndianFrench CanadianGermanGerman RussianGhanaianGreekGuamanian/ChamorroGuatemalanGuyaneseHaitianHmongHonduranHopiHoumaHungarianIcelanderIndian (Asian)IndonesianInupiatIranianIraqiIrishIroquoisIsraeliItalianJamaicanJapaneseJordanianKenyanKiowaKoreanLaotianLatvianLebaneseLiberianLithuanianLumbeeLuxembourgerMacedonianMalaysianMalteseMarshalleseMenomineeMexicanMexican American IndianMongolianMoroccanNative HawaiianNavajoNepaleseNew ZealanderNicaraguanNigerianNorthern EuropeanNorwegianOkinawanOsageOttawaPaiutePakistaniPalestinianPanamanianParaguayanPennsylvania GermanPeruvianPimaPolishPortuguesePotawatomiPuebloPuerto RicanPuget Sound SalishRomanianRussianSalvadoranSamoanScandinavianScotch-IrishScottishSeminoleSenegaleseSerbianShoshoneSierra LeoneanSiouxSlavicSlovakSloveneSomaliSouth AfricanSouth AmericanSouth American IndianSoviet UnionSpaniardSpanishSpanish AmericanSpanish American IndianSri LankanSubsaharan AfricanSudaneseSwedishSwissSyrianTaiwaneseThaiTlingit-HaidaTohono O'OdhamTonganTrinidadian and TobagonianTsimshianTurkishU.S. Virgin IslanderUgandanUkrainianUruguayanUteVenezuelanVietnameseWelshWest IndianYakamaYaquiYugoslavianYumanYup'ikZimbabwean
Immigration
NonimmigrantsImmigrantsAfghanistanAfricaAlbaniaArgentinaArmeniaAsiaAustraliaAustriaBahamasBangladeshBarbadosBelarusBelgiumBelizeBoliviaBosnia and HerzegovinaBrazilBulgariaBurma/MyanmarCabo VerdeCambodiaCameroonCanadaCaribbeanCentral AmericaChileChinaColombiaCongoCosta RicaCroatiaCubaCzechoslovakiaDenmarkDominicaDominican RepublicEastern AsiaEastern EuropeEcuadorEgyptEl SalvadorEnglandEritreaEthiopiaEuropeFijiFranceGermanyGhanaGreeceGrenadaGuatemalaGuyanaHaitiHondurasHong KongHungaryIndiaIndonesiaIranIraqIrelandIsraelItalyJamaicaJapanJordanKazakhstanKenyaKoreaKuwaitLaosLatin AmericaLatviaLebanonLiberiaLithuaniaMalaysiaMexicoMicronesiaMiddle AfricaMoldovaMoroccoNepalNetherlandsNicaraguaNigeriaNorth AmericaNorth MacedoniaNorthern AfricaNorthern EuropeNorwayOceaniaPakistanPanamaPeruPhilippinesPolandPortugalRomaniaRussiaSaudi ArabiaScotlandSenegalSerbiaSierra LeoneSingaporeSomaliaSouth AfricaSouth AmericaSouth Central AsiaSouth Eastern AsiaSouthern EuropeSpainSri LankaSt. Vincent and the GrenadinesSudanSwedenSwitzerlandSyriaTaiwanThailandTrinidad and TobagoTurkeyUgandaUkraineUruguayUzbekistanVenezuelaVietnamWest IndiesWestern AfricaWestern AsiaWestern EuropeYemenZaireZimbabweAzores
Householder Income Over 65 years
Income
Poverty
Unemployment
Labor Participation
Family Structure
Vehicle Availability
Education Level
Disability

Householder Income Over 65 years Comparison

Immigrants from Eastern Africa

Danes

Average
Exceptional
$61,157
HOUSEHOLDER INCOME OVER 65 YEARS
55.0/ 100
METRIC RATING
166th/ 347
METRIC RANK
$63,117
HOUSEHOLDER INCOME OVER 65 YEARS
90.5/ 100
METRIC RATING
118th/ 347
METRIC RANK

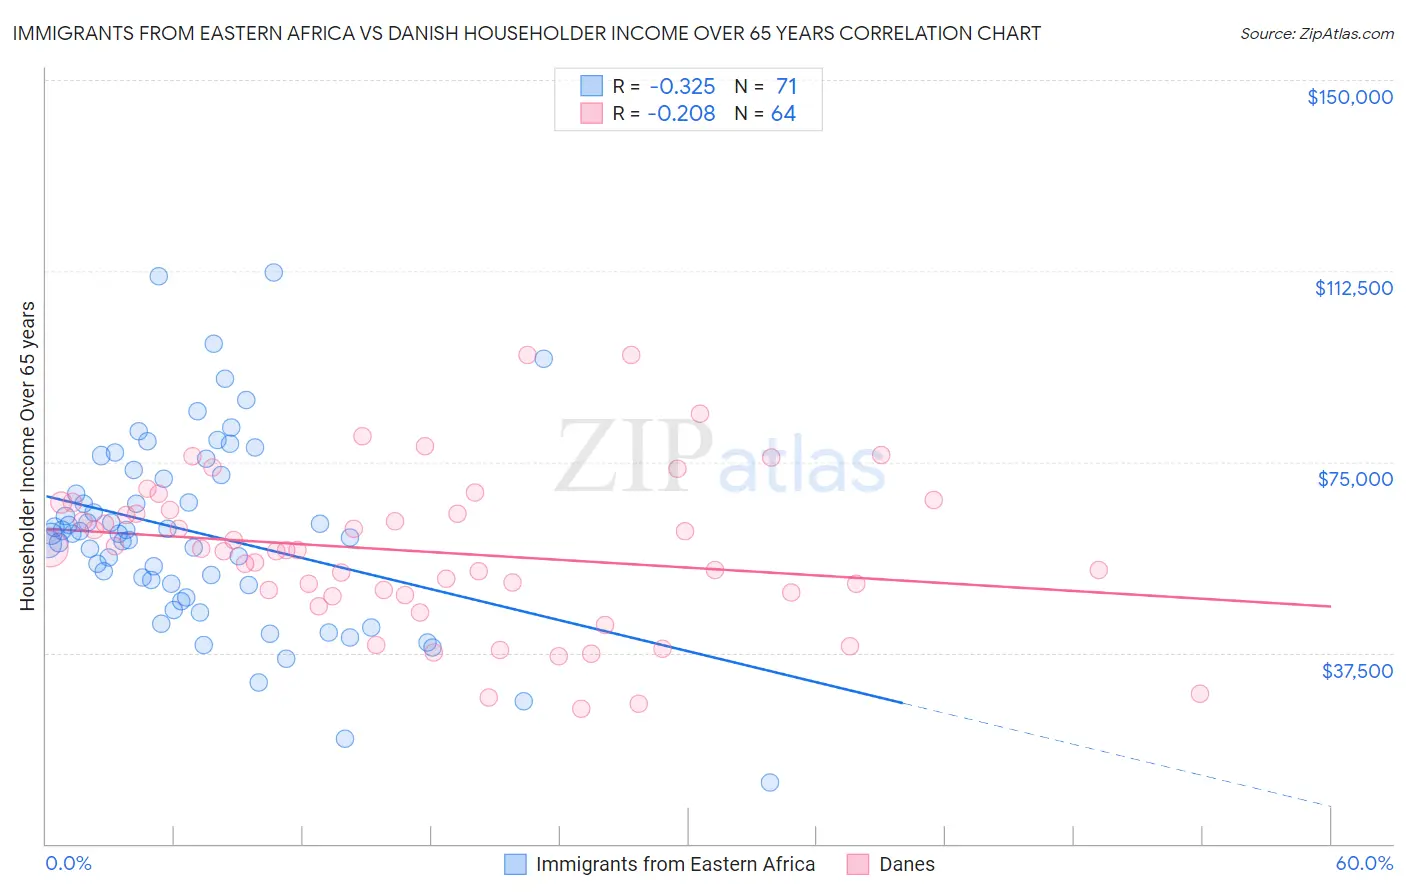
Immigrants from Eastern Africa vs Danish Householder Income Over 65 years Correlation Chart

The statistical analysis conducted on geographies consisting of 354,024,909 people shows a mild negative correlation between the proportion of Immigrants from Eastern Africa and household income with householder over the age of 65 in the United States with a correlation coefficient (R) of -0.325 and weighted average of $61,157. Similarly, the statistical analysis conducted on geographies consisting of 471,993,582 people shows a weak negative correlation between the proportion of Danes and household income with householder over the age of 65 in the United States with a correlation coefficient (R) of -0.208 and weighted average of $63,117, a difference of 3.2%.
Immigrants from Eastern Africa vs Danish Householder Income Over 65 years

Householder Income Over 65 years Correlation Summary

MeasurementImmigrants from Eastern AfricaDanish
Minimum$12,049$26,500
Maximum$112,225$95,917
Range$100,176$69,417
Mean$61,052$57,329
Median$60,948$57,701
Interquartile 25% (IQ1)$50,731$49,152
Interquartile 75% (IQ3)$72,534$66,265
Interquartile Range (IQR)$21,803$17,112
Standard Deviation (Sample)$18,747$15,144
Standard Deviation (Population)$18,615$15,025

Similar Demographics by Householder Income Over 65 years

Demographics Similar to Immigrants from Eastern Africa by Householder Income Over 65 years

In terms of householder income over 65 years, the demographic groups most similar to Immigrants from Eastern Africa are Immigrants from Ukraine ($61,163, a difference of 0.010%), Ugandan ($61,177, a difference of 0.030%), Immigrants from North Macedonia ($61,175, a difference of 0.030%), Norwegian ($61,104, a difference of 0.090%), and Irish ($61,097, a difference of 0.10%).
DemographicsRating | RankHouseholder Income Over 65 years
Brazilians
62.7
/100
|
#159
Good
$61,465
Portuguese
62.1
/100
|
#160
Good
$61,440
Icelanders
57.9
/100
|
#161
Average
$61,270
Czechs
57.2
/100
|
#162
Average
$61,244
Ugandans
55.5
/100
|
#163
Average
$61,177
Immigrants | North Macedonia
55.4
/100
|
#164
Average
$61,175
Immigrants | Ukraine
55.1
/100
|
#165
Average
$61,163
Immigrants | Eastern Africa
55.0
/100
|
#166
Average
$61,157
Norwegians
53.6
/100
|
#167
Average
$61,104
Irish
53.4
/100
|
#168
Average
$61,097
Carpatho Rusyns
53.3
/100
|
#169
Average
$61,093
Serbians
53.1
/100
|
#170
Average
$61,087
Inupiat
52.4
/100
|
#171
Average
$61,061
Immigrants | Poland
51.9
/100
|
#172
Average
$61,041
Immigrants | Micronesia
50.8
/100
|
#173
Average
$61,000

Demographics Similar to Danes by Householder Income Over 65 years

In terms of householder income over 65 years, the demographic groups most similar to Danes are Immigrants from Croatia ($63,168, a difference of 0.080%), Guamanian/Chamorro ($63,187, a difference of 0.11%), Immigrants from Jordan ($63,041, a difference of 0.12%), Ukrainian ($63,032, a difference of 0.13%), and Immigrants from Vietnam ($63,014, a difference of 0.16%).
DemographicsRating | RankHouseholder Income Over 65 years
Immigrants | Spain
93.7
/100
|
#111
Exceptional
$63,540
Syrians
93.4
/100
|
#112
Exceptional
$63,494
Immigrants | Serbia
92.7
/100
|
#113
Exceptional
$63,387
Immigrants | Saudi Arabia
92.4
/100
|
#114
Exceptional
$63,355
Croatians
91.4
/100
|
#115
Exceptional
$63,225
Guamanians/Chamorros
91.1
/100
|
#116
Exceptional
$63,187
Immigrants | Croatia
90.9
/100
|
#117
Exceptional
$63,168
Danes
90.5
/100
|
#118
Exceptional
$63,117
Immigrants | Jordan
89.8
/100
|
#119
Excellent
$63,041
Ukrainians
89.7
/100
|
#120
Excellent
$63,032
Immigrants | Vietnam
89.5
/100
|
#121
Excellent
$63,014
Immigrants | Moldova
88.7
/100
|
#122
Excellent
$62,939
Tlingit-Haida
88.6
/100
|
#123
Excellent
$62,922
Taiwanese
88.3
/100
|
#124
Excellent
$62,894
Soviet Union
87.8
/100
|
#125
Excellent
$62,848