Comanche vs Danish Householder Income Over 65 years
COMPARE
Comanche
Danish
Householder Income Over 65 years
Householder Income Over 65 years Comparison
Comanche
Danes
$54,922
HOUSEHOLDER INCOME OVER 65 YEARS
0.2/ 100
METRIC RATING
261st/ 347
METRIC RANK
$63,117
HOUSEHOLDER INCOME OVER 65 YEARS
90.5/ 100
METRIC RATING
118th/ 347
METRIC RANK
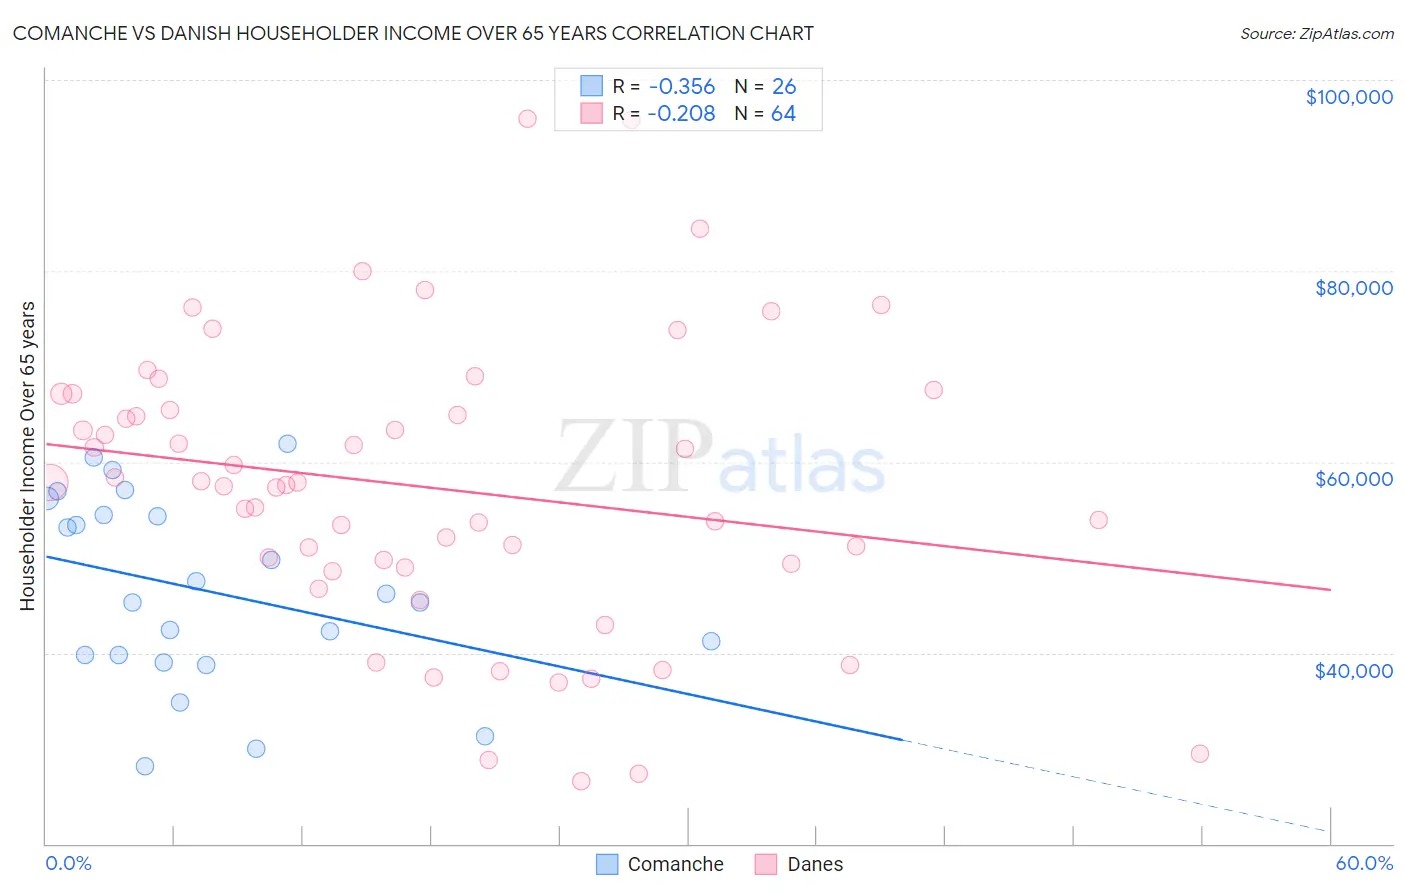
Comanche vs Danish Householder Income Over 65 years Correlation Chart
The statistical analysis conducted on geographies consisting of 109,617,596 people shows a mild negative correlation between the proportion of Comanche and household income with householder over the age of 65 in the United States with a correlation coefficient (R) of -0.356 and weighted average of $54,922. Similarly, the statistical analysis conducted on geographies consisting of 471,993,582 people shows a weak negative correlation between the proportion of Danes and household income with householder over the age of 65 in the United States with a correlation coefficient (R) of -0.208 and weighted average of $63,117, a difference of 14.9%.
Householder Income Over 65 years Correlation Summary
| Measurement | Comanche | Danish |
| Minimum | $28,127 | $26,500 |
| Maximum | $61,875 | $95,917 |
| Range | $33,748 | $69,417 |
| Mean | $46,472 | $57,329 |
| Median | $45,782 | $57,701 |
| Interquartile 25% (IQ1) | $39,810 | $49,152 |
| Interquartile 75% (IQ3) | $54,432 | $66,265 |
| Interquartile Range (IQR) | $14,621 | $17,112 |
| Standard Deviation (Sample) | $9,777 | $15,144 |
| Standard Deviation (Population) | $9,587 | $15,025 |
Similar Demographics by Householder Income Over 65 years
Demographics Similar to Comanche by Householder Income Over 65 years
In terms of householder income over 65 years, the demographic groups most similar to Comanche are Immigrants from West Indies ($54,927, a difference of 0.010%), West Indian ($54,936, a difference of 0.030%), Ecuadorian ($54,958, a difference of 0.070%), Bangladeshi ($54,719, a difference of 0.37%), and French American Indian ($54,699, a difference of 0.41%).
| Demographics | Rating | Rank | Householder Income Over 65 years |
| Americans | 0.3 /100 | #254 | Tragic $55,527 |
| Immigrants | Bangladesh | 0.3 /100 | #255 | Tragic $55,394 |
| German Russians | 0.3 /100 | #256 | Tragic $55,356 |
| Trinidadians and Tobagonians | 0.3 /100 | #257 | Tragic $55,327 |
| Ecuadorians | 0.2 /100 | #258 | Tragic $54,958 |
| West Indians | 0.2 /100 | #259 | Tragic $54,936 |
| Immigrants | West Indies | 0.2 /100 | #260 | Tragic $54,927 |
| Comanche | 0.2 /100 | #261 | Tragic $54,922 |
| Bangladeshis | 0.1 /100 | #262 | Tragic $54,719 |
| French American Indians | 0.1 /100 | #263 | Tragic $54,699 |
| Apache | 0.1 /100 | #264 | Tragic $54,668 |
| Belizeans | 0.1 /100 | #265 | Tragic $54,580 |
| Jamaicans | 0.1 /100 | #266 | Tragic $54,560 |
| Guatemalans | 0.1 /100 | #267 | Tragic $54,526 |
| Immigrants | Zaire | 0.1 /100 | #268 | Tragic $54,512 |
Demographics Similar to Danes by Householder Income Over 65 years
In terms of householder income over 65 years, the demographic groups most similar to Danes are Immigrants from Croatia ($63,168, a difference of 0.080%), Guamanian/Chamorro ($63,187, a difference of 0.11%), Immigrants from Jordan ($63,041, a difference of 0.12%), Ukrainian ($63,032, a difference of 0.13%), and Immigrants from Vietnam ($63,014, a difference of 0.16%).
| Demographics | Rating | Rank | Householder Income Over 65 years |
| Immigrants | Spain | 93.7 /100 | #111 | Exceptional $63,540 |
| Syrians | 93.4 /100 | #112 | Exceptional $63,494 |
| Immigrants | Serbia | 92.7 /100 | #113 | Exceptional $63,387 |
| Immigrants | Saudi Arabia | 92.4 /100 | #114 | Exceptional $63,355 |
| Croatians | 91.4 /100 | #115 | Exceptional $63,225 |
| Guamanians/Chamorros | 91.1 /100 | #116 | Exceptional $63,187 |
| Immigrants | Croatia | 90.9 /100 | #117 | Exceptional $63,168 |
| Danes | 90.5 /100 | #118 | Exceptional $63,117 |
| Immigrants | Jordan | 89.8 /100 | #119 | Excellent $63,041 |
| Ukrainians | 89.7 /100 | #120 | Excellent $63,032 |
| Immigrants | Vietnam | 89.5 /100 | #121 | Excellent $63,014 |
| Immigrants | Moldova | 88.7 /100 | #122 | Excellent $62,939 |
| Tlingit-Haida | 88.6 /100 | #123 | Excellent $62,922 |
| Taiwanese | 88.3 /100 | #124 | Excellent $62,894 |
| Soviet Union | 87.8 /100 | #125 | Excellent $62,848 |