Black/African American vs Danish Householder Income Under 25 years
COMPARE
Black/African American
Danish
Householder Income Under 25 years
Householder Income Under 25 years Comparison
Blacks/African Americans
Danes
$44,381
HOUSEHOLDER INCOME UNDER 25 YEARS
0.0/ 100
METRIC RATING
340th/ 347
METRIC RANK
$53,041
HOUSEHOLDER INCOME UNDER 25 YEARS
88.9/ 100
METRIC RATING
141st/ 347
METRIC RANK
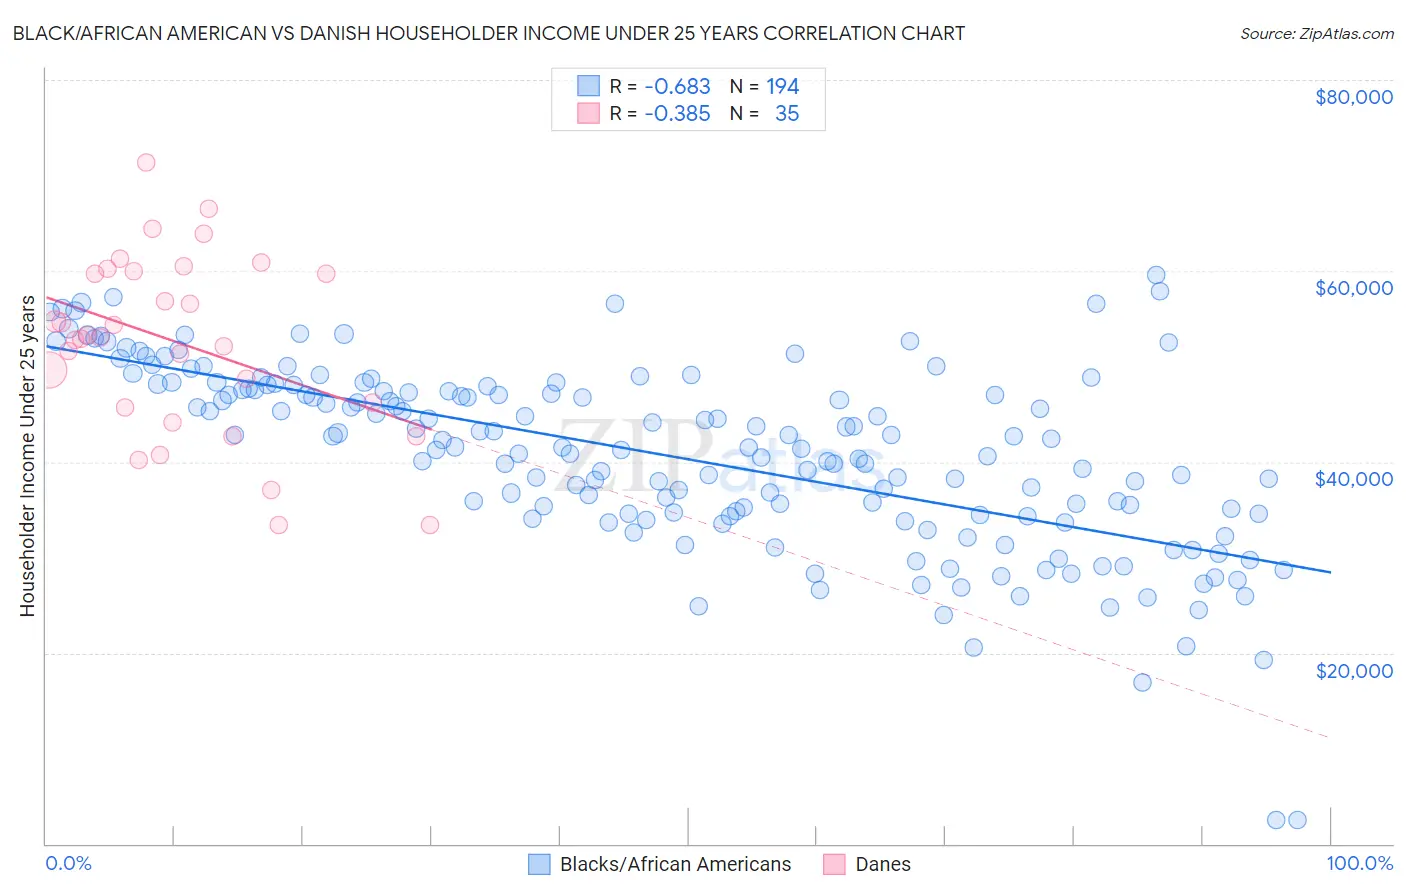
Black/African American vs Danish Householder Income Under 25 years Correlation Chart
The statistical analysis conducted on geographies consisting of 438,583,318 people shows a significant negative correlation between the proportion of Blacks/African Americans and household income with householder under the age of 25 in the United States with a correlation coefficient (R) of -0.683 and weighted average of $44,381. Similarly, the statistical analysis conducted on geographies consisting of 385,598,652 people shows a mild negative correlation between the proportion of Danes and household income with householder under the age of 25 in the United States with a correlation coefficient (R) of -0.385 and weighted average of $53,041, a difference of 19.5%.
Householder Income Under 25 years Correlation Summary
| Measurement | Black/African American | Danish |
| Minimum | $2,499 | $33,393 |
| Maximum | $59,638 | $71,390 |
| Range | $57,139 | $37,997 |
| Mean | $40,625 | $52,501 |
| Median | $41,554 | $53,052 |
| Interquartile 25% (IQ1) | $34,429 | $45,744 |
| Interquartile 75% (IQ3) | $47,684 | $59,942 |
| Interquartile Range (IQR) | $13,255 | $14,198 |
| Standard Deviation (Sample) | $9,747 | $9,291 |
| Standard Deviation (Population) | $9,722 | $9,158 |
Similar Demographics by Householder Income Under 25 years
Demographics Similar to Blacks/African Americans by Householder Income Under 25 years
In terms of householder income under 25 years, the demographic groups most similar to Blacks/African Americans are Houma ($44,356, a difference of 0.060%), Kiowa ($44,733, a difference of 0.79%), Chickasaw ($44,763, a difference of 0.86%), Arapaho ($44,003, a difference of 0.86%), and Pueblo ($45,018, a difference of 1.4%).
| Demographics | Rating | Rank | Householder Income Under 25 years |
| Creek | 0.0 /100 | #333 | Tragic $45,371 |
| Cajuns | 0.0 /100 | #334 | Tragic $45,338 |
| Cheyenne | 0.0 /100 | #335 | Tragic $45,275 |
| Tohono O'odham | 0.0 /100 | #336 | Tragic $45,248 |
| Pueblo | 0.0 /100 | #337 | Tragic $45,018 |
| Chickasaw | 0.0 /100 | #338 | Tragic $44,763 |
| Kiowa | 0.0 /100 | #339 | Tragic $44,733 |
| Blacks/African Americans | 0.0 /100 | #340 | Tragic $44,381 |
| Houma | 0.0 /100 | #341 | Tragic $44,356 |
| Arapaho | 0.0 /100 | #342 | Tragic $44,003 |
| Immigrants | Yemen | 0.0 /100 | #343 | Tragic $43,591 |
| Immigrants | Congo | 0.0 /100 | #344 | Tragic $43,266 |
| Navajo | 0.0 /100 | #345 | Tragic $42,380 |
| Puerto Ricans | 0.0 /100 | #346 | Tragic $39,726 |
| Lumbee | 0.0 /100 | #347 | Tragic $34,584 |
Demographics Similar to Danes by Householder Income Under 25 years
In terms of householder income under 25 years, the demographic groups most similar to Danes are Hawaiian ($53,078, a difference of 0.070%), Immigrants from Armenia ($52,986, a difference of 0.10%), Swedish ($52,986, a difference of 0.10%), Costa Rican ($53,106, a difference of 0.12%), and South American Indian ($52,979, a difference of 0.12%).
| Demographics | Rating | Rank | Householder Income Under 25 years |
| Immigrants | Northern Africa | 91.9 /100 | #134 | Exceptional $53,185 |
| Chileans | 91.9 /100 | #135 | Exceptional $53,185 |
| Armenians | 91.8 /100 | #136 | Exceptional $53,179 |
| Immigrants | Barbados | 91.5 /100 | #137 | Exceptional $53,163 |
| Norwegians | 90.8 /100 | #138 | Exceptional $53,127 |
| Costa Ricans | 90.4 /100 | #139 | Exceptional $53,106 |
| Hawaiians | 89.8 /100 | #140 | Excellent $53,078 |
| Danes | 88.9 /100 | #141 | Excellent $53,041 |
| Immigrants | Armenia | 87.5 /100 | #142 | Excellent $52,986 |
| Swedes | 87.5 /100 | #143 | Excellent $52,986 |
| South American Indians | 87.3 /100 | #144 | Excellent $52,979 |
| Immigrants | Western Europe | 86.7 /100 | #145 | Excellent $52,957 |
| Immigrants | Hungary | 81.6 /100 | #146 | Excellent $52,798 |
| Latvians | 81.0 /100 | #147 | Excellent $52,783 |
| French Canadians | 76.5 /100 | #148 | Good $52,672 |