Black/African American vs Belgian Disability Age Over 75
COMPARE
Black/African American
Belgian
Disability Age Over 75
Disability Age Over 75 Comparison
Blacks/African Americans
Belgians
49.5%
DISABILITY AGE OVER 75
0.0/ 100
METRIC RATING
282nd/ 347
METRIC RANK
45.8%
DISABILITY AGE OVER 75
99.7/ 100
METRIC RATING
50th/ 347
METRIC RANK
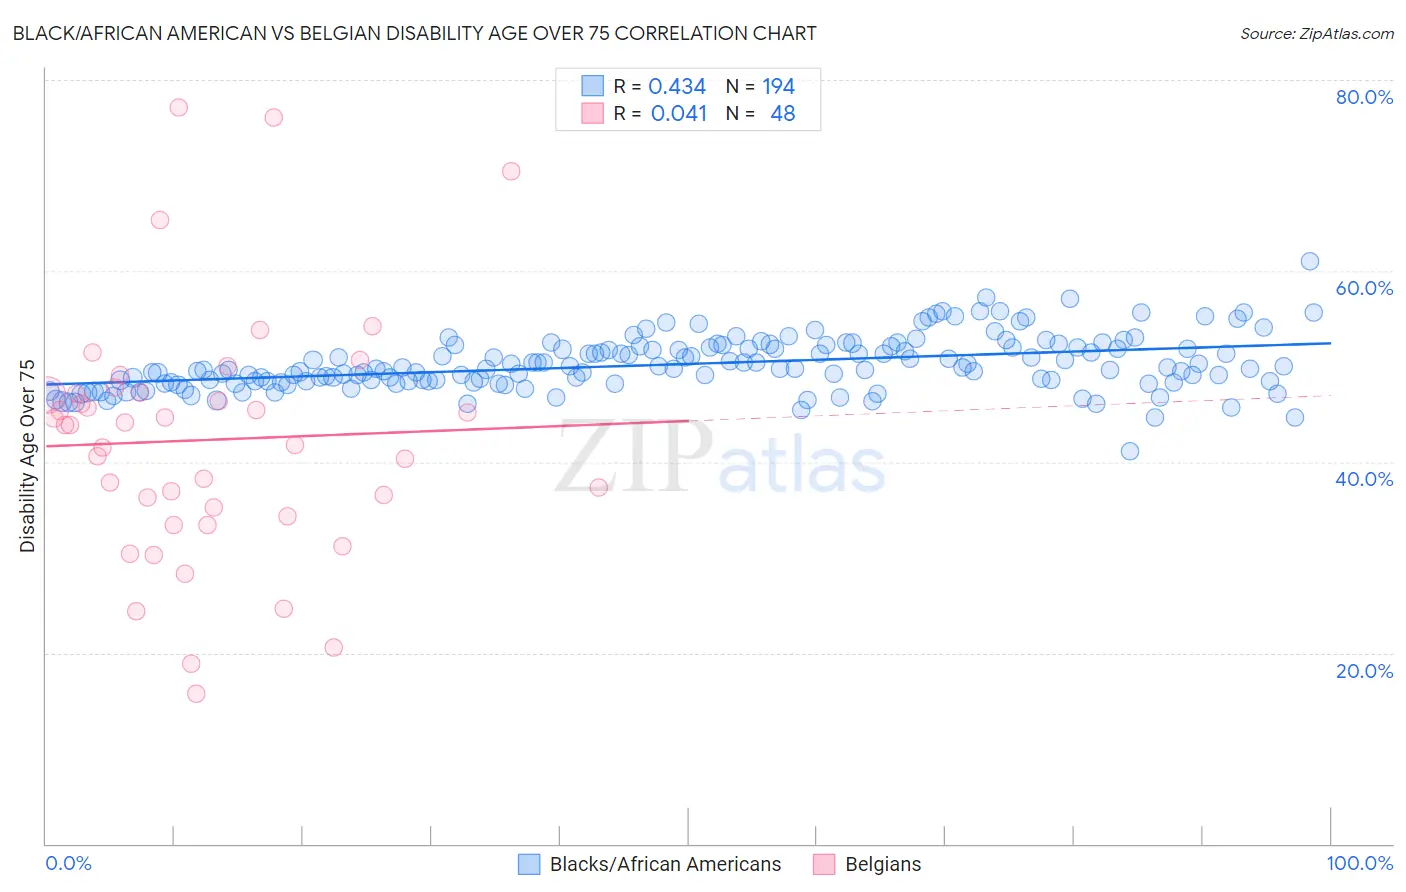
Black/African American vs Belgian Disability Age Over 75 Correlation Chart
The statistical analysis conducted on geographies consisting of 563,629,175 people shows a moderate positive correlation between the proportion of Blacks/African Americans and percentage of population with a disability over the age of 75 in the United States with a correlation coefficient (R) of 0.434 and weighted average of 49.5%. Similarly, the statistical analysis conducted on geographies consisting of 355,558,125 people shows no correlation between the proportion of Belgians and percentage of population with a disability over the age of 75 in the United States with a correlation coefficient (R) of 0.041 and weighted average of 45.8%, a difference of 8.1%.
Disability Age Over 75 Correlation Summary
| Measurement | Black/African American | Belgian |
| Minimum | 41.1% | 15.7% |
| Maximum | 61.0% | 77.1% |
| Range | 19.9% | 61.4% |
| Mean | 50.2% | 42.3% |
| Median | 49.8% | 43.8% |
| Interquartile 25% (IQ1) | 48.4% | 34.8% |
| Interquartile 75% (IQ3) | 52.0% | 47.2% |
| Interquartile Range (IQR) | 3.6% | 12.4% |
| Standard Deviation (Sample) | 2.8% | 12.9% |
| Standard Deviation (Population) | 2.8% | 12.8% |
Similar Demographics by Disability Age Over 75
Demographics Similar to Blacks/African Americans by Disability Age Over 75
In terms of disability age over 75, the demographic groups most similar to Blacks/African Americans are Samoan (49.5%, a difference of 0.030%), Immigrants from Latin America (49.5%, a difference of 0.080%), Belizean (49.4%, a difference of 0.14%), Bangladeshi (49.4%, a difference of 0.15%), and Guamanian/Chamorro (49.4%, a difference of 0.21%).
| Demographics | Rating | Rank | Disability Age Over 75 |
| Immigrants | Dominica | 0.1 /100 | #275 | Tragic 49.1% |
| Immigrants | Uzbekistan | 0.1 /100 | #276 | Tragic 49.2% |
| Hawaiians | 0.1 /100 | #277 | Tragic 49.2% |
| Immigrants | Laos | 0.1 /100 | #278 | Tragic 49.2% |
| Guamanians/Chamorros | 0.0 /100 | #279 | Tragic 49.4% |
| Bangladeshis | 0.0 /100 | #280 | Tragic 49.4% |
| Belizeans | 0.0 /100 | #281 | Tragic 49.4% |
| Blacks/African Americans | 0.0 /100 | #282 | Tragic 49.5% |
| Samoans | 0.0 /100 | #283 | Tragic 49.5% |
| Immigrants | Latin America | 0.0 /100 | #284 | Tragic 49.5% |
| Crow | 0.0 /100 | #285 | Tragic 49.6% |
| Immigrants | Belize | 0.0 /100 | #286 | Tragic 49.6% |
| Sioux | 0.0 /100 | #287 | Tragic 49.7% |
| Yaqui | 0.0 /100 | #288 | Tragic 49.8% |
| Osage | 0.0 /100 | #289 | Tragic 49.8% |
Demographics Similar to Belgians by Disability Age Over 75
In terms of disability age over 75, the demographic groups most similar to Belgians are Immigrants from Korea (45.8%, a difference of 0.0%), Immigrants from France (45.8%, a difference of 0.050%), Immigrants from Italy (45.8%, a difference of 0.070%), Immigrants from North America (45.7%, a difference of 0.13%), and Slovak (45.8%, a difference of 0.14%).
| Demographics | Rating | Rank | Disability Age Over 75 |
| Czechs | 99.8 /100 | #43 | Exceptional 45.7% |
| Australians | 99.8 /100 | #44 | Exceptional 45.7% |
| Turks | 99.8 /100 | #45 | Exceptional 45.7% |
| Swedes | 99.8 /100 | #46 | Exceptional 45.7% |
| Immigrants | Canada | 99.8 /100 | #47 | Exceptional 45.7% |
| Croatians | 99.8 /100 | #48 | Exceptional 45.7% |
| Immigrants | North America | 99.8 /100 | #49 | Exceptional 45.7% |
| Belgians | 99.7 /100 | #50 | Exceptional 45.8% |
| Immigrants | Korea | 99.7 /100 | #51 | Exceptional 45.8% |
| Immigrants | France | 99.7 /100 | #52 | Exceptional 45.8% |
| Immigrants | Italy | 99.7 /100 | #53 | Exceptional 45.8% |
| Slovaks | 99.6 /100 | #54 | Exceptional 45.8% |
| Maltese | 99.6 /100 | #55 | Exceptional 45.8% |
| Immigrants | Netherlands | 99.6 /100 | #56 | Exceptional 45.9% |
| Immigrants | Turkey | 99.6 /100 | #57 | Exceptional 45.9% |