Subsaharan African vs Belgian Householder Income Over 65 years
COMPARE
Subsaharan African
Belgian
Householder Income Over 65 years
Householder Income Over 65 years Comparison
Sub-Saharan Africans
Belgians
$56,615
HOUSEHOLDER INCOME OVER 65 YEARS
1.0/ 100
METRIC RATING
240th/ 347
METRIC RANK
$59,915
HOUSEHOLDER INCOME OVER 65 YEARS
24.9/ 100
METRIC RATING
191st/ 347
METRIC RANK
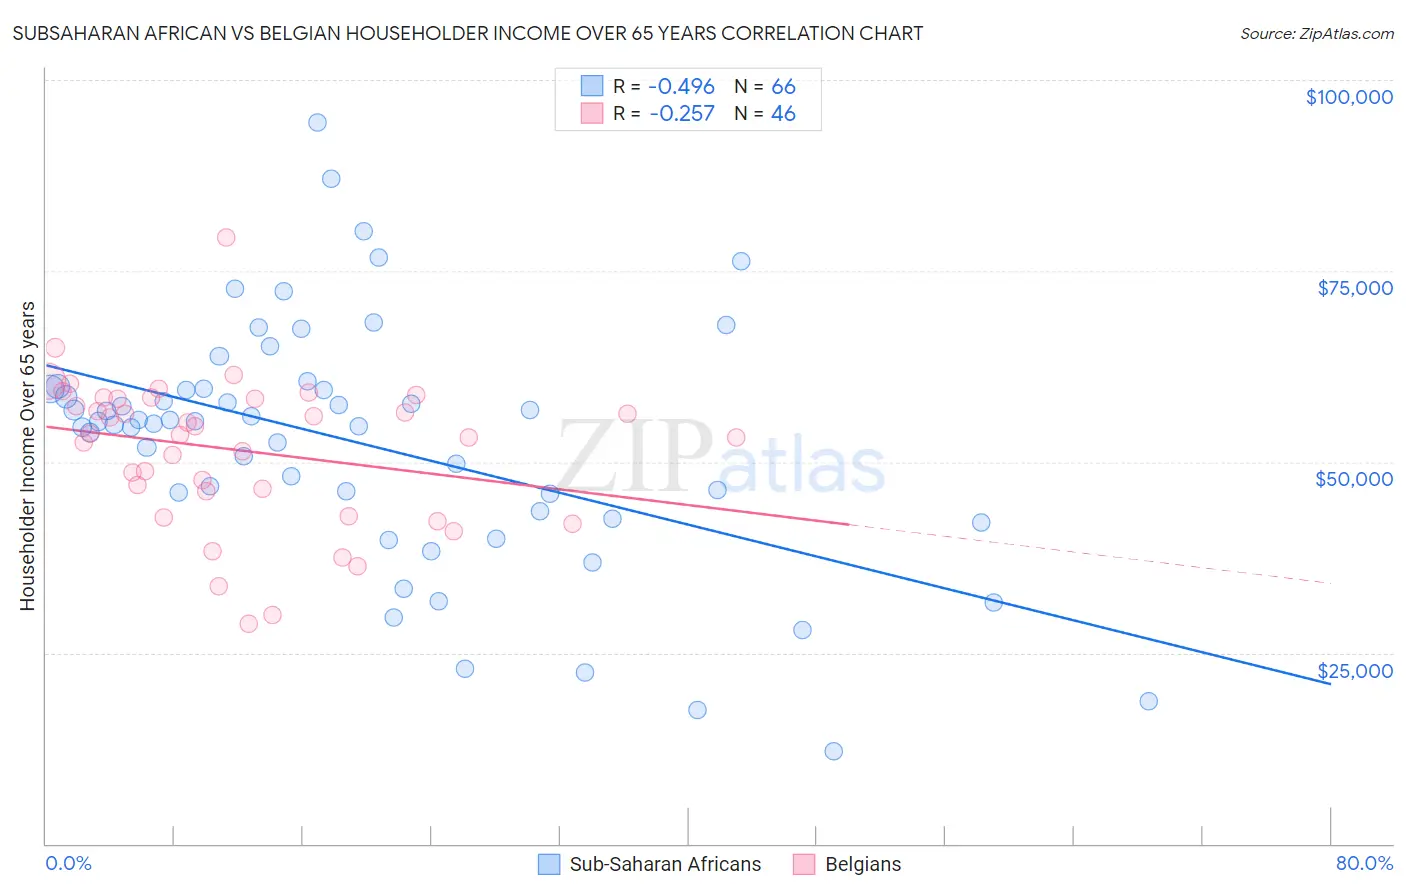
Subsaharan African vs Belgian Householder Income Over 65 years Correlation Chart
The statistical analysis conducted on geographies consisting of 505,008,485 people shows a moderate negative correlation between the proportion of Sub-Saharan Africans and household income with householder over the age of 65 in the United States with a correlation coefficient (R) of -0.496 and weighted average of $56,615. Similarly, the statistical analysis conducted on geographies consisting of 355,085,378 people shows a weak negative correlation between the proportion of Belgians and household income with householder over the age of 65 in the United States with a correlation coefficient (R) of -0.257 and weighted average of $59,915, a difference of 5.8%.
Householder Income Over 65 years Correlation Summary
| Measurement | Subsaharan African | Belgian |
| Minimum | $12,049 | $28,750 |
| Maximum | $94,427 | $79,412 |
| Range | $82,378 | $50,662 |
| Mean | $52,341 | $51,516 |
| Median | $55,146 | $53,553 |
| Interquartile 25% (IQ1) | $43,507 | $46,134 |
| Interquartile 75% (IQ3) | $59,521 | $58,281 |
| Interquartile Range (IQR) | $16,014 | $12,147 |
| Standard Deviation (Sample) | $16,149 | $9,760 |
| Standard Deviation (Population) | $16,026 | $9,654 |
Similar Demographics by Householder Income Over 65 years
Demographics Similar to Sub-Saharan Africans by Householder Income Over 65 years
In terms of householder income over 65 years, the demographic groups most similar to Sub-Saharan Africans are Immigrants from Laos ($56,722, a difference of 0.19%), Immigrants from Guyana ($56,495, a difference of 0.21%), Fijian ($56,768, a difference of 0.27%), Yaqui ($56,417, a difference of 0.35%), and Guyanese ($56,351, a difference of 0.47%).
| Demographics | Rating | Rank | Householder Income Over 65 years |
| Immigrants | Western Africa | 1.7 /100 | #233 | Tragic $57,119 |
| Immigrants | Burma/Myanmar | 1.7 /100 | #234 | Tragic $57,114 |
| Spanish Americans | 1.6 /100 | #235 | Tragic $57,021 |
| Immigrants | Uruguay | 1.5 /100 | #236 | Tragic $56,975 |
| Immigrants | Panama | 1.5 /100 | #237 | Tragic $56,944 |
| Fijians | 1.2 /100 | #238 | Tragic $56,768 |
| Immigrants | Laos | 1.2 /100 | #239 | Tragic $56,722 |
| Sub-Saharan Africans | 1.0 /100 | #240 | Tragic $56,615 |
| Immigrants | Guyana | 0.9 /100 | #241 | Tragic $56,495 |
| Yaqui | 0.8 /100 | #242 | Tragic $56,417 |
| Guyanese | 0.8 /100 | #243 | Tragic $56,351 |
| Hmong | 0.8 /100 | #244 | Tragic $56,339 |
| Immigrants | Uzbekistan | 0.8 /100 | #245 | Tragic $56,331 |
| Central Americans | 0.8 /100 | #246 | Tragic $56,321 |
| Yakama | 0.7 /100 | #247 | Tragic $56,234 |
Demographics Similar to Belgians by Householder Income Over 65 years
In terms of householder income over 65 years, the demographic groups most similar to Belgians are Puget Sound Salish ($59,934, a difference of 0.030%), South American ($59,854, a difference of 0.10%), Immigrants from Costa Rica ($59,848, a difference of 0.11%), Immigrants from Africa ($59,837, a difference of 0.13%), and Immigrants from Iraq ($59,824, a difference of 0.15%).
| Demographics | Rating | Rank | Householder Income Over 65 years |
| Iraqis | 37.2 /100 | #184 | Fair $60,466 |
| Albanians | 32.0 /100 | #185 | Fair $60,249 |
| Slovenes | 31.8 /100 | #186 | Fair $60,241 |
| Immigrants | Thailand | 31.3 /100 | #187 | Fair $60,217 |
| Immigrants | Eritrea | 28.6 /100 | #188 | Fair $60,096 |
| Ghanaians | 27.5 /100 | #189 | Fair $60,043 |
| Puget Sound Salish | 25.3 /100 | #190 | Fair $59,934 |
| Belgians | 24.9 /100 | #191 | Fair $59,915 |
| South Americans | 23.8 /100 | #192 | Fair $59,854 |
| Immigrants | Costa Rica | 23.6 /100 | #193 | Fair $59,848 |
| Immigrants | Africa | 23.4 /100 | #194 | Fair $59,837 |
| Immigrants | Iraq | 23.2 /100 | #195 | Fair $59,824 |
| Germans | 21.5 /100 | #196 | Fair $59,730 |
| Immigrants | Kenya | 21.1 /100 | #197 | Fair $59,710 |
| Moroccans | 20.7 /100 | #198 | Fair $59,683 |