Arapaho vs Belgian Householder Income Over 65 years
COMPARE
Arapaho
Belgian
Householder Income Over 65 years
Householder Income Over 65 years Comparison
Arapaho
Belgians
$59,383
HOUSEHOLDER INCOME OVER 65 YEARS
16.0/ 100
METRIC RATING
204th/ 347
METRIC RANK
$59,915
HOUSEHOLDER INCOME OVER 65 YEARS
24.9/ 100
METRIC RATING
191st/ 347
METRIC RANK
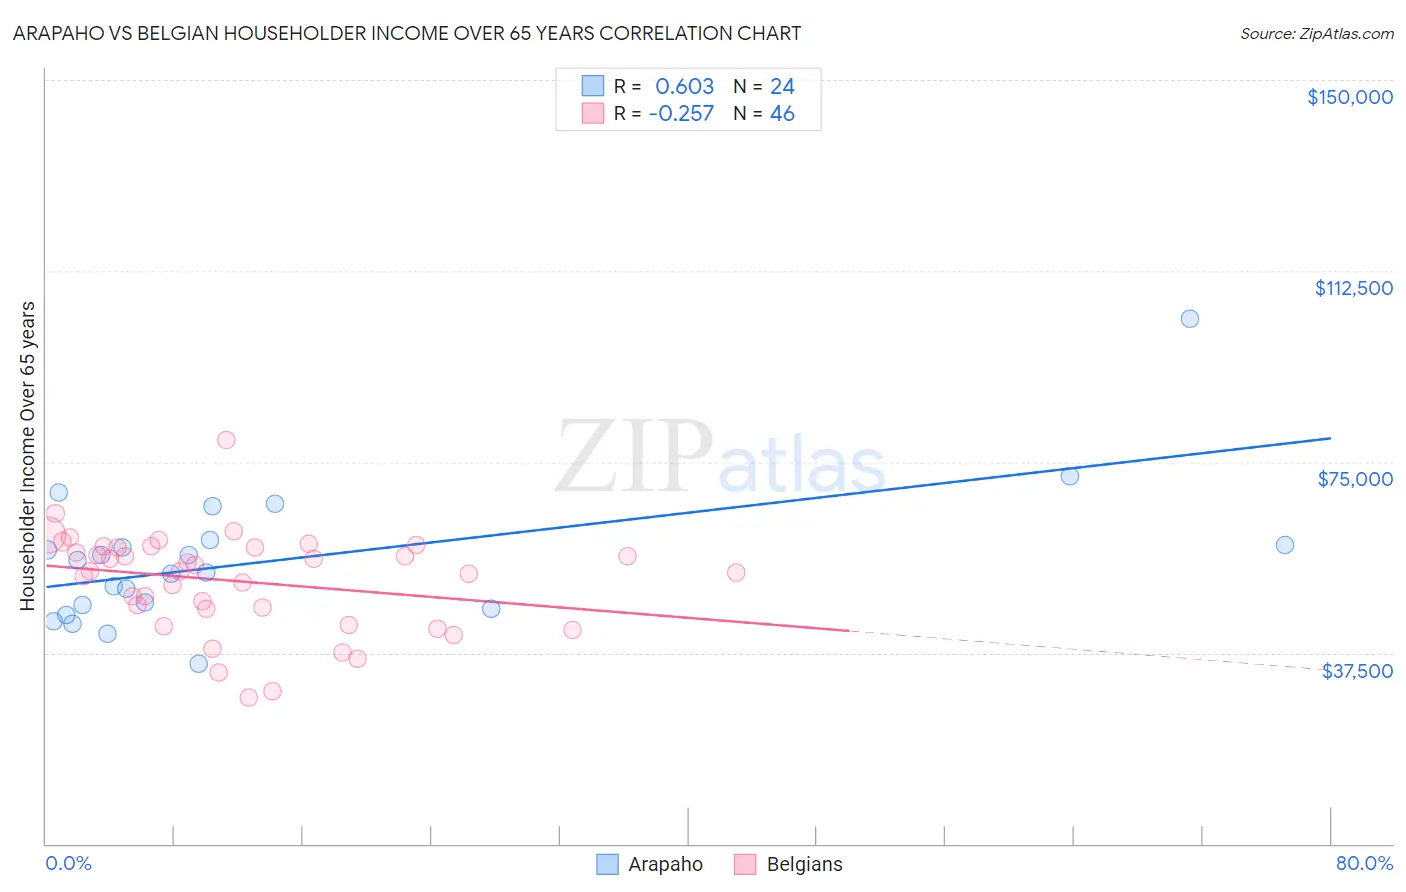
Arapaho vs Belgian Householder Income Over 65 years Correlation Chart
The statistical analysis conducted on geographies consisting of 29,739,180 people shows a significant positive correlation between the proportion of Arapaho and household income with householder over the age of 65 in the United States with a correlation coefficient (R) of 0.603 and weighted average of $59,383. Similarly, the statistical analysis conducted on geographies consisting of 355,085,378 people shows a weak negative correlation between the proportion of Belgians and household income with householder over the age of 65 in the United States with a correlation coefficient (R) of -0.257 and weighted average of $59,915, a difference of 0.90%.
Householder Income Over 65 years Correlation Summary
| Measurement | Arapaho | Belgian |
| Minimum | $35,366 | $28,750 |
| Maximum | $103,036 | $79,412 |
| Range | $67,670 | $50,662 |
| Mean | $55,690 | $51,516 |
| Median | $54,436 | $53,553 |
| Interquartile 25% (IQ1) | $46,442 | $46,134 |
| Interquartile 75% (IQ3) | $59,194 | $58,281 |
| Interquartile Range (IQR) | $12,751 | $12,147 |
| Standard Deviation (Sample) | $13,684 | $9,760 |
| Standard Deviation (Population) | $13,396 | $9,654 |
Demographics Similar to Arapaho and Belgians by Householder Income Over 65 years
In terms of householder income over 65 years, the demographic groups most similar to Arapaho are Scotch-Irish ($59,447, a difference of 0.11%), Immigrants from Sudan ($59,248, a difference of 0.23%), Finnish ($59,535, a difference of 0.25%), Dutch ($59,539, a difference of 0.26%), and Immigrants from South America ($59,151, a difference of 0.39%). Similarly, the demographic groups most similar to Belgians are Puget Sound Salish ($59,934, a difference of 0.030%), South American ($59,854, a difference of 0.10%), Immigrants from Costa Rica ($59,848, a difference of 0.11%), Immigrants from Africa ($59,837, a difference of 0.13%), and Immigrants from Iraq ($59,824, a difference of 0.15%).
| Demographics | Rating | Rank | Householder Income Over 65 years |
| Immigrants | Thailand | 31.3 /100 | #187 | Fair $60,217 |
| Immigrants | Eritrea | 28.6 /100 | #188 | Fair $60,096 |
| Ghanaians | 27.5 /100 | #189 | Fair $60,043 |
| Puget Sound Salish | 25.3 /100 | #190 | Fair $59,934 |
| Belgians | 24.9 /100 | #191 | Fair $59,915 |
| South Americans | 23.8 /100 | #192 | Fair $59,854 |
| Immigrants | Costa Rica | 23.6 /100 | #193 | Fair $59,848 |
| Immigrants | Africa | 23.4 /100 | #194 | Fair $59,837 |
| Immigrants | Iraq | 23.2 /100 | #195 | Fair $59,824 |
| Germans | 21.5 /100 | #196 | Fair $59,730 |
| Immigrants | Kenya | 21.1 /100 | #197 | Fair $59,710 |
| Moroccans | 20.7 /100 | #198 | Fair $59,683 |
| Immigrants | Immigrants | 20.2 /100 | #199 | Fair $59,656 |
| French | 20.2 /100 | #200 | Fair $59,656 |
| Dutch | 18.3 /100 | #201 | Poor $59,539 |
| Finns | 18.2 /100 | #202 | Poor $59,535 |
| Scotch-Irish | 16.9 /100 | #203 | Poor $59,447 |
| Arapaho | 16.0 /100 | #204 | Poor $59,383 |
| Immigrants | Sudan | 14.2 /100 | #205 | Poor $59,248 |
| Immigrants | South America | 13.0 /100 | #206 | Poor $59,151 |
| Salvadorans | 12.9 /100 | #207 | Poor $59,141 |