Zip Codes with the Highest Percentage of Population Employed in Legal Services & Support in Elgin, IL
RELATED REPORTS & OPTIONS
Legal Services & Support
Elgin
Compare Zip Codes
Map of Zip Codes with the Highest Percentage of Population Employed in Legal Services & Support in Elgin
0.30%
1.8%
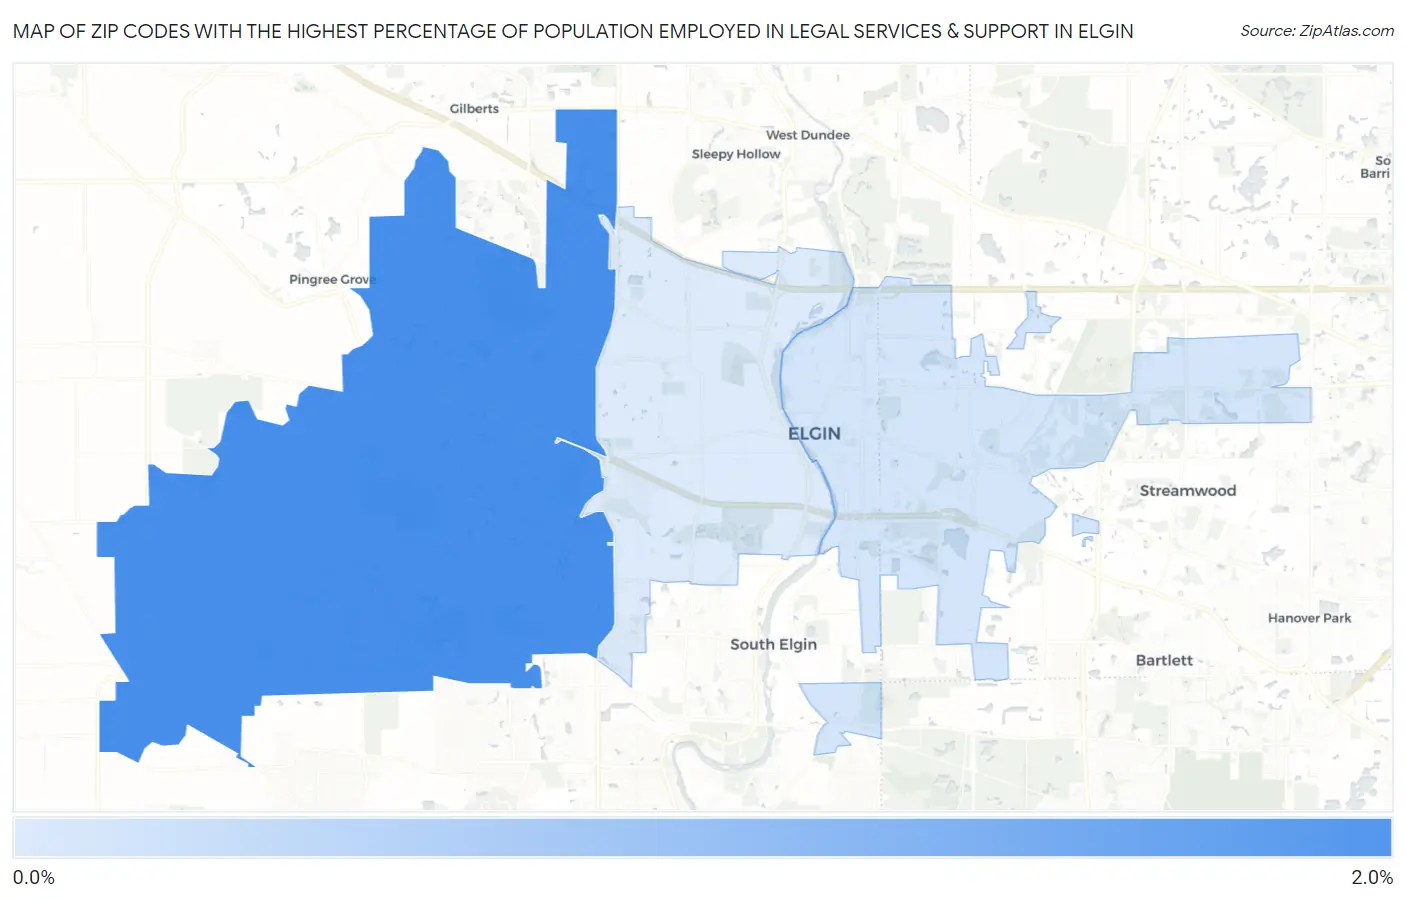
Zip Codes with the Highest Percentage of Population Employed in Legal Services & Support in Elgin, IL
| Zip Code | % Employed | vs State | vs National | |
| 1. | 60124 | 1.8% | 1.3%(+0.459)#156 | 1.2%(+0.624)#3,984 |
| 2. | 60120 | 0.39% | 1.3%(-0.959)#557 | 1.2%(-0.793)#13,938 |
| 3. | 60123 | 0.30% | 1.3%(-1.04)#603 | 1.2%(-0.879)#14,982 |
1
Common Questions
What are the Top Zip Codes with the Highest Percentage of Population Employed in Legal Services & Support in Elgin, IL?
Top Zip Codes with the Highest Percentage of Population Employed in Legal Services & Support in Elgin, IL are:
What zip code has the Highest Percentage of Population Employed in Legal Services & Support in Elgin, IL?
60124 has the Highest Percentage of Population Employed in Legal Services & Support in Elgin, IL with 1.8%.
What is the Percentage of Population Employed in Legal Services & Support in Elgin, IL?
Percentage of Population Employed in Legal Services & Support in Elgin is 0.71%.
What is the Percentage of Population Employed in Legal Services & Support in Illinois?
Percentage of Population Employed in Legal Services & Support in Illinois is 1.3%.
What is the Percentage of Population Employed in Legal Services & Support in the United States?
Percentage of Population Employed in Legal Services & Support in the United States is 1.2%.