Zip Codes with the Highest Percentage of Population with a Degree in Visual and Performing Arts in Elgin, IL
RELATED REPORTS & OPTIONS
Visual and Performing Arts
Elgin
Compare Zip Codes
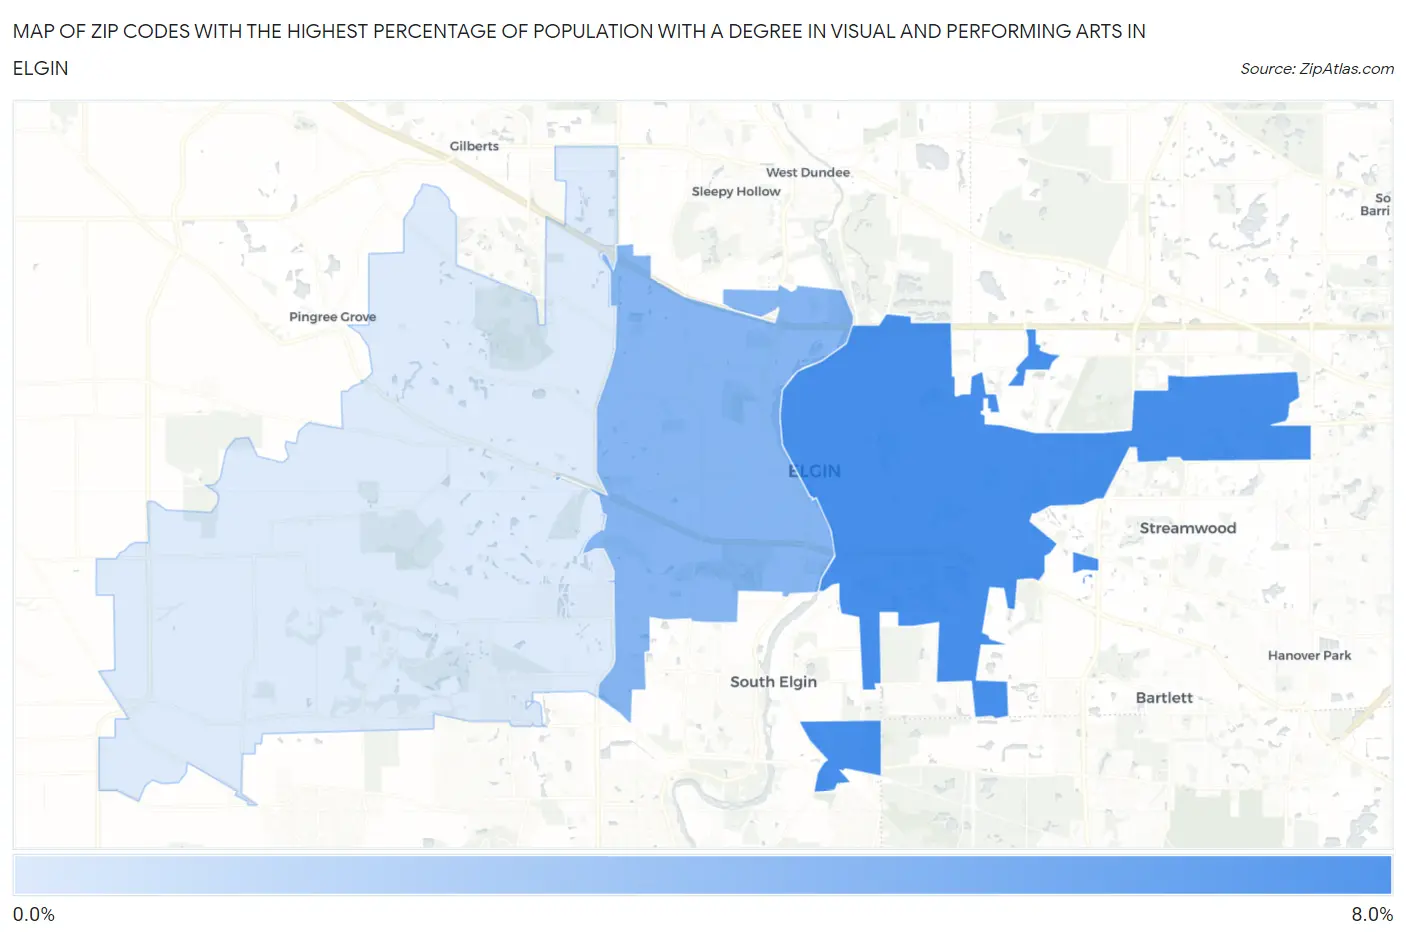
Map of Zip Codes with the Highest Percentage of Population with a Degree in Visual and Performing Arts in Elgin
0.96%
6.4%
Zip Codes with the Highest Percentage of Population with a Degree in Visual and Performing Arts in Elgin, IL
| Zip Code | % Graduates | vs State | vs National | |
| 1. | 60120 | 6.4% | 4.4%(+1.97)#176 | 4.3%(+2.17)#4,321 |
| 2. | 60123 | 4.1% | 4.4%(-0.332)#351 | 4.3%(-0.134)#8,875 |
| 3. | 60124 | 0.96% | 4.4%(-3.49)#808 | 4.3%(-3.29)#19,779 |
1
Common Questions
What are the Top Zip Codes with the Highest Percentage of Population with a Degree in Visual and Performing Arts in Elgin, IL?
Top Zip Codes with the Highest Percentage of Population with a Degree in Visual and Performing Arts in Elgin, IL are:
What zip code has the Highest Percentage of Population with a Degree in Visual and Performing Arts in Elgin, IL?
60120 has the Highest Percentage of Population with a Degree in Visual and Performing Arts in Elgin, IL with 6.4%.
What is the Percentage of Population with a Degree in Visual and Performing Arts in Elgin, IL?
Percentage of Population with a Degree in Visual and Performing Arts in Elgin is 4.0%.
What is the Percentage of Population with a Degree in Visual and Performing Arts in Illinois?
Percentage of Population with a Degree in Visual and Performing Arts in Illinois is 4.4%.
What is the Percentage of Population with a Degree in Visual and Performing Arts in the United States?
Percentage of Population with a Degree in Visual and Performing Arts in the United States is 4.3%.