Zip Codes with the Highest Percentage of Population Employed in Health Diagnosing & Treating in Elgin, IL
RELATED REPORTS & OPTIONS
Health Diagnosing & Treating
Elgin
Compare Zip Codes
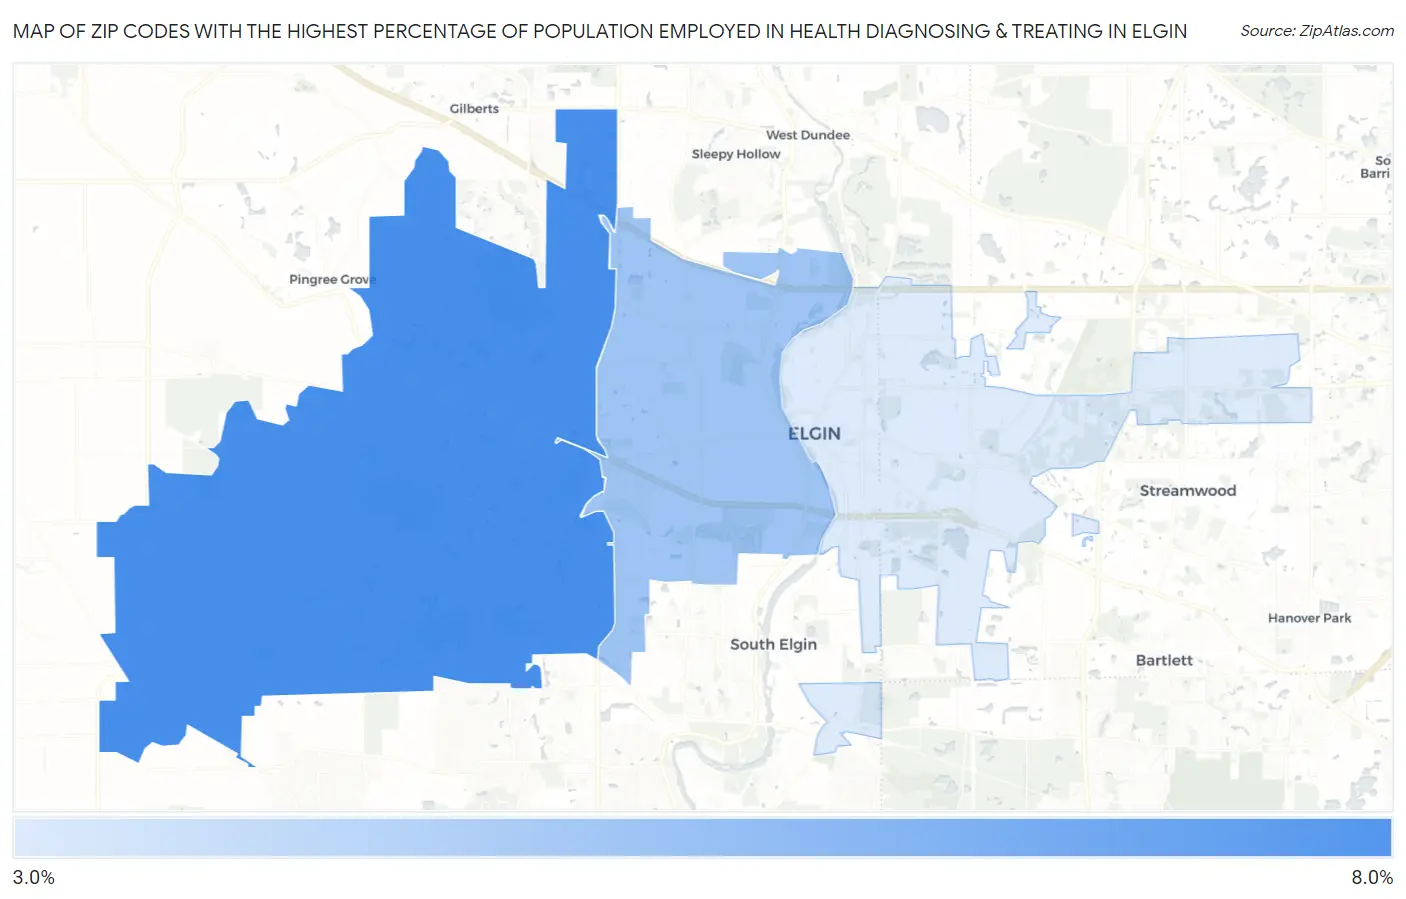
Map of Zip Codes with the Highest Percentage of Population Employed in Health Diagnosing & Treating in Elgin
3.0%
6.3%
Zip Codes with the Highest Percentage of Population Employed in Health Diagnosing & Treating in Elgin, IL
| Zip Code | % Employed | vs State | vs National | |
| 1. | 60124 | 6.3% | 6.2%(+0.049)#593 | 6.2%(+0.040)#12,815 |
| 2. | 60123 | 4.4% | 6.2%(-1.87)#955 | 6.2%(-1.88)#20,109 |
| 3. | 60120 | 3.0% | 6.2%(-3.20)#1,129 | 6.2%(-3.21)#24,223 |
1
Common Questions
What are the Top Zip Codes with the Highest Percentage of Population Employed in Health Diagnosing & Treating in Elgin, IL?
Top Zip Codes with the Highest Percentage of Population Employed in Health Diagnosing & Treating in Elgin, IL are:
What zip code has the Highest Percentage of Population Employed in Health Diagnosing & Treating in Elgin, IL?
60124 has the Highest Percentage of Population Employed in Health Diagnosing & Treating in Elgin, IL with 6.3%.
What is the Percentage of Population Employed in Health Diagnosing & Treating in Elgin, IL?
Percentage of Population Employed in Health Diagnosing & Treating in Elgin is 4.3%.
What is the Percentage of Population Employed in Health Diagnosing & Treating in Illinois?
Percentage of Population Employed in Health Diagnosing & Treating in Illinois is 6.2%.
What is the Percentage of Population Employed in Health Diagnosing & Treating in the United States?
Percentage of Population Employed in Health Diagnosing & Treating in the United States is 6.2%.