Zip Codes with the Highest Percentage of Population Employed in Health Diagnosing & Treating in Waterloo, IA
RELATED REPORTS & OPTIONS
Health Diagnosing & Treating
Waterloo
Compare Zip Codes
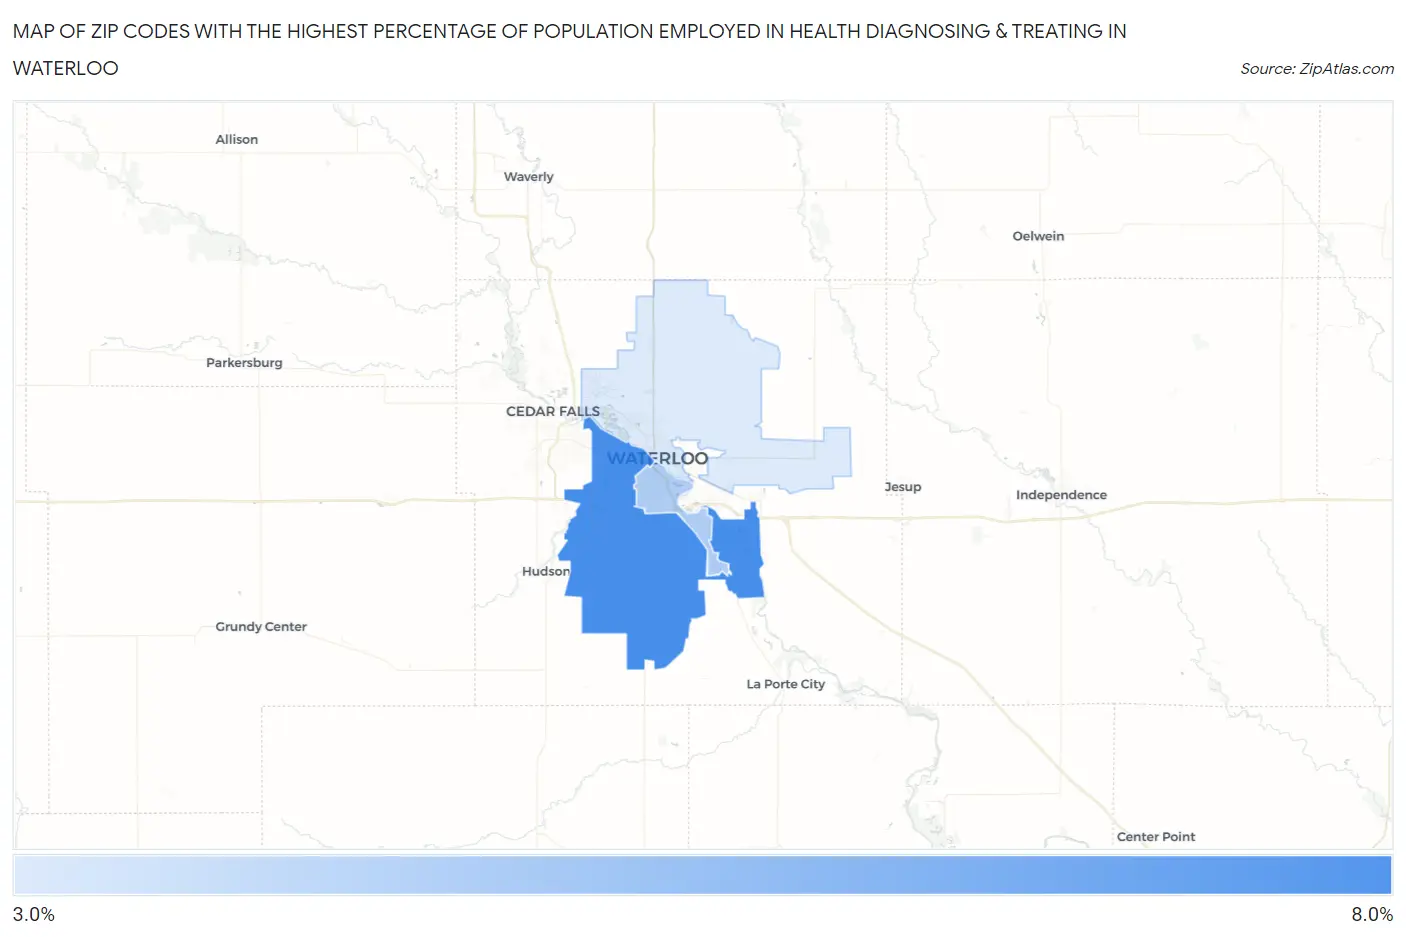
Map of Zip Codes with the Highest Percentage of Population Employed in Health Diagnosing & Treating in Waterloo
3.5%
7.1%
Zip Codes with the Highest Percentage of Population Employed in Health Diagnosing & Treating in Waterloo, IA
| Zip Code | % Employed | vs State | vs National | |
| 1. | 50701 | 7.1% | 6.2%(+0.936)#272 | 6.2%(+0.856)#10,033 |
| 2. | 50702 | 4.6% | 6.2%(-1.55)#525 | 6.2%(-1.63)#19,179 |
| 3. | 50703 | 3.5% | 6.2%(-2.62)#654 | 6.2%(-2.70)#22,775 |
1
Common Questions
What are the Top Zip Codes with the Highest Percentage of Population Employed in Health Diagnosing & Treating in Waterloo, IA?
Top Zip Codes with the Highest Percentage of Population Employed in Health Diagnosing & Treating in Waterloo, IA are:
What zip code has the Highest Percentage of Population Employed in Health Diagnosing & Treating in Waterloo, IA?
50701 has the Highest Percentage of Population Employed in Health Diagnosing & Treating in Waterloo, IA with 7.1%.
What is the Percentage of Population Employed in Health Diagnosing & Treating in Waterloo, IA?
Percentage of Population Employed in Health Diagnosing & Treating in Waterloo is 5.2%.
What is the Percentage of Population Employed in Health Diagnosing & Treating in Iowa?
Percentage of Population Employed in Health Diagnosing & Treating in Iowa is 6.2%.
What is the Percentage of Population Employed in Health Diagnosing & Treating in the United States?
Percentage of Population Employed in Health Diagnosing & Treating in the United States is 6.2%.