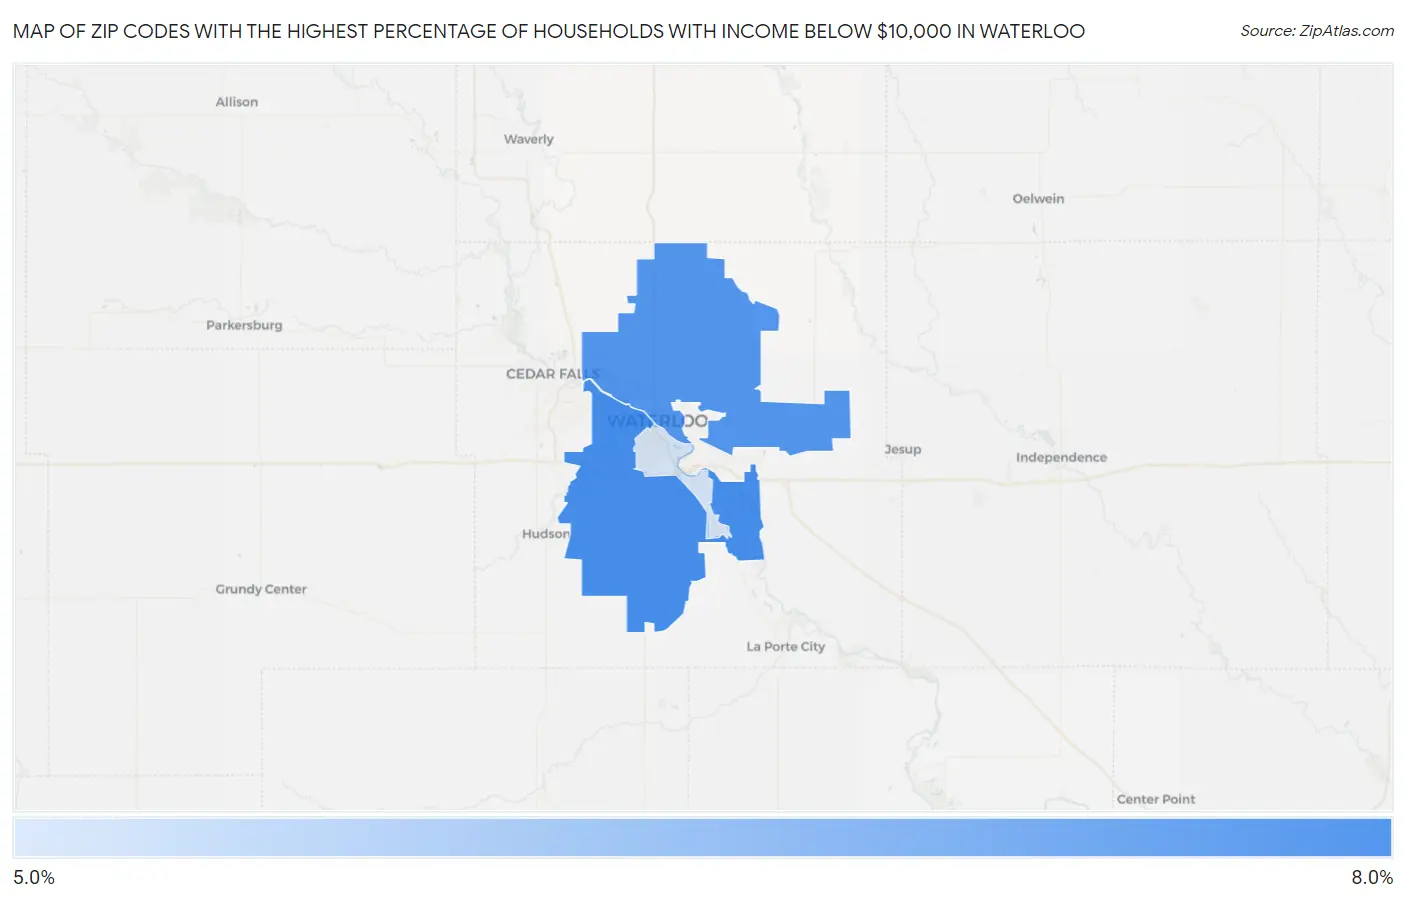
Zip Codes with the Highest Percentage of Households with Income Below $10,000 in Waterloo, IA
RELATED REPORTS & OPTIONS
Household Income | $0-10k
Waterloo
Compare Zip Codes
Map of Zip Codes with the Highest Percentage of Households with Income Below $10,000 in Waterloo
5.1%
6.1%
Zip Codes with the Highest Percentage of Households with Income Below $10,000 in Waterloo, IA
| Zip Code | Households with Income < $10k | vs State | vs National | |
| 1. | 50701 | 6.1% | 4.2%(+1.90)#169 | 4.9%(+1.20)#8,748 |
| 2. | 50703 | 6.0% | 4.2%(+1.80)#173 | 4.9%(+1.10)#9,024 |
| 3. | 50702 | 5.1% | 4.2%(+0.900)#227 | 4.9%(+0.200)#11,397 |
1
Common Questions
What are the Top Zip Codes with the Highest Percentage of Households with Income Below $10,000 in Waterloo, IA?
Top Zip Codes with the Highest Percentage of Households with Income Below $10,000 in Waterloo, IA are:
What zip code has the Highest Percentage of Households with Income Below $10,000 in Waterloo, IA?
50701 has the Highest Percentage of Households with Income Below $10,000 in Waterloo, IA with 6.1%.
What is the Percentage of Households with Income Below $10,000 in Waterloo, IA?
Percentage of Households with Income Below $10,000 in Waterloo is 5.8%.
What is the Percentage of Households with Income Below $10,000 in Iowa?
Percentage of Households with Income Below $10,000 in Iowa is 4.2%.
What is the Percentage of Households with Income Below $10,000 in the United States?
Percentage of Households with Income Below $10,000 in the United States is 4.9%.