Zip Codes with the Highest Percentage of Population Employed in Legal Services & Support in Waterloo, IA
RELATED REPORTS & OPTIONS
Legal Services & Support
Waterloo
Compare Zip Codes
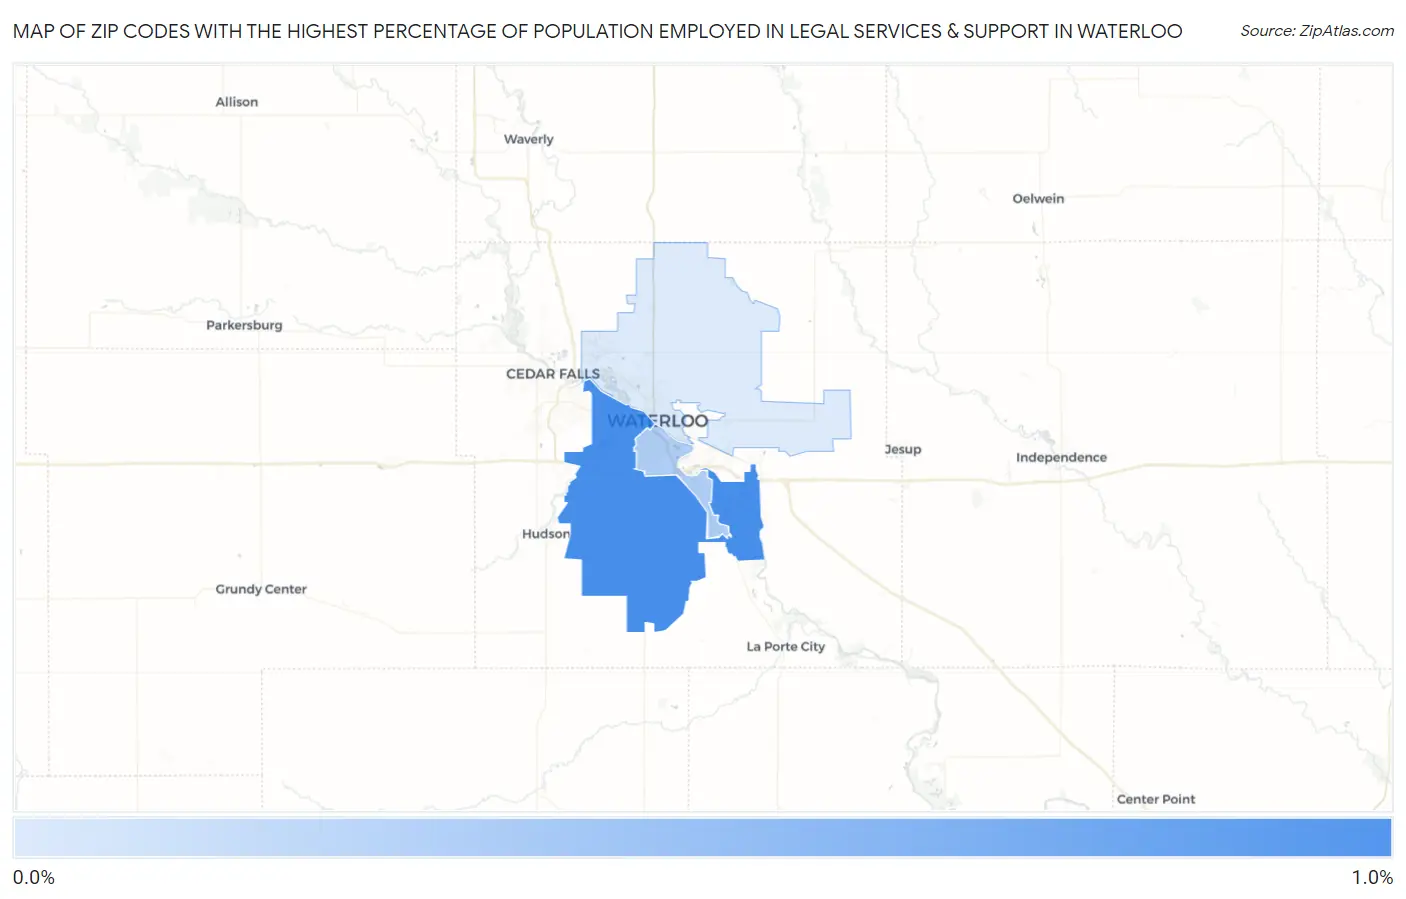
Map of Zip Codes with the Highest Percentage of Population Employed in Legal Services & Support in Waterloo
0.12%
0.99%
Zip Codes with the Highest Percentage of Population Employed in Legal Services & Support in Waterloo, IA
| Zip Code | % Employed | vs State | vs National | |
| 1. | 50701 | 0.99% | 0.75%(+0.240)#129 | 1.2%(-0.198)#7,919 |
| 2. | 50702 | 0.39% | 0.75%(-0.357)#280 | 1.2%(-0.796)#13,970 |
| 3. | 50703 | 0.12% | 0.75%(-0.630)#359 | 1.2%(-1.07)#17,002 |
1
Common Questions
What are the Top Zip Codes with the Highest Percentage of Population Employed in Legal Services & Support in Waterloo, IA?
Top Zip Codes with the Highest Percentage of Population Employed in Legal Services & Support in Waterloo, IA are:
What zip code has the Highest Percentage of Population Employed in Legal Services & Support in Waterloo, IA?
50701 has the Highest Percentage of Population Employed in Legal Services & Support in Waterloo, IA with 0.99%.
What is the Percentage of Population Employed in Legal Services & Support in Waterloo, IA?
Percentage of Population Employed in Legal Services & Support in Waterloo is 0.61%.
What is the Percentage of Population Employed in Legal Services & Support in Iowa?
Percentage of Population Employed in Legal Services & Support in Iowa is 0.75%.
What is the Percentage of Population Employed in Legal Services & Support in the United States?
Percentage of Population Employed in Legal Services & Support in the United States is 1.2%.