German vs Immigrants from Cameroon Currently Married
COMPARE
German
Immigrants from Cameroon
Currently Married
Currently Married Comparison
Germans
Immigrants from Cameroon
49.6%
CURRENTLY MARRIED
99.9/ 100
METRIC RATING
14th/ 347
METRIC RANK
44.2%
CURRENTLY MARRIED
0.3/ 100
METRIC RATING
249th/ 347
METRIC RANK
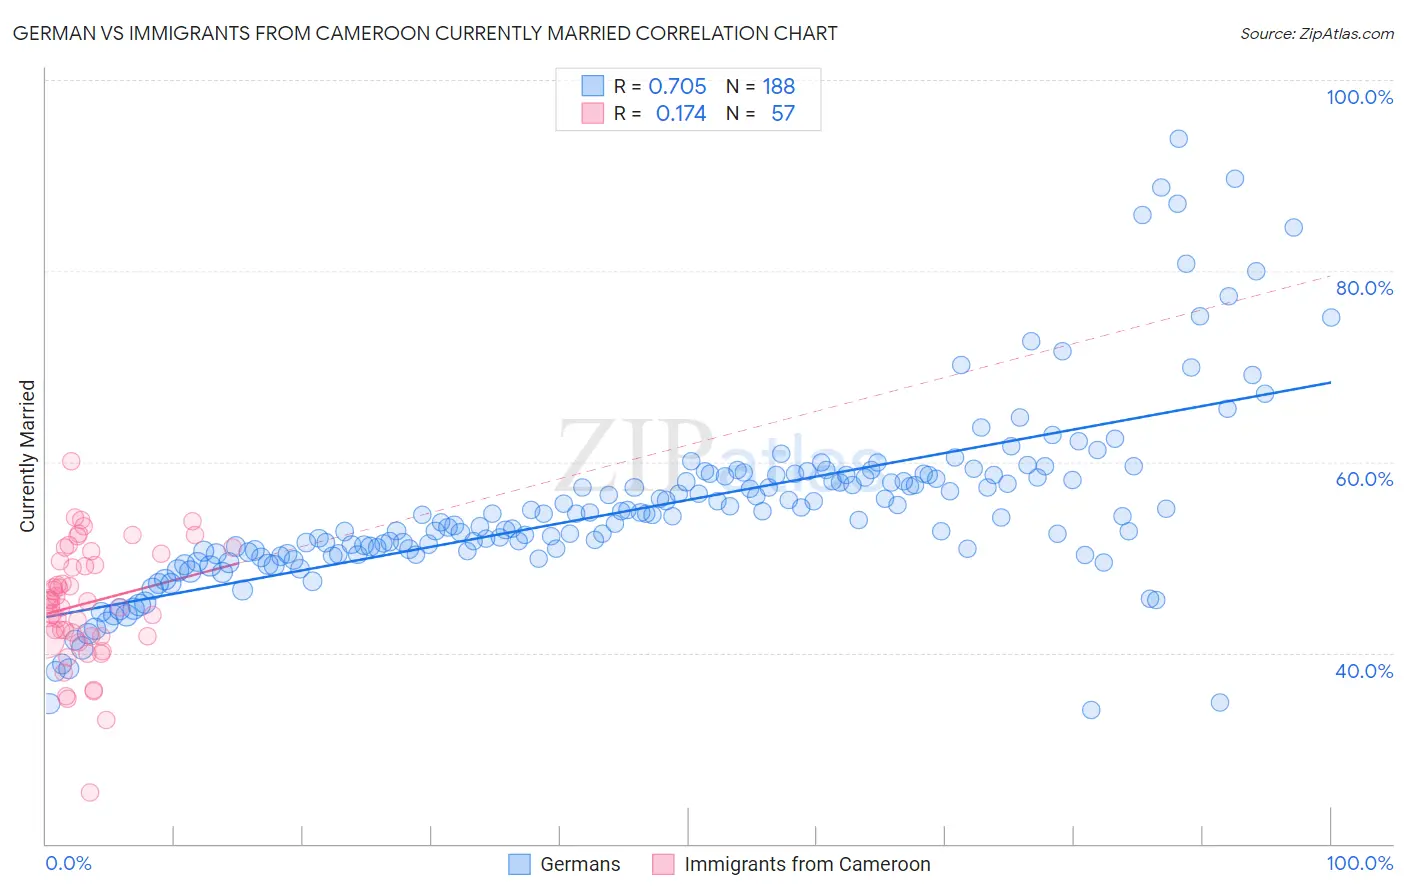
German vs Immigrants from Cameroon Currently Married Correlation Chart
The statistical analysis conducted on geographies consisting of 581,146,100 people shows a strong positive correlation between the proportion of Germans and percentage of population currently married in the United States with a correlation coefficient (R) of 0.705 and weighted average of 49.6%. Similarly, the statistical analysis conducted on geographies consisting of 130,755,125 people shows a poor positive correlation between the proportion of Immigrants from Cameroon and percentage of population currently married in the United States with a correlation coefficient (R) of 0.174 and weighted average of 44.2%, a difference of 12.2%.
Currently Married Correlation Summary
| Measurement | German | Immigrants from Cameroon |
| Minimum | 34.0% | 25.4% |
| Maximum | 93.9% | 60.1% |
| Range | 59.9% | 34.7% |
| Mean | 55.3% | 45.2% |
| Median | 54.4% | 45.4% |
| Interquartile 25% (IQ1) | 50.4% | 41.7% |
| Interquartile 75% (IQ3) | 58.5% | 50.0% |
| Interquartile Range (IQR) | 8.2% | 8.3% |
| Standard Deviation (Sample) | 9.6% | 6.2% |
| Standard Deviation (Population) | 9.5% | 6.1% |
Similar Demographics by Currently Married
Demographics Similar to Germans by Currently Married
In terms of currently married, the demographic groups most similar to Germans are Dutch (49.6%, a difference of 0.010%), Pennsylvania German (49.6%, a difference of 0.030%), Chinese (49.5%, a difference of 0.17%), Scandinavian (49.5%, a difference of 0.19%), and English (49.7%, a difference of 0.28%).
| Demographics | Rating | Rank | Currently Married |
| Immigrants | South Central Asia | 100.0 /100 | #7 | Exceptional 50.0% |
| Swedes | 100.0 /100 | #8 | Exceptional 50.0% |
| Czechs | 99.9 /100 | #9 | Exceptional 49.9% |
| Filipinos | 99.9 /100 | #10 | Exceptional 49.7% |
| English | 99.9 /100 | #11 | Exceptional 49.7% |
| Swiss | 99.9 /100 | #12 | Exceptional 49.7% |
| Dutch | 99.9 /100 | #13 | Exceptional 49.6% |
| Germans | 99.9 /100 | #14 | Exceptional 49.6% |
| Pennsylvania Germans | 99.9 /100 | #15 | Exceptional 49.6% |
| Chinese | 99.9 /100 | #16 | Exceptional 49.5% |
| Scandinavians | 99.9 /100 | #17 | Exceptional 49.5% |
| Immigrants | Scotland | 99.8 /100 | #18 | Exceptional 49.3% |
| Europeans | 99.8 /100 | #19 | Exceptional 49.3% |
| Luxembourgers | 99.8 /100 | #20 | Exceptional 49.3% |
| Scottish | 99.8 /100 | #21 | Exceptional 49.2% |
Demographics Similar to Immigrants from Cameroon by Currently Married
In terms of currently married, the demographic groups most similar to Immigrants from Cameroon are Nicaraguan (44.2%, a difference of 0.020%), Immigrants from Eastern Africa (44.2%, a difference of 0.020%), Blackfeet (44.2%, a difference of 0.080%), Ugandan (44.2%, a difference of 0.10%), and Hispanic or Latino (44.1%, a difference of 0.11%).
| Demographics | Rating | Rank | Currently Married |
| Immigrants | Cambodia | 0.7 /100 | #242 | Tragic 44.5% |
| Immigrants | Ethiopia | 0.7 /100 | #243 | Tragic 44.5% |
| Japanese | 0.6 /100 | #244 | Tragic 44.5% |
| Immigrants | Armenia | 0.4 /100 | #245 | Tragic 44.3% |
| Immigrants | Burma/Myanmar | 0.4 /100 | #246 | Tragic 44.3% |
| Ugandans | 0.4 /100 | #247 | Tragic 44.2% |
| Nicaraguans | 0.3 /100 | #248 | Tragic 44.2% |
| Immigrants | Cameroon | 0.3 /100 | #249 | Tragic 44.2% |
| Immigrants | Eastern Africa | 0.3 /100 | #250 | Tragic 44.2% |
| Blackfeet | 0.3 /100 | #251 | Tragic 44.2% |
| Hispanics or Latinos | 0.3 /100 | #252 | Tragic 44.1% |
| Immigrants | Central America | 0.3 /100 | #253 | Tragic 44.1% |
| Vietnamese | 0.2 /100 | #254 | Tragic 44.0% |
| Yakama | 0.2 /100 | #255 | Tragic 44.0% |
| Shoshone | 0.2 /100 | #256 | Tragic 44.0% |