German vs Chickasaw Cognitive Disability
COMPARE
German
Chickasaw
Cognitive Disability
Cognitive Disability Comparison
Germans
Chickasaw
16.7%
COGNITIVE DISABILITY
99.3/ 100
METRIC RATING
72nd/ 347
METRIC RANK
18.5%
COGNITIVE DISABILITY
0.0/ 100
METRIC RATING
312th/ 347
METRIC RANK
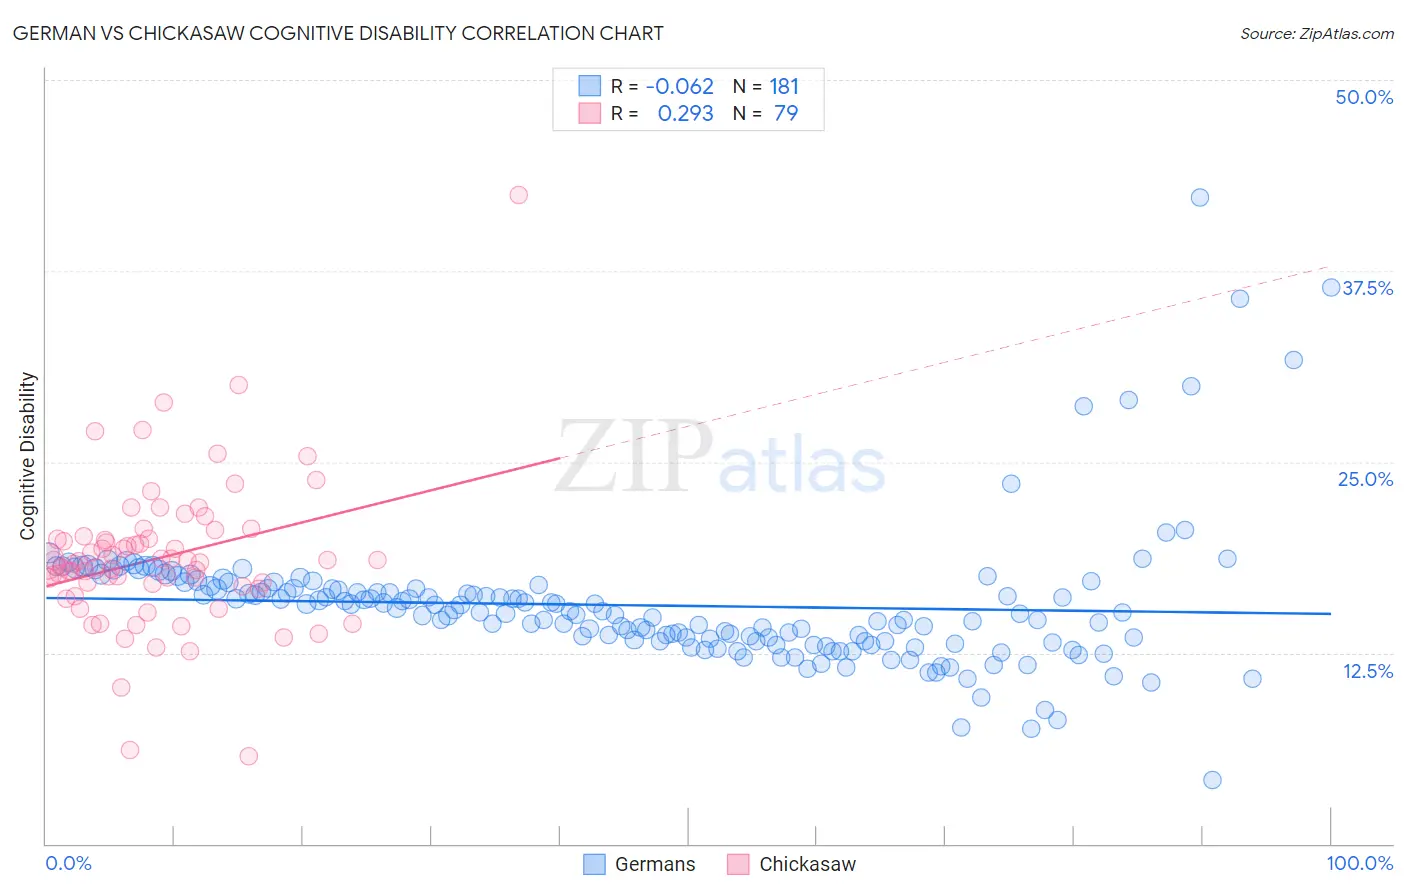
German vs Chickasaw Cognitive Disability Correlation Chart
The statistical analysis conducted on geographies consisting of 580,999,229 people shows a slight negative correlation between the proportion of Germans and percentage of population with cognitive disability in the United States with a correlation coefficient (R) of -0.062 and weighted average of 16.7%. Similarly, the statistical analysis conducted on geographies consisting of 147,689,565 people shows a weak positive correlation between the proportion of Chickasaw and percentage of population with cognitive disability in the United States with a correlation coefficient (R) of 0.293 and weighted average of 18.5%, a difference of 11.0%.
Cognitive Disability Correlation Summary
| Measurement | German | Chickasaw |
| Minimum | 4.2% | 5.7% |
| Maximum | 42.3% | 42.5% |
| Range | 38.1% | 36.8% |
| Mean | 15.6% | 18.7% |
| Median | 15.2% | 18.5% |
| Interquartile 25% (IQ1) | 13.3% | 16.9% |
| Interquartile 75% (IQ3) | 16.9% | 20.0% |
| Interquartile Range (IQR) | 3.7% | 3.1% |
| Standard Deviation (Sample) | 4.5% | 4.9% |
| Standard Deviation (Population) | 4.5% | 4.9% |
Similar Demographics by Cognitive Disability
Demographics Similar to Germans by Cognitive Disability
In terms of cognitive disability, the demographic groups most similar to Germans are Burmese (16.7%, a difference of 0.010%), Slavic (16.7%, a difference of 0.010%), Immigrants from Sweden (16.7%, a difference of 0.020%), Immigrants from Belgium (16.7%, a difference of 0.020%), and Estonian (16.7%, a difference of 0.020%).
| Demographics | Rating | Rank | Cognitive Disability |
| Colombians | 99.6 /100 | #65 | Exceptional 16.6% |
| Immigrants | Ukraine | 99.5 /100 | #66 | Exceptional 16.6% |
| Latvians | 99.5 /100 | #67 | Exceptional 16.6% |
| Ukrainians | 99.4 /100 | #68 | Exceptional 16.6% |
| Immigrants | Uzbekistan | 99.4 /100 | #69 | Exceptional 16.7% |
| Immigrants | Sweden | 99.4 /100 | #70 | Exceptional 16.7% |
| Immigrants | Belgium | 99.3 /100 | #71 | Exceptional 16.7% |
| Germans | 99.3 /100 | #72 | Exceptional 16.7% |
| Burmese | 99.3 /100 | #73 | Exceptional 16.7% |
| Slavs | 99.3 /100 | #74 | Exceptional 16.7% |
| Estonians | 99.3 /100 | #75 | Exceptional 16.7% |
| Immigrants | Serbia | 99.3 /100 | #76 | Exceptional 16.7% |
| Immigrants | Hungary | 99.3 /100 | #77 | Exceptional 16.7% |
| Peruvians | 99.3 /100 | #78 | Exceptional 16.7% |
| Immigrants | Bulgaria | 99.3 /100 | #79 | Exceptional 16.7% |
Demographics Similar to Chickasaw by Cognitive Disability
In terms of cognitive disability, the demographic groups most similar to Chickasaw are Yaqui (18.5%, a difference of 0.11%), Subsaharan African (18.5%, a difference of 0.17%), Hmong (18.4%, a difference of 0.29%), Choctaw (18.4%, a difference of 0.31%), and Immigrants from Dominica (18.6%, a difference of 0.35%).
| Demographics | Rating | Rank | Cognitive Disability |
| Colville | 0.0 /100 | #305 | Tragic 18.3% |
| Seminole | 0.0 /100 | #306 | Tragic 18.3% |
| Ugandans | 0.0 /100 | #307 | Tragic 18.3% |
| Immigrants | Western Africa | 0.0 /100 | #308 | Tragic 18.4% |
| Immigrants | Eastern Africa | 0.0 /100 | #309 | Tragic 18.4% |
| Choctaw | 0.0 /100 | #310 | Tragic 18.4% |
| Hmong | 0.0 /100 | #311 | Tragic 18.4% |
| Chickasaw | 0.0 /100 | #312 | Tragic 18.5% |
| Yaqui | 0.0 /100 | #313 | Tragic 18.5% |
| Sub-Saharan Africans | 0.0 /100 | #314 | Tragic 18.5% |
| Immigrants | Dominica | 0.0 /100 | #315 | Tragic 18.6% |
| Immigrants | Middle Africa | 0.0 /100 | #316 | Tragic 18.6% |
| Liberians | 0.0 /100 | #317 | Tragic 18.6% |
| Bangladeshis | 0.0 /100 | #318 | Tragic 18.6% |
| Comanche | 0.0 /100 | #319 | Tragic 18.6% |