German vs Chickasaw Male Disability
COMPARE
German
Chickasaw
Male Disability
Male Disability Comparison
Germans
Chickasaw
12.7%
MALE DISABILITY
0.0/ 100
METRIC RATING
283rd/ 347
METRIC RANK
15.1%
MALE DISABILITY
0.0/ 100
METRIC RATING
339th/ 347
METRIC RANK
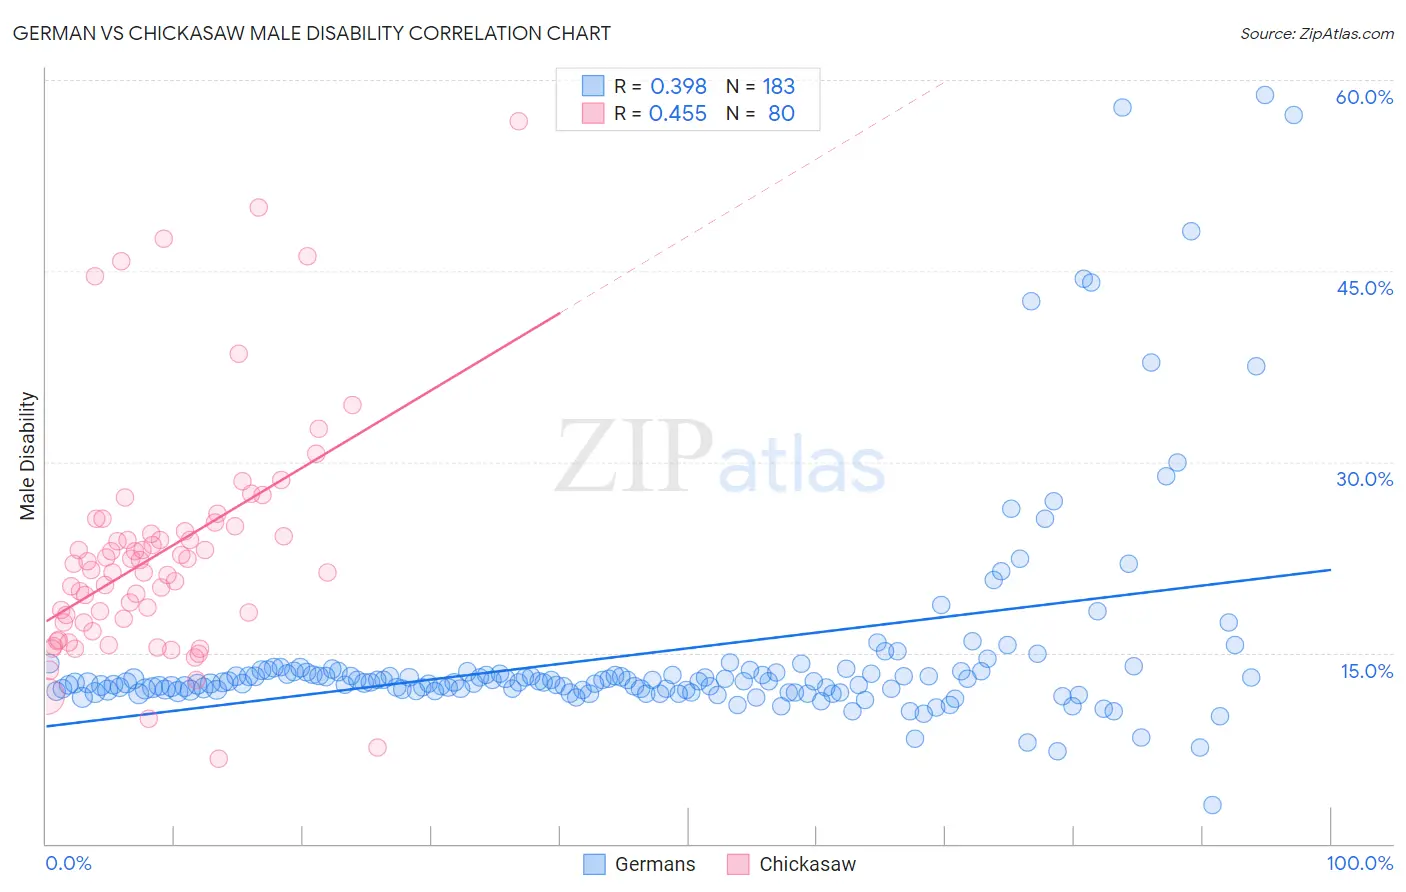
German vs Chickasaw Male Disability Correlation Chart
The statistical analysis conducted on geographies consisting of 580,769,413 people shows a mild positive correlation between the proportion of Germans and percentage of males with a disability in the United States with a correlation coefficient (R) of 0.398 and weighted average of 12.7%. Similarly, the statistical analysis conducted on geographies consisting of 147,685,248 people shows a moderate positive correlation between the proportion of Chickasaw and percentage of males with a disability in the United States with a correlation coefficient (R) of 0.455 and weighted average of 15.1%, a difference of 18.9%.
Male Disability Correlation Summary
| Measurement | German | Chickasaw |
| Minimum | 3.0% | 6.7% |
| Maximum | 58.8% | 56.8% |
| Range | 55.8% | 50.1% |
| Mean | 14.9% | 22.9% |
| Median | 12.7% | 21.7% |
| Interquartile 25% (IQ1) | 12.1% | 17.4% |
| Interquartile 75% (IQ3) | 13.5% | 24.7% |
| Interquartile Range (IQR) | 1.4% | 7.4% |
| Standard Deviation (Sample) | 8.3% | 9.2% |
| Standard Deviation (Population) | 8.3% | 9.1% |
Similar Demographics by Male Disability
Demographics Similar to Germans by Male Disability
In terms of male disability, the demographic groups most similar to Germans are Irish (12.7%, a difference of 0.010%), Sioux (12.7%, a difference of 0.070%), Dutch (12.7%, a difference of 0.12%), Slovak (12.7%, a difference of 0.17%), and Spanish (12.7%, a difference of 0.27%).
| Demographics | Rating | Rank | Male Disability |
| Africans | 0.0 /100 | #276 | Tragic 12.6% |
| Finns | 0.0 /100 | #277 | Tragic 12.6% |
| Central American Indians | 0.0 /100 | #278 | Tragic 12.7% |
| Slovaks | 0.0 /100 | #279 | Tragic 12.7% |
| Dutch | 0.0 /100 | #280 | Tragic 12.7% |
| Sioux | 0.0 /100 | #281 | Tragic 12.7% |
| Irish | 0.0 /100 | #282 | Tragic 12.7% |
| Germans | 0.0 /100 | #283 | Tragic 12.7% |
| Spanish | 0.0 /100 | #284 | Tragic 12.7% |
| Welsh | 0.0 /100 | #285 | Tragic 12.7% |
| Scottish | 0.0 /100 | #286 | Tragic 12.8% |
| Cape Verdeans | 0.0 /100 | #287 | Tragic 12.8% |
| Yup'ik | 0.0 /100 | #288 | Tragic 12.8% |
| Immigrants | Cabo Verde | 0.0 /100 | #289 | Tragic 12.8% |
| Pima | 0.0 /100 | #290 | Tragic 12.8% |
Demographics Similar to Chickasaw by Male Disability
In terms of male disability, the demographic groups most similar to Chickasaw are Lumbee (15.2%, a difference of 0.74%), Pueblo (15.0%, a difference of 0.80%), Menominee (15.0%, a difference of 0.91%), Alaskan Athabascan (14.9%, a difference of 1.4%), and Choctaw (15.4%, a difference of 1.8%).
| Demographics | Rating | Rank | Male Disability |
| Seminole | 0.0 /100 | #332 | Tragic 14.7% |
| Yuman | 0.0 /100 | #333 | Tragic 14.7% |
| Cherokee | 0.0 /100 | #334 | Tragic 14.8% |
| Dutch West Indians | 0.0 /100 | #335 | Tragic 14.8% |
| Alaskan Athabascans | 0.0 /100 | #336 | Tragic 14.9% |
| Menominee | 0.0 /100 | #337 | Tragic 15.0% |
| Pueblo | 0.0 /100 | #338 | Tragic 15.0% |
| Chickasaw | 0.0 /100 | #339 | Tragic 15.1% |
| Lumbee | 0.0 /100 | #340 | Tragic 15.2% |
| Choctaw | 0.0 /100 | #341 | Tragic 15.4% |
| Kiowa | 0.0 /100 | #342 | Tragic 15.4% |
| Creek | 0.0 /100 | #343 | Tragic 15.5% |
| Puerto Ricans | 0.0 /100 | #344 | Tragic 15.6% |
| Tsimshian | 0.0 /100 | #345 | Tragic 15.6% |
| Colville | 0.0 /100 | #346 | Tragic 16.5% |