German vs Moroccan Currently Married
COMPARE
German
Moroccan
Currently Married
Currently Married Comparison
Germans
Moroccans
49.6%
CURRENTLY MARRIED
99.9/ 100
METRIC RATING
14th/ 347
METRIC RANK
44.6%
CURRENTLY MARRIED
0.9/ 100
METRIC RATING
238th/ 347
METRIC RANK
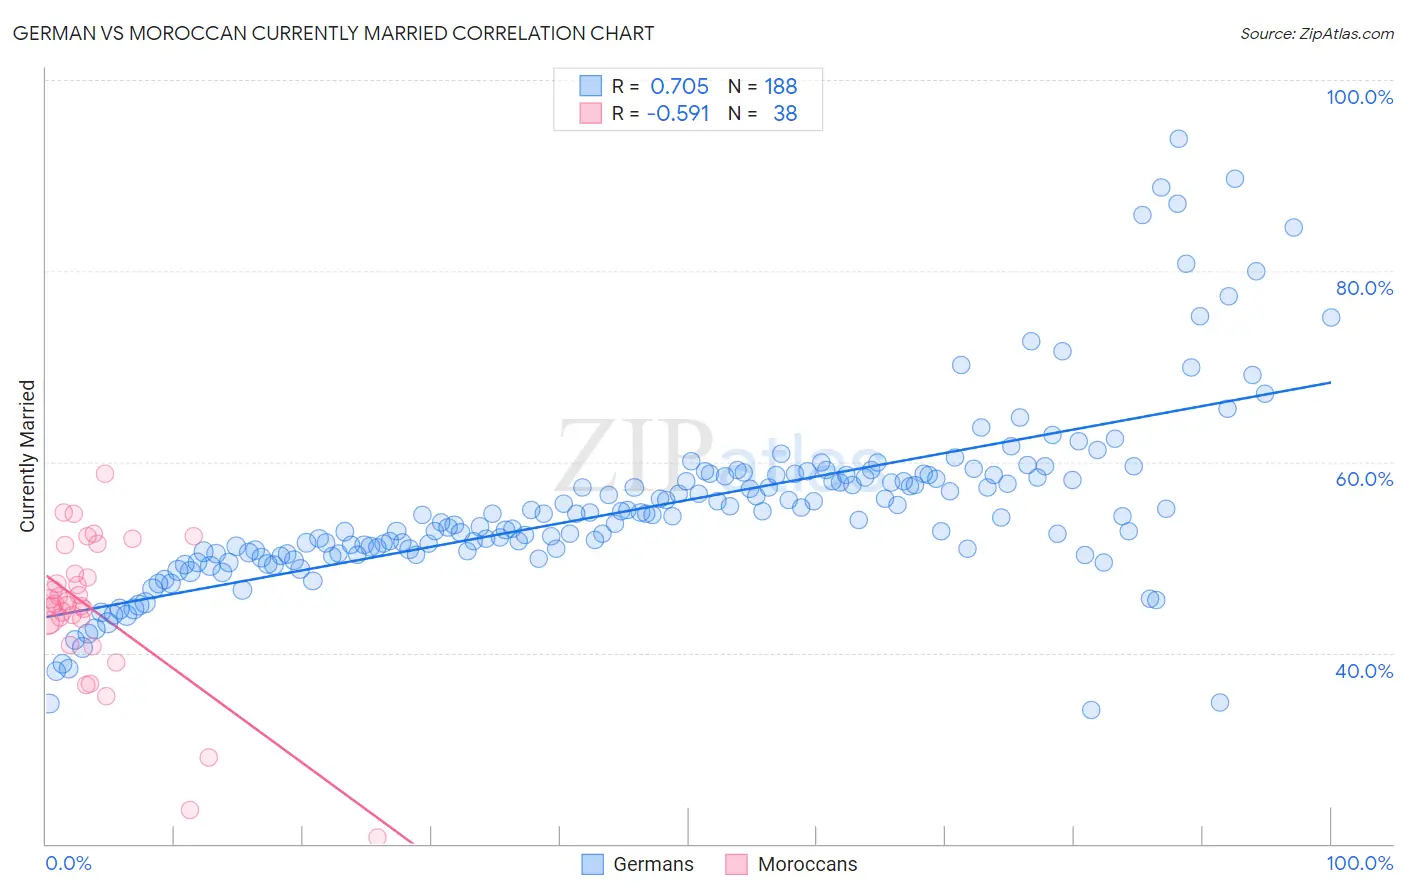
German vs Moroccan Currently Married Correlation Chart
The statistical analysis conducted on geographies consisting of 581,146,100 people shows a strong positive correlation between the proportion of Germans and percentage of population currently married in the United States with a correlation coefficient (R) of 0.705 and weighted average of 49.6%. Similarly, the statistical analysis conducted on geographies consisting of 201,812,139 people shows a substantial negative correlation between the proportion of Moroccans and percentage of population currently married in the United States with a correlation coefficient (R) of -0.591 and weighted average of 44.6%, a difference of 11.2%.
Currently Married Correlation Summary
| Measurement | German | Moroccan |
| Minimum | 34.0% | 20.7% |
| Maximum | 93.9% | 58.8% |
| Range | 59.9% | 38.1% |
| Mean | 55.3% | 44.4% |
| Median | 54.4% | 45.0% |
| Interquartile 25% (IQ1) | 50.4% | 43.1% |
| Interquartile 75% (IQ3) | 58.5% | 48.3% |
| Interquartile Range (IQR) | 8.2% | 5.2% |
| Standard Deviation (Sample) | 9.6% | 7.9% |
| Standard Deviation (Population) | 9.5% | 7.8% |
Similar Demographics by Currently Married
Demographics Similar to Germans by Currently Married
In terms of currently married, the demographic groups most similar to Germans are Dutch (49.6%, a difference of 0.010%), Pennsylvania German (49.6%, a difference of 0.030%), Chinese (49.5%, a difference of 0.17%), Scandinavian (49.5%, a difference of 0.19%), and English (49.7%, a difference of 0.28%).
| Demographics | Rating | Rank | Currently Married |
| Immigrants | South Central Asia | 100.0 /100 | #7 | Exceptional 50.0% |
| Swedes | 100.0 /100 | #8 | Exceptional 50.0% |
| Czechs | 99.9 /100 | #9 | Exceptional 49.9% |
| Filipinos | 99.9 /100 | #10 | Exceptional 49.7% |
| English | 99.9 /100 | #11 | Exceptional 49.7% |
| Swiss | 99.9 /100 | #12 | Exceptional 49.7% |
| Dutch | 99.9 /100 | #13 | Exceptional 49.6% |
| Germans | 99.9 /100 | #14 | Exceptional 49.6% |
| Pennsylvania Germans | 99.9 /100 | #15 | Exceptional 49.6% |
| Chinese | 99.9 /100 | #16 | Exceptional 49.5% |
| Scandinavians | 99.9 /100 | #17 | Exceptional 49.5% |
| Immigrants | Scotland | 99.8 /100 | #18 | Exceptional 49.3% |
| Europeans | 99.8 /100 | #19 | Exceptional 49.3% |
| Luxembourgers | 99.8 /100 | #20 | Exceptional 49.3% |
| Scottish | 99.8 /100 | #21 | Exceptional 49.2% |
Demographics Similar to Moroccans by Currently Married
In terms of currently married, the demographic groups most similar to Moroccans are Cuban (44.6%, a difference of 0.080%), Seminole (44.6%, a difference of 0.080%), Alaskan Athabascan (44.6%, a difference of 0.090%), Immigrants from Mexico (44.5%, a difference of 0.14%), and Mexican American Indian (44.5%, a difference of 0.14%).
| Demographics | Rating | Rank | Currently Married |
| Immigrants | Panama | 1.5 /100 | #231 | Tragic 44.9% |
| Nepalese | 1.2 /100 | #232 | Tragic 44.7% |
| Immigrants | Saudi Arabia | 1.1 /100 | #233 | Tragic 44.7% |
| Iroquois | 1.1 /100 | #234 | Tragic 44.7% |
| Alaskan Athabascans | 0.9 /100 | #235 | Tragic 44.6% |
| Cubans | 0.9 /100 | #236 | Tragic 44.6% |
| Seminole | 0.9 /100 | #237 | Tragic 44.6% |
| Moroccans | 0.9 /100 | #238 | Tragic 44.6% |
| Immigrants | Mexico | 0.7 /100 | #239 | Tragic 44.5% |
| Mexican American Indians | 0.7 /100 | #240 | Tragic 44.5% |
| Ethiopians | 0.7 /100 | #241 | Tragic 44.5% |
| Immigrants | Cambodia | 0.7 /100 | #242 | Tragic 44.5% |
| Immigrants | Ethiopia | 0.7 /100 | #243 | Tragic 44.5% |
| Japanese | 0.6 /100 | #244 | Tragic 44.5% |
| Immigrants | Armenia | 0.4 /100 | #245 | Tragic 44.3% |