Yup'ik vs Houma College, 1 year or more
COMPARE
Yup'ik
Houma
College, 1 year or more
College, 1 year or more Comparison
Yup'ik
Houma
39.4%
COLLEGE, 1 YEAR OR MORE
0.0/ 100
METRIC RATING
347th/ 347
METRIC RANK
41.2%
COLLEGE, 1 YEAR OR MORE
0.0/ 100
METRIC RATING
346th/ 347
METRIC RANK
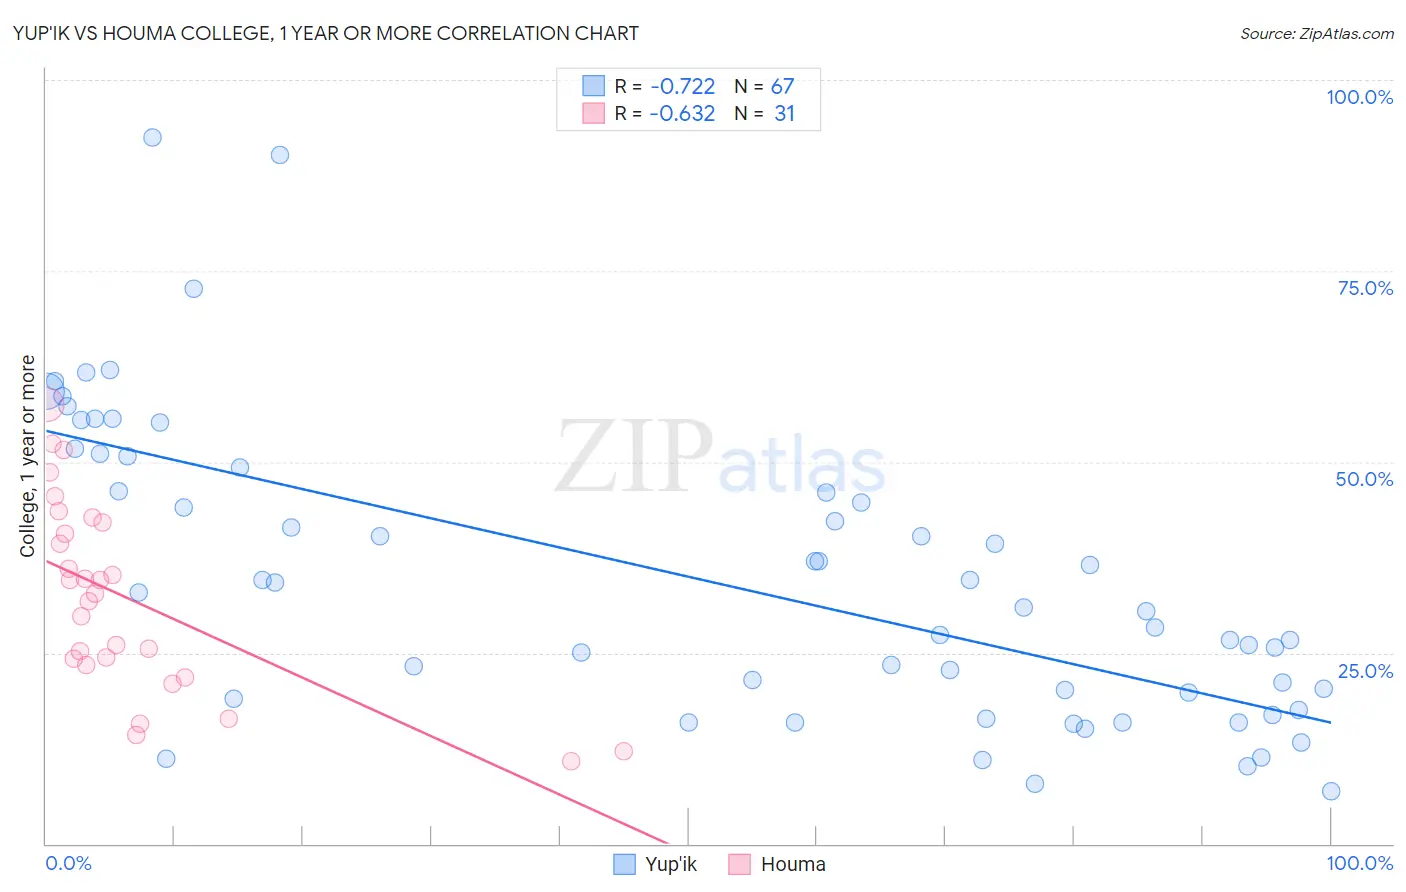
Yup'ik vs Houma College, 1 year or more Correlation Chart
The statistical analysis conducted on geographies consisting of 39,964,300 people shows a strong negative correlation between the proportion of Yup'ik and percentage of population with at least college, 1 year or more education in the United States with a correlation coefficient (R) of -0.722 and weighted average of 39.4%. Similarly, the statistical analysis conducted on geographies consisting of 36,795,542 people shows a significant negative correlation between the proportion of Houma and percentage of population with at least college, 1 year or more education in the United States with a correlation coefficient (R) of -0.632 and weighted average of 41.2%, a difference of 4.5%.
College, 1 year or more Correlation Summary
| Measurement | Yup'ik | Houma |
| Minimum | 6.9% | 10.8% |
| Maximum | 92.4% | 57.5% |
| Range | 85.5% | 46.7% |
| Mean | 34.7% | 32.1% |
| Median | 30.9% | 32.7% |
| Interquartile 25% (IQ1) | 19.0% | 23.5% |
| Interquartile 75% (IQ3) | 49.2% | 42.0% |
| Interquartile Range (IQR) | 30.2% | 18.6% |
| Standard Deviation (Sample) | 19.3% | 12.4% |
| Standard Deviation (Population) | 19.2% | 12.2% |
Demographics Similar to Yup'ik and Houma by College, 1 year or more
In terms of college, 1 year or more, the demographic groups most similar to Yup'ik are Pima (45.6%, a difference of 15.7%), Yakama (46.2%, a difference of 17.2%), Tohono O'odham (47.1%, a difference of 19.5%), Inupiat (47.2%, a difference of 19.8%), and Immigrants from Mexico (47.5%, a difference of 20.5%). Similarly, the demographic groups most similar to Houma are Pima (45.6%, a difference of 10.7%), Yakama (46.2%, a difference of 12.2%), Tohono O'odham (47.1%, a difference of 14.4%), Inupiat (47.2%, a difference of 14.6%), and Immigrants from Mexico (47.5%, a difference of 15.3%).
| Demographics | Rating | Rank | College, 1 year or more |
| Dutch West Indians | 0.0 /100 | #328 | Tragic 50.5% |
| Cape Verdeans | 0.0 /100 | #329 | Tragic 50.3% |
| Natives/Alaskans | 0.0 /100 | #330 | Tragic 50.2% |
| Immigrants | Yemen | 0.0 /100 | #331 | Tragic 50.0% |
| Mexicans | 0.0 /100 | #332 | Tragic 49.2% |
| Immigrants | Dominican Republic | 0.0 /100 | #333 | Tragic 49.1% |
| Lumbee | 0.0 /100 | #334 | Tragic 48.9% |
| Yuman | 0.0 /100 | #335 | Tragic 48.7% |
| Spanish American Indians | 0.0 /100 | #336 | Tragic 48.5% |
| Pennsylvania Germans | 0.0 /100 | #337 | Tragic 48.5% |
| Immigrants | Central America | 0.0 /100 | #338 | Tragic 48.5% |
| Immigrants | Azores | 0.0 /100 | #339 | Tragic 48.4% |
| Immigrants | Cabo Verde | 0.0 /100 | #340 | Tragic 48.1% |
| Immigrants | Mexico | 0.0 /100 | #341 | Tragic 47.5% |
| Inupiat | 0.0 /100 | #342 | Tragic 47.2% |
| Tohono O'odham | 0.0 /100 | #343 | Tragic 47.1% |
| Yakama | 0.0 /100 | #344 | Tragic 46.2% |
| Pima | 0.0 /100 | #345 | Tragic 45.6% |
| Houma | 0.0 /100 | #346 | Tragic 41.2% |
| Yup'ik | 0.0 /100 | #347 | Tragic 39.4% |