Lebanese vs Cheyenne College, Under 1 year
COMPARE
Lebanese
Cheyenne
College, Under 1 year
College, Under 1 year Comparison
Lebanese
Cheyenne
67.5%
COLLEGE, UNDER 1 YEAR
94.6/ 100
METRIC RATING
119th/ 347
METRIC RANK
60.6%
COLLEGE, UNDER 1 YEAR
0.1/ 100
METRIC RATING
270th/ 347
METRIC RANK
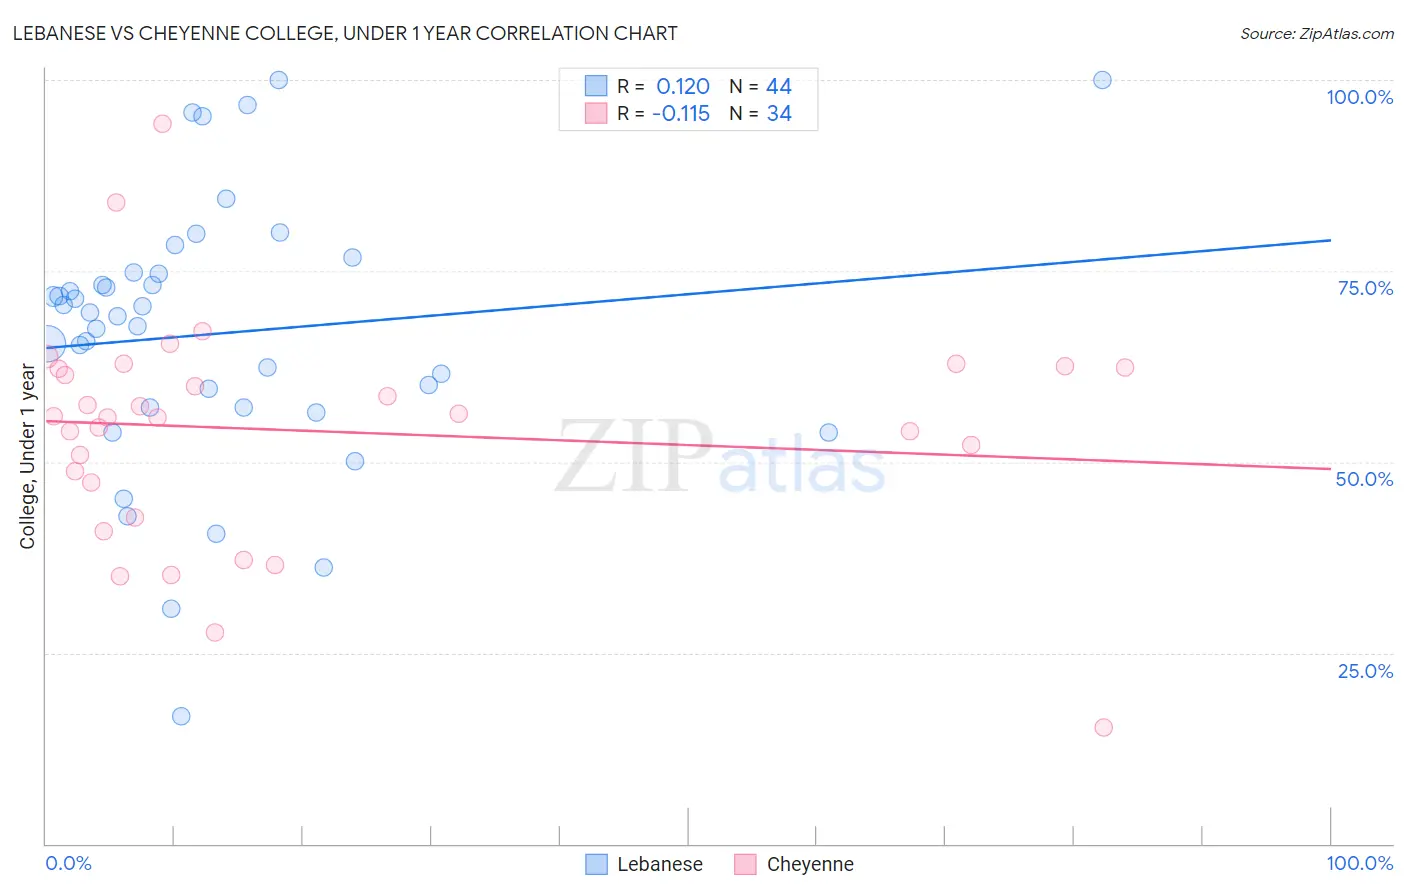
Lebanese vs Cheyenne College, Under 1 year Correlation Chart
The statistical analysis conducted on geographies consisting of 401,622,274 people shows a poor positive correlation between the proportion of Lebanese and percentage of population with at least college, under 1 year education in the United States with a correlation coefficient (R) of 0.120 and weighted average of 67.5%. Similarly, the statistical analysis conducted on geographies consisting of 80,719,411 people shows a poor negative correlation between the proportion of Cheyenne and percentage of population with at least college, under 1 year education in the United States with a correlation coefficient (R) of -0.115 and weighted average of 60.6%, a difference of 11.4%.
College, Under 1 year Correlation Summary
| Measurement | Lebanese | Cheyenne |
| Minimum | 16.6% | 15.3% |
| Maximum | 100.0% | 94.3% |
| Range | 83.4% | 79.1% |
| Mean | 66.8% | 54.1% |
| Median | 69.3% | 55.9% |
| Interquartile 25% (IQ1) | 57.1% | 47.3% |
| Interquartile 75% (IQ3) | 74.7% | 62.4% |
| Interquartile Range (IQR) | 17.6% | 15.0% |
| Standard Deviation (Sample) | 17.8% | 14.9% |
| Standard Deviation (Population) | 17.6% | 14.7% |
Similar Demographics by College, Under 1 year
Demographics Similar to Lebanese by College, Under 1 year
In terms of college, under 1 year, the demographic groups most similar to Lebanese are Immigrants from Ukraine (67.5%, a difference of 0.010%), Pakistani (67.5%, a difference of 0.040%), Immigrants from Nepal (67.5%, a difference of 0.060%), Basque (67.6%, a difference of 0.14%), and Chilean (67.6%, a difference of 0.15%).
| Demographics | Rating | Rank | College, Under 1 year |
| Macedonians | 95.7 /100 | #112 | Exceptional 67.6% |
| Syrians | 95.6 /100 | #113 | Exceptional 67.6% |
| Chileans | 95.3 /100 | #114 | Exceptional 67.6% |
| Basques | 95.2 /100 | #115 | Exceptional 67.6% |
| Immigrants | Nepal | 94.9 /100 | #116 | Exceptional 67.5% |
| Pakistanis | 94.8 /100 | #117 | Exceptional 67.5% |
| Immigrants | Ukraine | 94.7 /100 | #118 | Exceptional 67.5% |
| Lebanese | 94.6 /100 | #119 | Exceptional 67.5% |
| Serbians | 93.9 /100 | #120 | Exceptional 67.4% |
| Slovenes | 93.3 /100 | #121 | Exceptional 67.3% |
| Immigrants | Jordan | 92.8 /100 | #122 | Exceptional 67.3% |
| Immigrants | Northern Africa | 92.7 /100 | #123 | Exceptional 67.2% |
| Arabs | 92.6 /100 | #124 | Exceptional 67.2% |
| Italians | 91.8 /100 | #125 | Exceptional 67.2% |
| Alsatians | 91.3 /100 | #126 | Exceptional 67.1% |
Demographics Similar to Cheyenne by College, Under 1 year
In terms of college, under 1 year, the demographic groups most similar to Cheyenne are U.S. Virgin Islander (60.6%, a difference of 0.020%), Immigrants from West Indies (60.6%, a difference of 0.11%), Jamaican (60.5%, a difference of 0.17%), Chickasaw (60.4%, a difference of 0.22%), and Alaska Native (60.4%, a difference of 0.22%).
| Demographics | Rating | Rank | College, Under 1 year |
| Shoshone | 0.2 /100 | #263 | Tragic 61.1% |
| Trinidadians and Tobagonians | 0.2 /100 | #264 | Tragic 61.1% |
| Immigrants | Bahamas | 0.2 /100 | #265 | Tragic 61.1% |
| Alaskan Athabascans | 0.2 /100 | #266 | Tragic 61.0% |
| Americans | 0.2 /100 | #267 | Tragic 61.0% |
| Immigrants | Trinidad and Tobago | 0.1 /100 | #268 | Tragic 60.7% |
| Immigrants | West Indies | 0.1 /100 | #269 | Tragic 60.6% |
| Cheyenne | 0.1 /100 | #270 | Tragic 60.6% |
| U.S. Virgin Islanders | 0.1 /100 | #271 | Tragic 60.6% |
| Jamaicans | 0.1 /100 | #272 | Tragic 60.5% |
| Chickasaw | 0.1 /100 | #273 | Tragic 60.4% |
| Alaska Natives | 0.1 /100 | #274 | Tragic 60.4% |
| Immigrants | Barbados | 0.1 /100 | #275 | Tragic 60.4% |
| Arapaho | 0.1 /100 | #276 | Tragic 60.3% |
| Bahamians | 0.1 /100 | #277 | Tragic 60.3% |