Lebanese vs Osage College, Under 1 year
COMPARE
Lebanese
Osage
College, Under 1 year
College, Under 1 year Comparison
Lebanese
Osage
67.5%
COLLEGE, UNDER 1 YEAR
94.6/ 100
METRIC RATING
119th/ 347
METRIC RANK
62.7%
COLLEGE, UNDER 1 YEAR
2.2/ 100
METRIC RATING
232nd/ 347
METRIC RANK
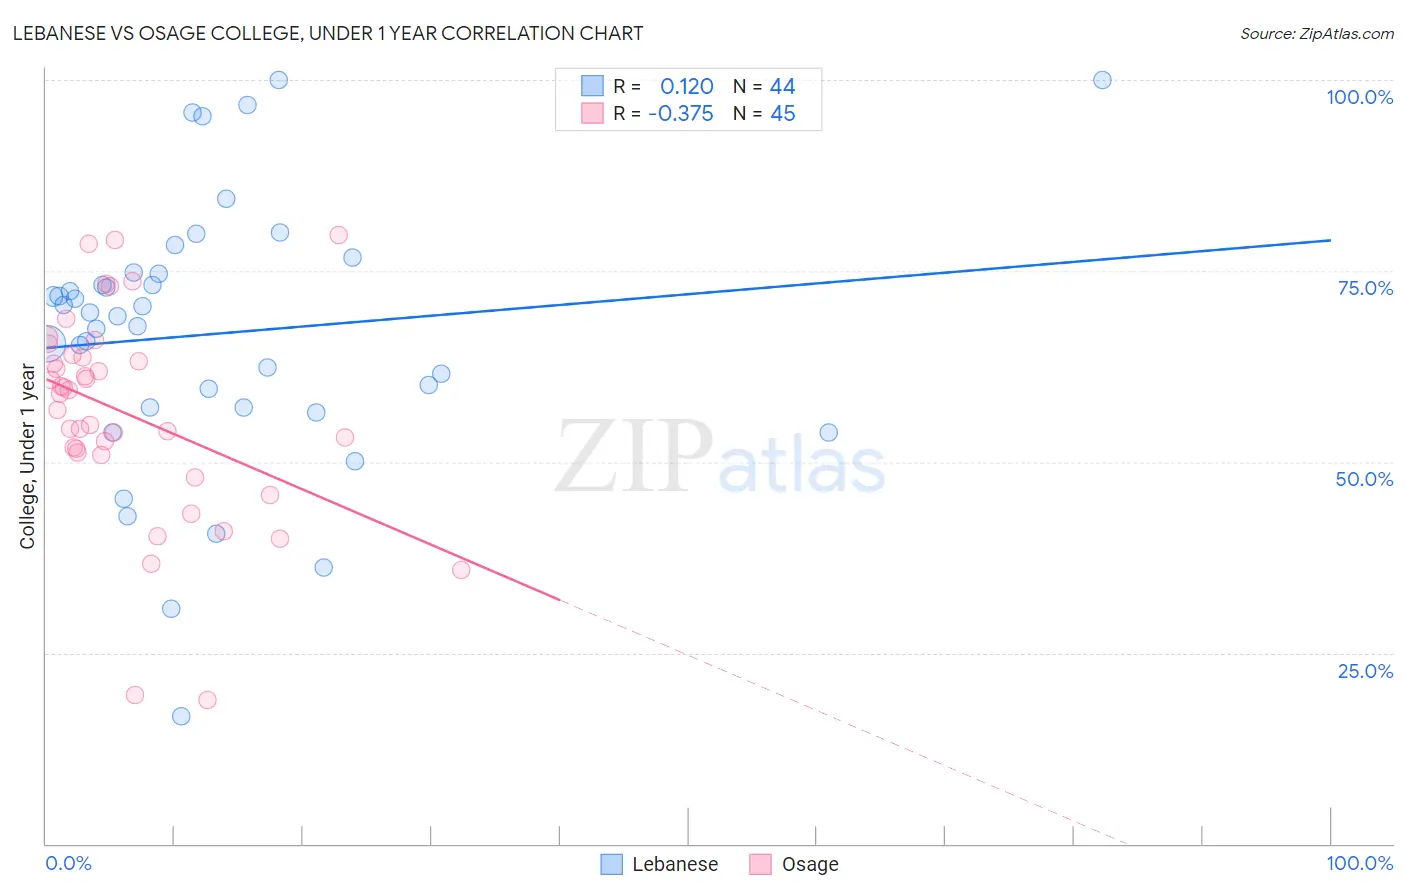
Lebanese vs Osage College, Under 1 year Correlation Chart
The statistical analysis conducted on geographies consisting of 401,622,274 people shows a poor positive correlation between the proportion of Lebanese and percentage of population with at least college, under 1 year education in the United States with a correlation coefficient (R) of 0.120 and weighted average of 67.5%. Similarly, the statistical analysis conducted on geographies consisting of 91,808,929 people shows a mild negative correlation between the proportion of Osage and percentage of population with at least college, under 1 year education in the United States with a correlation coefficient (R) of -0.375 and weighted average of 62.7%, a difference of 7.6%.
College, Under 1 year Correlation Summary
| Measurement | Lebanese | Osage |
| Minimum | 16.6% | 18.8% |
| Maximum | 100.0% | 79.7% |
| Range | 83.4% | 60.9% |
| Mean | 66.8% | 56.2% |
| Median | 69.3% | 58.9% |
| Interquartile 25% (IQ1) | 57.1% | 51.1% |
| Interquartile 75% (IQ3) | 74.7% | 63.8% |
| Interquartile Range (IQR) | 17.6% | 12.7% |
| Standard Deviation (Sample) | 17.8% | 13.5% |
| Standard Deviation (Population) | 17.6% | 13.4% |
Similar Demographics by College, Under 1 year
Demographics Similar to Lebanese by College, Under 1 year
In terms of college, under 1 year, the demographic groups most similar to Lebanese are Immigrants from Ukraine (67.5%, a difference of 0.010%), Pakistani (67.5%, a difference of 0.040%), Immigrants from Nepal (67.5%, a difference of 0.060%), Basque (67.6%, a difference of 0.14%), and Chilean (67.6%, a difference of 0.15%).
| Demographics | Rating | Rank | College, Under 1 year |
| Macedonians | 95.7 /100 | #112 | Exceptional 67.6% |
| Syrians | 95.6 /100 | #113 | Exceptional 67.6% |
| Chileans | 95.3 /100 | #114 | Exceptional 67.6% |
| Basques | 95.2 /100 | #115 | Exceptional 67.6% |
| Immigrants | Nepal | 94.9 /100 | #116 | Exceptional 67.5% |
| Pakistanis | 94.8 /100 | #117 | Exceptional 67.5% |
| Immigrants | Ukraine | 94.7 /100 | #118 | Exceptional 67.5% |
| Lebanese | 94.6 /100 | #119 | Exceptional 67.5% |
| Serbians | 93.9 /100 | #120 | Exceptional 67.4% |
| Slovenes | 93.3 /100 | #121 | Exceptional 67.3% |
| Immigrants | Jordan | 92.8 /100 | #122 | Exceptional 67.3% |
| Immigrants | Northern Africa | 92.7 /100 | #123 | Exceptional 67.2% |
| Arabs | 92.6 /100 | #124 | Exceptional 67.2% |
| Italians | 91.8 /100 | #125 | Exceptional 67.2% |
| Alsatians | 91.3 /100 | #126 | Exceptional 67.1% |
Demographics Similar to Osage by College, Under 1 year
In terms of college, under 1 year, the demographic groups most similar to Osage are Immigrants from Western Africa (62.8%, a difference of 0.11%), Iroquois (62.6%, a difference of 0.12%), Chippewa (62.6%, a difference of 0.15%), Spanish American (62.6%, a difference of 0.20%), and Immigrants (62.5%, a difference of 0.33%).
| Demographics | Rating | Rank | College, Under 1 year |
| Immigrants | Peru | 4.0 /100 | #225 | Tragic 63.1% |
| Immigrants | Colombia | 4.0 /100 | #226 | Tragic 63.1% |
| Immigrants | Ghana | 3.7 /100 | #227 | Tragic 63.1% |
| Samoans | 3.3 /100 | #228 | Tragic 63.0% |
| Liberians | 3.2 /100 | #229 | Tragic 63.0% |
| Immigrants | Nonimmigrants | 3.0 /100 | #230 | Tragic 62.9% |
| Immigrants | Western Africa | 2.4 /100 | #231 | Tragic 62.8% |
| Osage | 2.2 /100 | #232 | Tragic 62.7% |
| Iroquois | 2.0 /100 | #233 | Tragic 62.6% |
| Chippewa | 2.0 /100 | #234 | Tragic 62.6% |
| Spanish Americans | 1.9 /100 | #235 | Tragic 62.6% |
| Immigrants | Immigrants | 1.7 /100 | #236 | Tragic 62.5% |
| Immigrants | Burma/Myanmar | 1.6 /100 | #237 | Tragic 62.5% |
| French American Indians | 1.5 /100 | #238 | Tragic 62.4% |
| Nepalese | 1.1 /100 | #239 | Tragic 62.2% |