Cree vs Immigrants from South Africa College, Under 1 year
COMPARE
Cree
Immigrants from South Africa
College, Under 1 year
College, Under 1 year Comparison
Cree
Immigrants from South Africa
63.3%
COLLEGE, UNDER 1 YEAR
5.2/ 100
METRIC RATING
221st/ 347
METRIC RANK
70.6%
COLLEGE, UNDER 1 YEAR
99.9/ 100
METRIC RATING
33rd/ 347
METRIC RANK
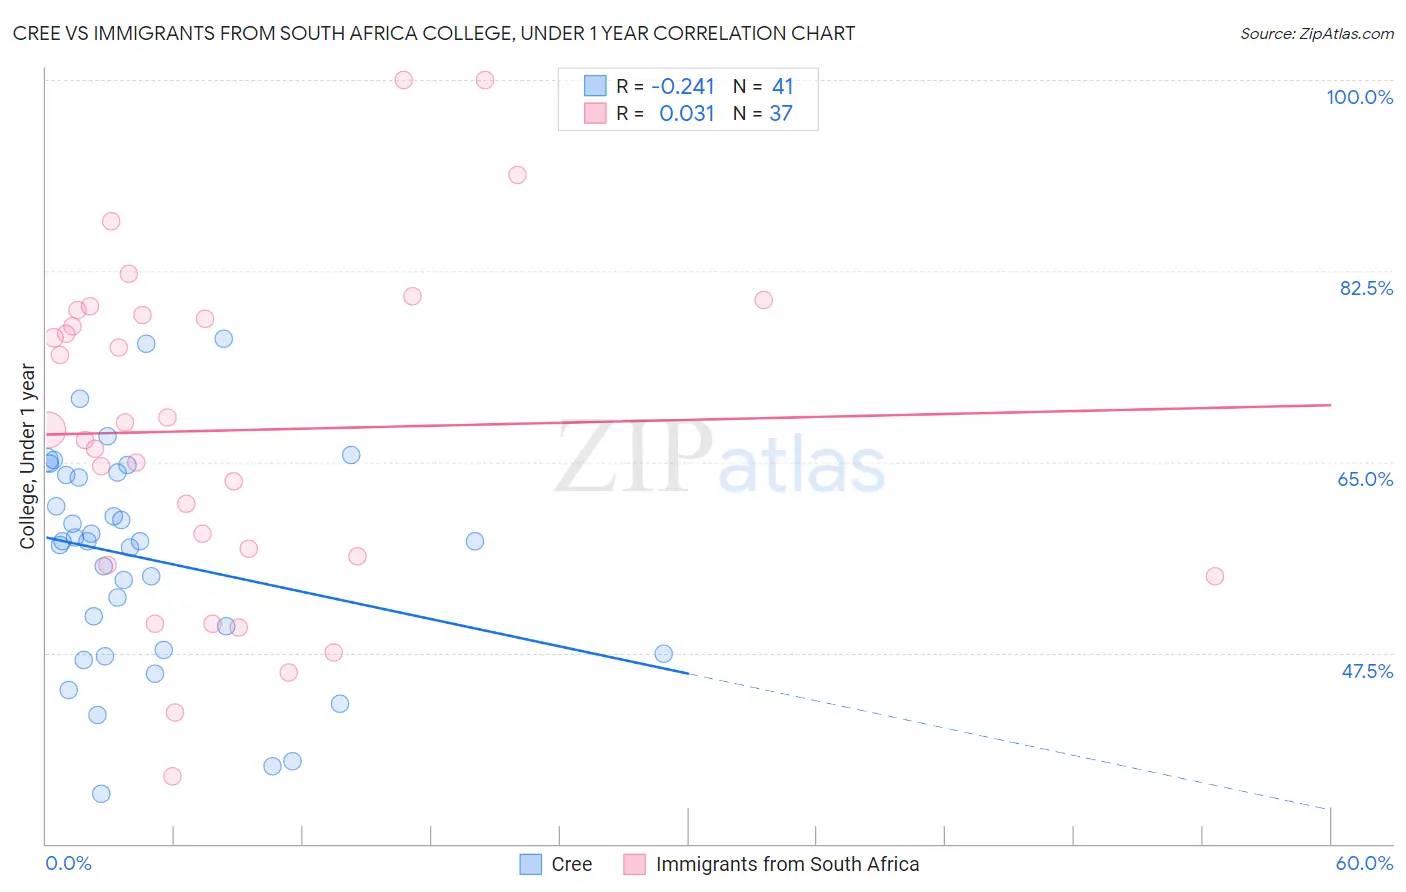
Cree vs Immigrants from South Africa College, Under 1 year Correlation Chart
The statistical analysis conducted on geographies consisting of 76,211,744 people shows a weak negative correlation between the proportion of Cree and percentage of population with at least college, under 1 year education in the United States with a correlation coefficient (R) of -0.241 and weighted average of 63.3%. Similarly, the statistical analysis conducted on geographies consisting of 233,321,300 people shows no correlation between the proportion of Immigrants from South Africa and percentage of population with at least college, under 1 year education in the United States with a correlation coefficient (R) of 0.031 and weighted average of 70.6%, a difference of 11.5%.
College, Under 1 year Correlation Summary
| Measurement | Cree | Immigrants from South Africa |
| Minimum | 34.5% | 36.2% |
| Maximum | 76.2% | 100.0% |
| Range | 41.7% | 63.8% |
| Mean | 56.1% | 67.9% |
| Median | 57.7% | 68.0% |
| Interquartile 25% (IQ1) | 47.5% | 56.0% |
| Interquartile 75% (IQ3) | 63.9% | 78.7% |
| Interquartile Range (IQR) | 16.4% | 22.8% |
| Standard Deviation (Sample) | 10.0% | 15.4% |
| Standard Deviation (Population) | 9.9% | 15.2% |
Similar Demographics by College, Under 1 year
Demographics Similar to Cree by College, Under 1 year
In terms of college, under 1 year, the demographic groups most similar to Cree are Immigrants from Senegal (63.3%, a difference of 0.050%), Portuguese (63.4%, a difference of 0.090%), Immigrants from Panama (63.4%, a difference of 0.11%), Immigrants from Fiji (63.4%, a difference of 0.11%), and Immigrants from Uruguay (63.4%, a difference of 0.14%).
| Demographics | Rating | Rank | College, Under 1 year |
| Immigrants | Nigeria | 8.8 /100 | #214 | Tragic 63.7% |
| Senegalese | 7.7 /100 | #215 | Tragic 63.6% |
| Hmong | 6.8 /100 | #216 | Tragic 63.5% |
| Immigrants | Uruguay | 5.8 /100 | #217 | Tragic 63.4% |
| Immigrants | Panama | 5.7 /100 | #218 | Tragic 63.4% |
| Immigrants | Fiji | 5.7 /100 | #219 | Tragic 63.4% |
| Portuguese | 5.6 /100 | #220 | Tragic 63.4% |
| Cree | 5.2 /100 | #221 | Tragic 63.3% |
| Immigrants | Senegal | 5.0 /100 | #222 | Tragic 63.3% |
| Immigrants | Costa Rica | 4.5 /100 | #223 | Tragic 63.2% |
| Sub-Saharan Africans | 4.4 /100 | #224 | Tragic 63.2% |
| Immigrants | Peru | 4.0 /100 | #225 | Tragic 63.1% |
| Immigrants | Colombia | 4.0 /100 | #226 | Tragic 63.1% |
| Immigrants | Ghana | 3.7 /100 | #227 | Tragic 63.1% |
| Samoans | 3.3 /100 | #228 | Tragic 63.0% |
Demographics Similar to Immigrants from South Africa by College, Under 1 year
In terms of college, under 1 year, the demographic groups most similar to Immigrants from South Africa are Estonian (70.6%, a difference of 0.020%), Russian (70.5%, a difference of 0.10%), Immigrants from Sri Lanka (70.5%, a difference of 0.16%), Turkish (70.7%, a difference of 0.17%), and Indian (Asian) (70.8%, a difference of 0.25%).
| Demographics | Rating | Rank | College, Under 1 year |
| Immigrants | Denmark | 100.0 /100 | #26 | Exceptional 71.0% |
| Immigrants | Ireland | 100.0 /100 | #27 | Exceptional 71.0% |
| Immigrants | Hong Kong | 100.0 /100 | #28 | Exceptional 71.0% |
| Immigrants | France | 100.0 /100 | #29 | Exceptional 71.0% |
| Immigrants | China | 99.9 /100 | #30 | Exceptional 70.9% |
| Indians (Asian) | 99.9 /100 | #31 | Exceptional 70.8% |
| Turks | 99.9 /100 | #32 | Exceptional 70.7% |
| Immigrants | South Africa | 99.9 /100 | #33 | Exceptional 70.6% |
| Estonians | 99.9 /100 | #34 | Exceptional 70.6% |
| Russians | 99.9 /100 | #35 | Exceptional 70.5% |
| Immigrants | Sri Lanka | 99.9 /100 | #36 | Exceptional 70.5% |
| Immigrants | Saudi Arabia | 99.9 /100 | #37 | Exceptional 70.4% |
| Australians | 99.9 /100 | #38 | Exceptional 70.4% |
| Bhutanese | 99.9 /100 | #39 | Exceptional 70.3% |
| Immigrants | Turkey | 99.9 /100 | #40 | Exceptional 70.3% |