Devine, TX Map & Demographics
Devine Map
Devine Overview
$30,619
PER CAPITA INCOME
$58,411
AVG FAMILY INCOME
$45,616
AVG HOUSEHOLD INCOME
21.3%
WAGE / INCOME GAP [ % ]
78.7¢/ $1
WAGE / INCOME GAP [ $ ]
0.59
INEQUALITY / GINI INDEX
4,375
TOTAL POPULATION
2,067
MALE POPULATION
2,308
FEMALE POPULATION
89.56
MALES / 100 FEMALES
111.66
FEMALES / 100 MALES
45.0
MEDIAN AGE
3.0
AVG FAMILY SIZE
2.4
AVG HOUSEHOLD SIZE
1,932
LABOR FORCE [ PEOPLE ]
57.4%
PERCENT IN LABOR FORCE
Devine Zip Codes
Devine Area Codes
Income in Devine
Income Overview in Devine
Per Capita Income in Devine is $30,619, while median incomes of families and households are $58,411 and $45,616 respectively.
| Characteristic | Number | Measure |
| Per Capita Income | 4,375 | $30,619 |
| Median Family Income | 1,221 | $58,411 |
| Mean Family Income | 1,221 | $99,552 |
| Median Household Income | 1,774 | $45,616 |
| Mean Household Income | 1,774 | $73,250 |
| Income Deficit | 1,221 | $0 |
| Wage / Income Gap (%) | 4,375 | 21.27% |
| Wage / Income Gap ($) | 4,375 | 78.73¢ per $1 |
| Gini / Inequality Index | 4,375 | 0.59 |
Earnings by Sex in Devine
Average Earnings in Devine are $36,095, $45,330 for men and $35,687 for women, a difference of 21.3%.
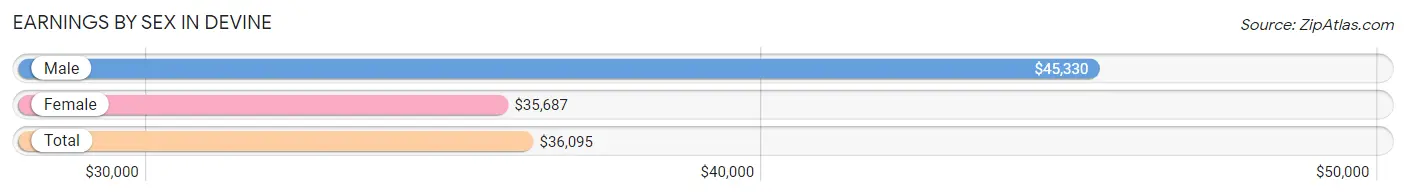
| Sex | Number | Average Earnings |
| Male | 956 (48.4%) | $45,330 |
| Female | 1,017 (51.5%) | $35,687 |
| Total | 1,973 (100.0%) | $36,095 |
Earnings by Sex by Income Bracket in Devine
The most common earnings brackets in Devine are $100,000+ for men (154 | 16.1%) and $35,000 to $39,999 for women (242 | 23.8%).
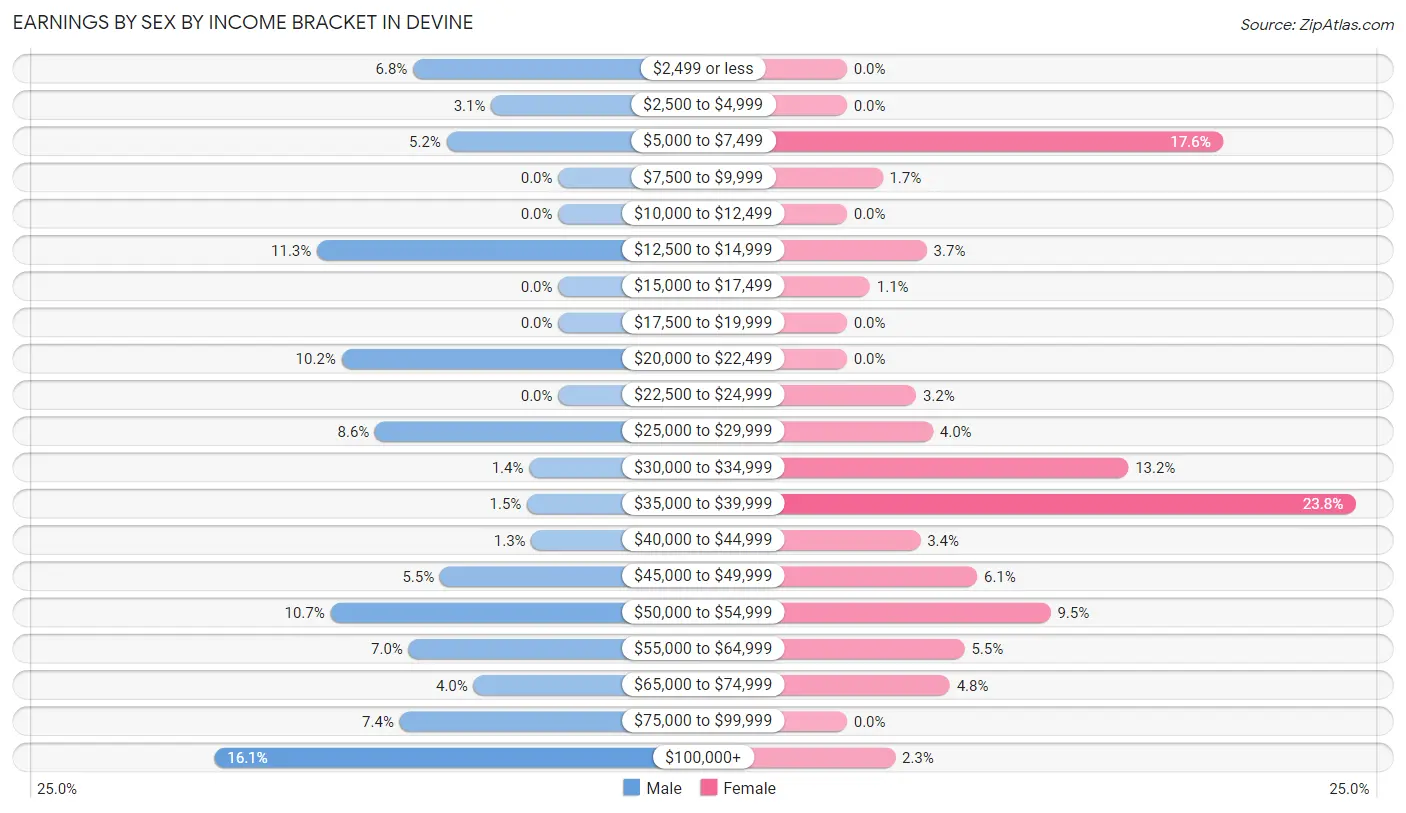
| Income | Male | Female |
| $2,499 or less | 65 (6.8%) | 0 (0.0%) |
| $2,500 to $4,999 | 30 (3.1%) | 0 (0.0%) |
| $5,000 to $7,499 | 50 (5.2%) | 179 (17.6%) |
| $7,500 to $9,999 | 0 (0.0%) | 17 (1.7%) |
| $10,000 to $12,499 | 0 (0.0%) | 0 (0.0%) |
| $12,500 to $14,999 | 108 (11.3%) | 38 (3.7%) |
| $15,000 to $17,499 | 0 (0.0%) | 11 (1.1%) |
| $17,500 to $19,999 | 0 (0.0%) | 0 (0.0%) |
| $20,000 to $22,499 | 97 (10.2%) | 0 (0.0%) |
| $22,500 to $24,999 | 0 (0.0%) | 33 (3.2%) |
| $25,000 to $29,999 | 82 (8.6%) | 41 (4.0%) |
| $30,000 to $34,999 | 13 (1.4%) | 134 (13.2%) |
| $35,000 to $39,999 | 14 (1.5%) | 242 (23.8%) |
| $40,000 to $44,999 | 12 (1.3%) | 35 (3.4%) |
| $45,000 to $49,999 | 53 (5.5%) | 62 (6.1%) |
| $50,000 to $54,999 | 102 (10.7%) | 97 (9.5%) |
| $55,000 to $64,999 | 67 (7.0%) | 56 (5.5%) |
| $65,000 to $74,999 | 38 (4.0%) | 49 (4.8%) |
| $75,000 to $99,999 | 71 (7.4%) | 0 (0.0%) |
| $100,000+ | 154 (16.1%) | 23 (2.3%) |
| Total | 956 (100.0%) | 1,017 (100.0%) |
Earnings by Sex by Educational Attainment in Devine
Average earnings in Devine are $50,873 for men and $36,071 for women, a difference of 29.1%. Men with an educational attainment of bachelor's degree enjoy the highest average annual earnings of $78,257, while those with college or associate's degree education earn the least with $45,330. Women with an educational attainment of bachelor's degree earn the most with the average annual earnings of $65,192, while those with high school diploma education have the smallest earnings of $35,227.
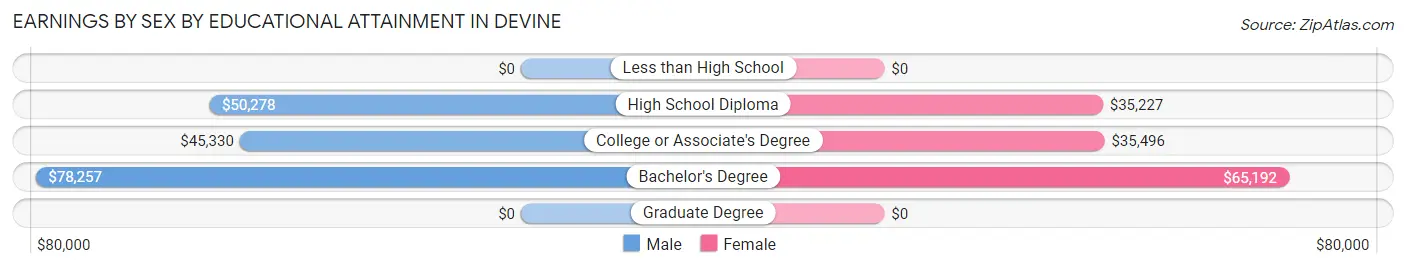
| Educational Attainment | Male Income | Female Income |
| Less than High School | - | - |
| High School Diploma | $50,278 | $35,227 |
| College or Associate's Degree | $45,330 | $35,496 |
| Bachelor's Degree | $78,257 | $65,192 |
| Graduate Degree | - | - |
| Total | $50,873 | $36,071 |
Family Income in Devine
Family Income Brackets in Devine
According to the Devine family income data, there are 295 families falling into the $100,000 to $149,999 income range, which is the most common income bracket and makes up 24.2% of all families.
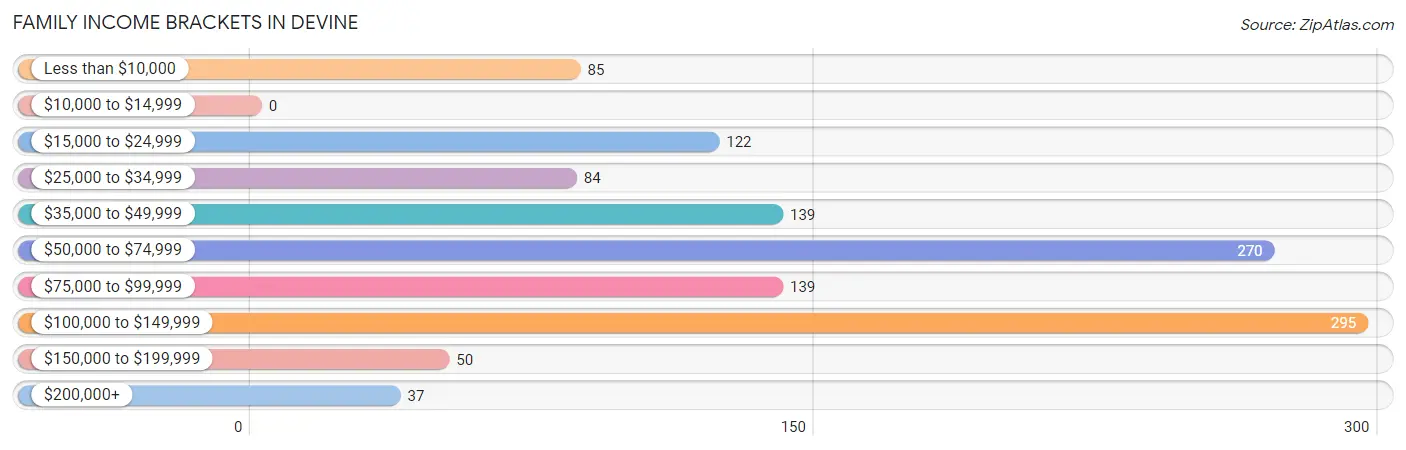
| Income Bracket | # Families | % Families |
| Less than $10,000 | 85 | 7.0% |
| $10,000 to $14,999 | 0 | 0.0% |
| $15,000 to $24,999 | 122 | 10.0% |
| $25,000 to $34,999 | 84 | 6.9% |
| $35,000 to $49,999 | 139 | 11.4% |
| $50,000 to $74,999 | 270 | 22.1% |
| $75,000 to $99,999 | 139 | 11.4% |
| $100,000 to $149,999 | 295 | 24.2% |
| $150,000 to $199,999 | 50 | 4.1% |
| $200,000+ | 37 | 3.0% |
Family Income by Famaliy Size in Devine
5-person families (58 | 4.8%) account for the highest median family income in Devine with $144,524 per family, while 4-person families (112 | 9.2%) have the highest median income of $29,554 per family member.
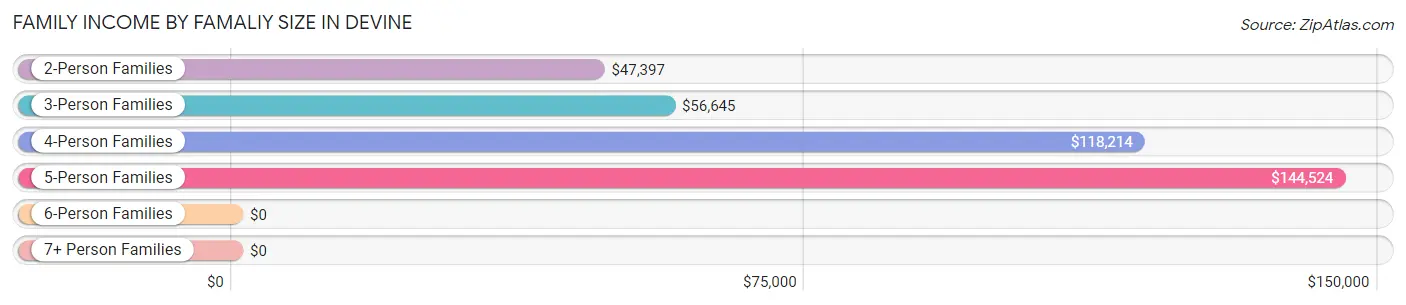
| Income Bracket | # Families | Median Income |
| 2-Person Families | 550 (45.1%) | $47,397 |
| 3-Person Families | 491 (40.2%) | $56,645 |
| 4-Person Families | 112 (9.2%) | $118,214 |
| 5-Person Families | 58 (4.8%) | $144,524 |
| 6-Person Families | 10 (0.8%) | $0 |
| 7+ Person Families | 0 (0.0%) | $0 |
| Total | 1,221 (100.0%) | $58,411 |
Family Income by Number of Earners in Devine
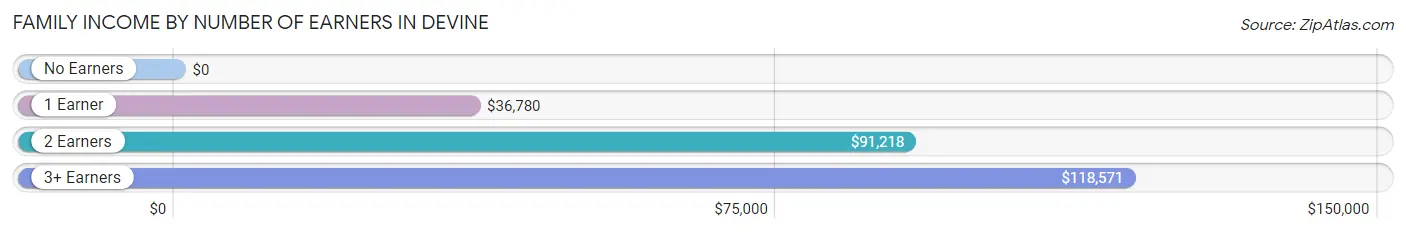
| Number of Earners | # Families | Median Income |
| No Earners | 217 (17.8%) | $0 |
| 1 Earner | 342 (28.0%) | $36,780 |
| 2 Earners | 528 (43.2%) | $91,218 |
| 3+ Earners | 134 (11.0%) | $118,571 |
| Total | 1,221 (100.0%) | $58,411 |
Household Income in Devine
Household Income Brackets in Devine
With 310 households falling in the category, the $50,000 to $74,999 income range is the most frequent in Devine, accounting for 17.5% of all households. In contrast, only 37 households (2.1%) fall into the $200,000+ income bracket, making it the least populous group.
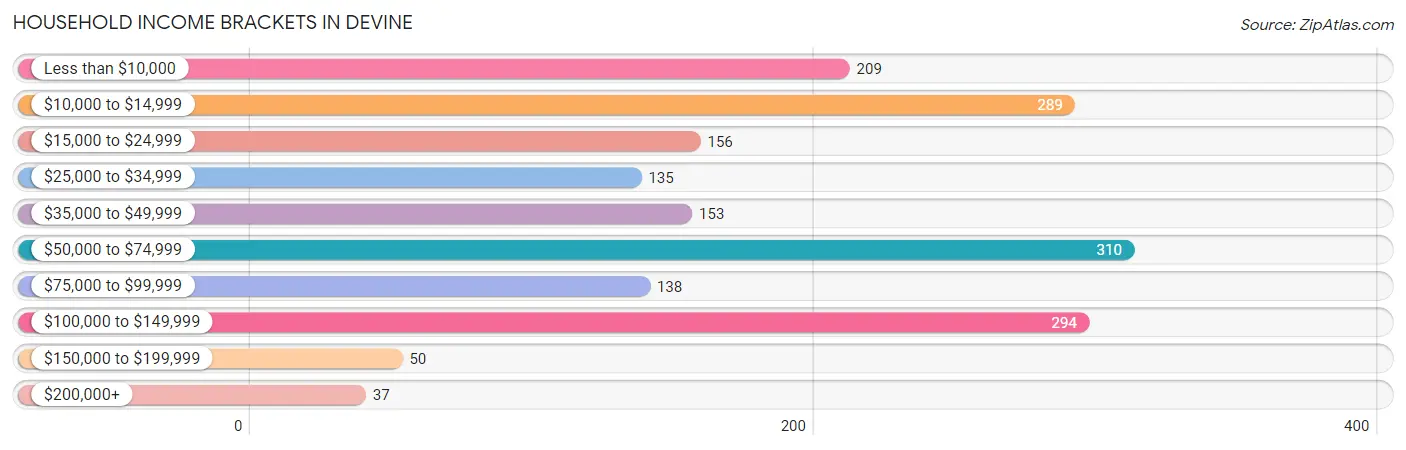
| Income Bracket | # Households | % Households |
| Less than $10,000 | 209 | 11.8% |
| $10,000 to $14,999 | 289 | 16.3% |
| $15,000 to $24,999 | 156 | 8.8% |
| $25,000 to $34,999 | 135 | 7.6% |
| $35,000 to $49,999 | 153 | 8.6% |
| $50,000 to $74,999 | 310 | 17.5% |
| $75,000 to $99,999 | 138 | 7.8% |
| $100,000 to $149,999 | 294 | 16.6% |
| $150,000 to $199,999 | 50 | 2.8% |
| $200,000+ | 37 | 2.1% |
Household Income by Householder Age in Devine
The median household income in Devine is $45,616, with the highest median household income of $74,786 found in the 45 to 64 years age bracket for the primary householder. A total of 684 households (38.6%) fall into this category. Meanwhile, the 15 to 24 years age bracket for the primary householder has the lowest median household income of $0, with 48 households (2.7%) in this group.
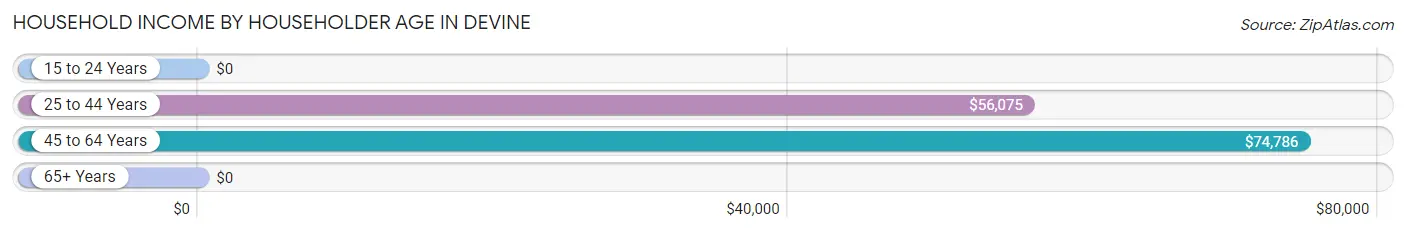
| Income Bracket | # Households | Median Income |
| 15 to 24 Years | 48 (2.7%) | $0 |
| 25 to 44 Years | 471 (26.6%) | $56,075 |
| 45 to 64 Years | 684 (38.6%) | $74,786 |
| 65+ Years | 571 (32.2%) | $0 |
| Total | 1,774 (100.0%) | $45,616 |
Poverty in Devine
Income Below Poverty by Sex and Age in Devine
With 18.0% poverty level for males and 16.9% for females among the residents of Devine, under 5 year old males and 75 year old and over females are the most vulnerable to poverty, with 103 males (83.1%) and 145 females (72.9%) in their respective age groups living below the poverty level.
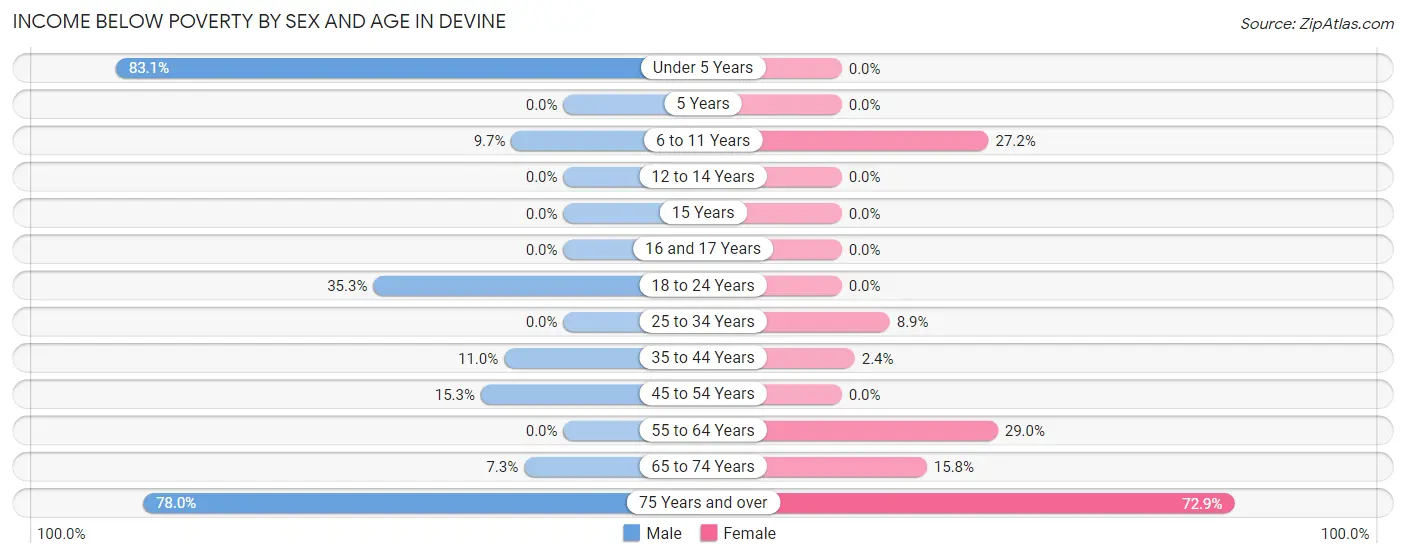
| Age Bracket | Male | Female |
| Under 5 Years | 103 (83.1%) | 0 (0.0%) |
| 5 Years | 0 (0.0%) | 0 (0.0%) |
| 6 to 11 Years | 20 (9.7%) | 76 (27.2%) |
| 12 to 14 Years | 0 (0.0%) | 0 (0.0%) |
| 15 Years | 0 (0.0%) | 0 (0.0%) |
| 16 and 17 Years | 0 (0.0%) | 0 (0.0%) |
| 18 to 24 Years | 48 (35.3%) | 0 (0.0%) |
| 25 to 34 Years | 0 (0.0%) | 23 (8.9%) |
| 35 to 44 Years | 11 (11.0%) | 7 (2.4%) |
| 45 to 54 Years | 65 (15.3%) | 0 (0.0%) |
| 55 to 64 Years | 0 (0.0%) | 99 (28.9%) |
| 65 to 74 Years | 13 (7.3%) | 30 (15.8%) |
| 75 Years and over | 103 (78.0%) | 145 (72.9%) |
| Total | 363 (18.0%) | 380 (16.9%) |
Income Above Poverty by Sex and Age in Devine
According to the poverty statistics in Devine, males aged 5 years and females aged under 5 years are the age groups that are most secure financially, with 100.0% of males and 100.0% of females in these age groups living above the poverty line.
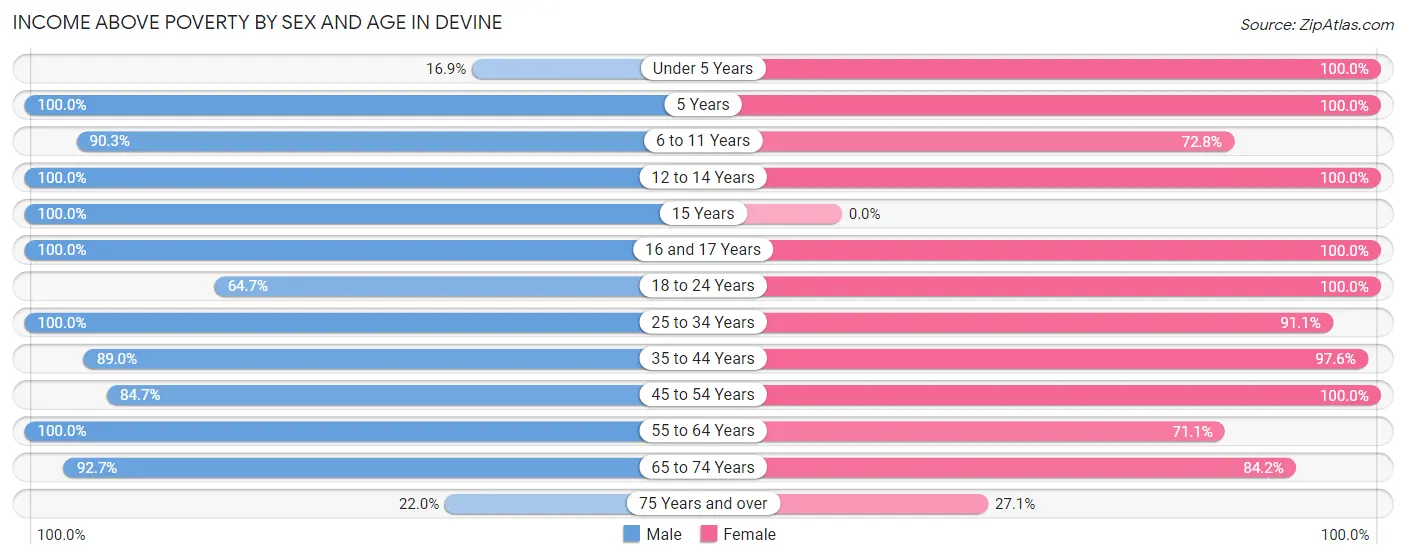
| Age Bracket | Male | Female |
| Under 5 Years | 21 (16.9%) | 100 (100.0%) |
| 5 Years | 57 (100.0%) | 21 (100.0%) |
| 6 to 11 Years | 187 (90.3%) | 203 (72.8%) |
| 12 to 14 Years | 85 (100.0%) | 89 (100.0%) |
| 15 Years | 48 (100.0%) | 0 (0.0%) |
| 16 and 17 Years | 96 (100.0%) | 82 (100.0%) |
| 18 to 24 Years | 88 (64.7%) | 62 (100.0%) |
| 25 to 34 Years | 146 (100.0%) | 235 (91.1%) |
| 35 to 44 Years | 89 (89.0%) | 283 (97.6%) |
| 45 to 54 Years | 359 (84.7%) | 335 (100.0%) |
| 55 to 64 Years | 284 (100.0%) | 243 (71.1%) |
| 65 to 74 Years | 165 (92.7%) | 160 (84.2%) |
| 75 Years and over | 29 (22.0%) | 54 (27.1%) |
| Total | 1,654 (82.0%) | 1,867 (83.1%) |
Income Below Poverty Among Married-Couple Families in Devine
The poverty statistics for married-couple families in Devine show that 2.2% or 20 of the total 927 families live below the poverty line. Families with 3 or 4 children have the highest poverty rate of 25.0%, comprising of 7 families. On the other hand, families with 1 or 2 children have the lowest poverty rate of 0.0%, which includes 0 families.
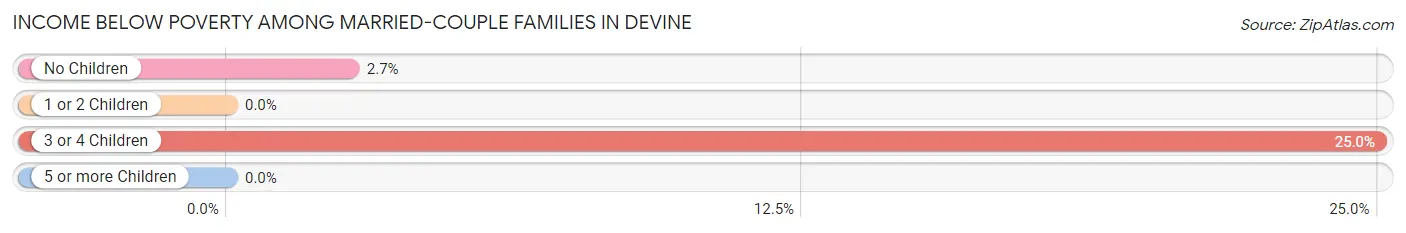
| Children | Above Poverty | Below Poverty |
| No Children | 478 (97.4%) | 13 (2.6%) |
| 1 or 2 Children | 408 (100.0%) | 0 (0.0%) |
| 3 or 4 Children | 21 (75.0%) | 7 (25.0%) |
| 5 or more Children | 0 (0.0%) | 0 (0.0%) |
| Total | 907 (97.8%) | 20 (2.2%) |
Income Below Poverty Among Single-Parent Households in Devine
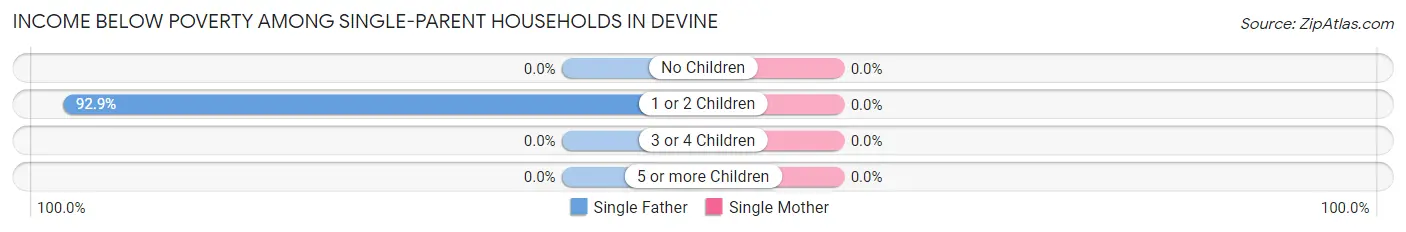
| Children | Single Father | Single Mother |
| No Children | 0 (0.0%) | 0 (0.0%) |
| 1 or 2 Children | 65 (92.9%) | 0 (0.0%) |
| 3 or 4 Children | 0 (0.0%) | 0 (0.0%) |
| 5 or more Children | 0 (0.0%) | 0 (0.0%) |
| Total | 65 (92.9%) | 0 (0.0%) |
Income Below Poverty Among Married-Couple vs Single-Parent Households in Devine
The poverty data for Devine shows that 20 of the married-couple family households (2.2%) and 65 of the single-parent households (22.1%) are living below the poverty level. Within the married-couple family households, those with 3 or 4 children have the highest poverty rate, with 7 households (25.0%) falling below the poverty line. Among the single-parent households, those with 1 or 2 children have the highest poverty rate, with 65 household (31.6%) living below poverty.
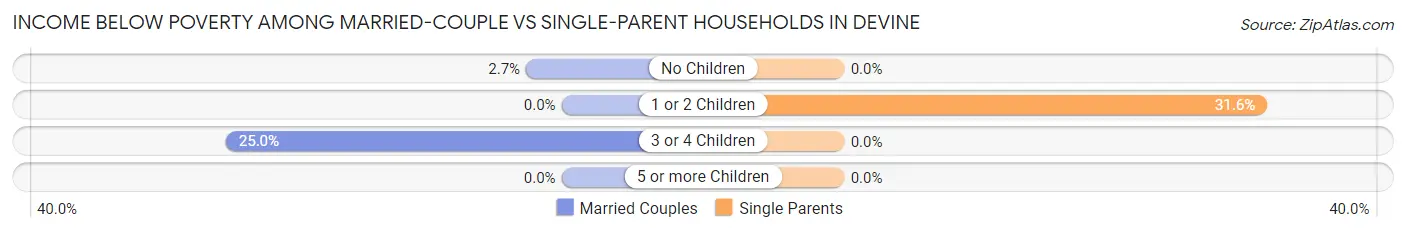
| Children | Married-Couple Families | Single-Parent Households |
| No Children | 13 (2.6%) | 0 (0.0%) |
| 1 or 2 Children | 0 (0.0%) | 65 (31.6%) |
| 3 or 4 Children | 7 (25.0%) | 0 (0.0%) |
| 5 or more Children | 0 (0.0%) | 0 (0.0%) |
| Total | 20 (2.2%) | 65 (22.1%) |
Race in Devine
The most populous races in Devine are Hispanic or Latino (2,669 | 61.0%), White / Caucasian (2,473 | 56.5%), and Two or more Races (1,078 | 24.6%).
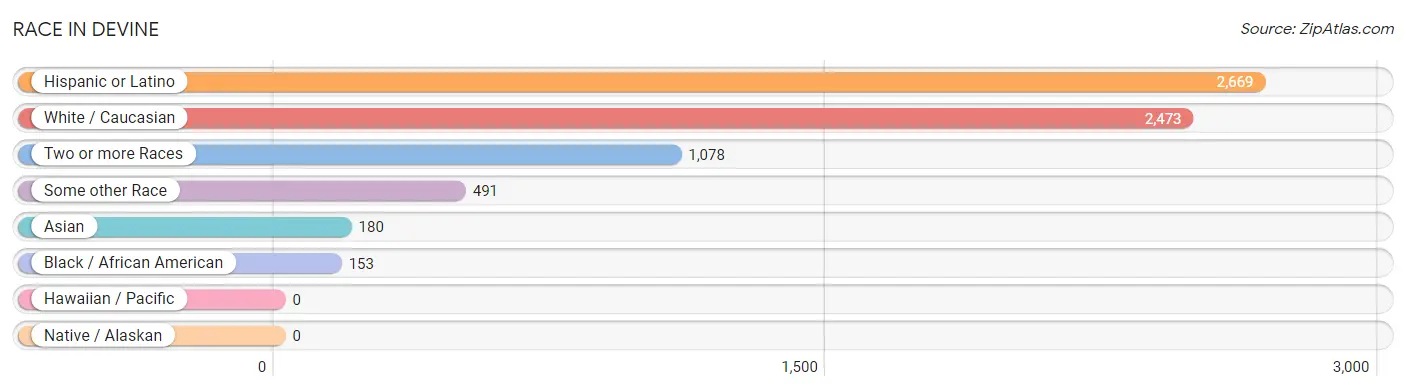
| Race | # Population | % Population |
| Asian | 180 | 4.1% |
| Black / African American | 153 | 3.5% |
| Hawaiian / Pacific | 0 | 0.0% |
| Hispanic or Latino | 2,669 | 61.0% |
| Native / Alaskan | 0 | 0.0% |
| White / Caucasian | 2,473 | 56.5% |
| Two or more Races | 1,078 | 24.6% |
| Some other Race | 491 | 11.2% |
| Total | 4,375 | 100.0% |
Ancestry in Devine
The most populous ancestries reported in Devine are Mexican (2,478 | 56.6%), German (329 | 7.5%), Norwegian (202 | 4.6%), Irish (190 | 4.3%), and Korean (180 | 4.1%), together accounting for 77.2% of all Devine residents.
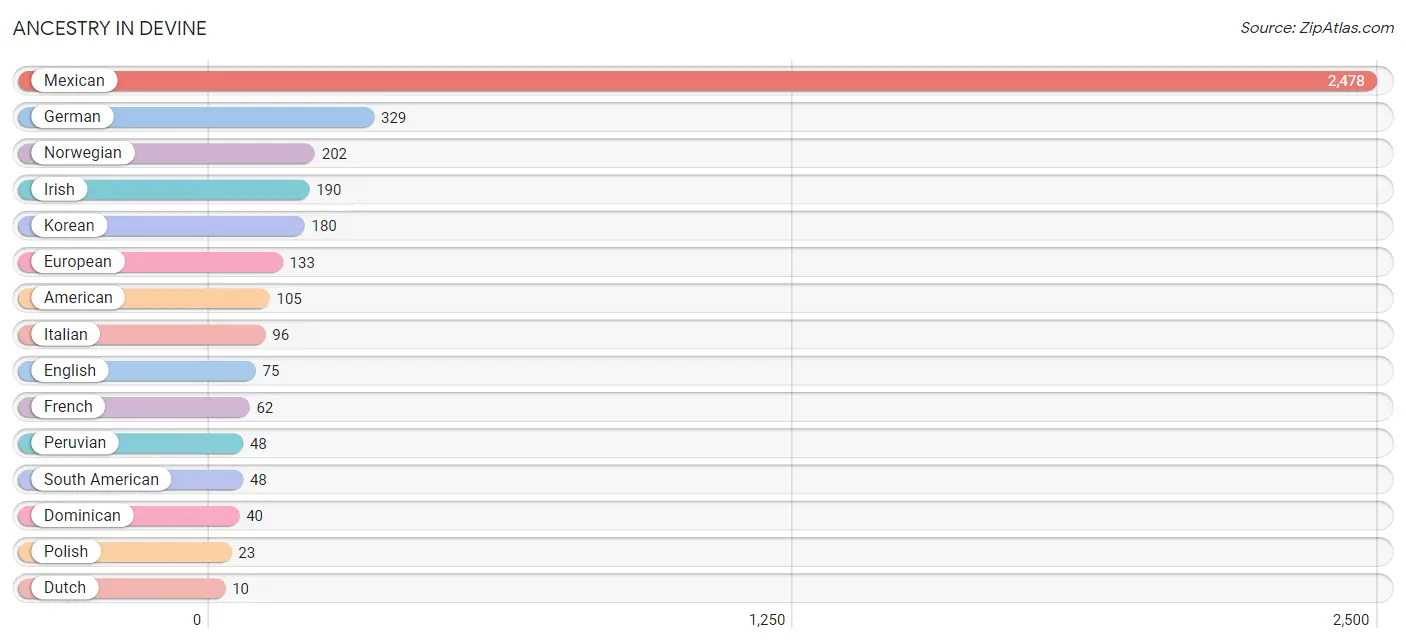
| Ancestry | # Population | % Population |
| American | 105 | 2.4% |
| Dominican | 40 | 0.9% |
| Dutch | 10 | 0.2% |
| English | 75 | 1.7% |
| European | 133 | 3.0% |
| French | 62 | 1.4% |
| German | 329 | 7.5% |
| Irish | 190 | 4.3% |
| Italian | 96 | 2.2% |
| Korean | 180 | 4.1% |
| Mexican | 2,478 | 56.6% |
| Norwegian | 202 | 4.6% |
| Peruvian | 48 | 1.1% |
| Polish | 23 | 0.5% |
| South American | 48 | 1.1% | View All 15 Rows |
Immigrants in Devine
The most numerous immigrant groups reported in Devine came from Latin America (182 | 4.2%), Central America (142 | 3.3%), Mexico (142 | 3.3%), Asia (66 | 1.5%), and Philippines (66 | 1.5%), together accounting for 13.7% of all Devine residents.
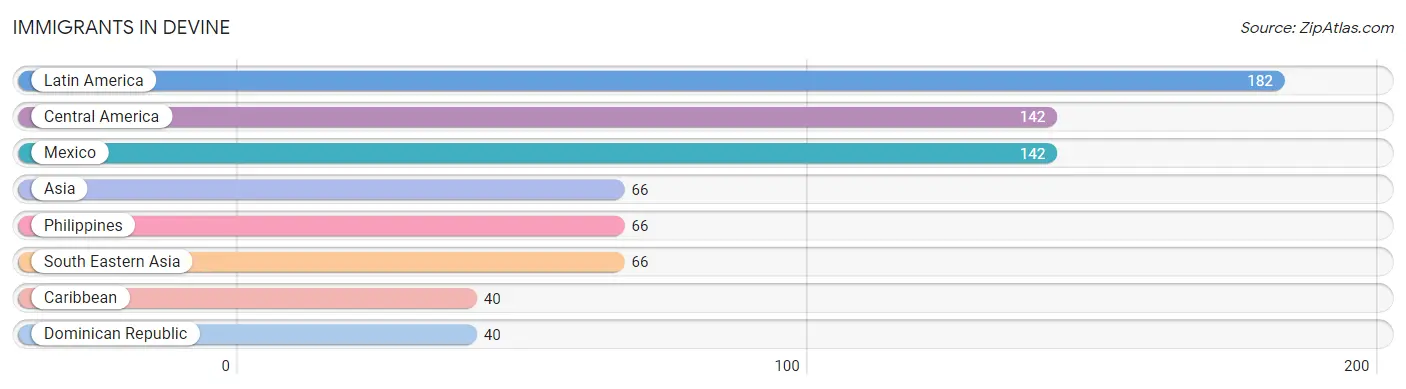
| Immigration Origin | # Population | % Population |
| Asia | 66 | 1.5% |
| Caribbean | 40 | 0.9% |
| Central America | 142 | 3.3% |
| Dominican Republic | 40 | 0.9% |
| Latin America | 182 | 4.2% |
| Mexico | 142 | 3.3% |
| Philippines | 66 | 1.5% |
| South Eastern Asia | 66 | 1.5% | View All 8 Rows |
Sex and Age in Devine
Sex and Age in Devine
The most populous age groups in Devine are 45 to 49 Years (314 | 15.2%) for men and 60 to 64 Years (340 | 14.7%) for women.
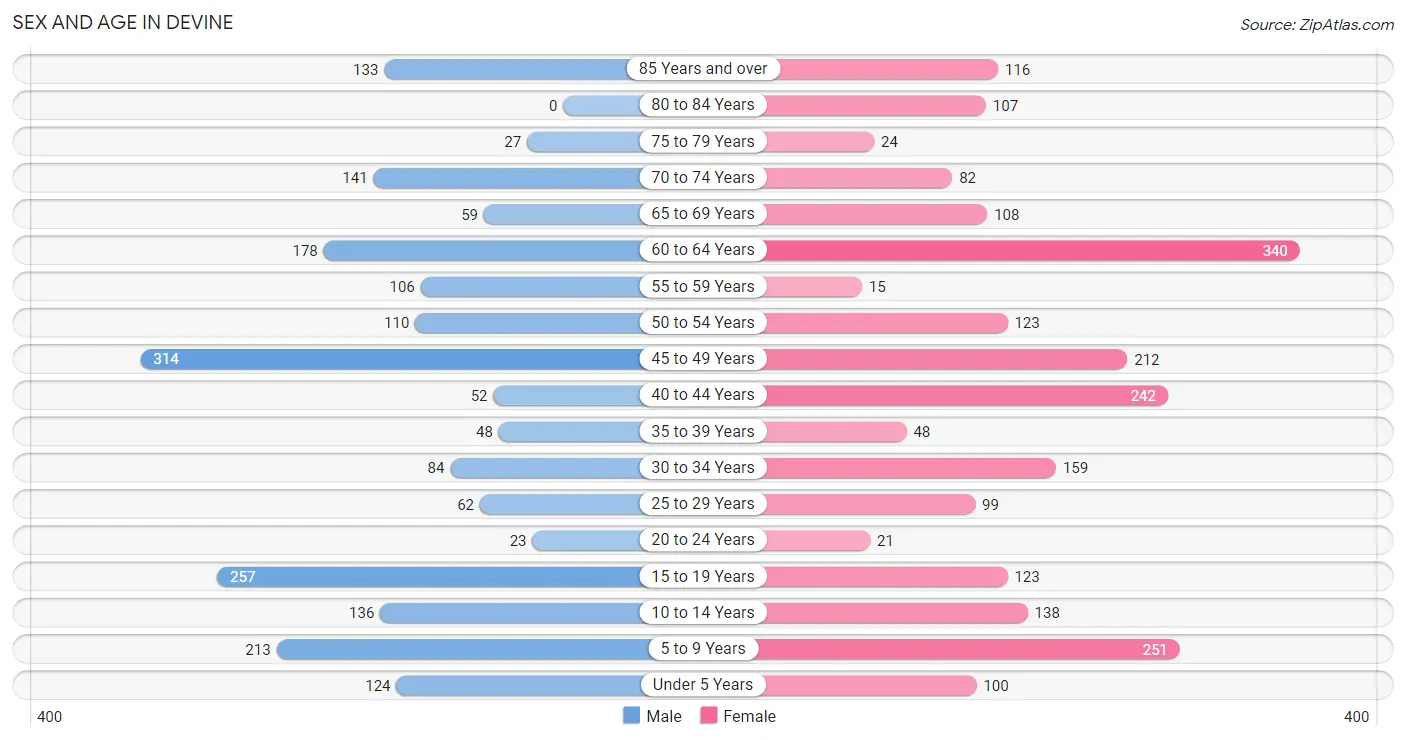
| Age Bracket | Male | Female |
| Under 5 Years | 124 (6.0%) | 100 (4.3%) |
| 5 to 9 Years | 213 (10.3%) | 251 (10.9%) |
| 10 to 14 Years | 136 (6.6%) | 138 (6.0%) |
| 15 to 19 Years | 257 (12.4%) | 123 (5.3%) |
| 20 to 24 Years | 23 (1.1%) | 21 (0.9%) |
| 25 to 29 Years | 62 (3.0%) | 99 (4.3%) |
| 30 to 34 Years | 84 (4.1%) | 159 (6.9%) |
| 35 to 39 Years | 48 (2.3%) | 48 (2.1%) |
| 40 to 44 Years | 52 (2.5%) | 242 (10.5%) |
| 45 to 49 Years | 314 (15.2%) | 212 (9.2%) |
| 50 to 54 Years | 110 (5.3%) | 123 (5.3%) |
| 55 to 59 Years | 106 (5.1%) | 15 (0.6%) |
| 60 to 64 Years | 178 (8.6%) | 340 (14.7%) |
| 65 to 69 Years | 59 (2.9%) | 108 (4.7%) |
| 70 to 74 Years | 141 (6.8%) | 82 (3.5%) |
| 75 to 79 Years | 27 (1.3%) | 24 (1.0%) |
| 80 to 84 Years | 0 (0.0%) | 107 (4.6%) |
| 85 Years and over | 133 (6.4%) | 116 (5.0%) |
| Total | 2,067 (100.0%) | 2,308 (100.0%) |
Families and Households in Devine
Median Family Size in Devine
The median family size in Devine is 3.02 persons per family, with single male/father families (70 | 5.7%) accounting for the largest median family size of 5.89 persons per family. On the other hand, married-couple families (927 | 75.9%) represent the smallest median family size with 2.84 persons per family.
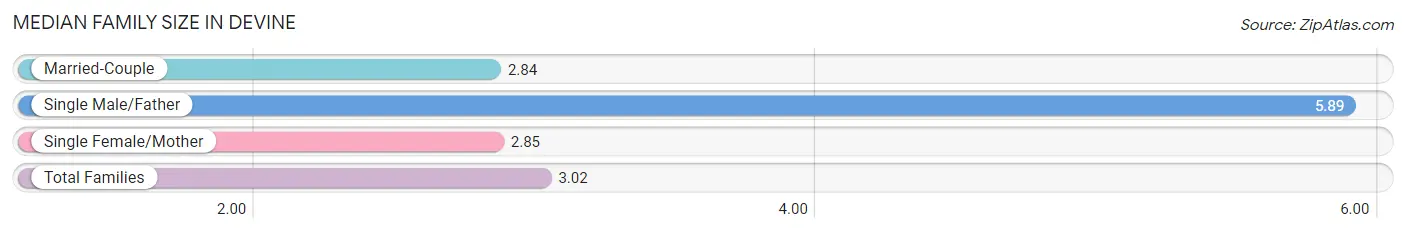
| Family Type | # Families | Family Size |
| Married-Couple | 927 (75.9%) | 2.84 |
| Single Male/Father | 70 (5.7%) | 5.89 |
| Single Female/Mother | 224 (18.3%) | 2.85 |
| Total Families | 1,221 (100.0%) | 3.02 |
Median Household Size in Devine
The median household size in Devine is 2.40 persons per household, with single male/father households (70 | 4.0%) accounting for the largest median household size of 5.89 persons per household. non-family households (553 | 31.2%) represent the smallest median household size with 1.04 persons per household.
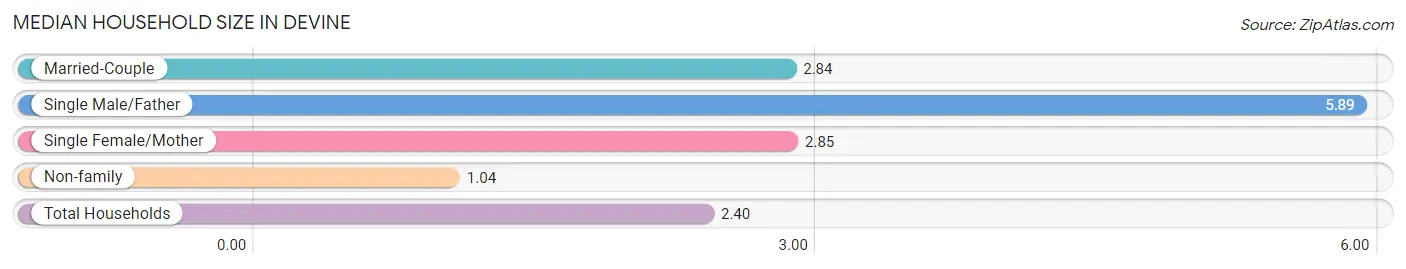
| Household Type | # Households | Household Size |
| Married-Couple | 927 (52.2%) | 2.84 |
| Single Male/Father | 70 (4.0%) | 5.89 |
| Single Female/Mother | 224 (12.6%) | 2.85 |
| Non-family | 553 (31.2%) | 1.04 |
| Total Households | 1,774 (100.0%) | 2.40 |
Household Size by Marriage Status in Devine
Out of a total of 1,774 households in Devine, 1,221 (68.8%) are family households, while 553 (31.2%) are nonfamily households. The most numerous type of family households are 2-person households, comprising 550, and the most common type of nonfamily households are 1-person households, comprising 526.
| Household Size | Family Households | Nonfamily Households |
| 1-Person Households | - | 526 (29.6%) |
| 2-Person Households | 550 (31.0%) | 27 (1.5%) |
| 3-Person Households | 491 (27.7%) | 0 (0.0%) |
| 4-Person Households | 112 (6.3%) | 0 (0.0%) |
| 5-Person Households | 58 (3.3%) | 0 (0.0%) |
| 6-Person Households | 10 (0.6%) | 0 (0.0%) |
| 7+ Person Households | 0 (0.0%) | 0 (0.0%) |
| Total | 1,221 (68.8%) | 553 (31.2%) |
Female Fertility in Devine
Fertility by Age in Devine
Average fertility rate in Devine is 217.0 births per 1,000 women. Women in the age bracket of 15 to 19 years have the highest fertility rate with 488.0 births per 1,000 women. Women in the age bracket of 20 to 34 years acount for 69.4% of all women with births.
| Age Bracket | Women with Births | Births / 1,000 Women |
| 15 to 19 years | 60 (30.6%) | 488.0 |
| 20 to 34 years | 136 (69.4%) | 487.0 |
| 35 to 50 years | 0 (0.0%) | 0.0 |
| Total | 196 (100.0%) | 217.0 |
Fertility by Age by Marriage Status in Devine
69.4% of women with births (196) in Devine are married. The highest percentage of unmarried women with births falls into 15 to 19 years age bracket with 100.0% of them unmarried at the time of birth, while the lowest percentage of unmarried women with births belong to 20 to 34 years age bracket with 0.0% of them unmarried.
| Age Bracket | Married | Unmarried |
| 15 to 19 years | 0 (0.0%) | 60 (100.0%) |
| 20 to 34 years | 136 (100.0%) | 0 (0.0%) |
| 35 to 50 years | 0 (0.0%) | 0 (0.0%) |
| Total | 136 (69.4%) | 60 (30.6%) |
Fertility by Education in Devine
| Educational Attainment | Women with Births | Births / 1,000 Women |
| Less than High School | 60 (30.6%) | 488.0 |
| High School Diploma | 0 (0.0%) | 0.0 |
| College or Associate's Degree | 136 (69.4%) | 425.0 |
| Bachelor's Degree | 0 (0.0%) | 0.0 |
| Graduate Degree | 0 (0.0%) | 0.0 |
| Total | 196 (100.0%) | 217.0 |
Fertility by Education by Marriage Status in Devine
30.6% of women with births in Devine are unmarried. Women with the educational attainment of college or associate's degree are most likely to be married with 100.0% of them married at childbirth, while women with the educational attainment of less than high school are least likely to be married with 100.0% of them unmarried at childbirth.
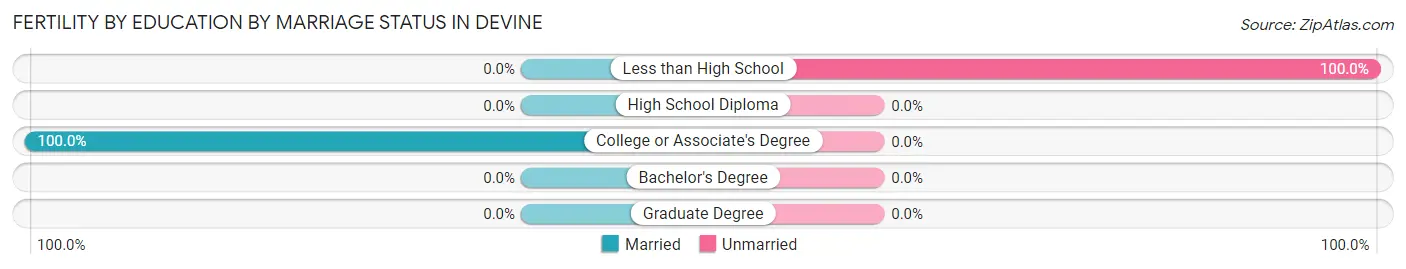
| Educational Attainment | Married | Unmarried |
| Less than High School | 0 (0.0%) | 60 (100.0%) |
| High School Diploma | 0 (0.0%) | 0 (0.0%) |
| College or Associate's Degree | 136 (100.0%) | 0 (0.0%) |
| Bachelor's Degree | 0 (0.0%) | 0 (0.0%) |
| Graduate Degree | 0 (0.0%) | 0 (0.0%) |
| Total | 136 (69.4%) | 60 (30.6%) |
Employment Characteristics in Devine
Employment by Class of Employer in Devine
Among the 1,932 employed individuals in Devine, private company employees (1,080 | 55.9%), not-for-profit organizations (327 | 16.9%), and local government employees (278 | 14.4%) make up the most common classes of employment.
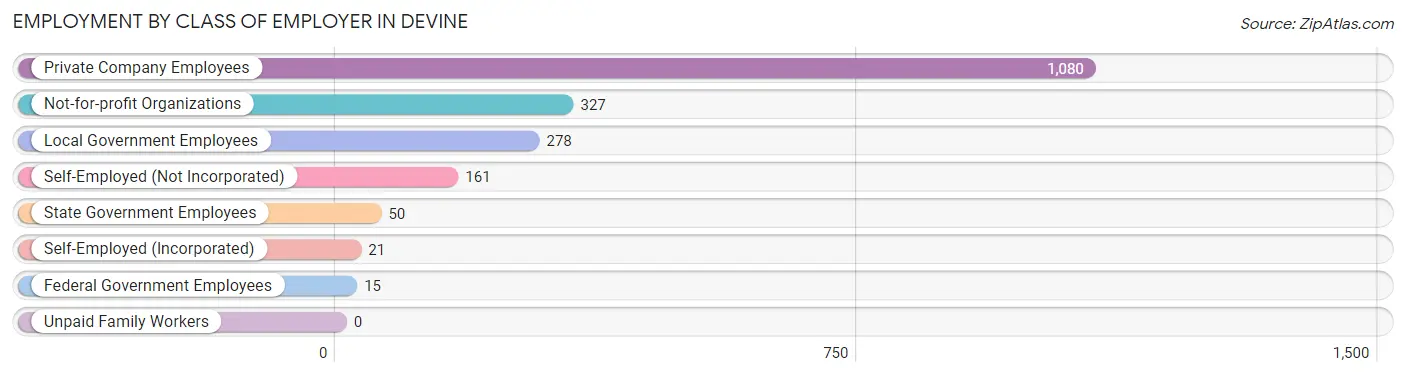
| Employer Class | # Employees | % Employees |
| Private Company Employees | 1,080 | 55.9% |
| Self-Employed (Incorporated) | 21 | 1.1% |
| Self-Employed (Not Incorporated) | 161 | 8.3% |
| Not-for-profit Organizations | 327 | 16.9% |
| Local Government Employees | 278 | 14.4% |
| State Government Employees | 50 | 2.6% |
| Federal Government Employees | 15 | 0.8% |
| Unpaid Family Workers | 0 | 0.0% |
| Total | 1,932 | 100.0% |
Employment Status by Age in Devine
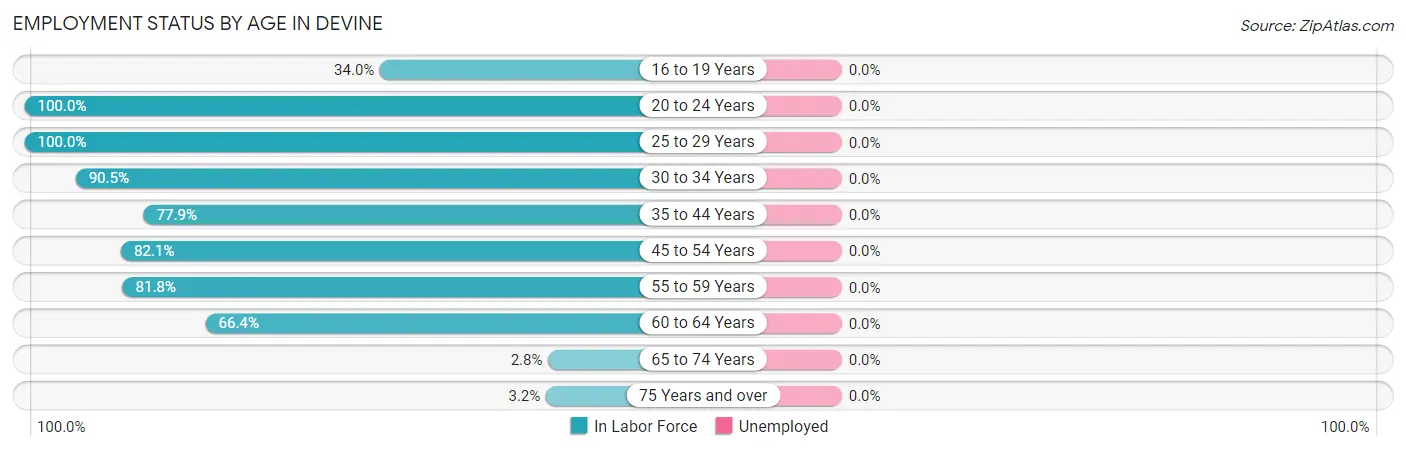
| Age Bracket | In Labor Force | Unemployed |
| 16 to 19 Years | 113 (34.0%) | 0 (0.0%) |
| 20 to 24 Years | 44 (100.0%) | 0 (0.0%) |
| 25 to 29 Years | 161 (100.0%) | 0 (0.0%) |
| 30 to 34 Years | 220 (90.5%) | 0 (0.0%) |
| 35 to 44 Years | 304 (77.9%) | 0 (0.0%) |
| 45 to 54 Years | 623 (82.1%) | 0 (0.0%) |
| 55 to 59 Years | 99 (81.8%) | 0 (0.0%) |
| 60 to 64 Years | 344 (66.4%) | 0 (0.0%) |
| 65 to 74 Years | 11 (2.8%) | 0 (0.0%) |
| 75 Years and over | 13 (3.2%) | 0 (0.0%) |
| Total | 1,932 (57.4%) | 0 (0.0%) |
Employment Status by Educational Attainment in Devine
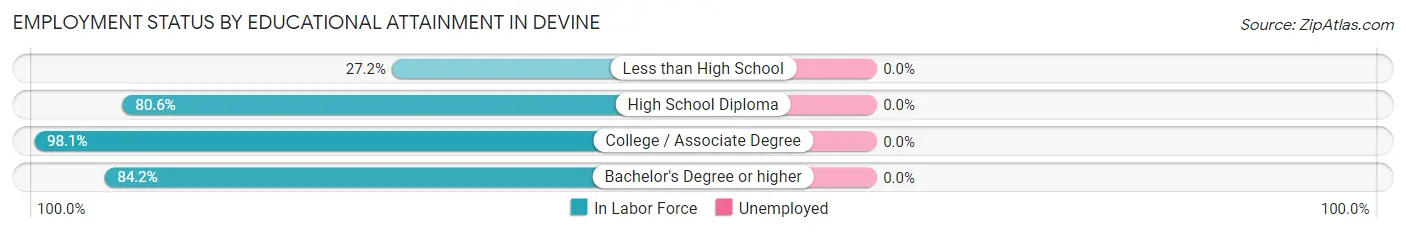
| Educational Attainment | In Labor Force | Unemployed |
| Less than High School | 79 (27.2%) | 0 (0.0%) |
| High School Diploma | 548 (80.6%) | 0 (0.0%) |
| College / Associate Degree | 671 (98.1%) | 0 (0.0%) |
| Bachelor's Degree or higher | 453 (84.2%) | 0 (0.0%) |
| Total | 1,751 (79.9%) | 0 (0.0%) |
Employment Occupations by Sex in Devine
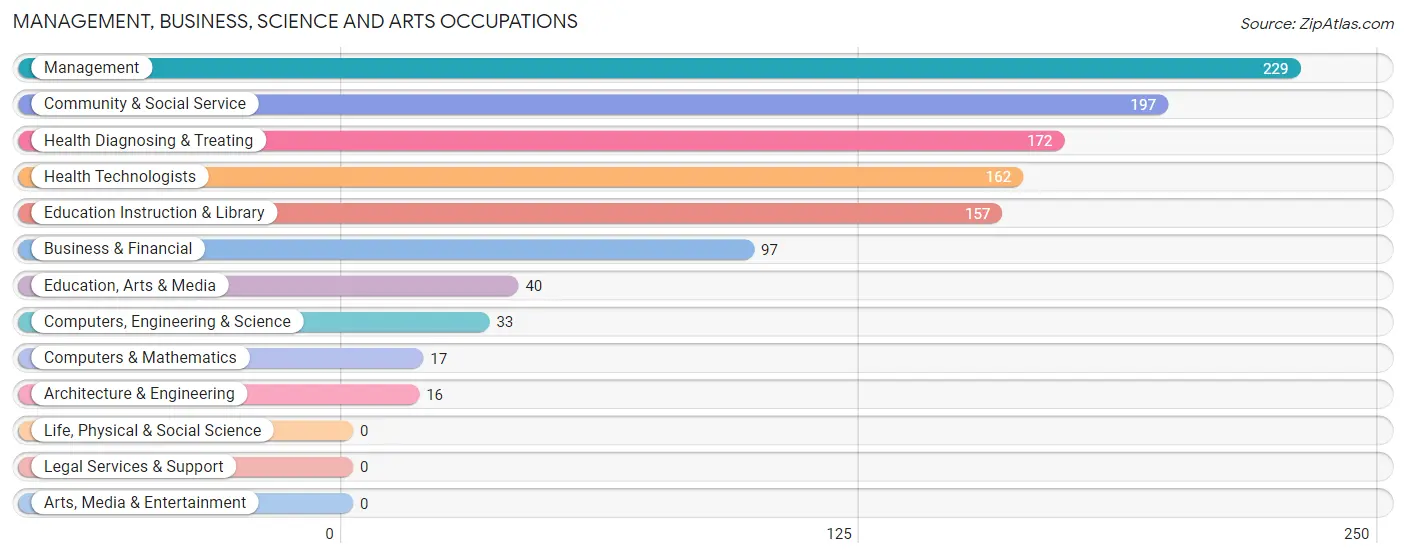
Management, Business, Science and Arts Occupations
The most common Management, Business, Science and Arts occupations in Devine are Management (229 | 11.8%), Community & Social Service (197 | 10.2%), Health Diagnosing & Treating (172 | 8.9%), Health Technologists (162 | 8.4%), and Education Instruction & Library (157 | 8.1%).
Management, Business, Science and Arts Occupations by Sex
Within the Management, Business, Science and Arts occupations in Devine, the most male-oriented occupations are Management (100.0%), Architecture & Engineering (100.0%), and Computers, Engineering & Science (48.5%), while the most female-oriented occupations are Business & Financial (100.0%), Computers & Mathematics (100.0%), and Education, Arts & Media (100.0%).
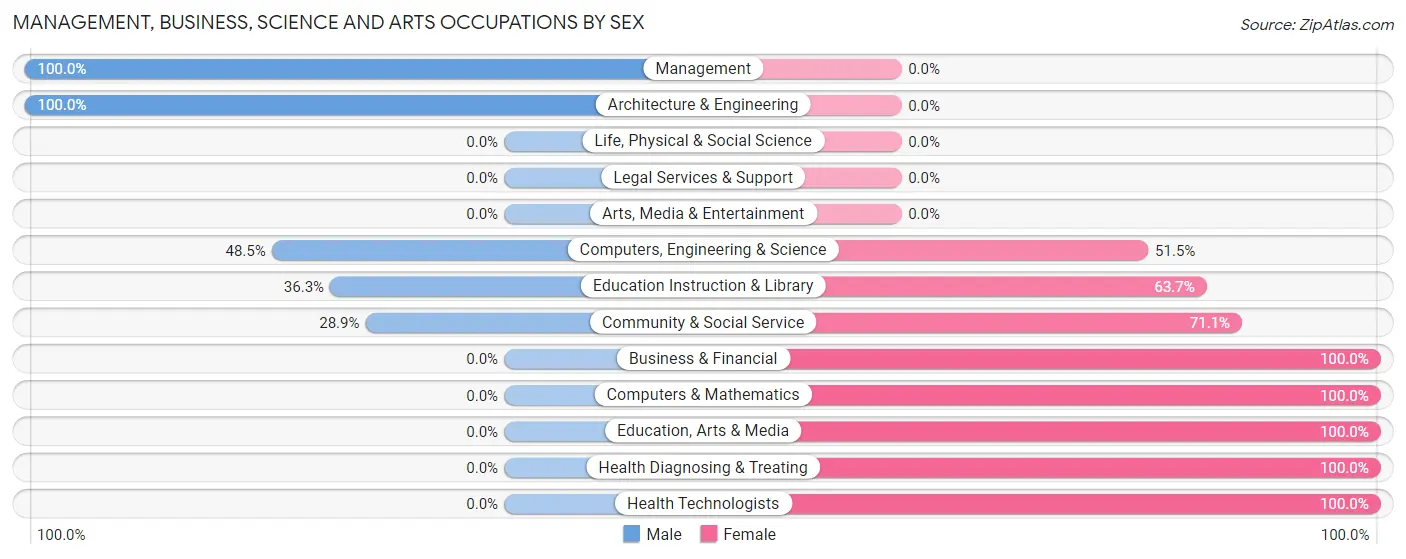
| Occupation | Male | Female |
| Management | 229 (100.0%) | 0 (0.0%) |
| Business & Financial | 0 (0.0%) | 97 (100.0%) |
| Computers, Engineering & Science | 16 (48.5%) | 17 (51.5%) |
| Computers & Mathematics | 0 (0.0%) | 17 (100.0%) |
| Architecture & Engineering | 16 (100.0%) | 0 (0.0%) |
| Life, Physical & Social Science | 0 (0.0%) | 0 (0.0%) |
| Community & Social Service | 57 (28.9%) | 140 (71.1%) |
| Education, Arts & Media | 0 (0.0%) | 40 (100.0%) |
| Legal Services & Support | 0 (0.0%) | 0 (0.0%) |
| Education Instruction & Library | 57 (36.3%) | 100 (63.7%) |
| Arts, Media & Entertainment | 0 (0.0%) | 0 (0.0%) |
| Health Diagnosing & Treating | 0 (0.0%) | 172 (100.0%) |
| Health Technologists | 0 (0.0%) | 162 (100.0%) |
| Total (Category) | 302 (41.5%) | 426 (58.5%) |
| Total (Overall) | 956 (49.5%) | 976 (50.5%) |
Services Occupations
The most common Services occupations in Devine are Cleaning & Maintenance (147 | 7.6%), Healthcare Support (114 | 5.9%), Food Preparation & Serving (100 | 5.2%), and Personal Care & Service (25 | 1.3%).
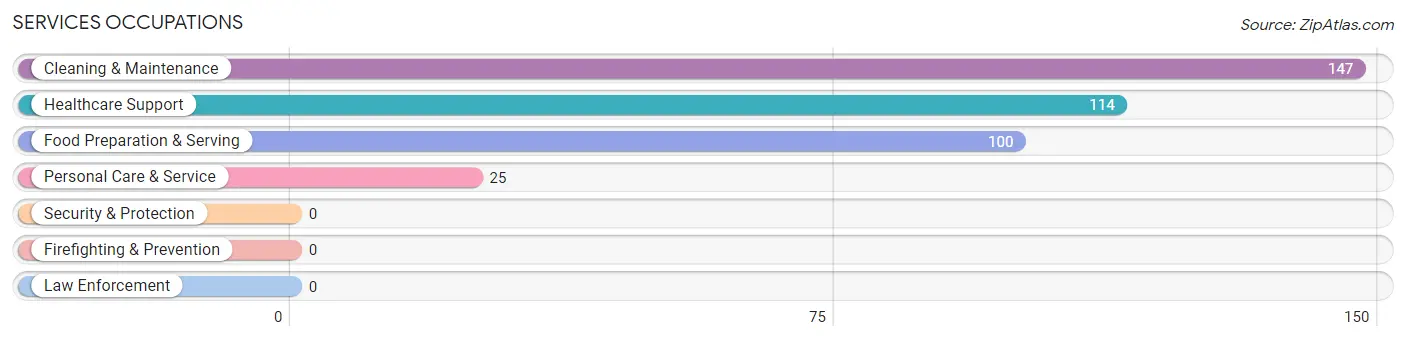
Services Occupations by Sex
Within the Services occupations in Devine, the most male-oriented occupations are Food Preparation & Serving (78.0%), Cleaning & Maintenance (74.2%), and Healthcare Support (34.2%), while the most female-oriented occupations are Personal Care & Service (100.0%), Healthcare Support (65.8%), and Cleaning & Maintenance (25.9%).
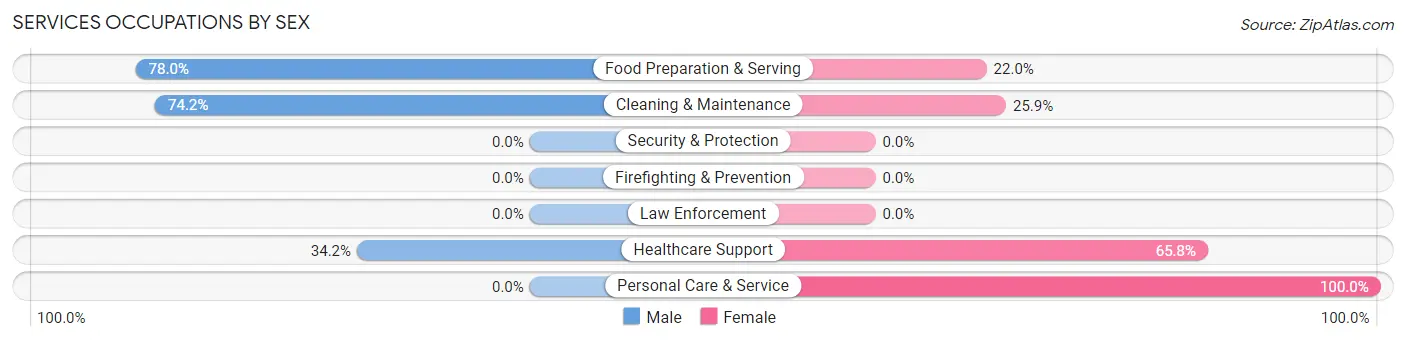
| Occupation | Male | Female |
| Healthcare Support | 39 (34.2%) | 75 (65.8%) |
| Security & Protection | 0 (0.0%) | 0 (0.0%) |
| Firefighting & Prevention | 0 (0.0%) | 0 (0.0%) |
| Law Enforcement | 0 (0.0%) | 0 (0.0%) |
| Food Preparation & Serving | 78 (78.0%) | 22 (22.0%) |
| Cleaning & Maintenance | 109 (74.2%) | 38 (25.9%) |
| Personal Care & Service | 0 (0.0%) | 25 (100.0%) |
| Total (Category) | 226 (58.6%) | 160 (41.4%) |
| Total (Overall) | 956 (49.5%) | 976 (50.5%) |
Sales and Office Occupations
The most common Sales and Office occupations in Devine are Office & Administration (322 | 16.7%), and Sales & Related (48 | 2.5%).
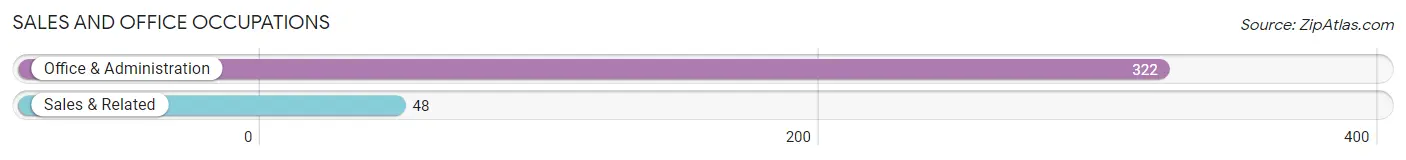
Sales and Office Occupations by Sex
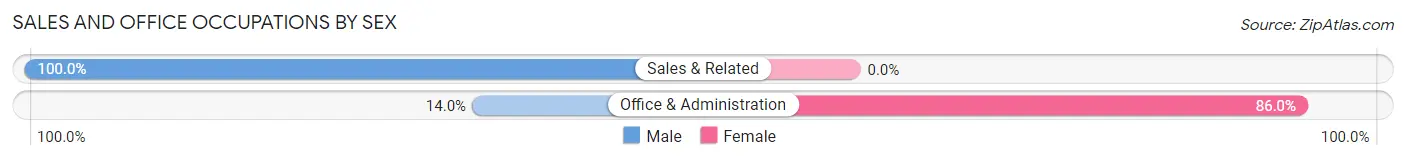
| Occupation | Male | Female |
| Sales & Related | 48 (100.0%) | 0 (0.0%) |
| Office & Administration | 45 (14.0%) | 277 (86.0%) |
| Total (Category) | 93 (25.1%) | 277 (74.9%) |
| Total (Overall) | 956 (49.5%) | 976 (50.5%) |
Natural Resources, Construction and Maintenance Occupations
The most common Natural Resources, Construction and Maintenance occupations in Devine are Construction & Extraction (115 | 5.9%), and Installation, Maintenance & Repair (79 | 4.1%).
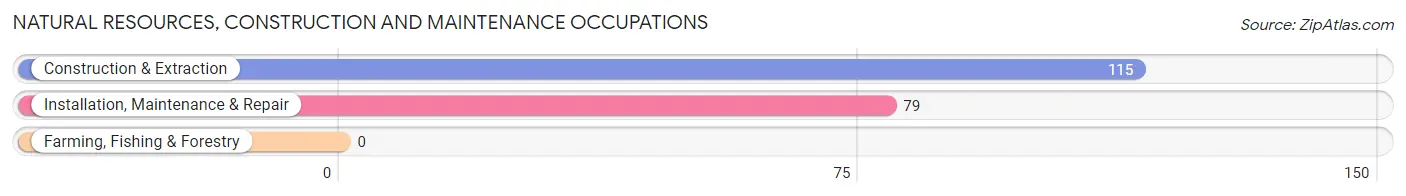
Natural Resources, Construction and Maintenance Occupations by Sex
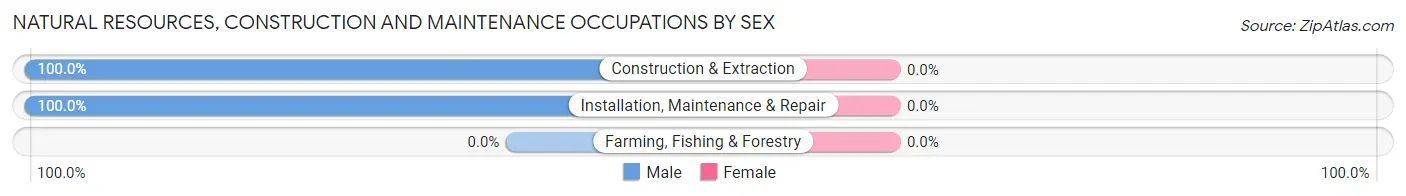
| Occupation | Male | Female |
| Farming, Fishing & Forestry | 0 (0.0%) | 0 (0.0%) |
| Construction & Extraction | 115 (100.0%) | 0 (0.0%) |
| Installation, Maintenance & Repair | 79 (100.0%) | 0 (0.0%) |
| Total (Category) | 194 (100.0%) | 0 (0.0%) |
| Total (Overall) | 956 (49.5%) | 976 (50.5%) |
Production, Transportation and Moving Occupations
The most common Production, Transportation and Moving occupations in Devine are Material Moving (134 | 6.9%), Production (106 | 5.5%), and Transportation (14 | 0.7%).
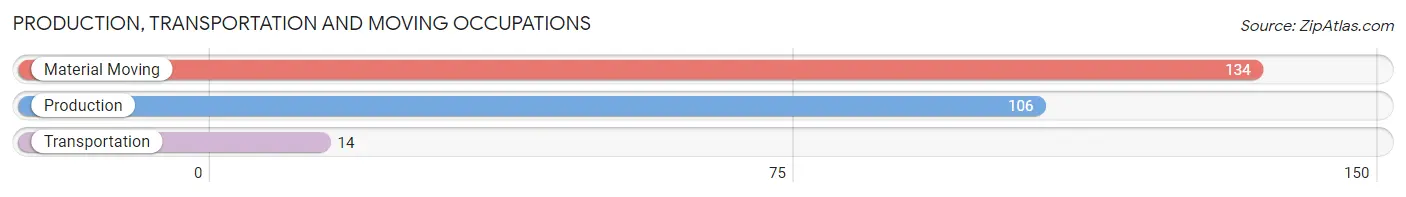
Production, Transportation and Moving Occupations by Sex
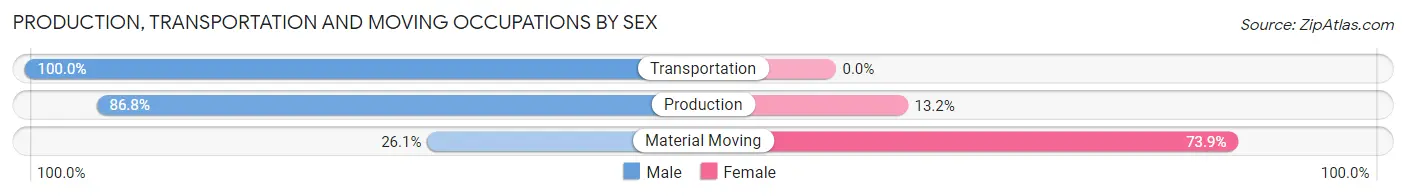
| Occupation | Male | Female |
| Production | 92 (86.8%) | 14 (13.2%) |
| Transportation | 14 (100.0%) | 0 (0.0%) |
| Material Moving | 35 (26.1%) | 99 (73.9%) |
| Total (Category) | 141 (55.5%) | 113 (44.5%) |
| Total (Overall) | 956 (49.5%) | 976 (50.5%) |
Employment Industries by Sex in Devine
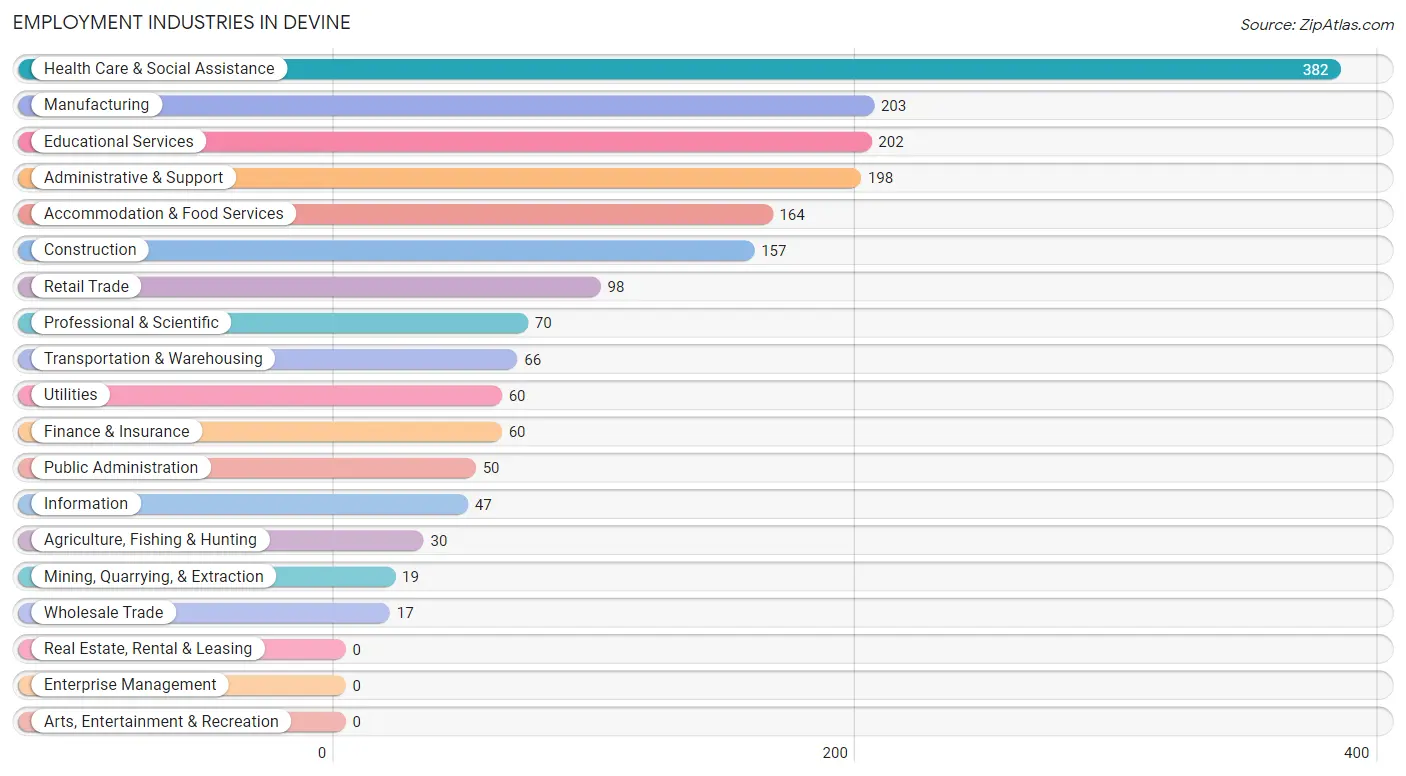
Employment Industries in Devine
The major employment industries in Devine include Health Care & Social Assistance (382 | 19.8%), Manufacturing (203 | 10.5%), Educational Services (202 | 10.5%), Administrative & Support (198 | 10.2%), and Accommodation & Food Services (164 | 8.5%).
Employment Industries by Sex in Devine
The Devine industries that see more men than women are Agriculture, Fishing & Hunting (100.0%), Mining, Quarrying, & Extraction (100.0%), and Construction (100.0%), whereas the industries that tend to have a higher number of women are Wholesale Trade (100.0%), Transportation & Warehousing (100.0%), and Information (100.0%).
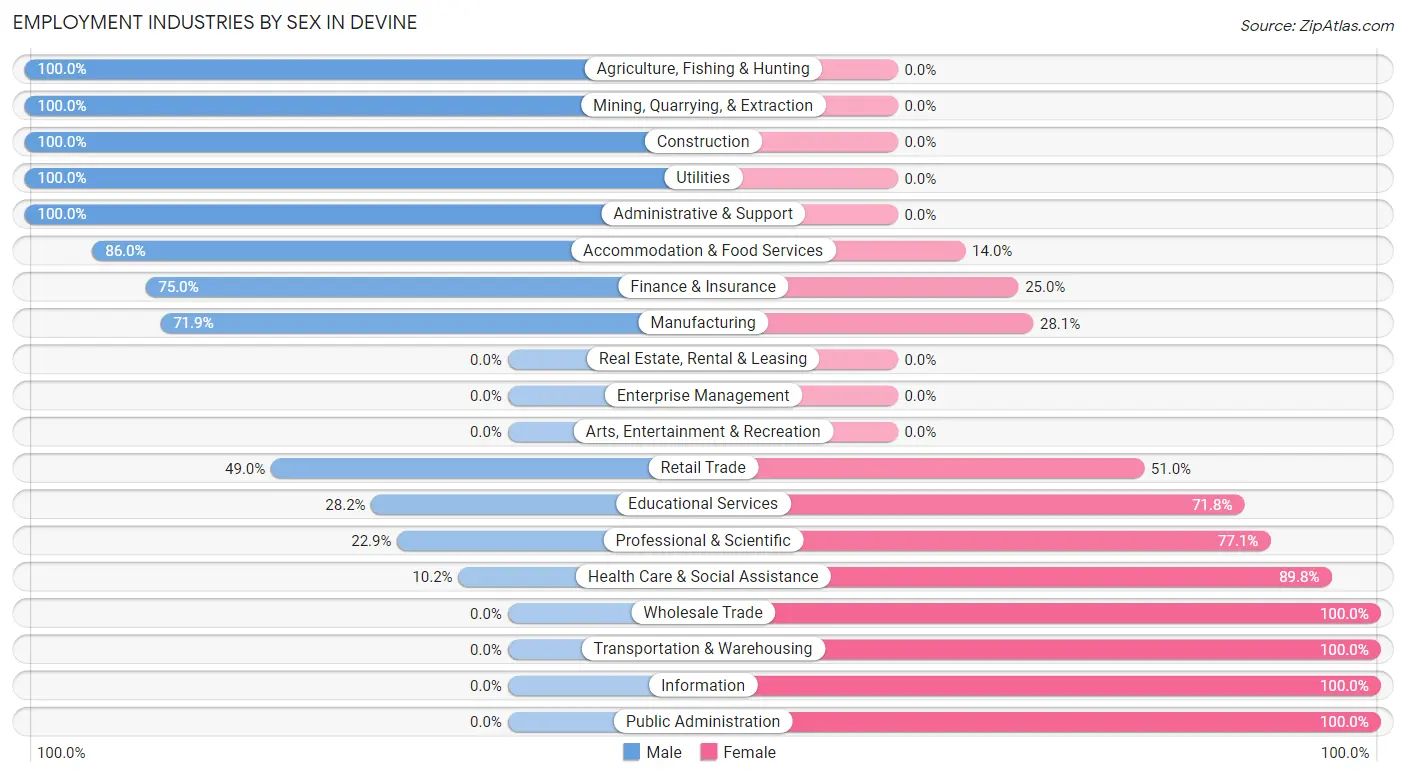
| Industry | Male | Female |
| Agriculture, Fishing & Hunting | 30 (100.0%) | 0 (0.0%) |
| Mining, Quarrying, & Extraction | 19 (100.0%) | 0 (0.0%) |
| Construction | 157 (100.0%) | 0 (0.0%) |
| Manufacturing | 146 (71.9%) | 57 (28.1%) |
| Wholesale Trade | 0 (0.0%) | 17 (100.0%) |
| Retail Trade | 48 (49.0%) | 50 (51.0%) |
| Transportation & Warehousing | 0 (0.0%) | 66 (100.0%) |
| Utilities | 60 (100.0%) | 0 (0.0%) |
| Information | 0 (0.0%) | 47 (100.0%) |
| Finance & Insurance | 45 (75.0%) | 15 (25.0%) |
| Real Estate, Rental & Leasing | 0 (0.0%) | 0 (0.0%) |
| Professional & Scientific | 16 (22.9%) | 54 (77.1%) |
| Enterprise Management | 0 (0.0%) | 0 (0.0%) |
| Administrative & Support | 198 (100.0%) | 0 (0.0%) |
| Educational Services | 57 (28.2%) | 145 (71.8%) |
| Health Care & Social Assistance | 39 (10.2%) | 343 (89.8%) |
| Arts, Entertainment & Recreation | 0 (0.0%) | 0 (0.0%) |
| Accommodation & Food Services | 141 (86.0%) | 23 (14.0%) |
| Public Administration | 0 (0.0%) | 50 (100.0%) |
| Total | 956 (49.5%) | 976 (50.5%) |
Education in Devine
School Enrollment in Devine
The most common levels of schooling among the 1,229 students in Devine are high school (318 | 25.9%), elementary school (316 | 25.7%), and middle school (230 | 18.7%).
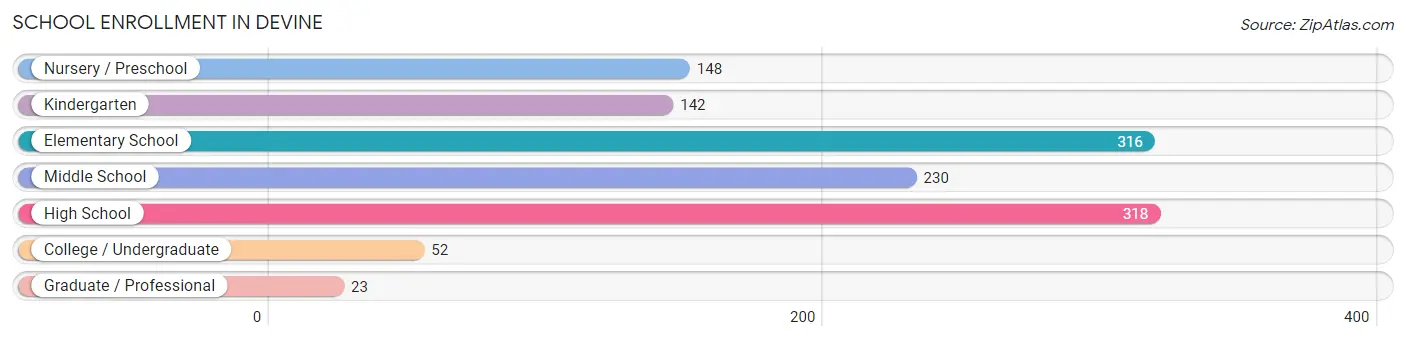
| School Level | # Students | % Students |
| Nursery / Preschool | 148 | 12.0% |
| Kindergarten | 142 | 11.6% |
| Elementary School | 316 | 25.7% |
| Middle School | 230 | 18.7% |
| High School | 318 | 25.9% |
| College / Undergraduate | 52 | 4.2% |
| Graduate / Professional | 23 | 1.9% |
| Total | 1,229 | 100.0% |
School Enrollment by Age by Funding Source in Devine
Out of a total of 1,229 students who are enrolled in schools in Devine, 245 (19.9%) attend a private institution, while the remaining 984 (80.1%) are enrolled in public schools. The age group of 35 years and over has the highest likelihood of being enrolled in private schools, with 76 (81.7% in the age bracket) enrolled. Conversely, the age group of 3 to 4 year olds has the lowest likelihood of being enrolled in a private school, with 148 (100.0% in the age bracket) attending a public institution.
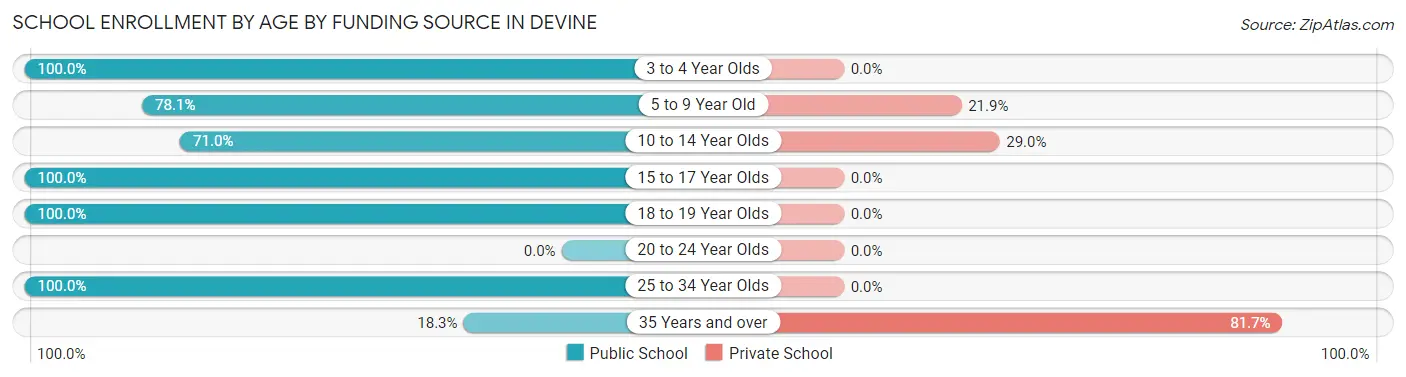
| Age Bracket | Public School | Private School |
| 3 to 4 Year Olds | 148 (100.0%) | 0 (0.0%) |
| 5 to 9 Year Old | 346 (78.1%) | 97 (21.9%) |
| 10 to 14 Year Olds | 174 (71.0%) | 71 (29.0%) |
| 15 to 17 Year Olds | 201 (100.0%) | 0 (0.0%) |
| 18 to 19 Year Olds | 76 (100.0%) | 0 (0.0%) |
| 20 to 24 Year Olds | 0 (0.0%) | 0 (0.0%) |
| 25 to 34 Year Olds | 23 (100.0%) | 0 (0.0%) |
| 35 Years and over | 17 (18.3%) | 76 (81.7%) |
| Total | 984 (80.1%) | 245 (19.9%) |
Educational Attainment by Field of Study in Devine
Bio, nature & agricultural (199 | 30.8%), education (143 | 22.1%), business (93 | 14.4%), computers & mathematics (63 | 9.7%), and liberal arts & history (57 | 8.8%) are the most common fields of study among 647 individuals in Devine who have obtained a bachelor's degree or higher.
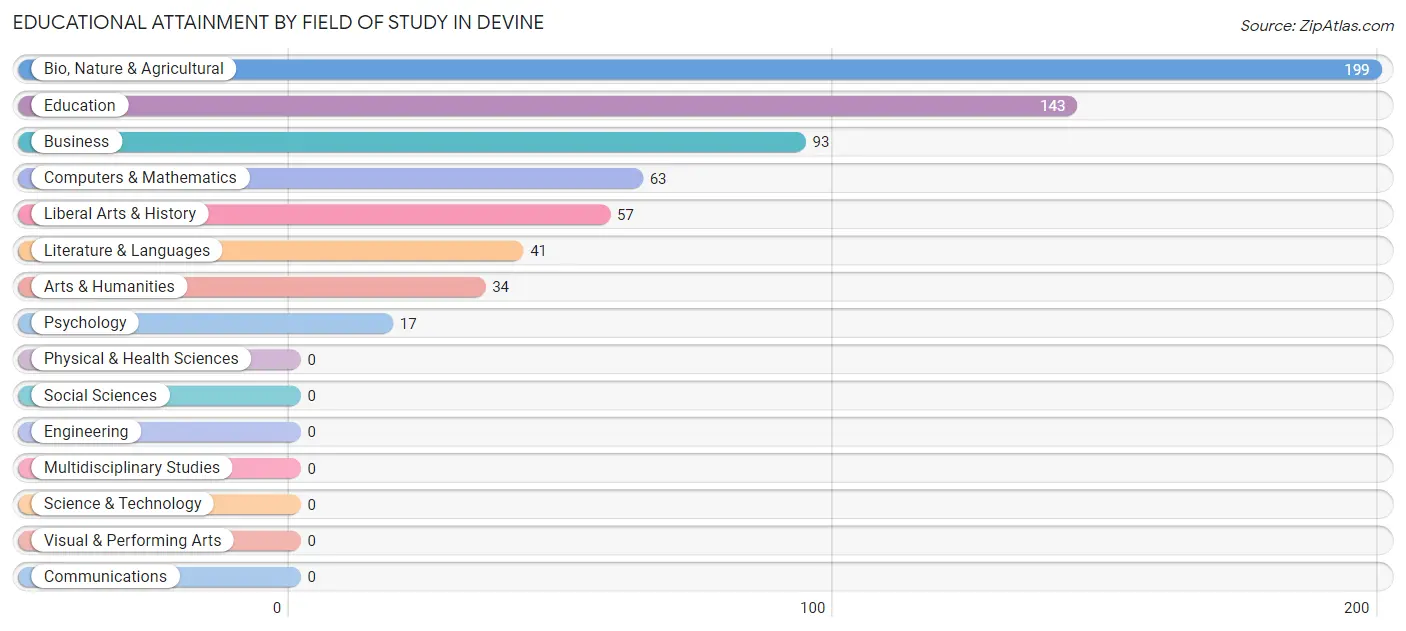
| Field of Study | # Graduates | % Graduates |
| Computers & Mathematics | 63 | 9.7% |
| Bio, Nature & Agricultural | 199 | 30.8% |
| Physical & Health Sciences | 0 | 0.0% |
| Psychology | 17 | 2.6% |
| Social Sciences | 0 | 0.0% |
| Engineering | 0 | 0.0% |
| Multidisciplinary Studies | 0 | 0.0% |
| Science & Technology | 0 | 0.0% |
| Business | 93 | 14.4% |
| Education | 143 | 22.1% |
| Literature & Languages | 41 | 6.3% |
| Liberal Arts & History | 57 | 8.8% |
| Visual & Performing Arts | 0 | 0.0% |
| Communications | 0 | 0.0% |
| Arts & Humanities | 34 | 5.3% |
| Total | 647 | 100.0% |
Transportation & Commute in Devine
Vehicle Availability by Sex in Devine
The most prevalent vehicle ownership categories in Devine are males with 2 vehicles (454, accounting for 47.5%) and females with 2 vehicles (462, making up 46.5%).
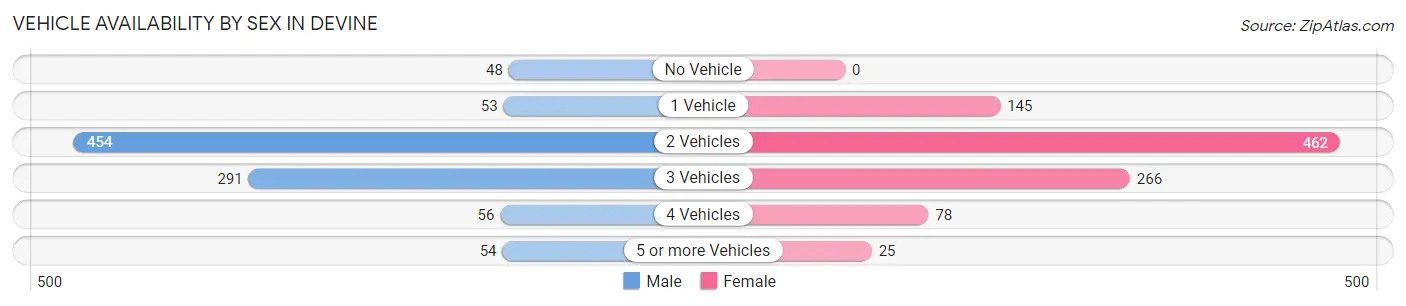
| Vehicles Available | Male | Female |
| No Vehicle | 48 (5.0%) | 0 (0.0%) |
| 1 Vehicle | 53 (5.5%) | 145 (14.9%) |
| 2 Vehicles | 454 (47.5%) | 462 (47.3%) |
| 3 Vehicles | 291 (30.4%) | 266 (27.3%) |
| 4 Vehicles | 56 (5.9%) | 78 (8.0%) |
| 5 or more Vehicles | 54 (5.7%) | 25 (2.6%) |
| Total | 956 (100.0%) | 976 (100.0%) |
Commute Time in Devine
The most frequently occuring commute durations in Devine are 5 to 9 minutes (505 commuters, 26.9%), 30 to 34 minutes (432 commuters, 23.0%), and 45 to 59 minutes (346 commuters, 18.4%).
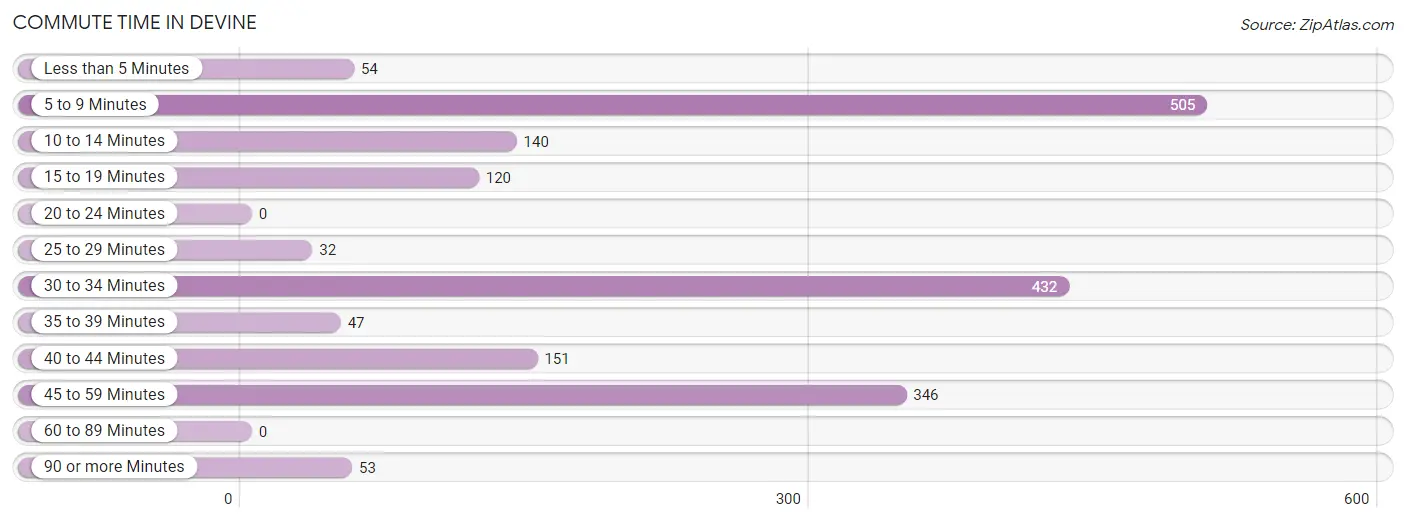
| Commute Time | # Commuters | % Commuters |
| Less than 5 Minutes | 54 | 2.9% |
| 5 to 9 Minutes | 505 | 26.9% |
| 10 to 14 Minutes | 140 | 7.4% |
| 15 to 19 Minutes | 120 | 6.4% |
| 20 to 24 Minutes | 0 | 0.0% |
| 25 to 29 Minutes | 32 | 1.7% |
| 30 to 34 Minutes | 432 | 23.0% |
| 35 to 39 Minutes | 47 | 2.5% |
| 40 to 44 Minutes | 151 | 8.0% |
| 45 to 59 Minutes | 346 | 18.4% |
| 60 to 89 Minutes | 0 | 0.0% |
| 90 or more Minutes | 53 | 2.8% |
Commute Time by Sex in Devine
The most common commute times in Devine are 30 to 34 minutes (294 commuters, 31.9%) for males and 5 to 9 minutes (312 commuters, 32.5%) for females.
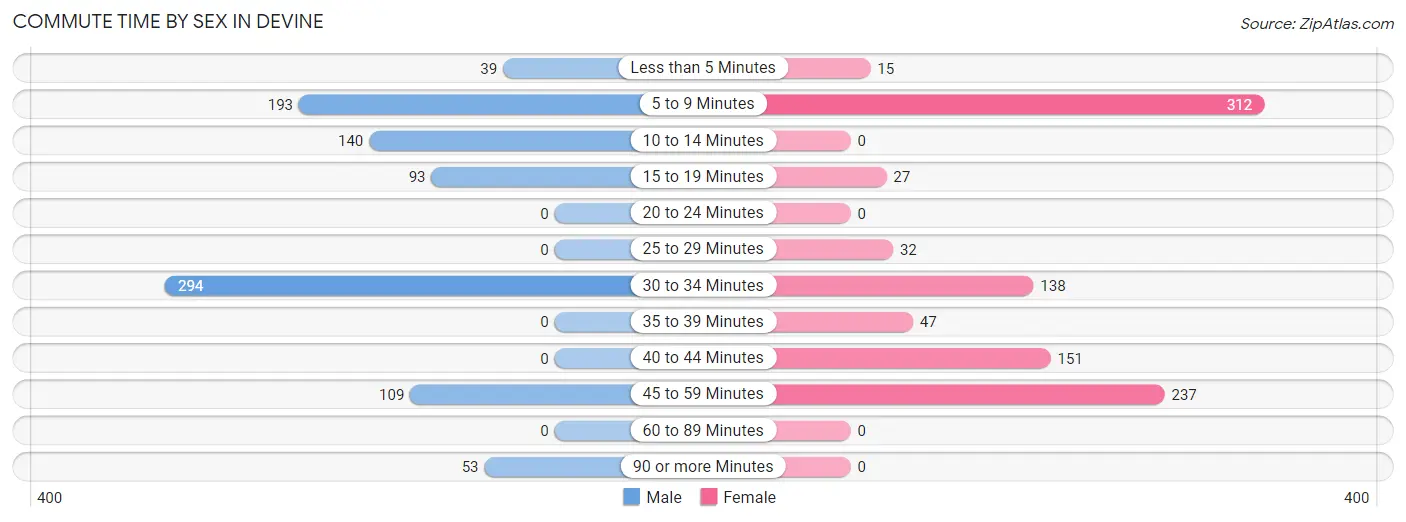
| Commute Time | Male | Female |
| Less than 5 Minutes | 39 (4.2%) | 15 (1.6%) |
| 5 to 9 Minutes | 193 (21.0%) | 312 (32.5%) |
| 10 to 14 Minutes | 140 (15.2%) | 0 (0.0%) |
| 15 to 19 Minutes | 93 (10.1%) | 27 (2.8%) |
| 20 to 24 Minutes | 0 (0.0%) | 0 (0.0%) |
| 25 to 29 Minutes | 0 (0.0%) | 32 (3.3%) |
| 30 to 34 Minutes | 294 (31.9%) | 138 (14.4%) |
| 35 to 39 Minutes | 0 (0.0%) | 47 (4.9%) |
| 40 to 44 Minutes | 0 (0.0%) | 151 (15.8%) |
| 45 to 59 Minutes | 109 (11.8%) | 237 (24.7%) |
| 60 to 89 Minutes | 0 (0.0%) | 0 (0.0%) |
| 90 or more Minutes | 53 (5.8%) | 0 (0.0%) |
Time of Departure to Work by Sex in Devine
The most frequent times of departure to work in Devine are 7:30 AM to 7:59 AM (131, 14.2%) for males and 5:30 AM to 5:59 AM (284, 29.6%) for females.
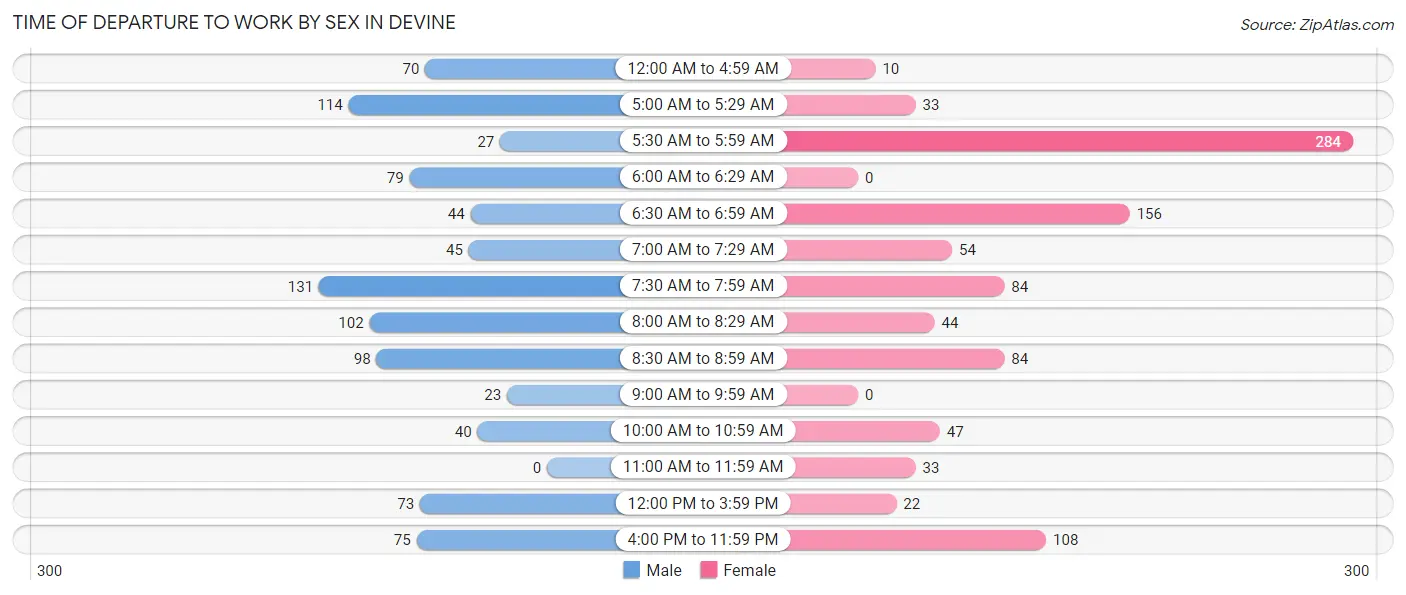
| Time of Departure | Male | Female |
| 12:00 AM to 4:59 AM | 70 (7.6%) | 10 (1.0%) |
| 5:00 AM to 5:29 AM | 114 (12.4%) | 33 (3.4%) |
| 5:30 AM to 5:59 AM | 27 (2.9%) | 284 (29.6%) |
| 6:00 AM to 6:29 AM | 79 (8.6%) | 0 (0.0%) |
| 6:30 AM to 6:59 AM | 44 (4.8%) | 156 (16.3%) |
| 7:00 AM to 7:29 AM | 45 (4.9%) | 54 (5.6%) |
| 7:30 AM to 7:59 AM | 131 (14.2%) | 84 (8.8%) |
| 8:00 AM to 8:29 AM | 102 (11.1%) | 44 (4.6%) |
| 8:30 AM to 8:59 AM | 98 (10.6%) | 84 (8.8%) |
| 9:00 AM to 9:59 AM | 23 (2.5%) | 0 (0.0%) |
| 10:00 AM to 10:59 AM | 40 (4.3%) | 47 (4.9%) |
| 11:00 AM to 11:59 AM | 0 (0.0%) | 33 (3.4%) |
| 12:00 PM to 3:59 PM | 73 (7.9%) | 22 (2.3%) |
| 4:00 PM to 11:59 PM | 75 (8.1%) | 108 (11.3%) |
| Total | 921 (100.0%) | 959 (100.0%) |
Housing Occupancy in Devine
Occupancy by Ownership in Devine
Of the total 1,774 dwellings in Devine, owner-occupied units account for 1,241 (70.0%), while renter-occupied units make up 533 (30.0%).
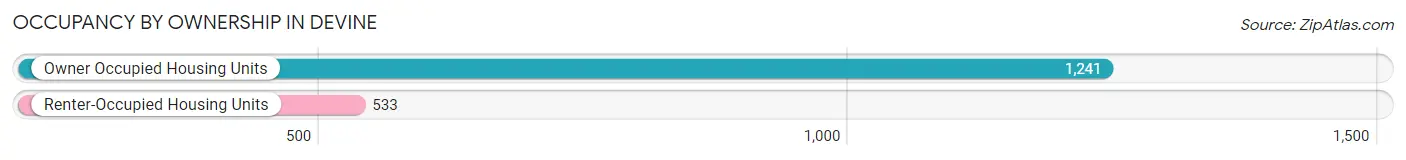
| Occupancy | # Housing Units | % Housing Units |
| Owner Occupied Housing Units | 1,241 | 70.0% |
| Renter-Occupied Housing Units | 533 | 30.0% |
| Total Occupied Housing Units | 1,774 | 100.0% |
Occupancy by Household Size in Devine
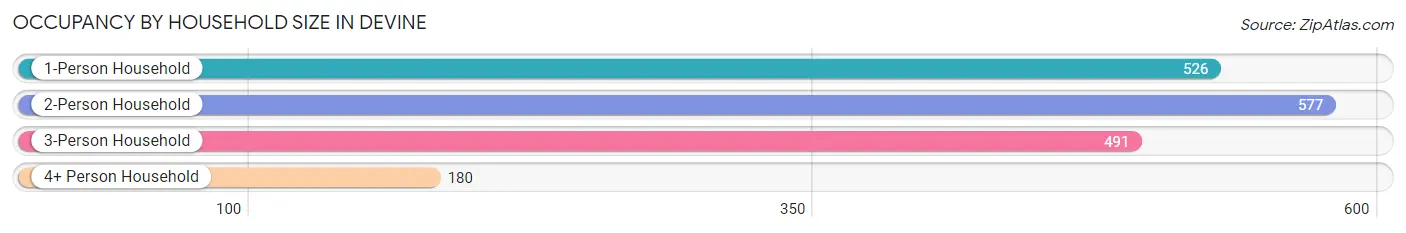
| Household Size | # Housing Units | % Housing Units |
| 1-Person Household | 526 | 29.6% |
| 2-Person Household | 577 | 32.5% |
| 3-Person Household | 491 | 27.7% |
| 4+ Person Household | 180 | 10.2% |
| Total Housing Units | 1,774 | 100.0% |
Occupancy by Ownership by Household Size in Devine

| Household Size | Owner-occupied | Renter-occupied |
| 1-Person Household | 192 (36.5%) | 334 (63.5%) |
| 2-Person Household | 528 (91.5%) | 49 (8.5%) |
| 3-Person Household | 346 (70.5%) | 145 (29.5%) |
| 4+ Person Household | 175 (97.2%) | 5 (2.8%) |
| Total Housing Units | 1,241 (70.0%) | 533 (30.0%) |
Occupancy by Educational Attainment in Devine
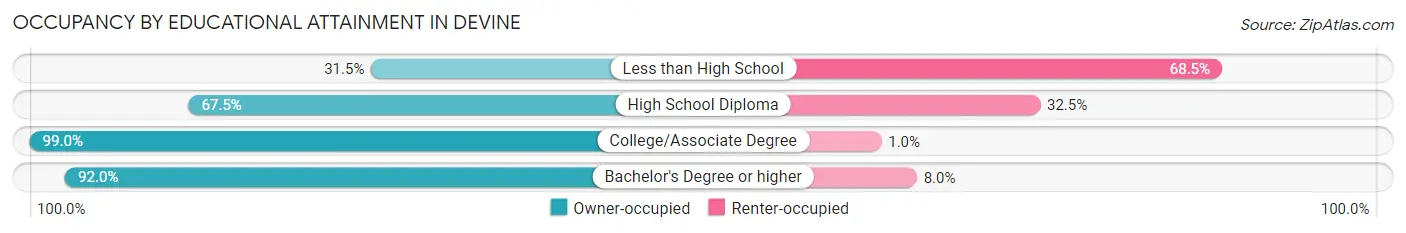
| Household Size | Owner-occupied | Renter-occupied |
| Less than High School | 141 (31.5%) | 307 (68.5%) |
| High School Diploma | 426 (67.5%) | 205 (32.5%) |
| College/Associate Degree | 491 (99.0%) | 5 (1.0%) |
| Bachelor's Degree or higher | 183 (92.0%) | 16 (8.0%) |
Occupancy by Age of Householder in Devine
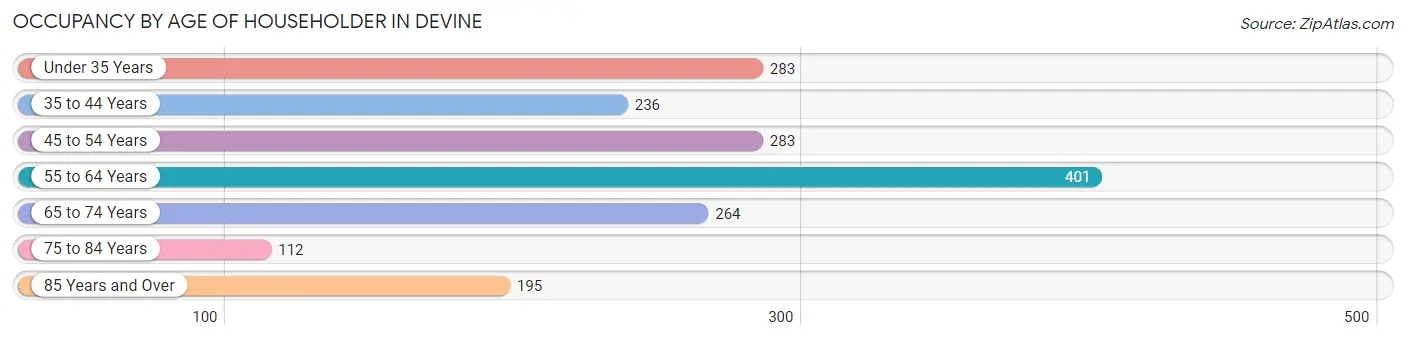
| Age Bracket | # Households | % Households |
| Under 35 Years | 283 | 16.0% |
| 35 to 44 Years | 236 | 13.3% |
| 45 to 54 Years | 283 | 16.0% |
| 55 to 64 Years | 401 | 22.6% |
| 65 to 74 Years | 264 | 14.9% |
| 75 to 84 Years | 112 | 6.3% |
| 85 Years and Over | 195 | 11.0% |
| Total | 1,774 | 100.0% |
Housing Finances in Devine
Median Income by Occupancy in Devine
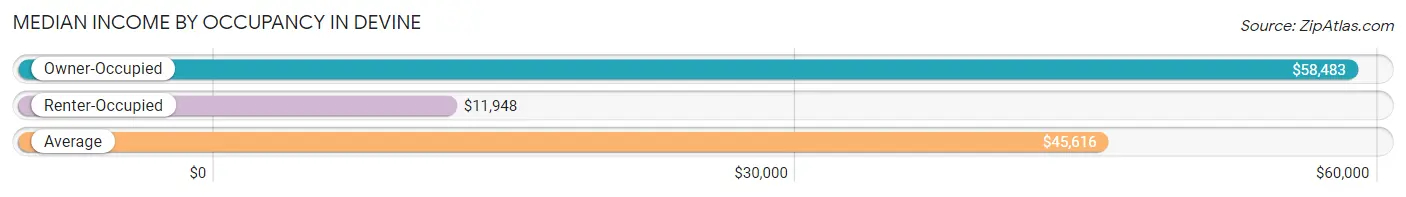
| Occupancy Type | # Households | Median Income |
| Owner-Occupied | 1,241 (70.0%) | $58,483 |
| Renter-Occupied | 533 (30.0%) | $11,948 |
| Average | 1,774 (100.0%) | $45,616 |
Occupancy by Householder Income Bracket in Devine
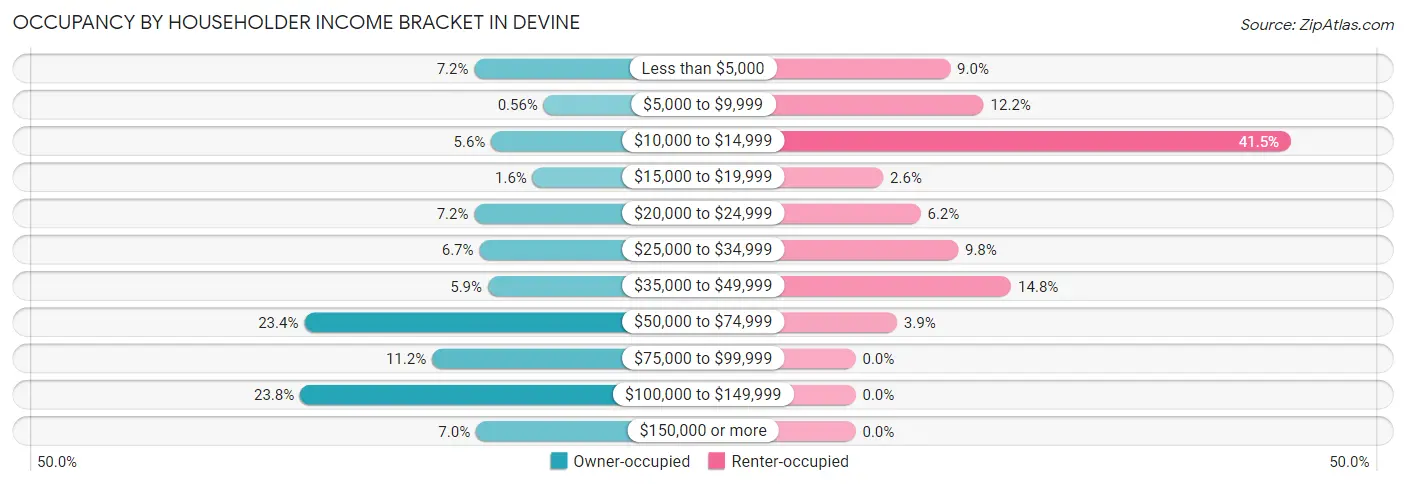
| Income Bracket | Owner-occupied | Renter-occupied |
| Less than $5,000 | 89 (7.2%) | 48 (9.0%) |
| $5,000 to $9,999 | 7 (0.6%) | 65 (12.2%) |
| $10,000 to $14,999 | 69 (5.6%) | 221 (41.5%) |
| $15,000 to $19,999 | 20 (1.6%) | 14 (2.6%) |
| $20,000 to $24,999 | 89 (7.2%) | 33 (6.2%) |
| $25,000 to $34,999 | 83 (6.7%) | 52 (9.8%) |
| $35,000 to $49,999 | 73 (5.9%) | 79 (14.8%) |
| $50,000 to $74,999 | 290 (23.4%) | 21 (3.9%) |
| $75,000 to $99,999 | 139 (11.2%) | 0 (0.0%) |
| $100,000 to $149,999 | 295 (23.8%) | 0 (0.0%) |
| $150,000 or more | 87 (7.0%) | 0 (0.0%) |
| Total | 1,241 (100.0%) | 533 (100.0%) |
Monthly Housing Cost Tiers in Devine
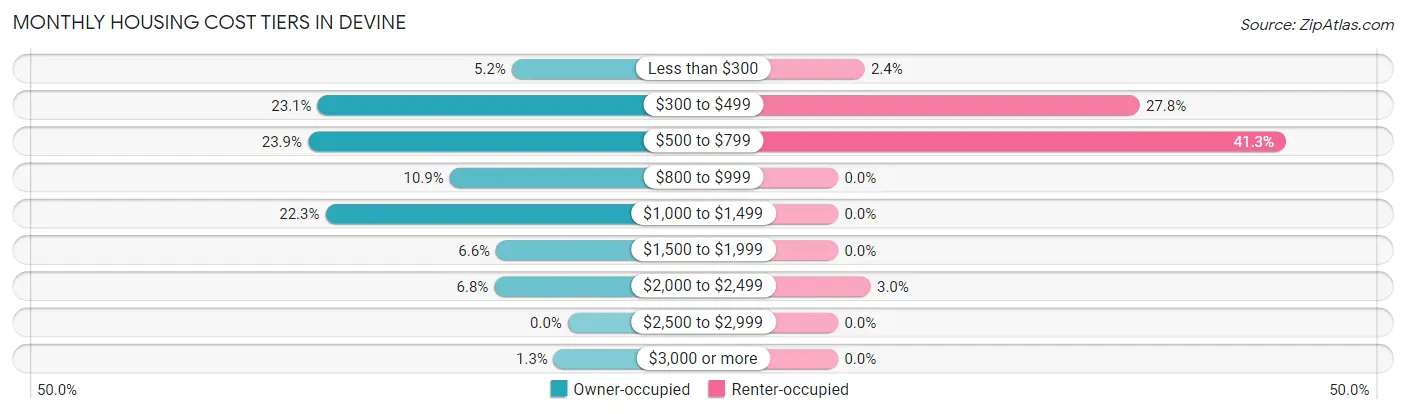
| Monthly Cost | Owner-occupied | Renter-occupied |
| Less than $300 | 64 (5.2%) | 13 (2.4%) |
| $300 to $499 | 286 (23.1%) | 148 (27.8%) |
| $500 to $799 | 297 (23.9%) | 220 (41.3%) |
| $800 to $999 | 135 (10.9%) | 0 (0.0%) |
| $1,000 to $1,499 | 277 (22.3%) | 0 (0.0%) |
| $1,500 to $1,999 | 82 (6.6%) | 0 (0.0%) |
| $2,000 to $2,499 | 84 (6.8%) | 16 (3.0%) |
| $2,500 to $2,999 | 0 (0.0%) | 0 (0.0%) |
| $3,000 or more | 16 (1.3%) | 0 (0.0%) |
| Total | 1,241 (100.0%) | 533 (100.0%) |
Physical Housing Characteristics in Devine
Housing Structures in Devine
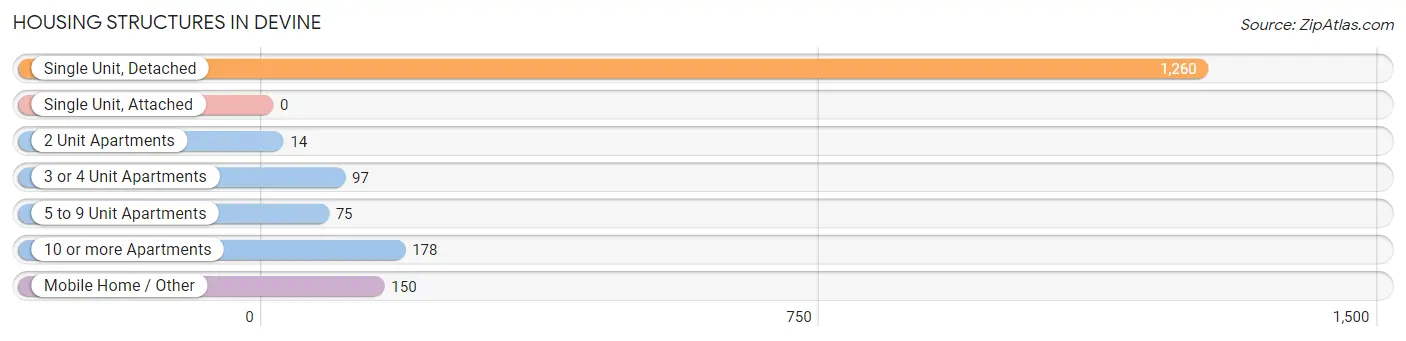
| Structure Type | # Housing Units | % Housing Units |
| Single Unit, Detached | 1,260 | 71.0% |
| Single Unit, Attached | 0 | 0.0% |
| 2 Unit Apartments | 14 | 0.8% |
| 3 or 4 Unit Apartments | 97 | 5.5% |
| 5 to 9 Unit Apartments | 75 | 4.2% |
| 10 or more Apartments | 178 | 10.0% |
| Mobile Home / Other | 150 | 8.5% |
| Total | 1,774 | 100.0% |
Housing Structures by Occupancy in Devine
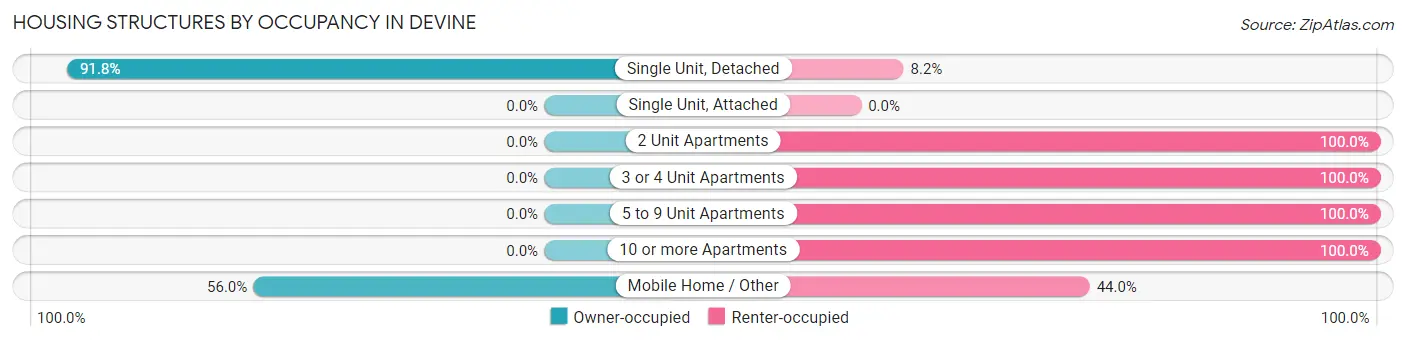
| Structure Type | Owner-occupied | Renter-occupied |
| Single Unit, Detached | 1,157 (91.8%) | 103 (8.2%) |
| Single Unit, Attached | 0 (0.0%) | 0 (0.0%) |
| 2 Unit Apartments | 0 (0.0%) | 14 (100.0%) |
| 3 or 4 Unit Apartments | 0 (0.0%) | 97 (100.0%) |
| 5 to 9 Unit Apartments | 0 (0.0%) | 75 (100.0%) |
| 10 or more Apartments | 0 (0.0%) | 178 (100.0%) |
| Mobile Home / Other | 84 (56.0%) | 66 (44.0%) |
| Total | 1,241 (70.0%) | 533 (30.0%) |
Housing Structures by Number of Rooms in Devine
| Number of Rooms | Owner-occupied | Renter-occupied |
| 1 Room | 57 (4.6%) | 75 (14.1%) |
| 2 or 3 Rooms | 47 (3.8%) | 235 (44.1%) |
| 4 or 5 Rooms | 117 (9.4%) | 218 (40.9%) |
| 6 or 7 Rooms | 727 (58.6%) | 5 (0.9%) |
| 8 or more Rooms | 293 (23.6%) | 0 (0.0%) |
| Total | 1,241 (100.0%) | 533 (100.0%) |
Housing Structure by Heating Type in Devine
| Heating Type | Owner-occupied | Renter-occupied |
| Utility Gas | 316 (25.5%) | 57 (10.7%) |
| Bottled, Tank, or LP Gas | 57 (4.6%) | 0 (0.0%) |
| Electricity | 868 (69.9%) | 476 (89.3%) |
| Fuel Oil or Kerosene | 0 (0.0%) | 0 (0.0%) |
| Coal or Coke | 0 (0.0%) | 0 (0.0%) |
| All other Fuels | 0 (0.0%) | 0 (0.0%) |
| No Fuel Used | 0 (0.0%) | 0 (0.0%) |
| Total | 1,241 (100.0%) | 533 (100.0%) |
Household Vehicle Usage in Devine
| Vehicles per Household | Owner-occupied | Renter-occupied |
| No Vehicle | 69 (5.6%) | 169 (31.7%) |
| 1 Vehicle | 302 (24.3%) | 345 (64.7%) |
| 2 Vehicles | 541 (43.6%) | 14 (2.6%) |
| 3 or more Vehicles | 329 (26.5%) | 5 (0.9%) |
| Total | 1,241 (100.0%) | 533 (100.0%) |
Real Estate & Mortgages in Devine
Real Estate and Mortgage Overview in Devine
| Characteristic | Without Mortgage | With Mortgage |
| Housing Units | 776 | 465 |
| Median Property Value | $117,900 | $242,600 |
| Median Household Income | $56,268 | $56 |
| Monthly Housing Costs | $609 | $16 |
| Real Estate Taxes | $2,114 | $0 |
Property Value by Mortgage Status in Devine
| Property Value | Without Mortgage | With Mortgage |
| Less than $50,000 | 84 (10.8%) | 0 (0.0%) |
| $50,000 to $99,999 | 116 (14.9%) | 137 (29.5%) |
| $100,000 to $299,999 | 418 (53.9%) | 195 (41.9%) |
| $300,000 to $499,999 | 108 (13.9%) | 54 (11.6%) |
| $500,000 to $749,999 | 29 (3.7%) | 39 (8.4%) |
| $750,000 to $999,999 | 0 (0.0%) | 40 (8.6%) |
| $1,000,000 or more | 21 (2.7%) | 0 (0.0%) |
| Total | 776 (100.0%) | 465 (100.0%) |
Household Income by Mortgage Status in Devine
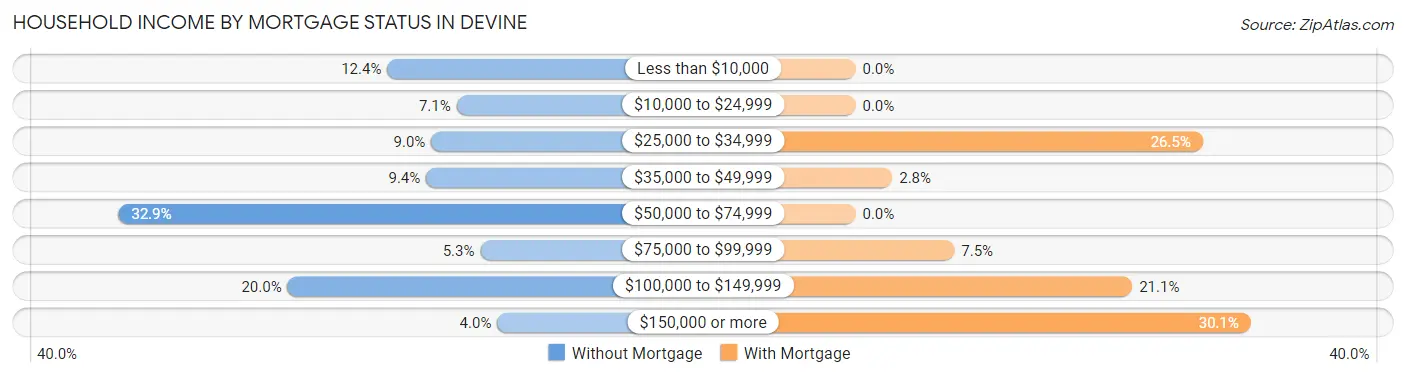
| Household Income | Without Mortgage | With Mortgage |
| Less than $10,000 | 96 (12.4%) | 0 (0.0%) |
| $10,000 to $24,999 | 55 (7.1%) | 0 (0.0%) |
| $25,000 to $34,999 | 70 (9.0%) | 123 (26.5%) |
| $35,000 to $49,999 | 73 (9.4%) | 13 (2.8%) |
| $50,000 to $74,999 | 255 (32.9%) | 0 (0.0%) |
| $75,000 to $99,999 | 41 (5.3%) | 35 (7.5%) |
| $100,000 to $149,999 | 155 (20.0%) | 98 (21.1%) |
| $150,000 or more | 31 (4.0%) | 140 (30.1%) |
| Total | 776 (100.0%) | 465 (100.0%) |
Property Value to Household Income Ratio in Devine
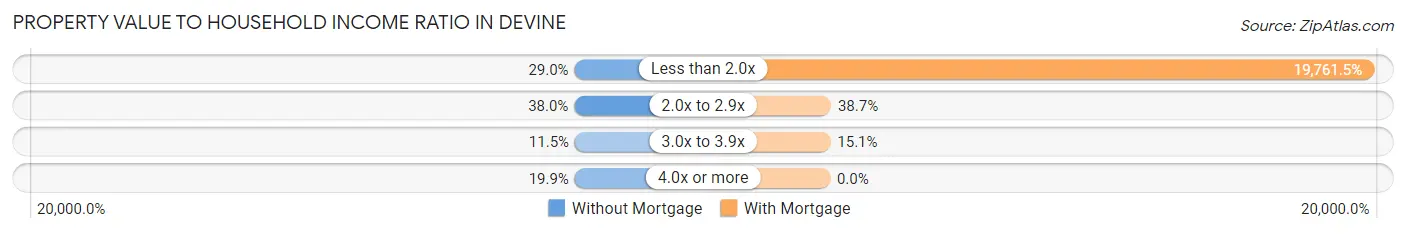
| Value-to-Income Ratio | Without Mortgage | With Mortgage |
| Less than 2.0x | 225 (29.0%) | 91,891 (19,761.5%) |
| 2.0x to 2.9x | 295 (38.0%) | 180 (38.7%) |
| 3.0x to 3.9x | 89 (11.5%) | 70 (15.0%) |
| 4.0x or more | 154 (19.9%) | 0 (0.0%) |
| Total | 776 (100.0%) | 465 (100.0%) |
Real Estate Taxes by Mortgage Status in Devine
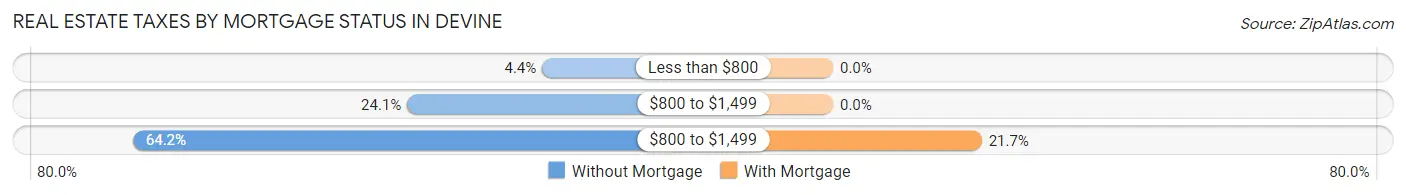
| Property Taxes | Without Mortgage | With Mortgage |
| Less than $800 | 34 (4.4%) | 0 (0.0%) |
| $800 to $1,499 | 187 (24.1%) | 0 (0.0%) |
| $800 to $1,499 | 498 (64.2%) | 101 (21.7%) |
| Total | 776 (100.0%) | 465 (100.0%) |
Health & Disability in Devine
Health Insurance Coverage by Age in Devine
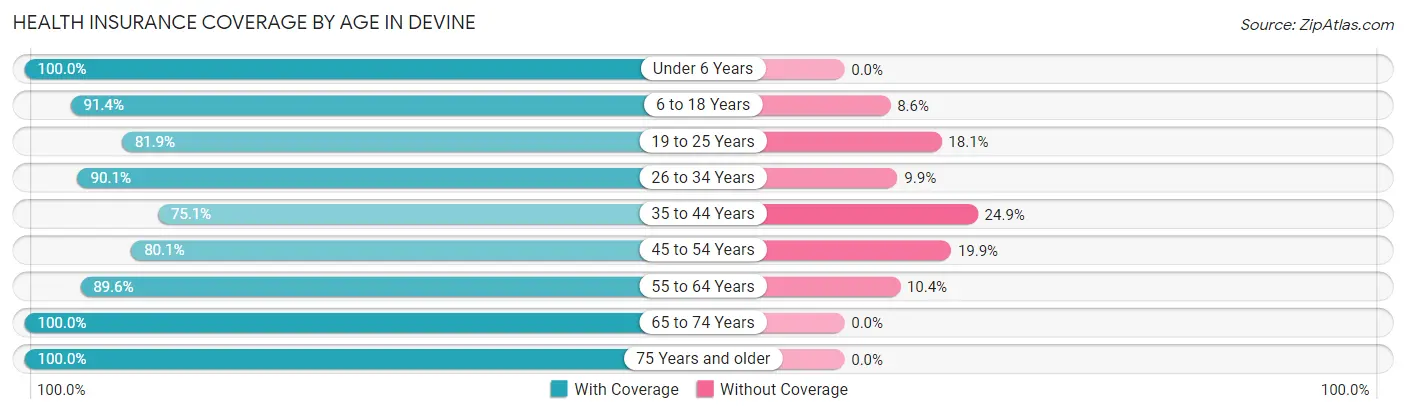
| Age Bracket | With Coverage | Without Coverage |
| Under 6 Years | 302 (100.0%) | 0 (0.0%) |
| 6 to 18 Years | 875 (91.4%) | 82 (8.6%) |
| 19 to 25 Years | 104 (81.9%) | 23 (18.1%) |
| 26 to 34 Years | 364 (90.1%) | 40 (9.9%) |
| 35 to 44 Years | 293 (75.1%) | 97 (24.9%) |
| 45 to 54 Years | 608 (80.1%) | 151 (19.9%) |
| 55 to 64 Years | 561 (89.6%) | 65 (10.4%) |
| 65 to 74 Years | 368 (100.0%) | 0 (0.0%) |
| 75 Years and older | 331 (100.0%) | 0 (0.0%) |
| Total | 3,806 (89.3%) | 458 (10.7%) |
Health Insurance Coverage by Citizenship Status in Devine
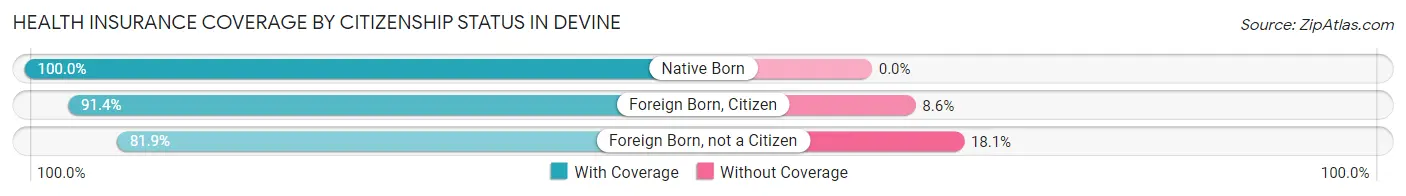
| Citizenship Status | With Coverage | Without Coverage |
| Native Born | 302 (100.0%) | 0 (0.0%) |
| Foreign Born, Citizen | 875 (91.4%) | 82 (8.6%) |
| Foreign Born, not a Citizen | 104 (81.9%) | 23 (18.1%) |
Health Insurance Coverage by Household Income in Devine
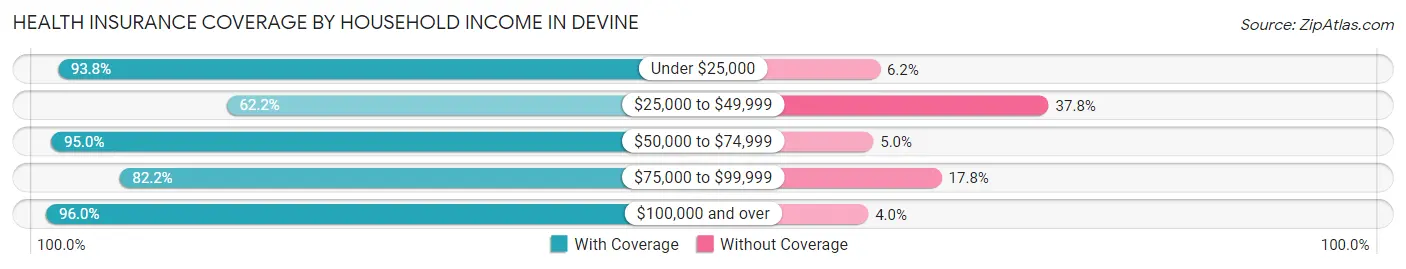
| Household Income | With Coverage | Without Coverage |
| Under $25,000 | 965 (93.8%) | 64 (6.2%) |
| $25,000 to $49,999 | 365 (62.2%) | 222 (37.8%) |
| $50,000 to $74,999 | 767 (95.0%) | 40 (5.0%) |
| $75,000 to $99,999 | 347 (82.2%) | 75 (17.8%) |
| $100,000 and over | 1,362 (96.0%) | 57 (4.0%) |
Public vs Private Health Insurance Coverage by Age in Devine
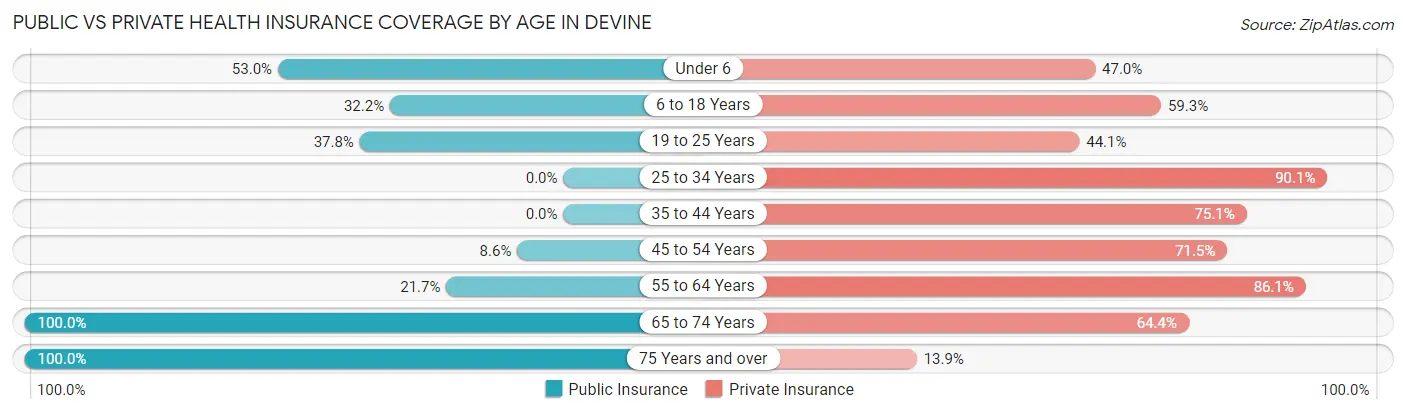
| Age Bracket | Public Insurance | Private Insurance |
| Under 6 | 160 (53.0%) | 142 (47.0%) |
| 6 to 18 Years | 308 (32.2%) | 567 (59.3%) |
| 19 to 25 Years | 48 (37.8%) | 56 (44.1%) |
| 25 to 34 Years | 0 (0.0%) | 364 (90.1%) |
| 35 to 44 Years | 0 (0.0%) | 293 (75.1%) |
| 45 to 54 Years | 65 (8.6%) | 543 (71.5%) |
| 55 to 64 Years | 136 (21.7%) | 539 (86.1%) |
| 65 to 74 Years | 368 (100.0%) | 237 (64.4%) |
| 75 Years and over | 331 (100.0%) | 46 (13.9%) |
| Total | 1,416 (33.2%) | 2,787 (65.4%) |
Disability Status by Sex by Age in Devine
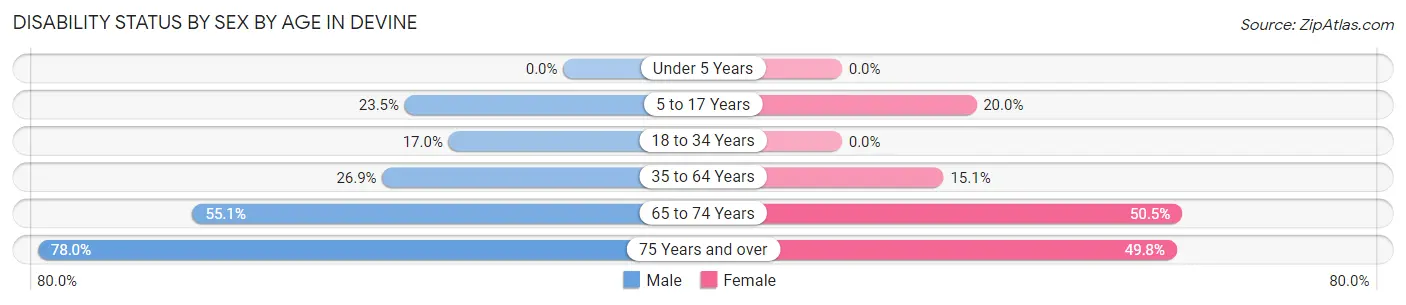
| Age Bracket | Male | Female |
| Under 5 Years | 0 (0.0%) | 0 (0.0%) |
| 5 to 17 Years | 116 (23.5%) | 94 (20.0%) |
| 18 to 34 Years | 48 (17.0%) | 0 (0.0%) |
| 35 to 64 Years | 217 (26.9%) | 146 (15.1%) |
| 65 to 74 Years | 98 (55.1%) | 96 (50.5%) |
| 75 Years and over | 103 (78.0%) | 99 (49.7%) |
Disability Class by Sex by Age in Devine
Disability Class: Hearing Difficulty
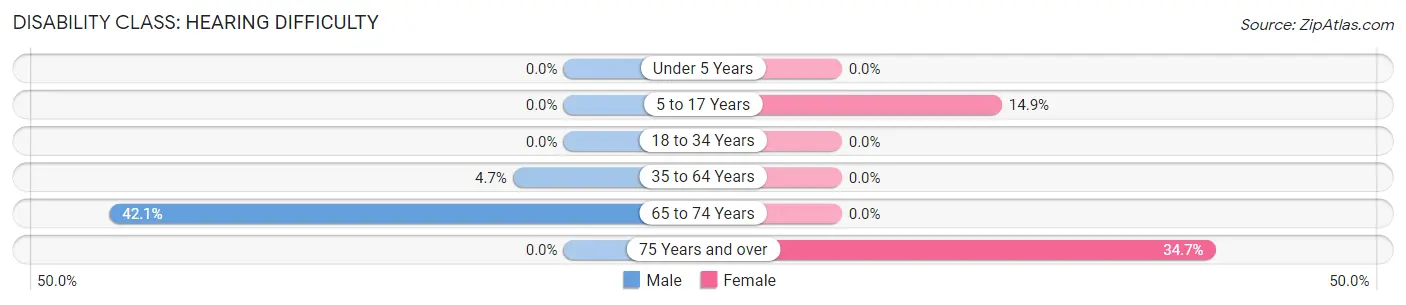
| Age Bracket | Male | Female |
| Under 5 Years | 0 (0.0%) | 0 (0.0%) |
| 5 to 17 Years | 0 (0.0%) | 70 (14.9%) |
| 18 to 34 Years | 0 (0.0%) | 0 (0.0%) |
| 35 to 64 Years | 38 (4.7%) | 0 (0.0%) |
| 65 to 74 Years | 75 (42.1%) | 0 (0.0%) |
| 75 Years and over | 0 (0.0%) | 69 (34.7%) |
Disability Class: Vision Difficulty
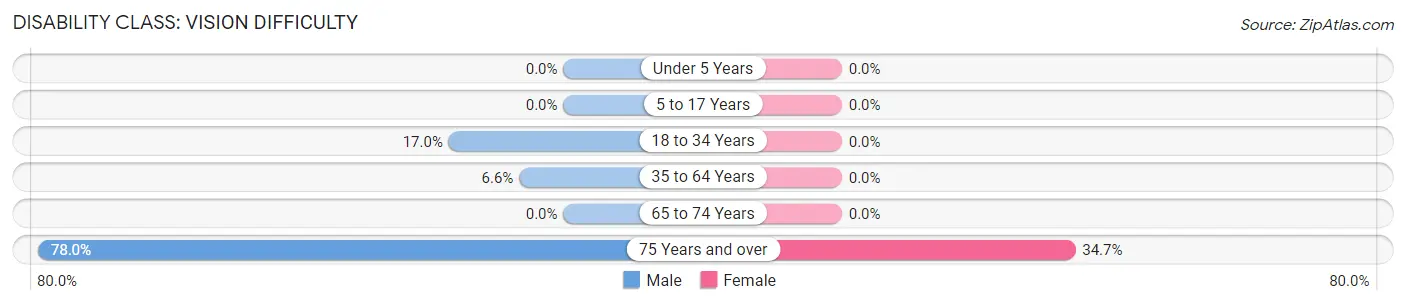
| Age Bracket | Male | Female |
| Under 5 Years | 0 (0.0%) | 0 (0.0%) |
| 5 to 17 Years | 0 (0.0%) | 0 (0.0%) |
| 18 to 34 Years | 48 (17.0%) | 0 (0.0%) |
| 35 to 64 Years | 53 (6.6%) | 0 (0.0%) |
| 65 to 74 Years | 0 (0.0%) | 0 (0.0%) |
| 75 Years and over | 103 (78.0%) | 69 (34.7%) |
Disability Class: Cognitive Difficulty
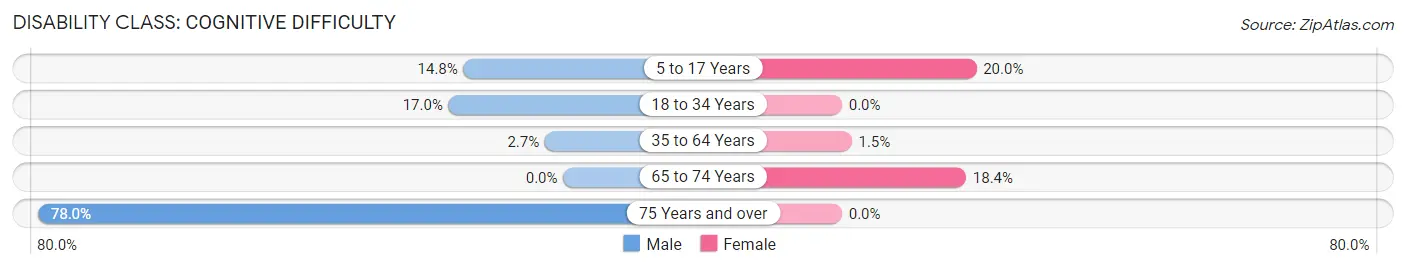
| Age Bracket | Male | Female |
| 5 to 17 Years | 73 (14.8%) | 94 (20.0%) |
| 18 to 34 Years | 48 (17.0%) | 0 (0.0%) |
| 35 to 64 Years | 22 (2.7%) | 14 (1.5%) |
| 65 to 74 Years | 0 (0.0%) | 35 (18.4%) |
| 75 Years and over | 103 (78.0%) | 0 (0.0%) |
Disability Class: Ambulatory Difficulty
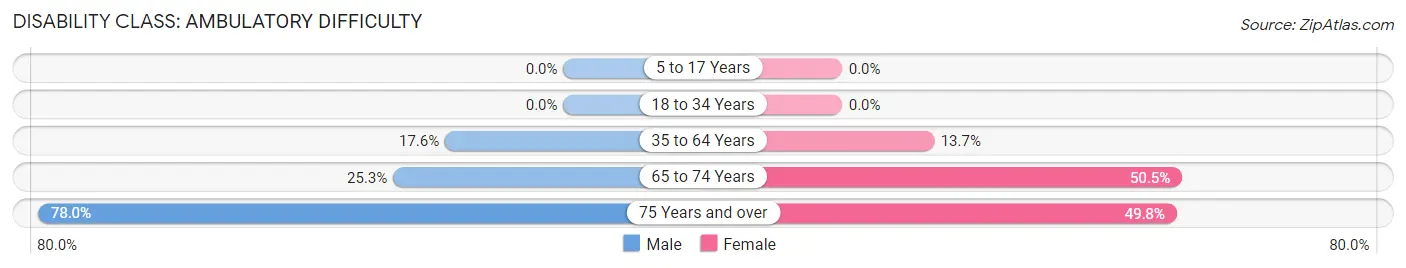
| Age Bracket | Male | Female |
| 5 to 17 Years | 0 (0.0%) | 0 (0.0%) |
| 18 to 34 Years | 0 (0.0%) | 0 (0.0%) |
| 35 to 64 Years | 142 (17.6%) | 132 (13.7%) |
| 65 to 74 Years | 45 (25.3%) | 96 (50.5%) |
| 75 Years and over | 103 (78.0%) | 99 (49.7%) |
Disability Class: Self-Care Difficulty
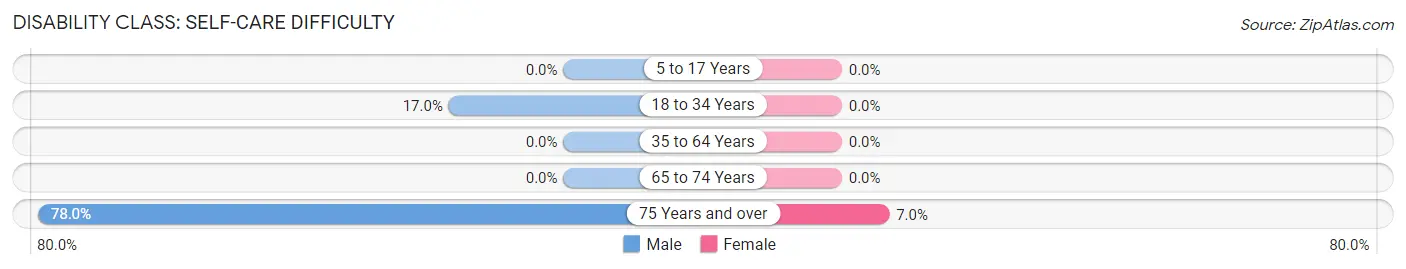
| Age Bracket | Male | Female |
| 5 to 17 Years | 0 (0.0%) | 0 (0.0%) |
| 18 to 34 Years | 48 (17.0%) | 0 (0.0%) |
| 35 to 64 Years | 0 (0.0%) | 0 (0.0%) |
| 65 to 74 Years | 0 (0.0%) | 0 (0.0%) |
| 75 Years and over | 103 (78.0%) | 14 (7.0%) |
Technology Access in Devine
Computing Device Access in Devine
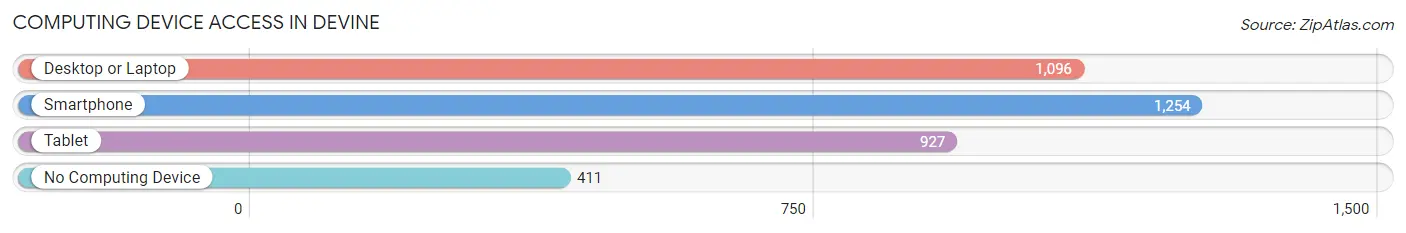
| Device Type | # Households | % Households |
| Desktop or Laptop | 1,096 | 61.8% |
| Smartphone | 1,254 | 70.7% |
| Tablet | 927 | 52.2% |
| No Computing Device | 411 | 23.2% |
| Total | 1,774 | 100.0% |
Internet Access in Devine
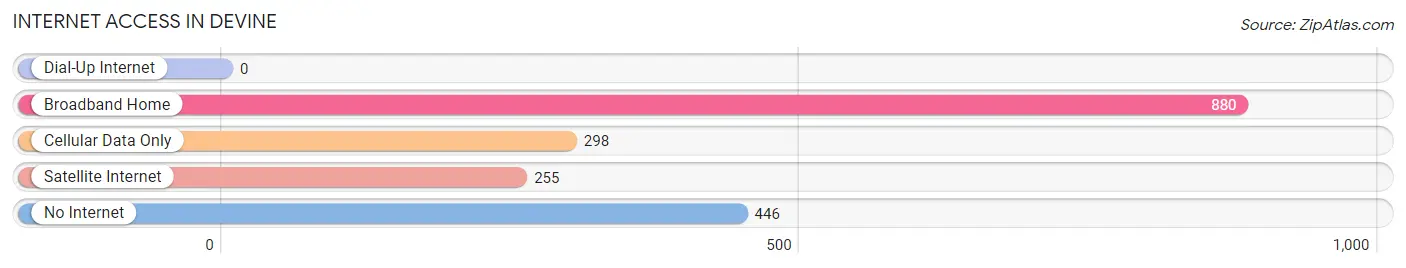
| Internet Type | # Households | % Households |
| Dial-Up Internet | 0 | 0.0% |
| Broadband Home | 880 | 49.6% |
| Cellular Data Only | 298 | 16.8% |
| Satellite Internet | 255 | 14.4% |
| No Internet | 446 | 25.1% |
| Total | 1,774 | 100.0% |
Devine Summary
Devine is a small city located in Medina County, Texas, United States. It is situated about 30 miles southwest of San Antonio and is part of the San Antonio–New Braunfels Metropolitan Statistical Area. The population of Devine was 4,350 at the 2010 census.
History
The area that is now Devine was first settled in the late 1800s by German and Czech immigrants. The town was originally called “Devine City” after the Devine family, who were among the first settlers. The town was officially incorporated in 1910.
In the early 1900s, Devine was a thriving agricultural community, with cotton, corn, and sorghum being the main crops. The town also had a number of businesses, including a bank, a hotel, a movie theater, and a number of stores.
In the 1950s, the town began to decline as many of the businesses closed and the population began to decline. However, in the late 1970s, the town began to experience a resurgence as new businesses opened and the population began to grow again.
Geography
Devine is located at 29°10'25" North, 98°54'45" West (29.173611, -98.9125). According to the United States Census Bureau, the city has a total area of 2.3 square miles, all of it land.
Economy
The economy of Devine is largely based on agriculture. The town is home to a number of farms, which produce cotton, corn, sorghum, and other crops. The town also has a number of businesses, including a bank, a hotel, a movie theater, and a number of stores.
Demographics
As of the 2010 census, there were 4,350 people, 1,541 households, and 1,093 families residing in the city. The population density was 1,890.7 people per square mile. The racial makeup of the city was 79.2% White, 0.7% African American, 0.7% Native American, 0.3% Asian, 0.1% Pacific Islander, 16.7% from other races, and 2.3% from two or more races. Hispanic or Latino of any race were 57.2% of the population.
The median income for a household in the city was $31,250, and the median income for a family was $37,500. Males had a median income of $27,500 versus $20,000 for females. The per capita income for the city was $14,845. About 17.2% of families and 20.2% of the population were below the poverty line, including 28.2% of those under age 18 and 15.2% of those age 65 or over.
Conclusion
Devine is a small city located in Medina County, Texas, United States. It is situated about 30 miles southwest of San Antonio and is part of the San Antonio–New Braunfels Metropolitan Statistical Area. The population of Devine was 4,350 at the 2010 census. The economy of Devine is largely based on agriculture, with cotton, corn, sorghum, and other crops being the main crops. The town also has a number of businesses, including a bank, a hotel, a movie theater, and a number of stores. The racial makeup of the city was 79.2% White, 0.7% African American, 0.7% Native American, 0.3% Asian, 0.1% Pacific Islander, 16.7% from other races, and 2.3% from two or more races. Hispanic or Latino of any race were 57.2% of the population. The median income for a household in the city was $31,250, and the median income for a family was $37,500.
Common Questions
What is Per Capita Income in Devine?
Per Capita income in Devine is $30,619.
What is the Median Family Income in Devine?
Median Family Income in Devine is $58,411.
What is the Median Household income in Devine?
Median Household Income in Devine is $45,616.
What is Income or Wage Gap in Devine?
Income or Wage Gap in Devine is 21.3%.
Women in Devine earn 78.7 cents for every dollar earned by a man.
What is Inequality or Gini Index in Devine?
Inequality or Gini Index in Devine is 0.59.
What is the Total Population of Devine?
Total Population of Devine is 4,375.
What is the Total Male Population of Devine?
Total Male Population of Devine is 2,067.
What is the Total Female Population of Devine?
Total Female Population of Devine is 2,308.
What is the Ratio of Males per 100 Females in Devine?
There are 89.56 Males per 100 Females in Devine.
What is the Ratio of Females per 100 Males in Devine?
There are 111.66 Females per 100 Males in Devine.
What is the Median Population Age in Devine?
Median Population Age in Devine is 45.0 Years.
What is the Average Family Size in Devine
Average Family Size in Devine is 3.0 People.
What is the Average Household Size in Devine
Average Household Size in Devine is 2.4 People.
How Large is the Labor Force in Devine?
There are 1,932 People in the Labor Forcein in Devine.
What is the Percentage of People in the Labor Force in Devine?
57.4% of People are in the Labor Force in Devine.