Mingus, TX Map & Demographics
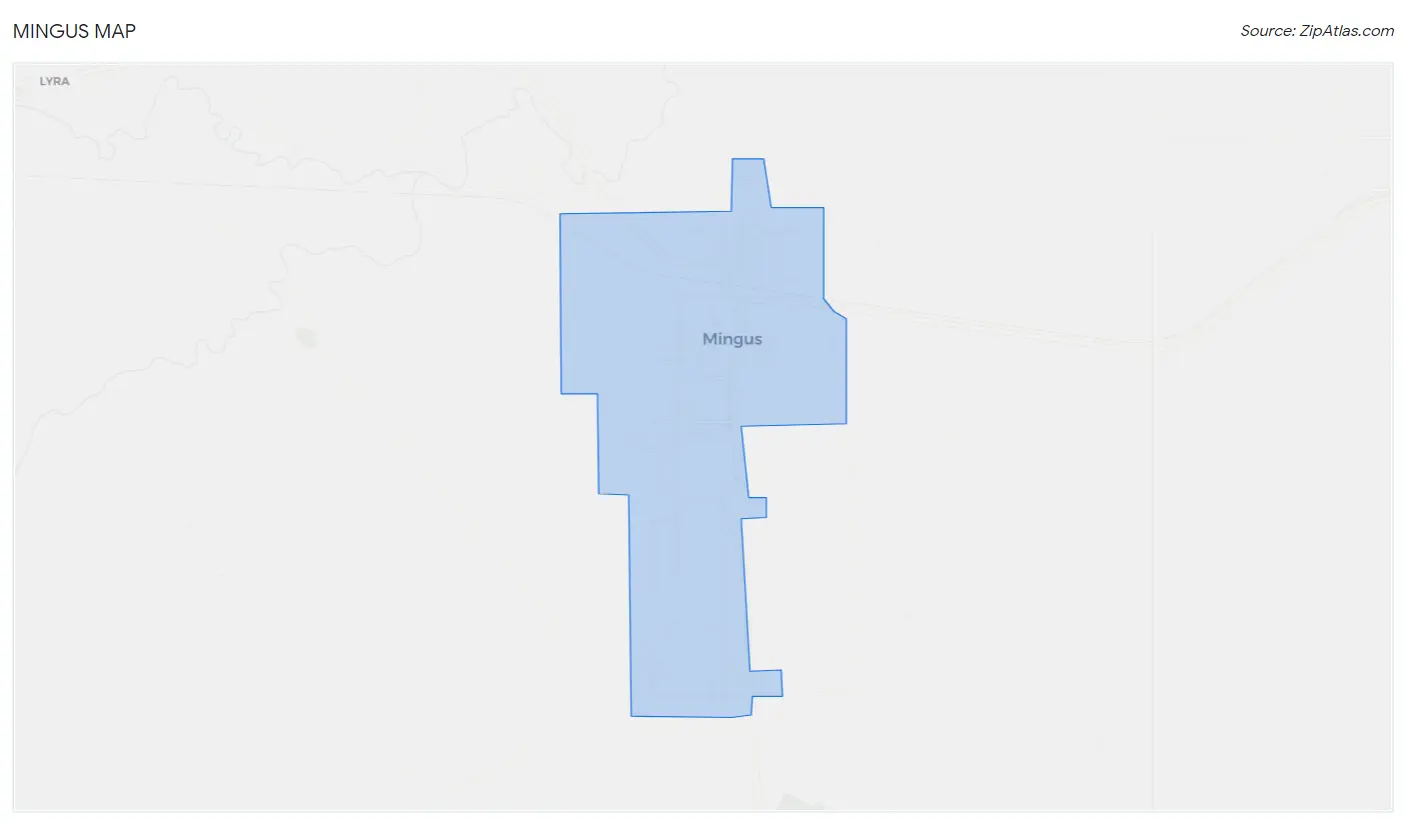
Mingus Map
Mingus Overview
$26,748
PER CAPITA INCOME
$81,250
AVG FAMILY INCOME
$46,250
AVG HOUSEHOLD INCOME
0.40
INEQUALITY / GINI INDEX
301
TOTAL POPULATION
173
MALE POPULATION
128
FEMALE POPULATION
135.16
MALES / 100 FEMALES
73.99
FEMALES / 100 MALES
56.7
MEDIAN AGE
3.1
AVG FAMILY SIZE
2.2
AVG HOUSEHOLD SIZE
144
LABOR FORCE [ PEOPLE ]
53.5%
PERCENT IN LABOR FORCE
2.8%
UNEMPLOYMENT RATE
Mingus Zip Codes
Income in Mingus
Income Overview in Mingus
Per Capita Income in Mingus is $26,748, while median incomes of families and households are $81,250 and $46,250 respectively.
| Characteristic | Number | Measure |
| Per Capita Income | 301 | $26,748 |
| Median Family Income | 66 | $81,250 |
| Mean Family Income | 66 | $69,838 |
| Median Household Income | 137 | $46,250 |
| Mean Household Income | 137 | $56,396 |
| Income Deficit | 66 | $0 |
| Wage / Income Gap (%) | 301 | 0.00% |
| Wage / Income Gap ($) | 301 | 100.00¢ per $1 |
| Gini / Inequality Index | 301 | 0.40 |
Earnings by Sex in Mingus
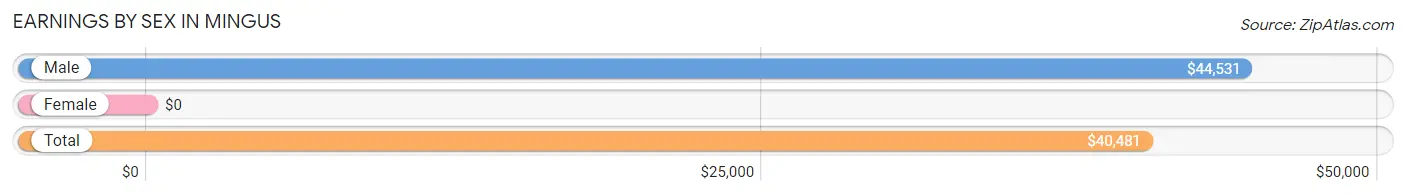
| Sex | Number | Average Earnings |
| Male | 97 (65.1%) | $44,531 |
| Female | 52 (34.9%) | $0 |
| Total | 149 (100.0%) | $40,481 |
Earnings by Sex by Income Bracket in Mingus
The most common earnings brackets in Mingus are $40,000 to $44,999 for men (21 | 21.6%) and $2,499 or less for women (21 | 40.4%).
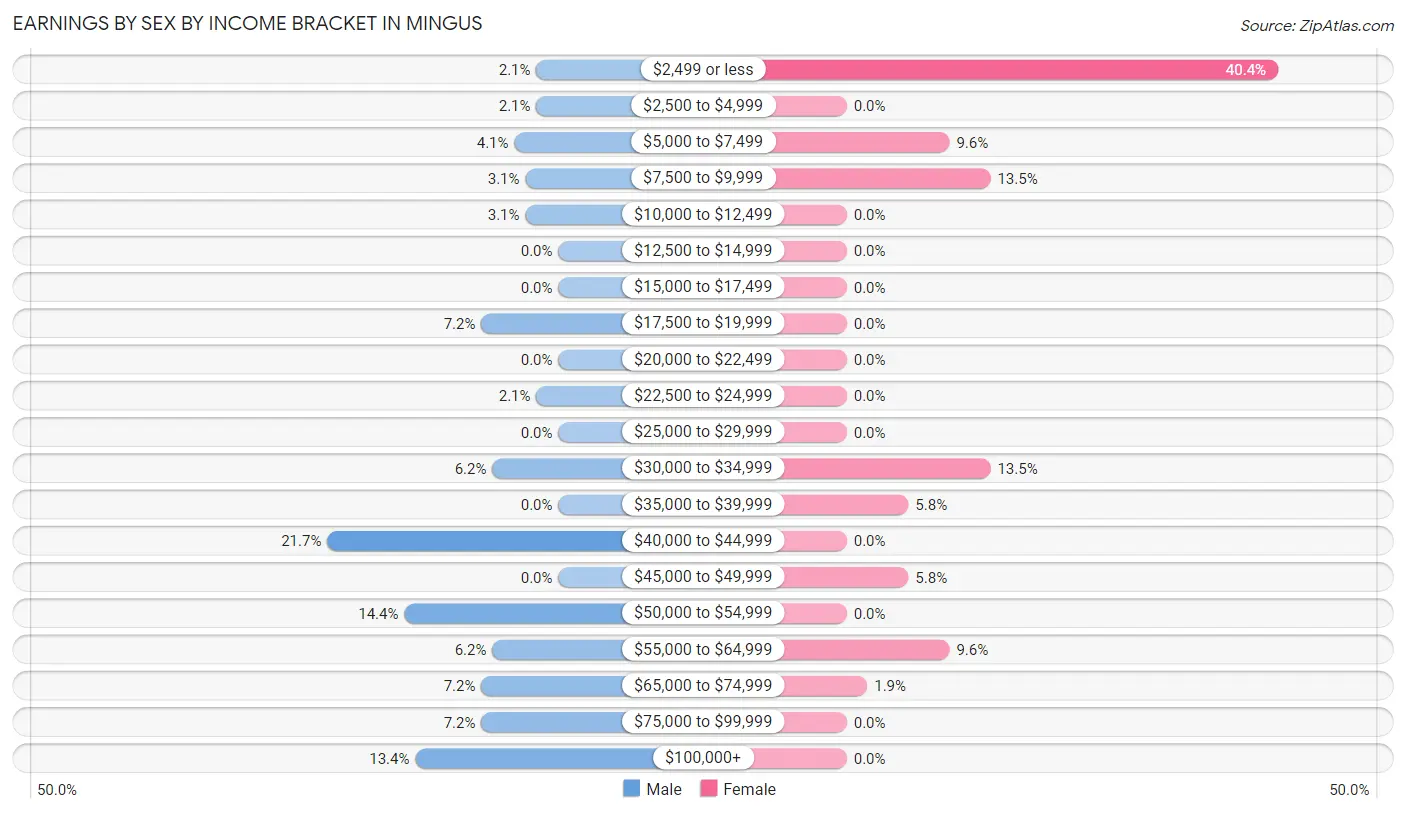
| Income | Male | Female |
| $2,499 or less | 2 (2.1%) | 21 (40.4%) |
| $2,500 to $4,999 | 2 (2.1%) | 0 (0.0%) |
| $5,000 to $7,499 | 4 (4.1%) | 5 (9.6%) |
| $7,500 to $9,999 | 3 (3.1%) | 7 (13.5%) |
| $10,000 to $12,499 | 3 (3.1%) | 0 (0.0%) |
| $12,500 to $14,999 | 0 (0.0%) | 0 (0.0%) |
| $15,000 to $17,499 | 0 (0.0%) | 0 (0.0%) |
| $17,500 to $19,999 | 7 (7.2%) | 0 (0.0%) |
| $20,000 to $22,499 | 0 (0.0%) | 0 (0.0%) |
| $22,500 to $24,999 | 2 (2.1%) | 0 (0.0%) |
| $25,000 to $29,999 | 0 (0.0%) | 0 (0.0%) |
| $30,000 to $34,999 | 6 (6.2%) | 7 (13.5%) |
| $35,000 to $39,999 | 0 (0.0%) | 3 (5.8%) |
| $40,000 to $44,999 | 21 (21.6%) | 0 (0.0%) |
| $45,000 to $49,999 | 0 (0.0%) | 3 (5.8%) |
| $50,000 to $54,999 | 14 (14.4%) | 0 (0.0%) |
| $55,000 to $64,999 | 6 (6.2%) | 5 (9.6%) |
| $65,000 to $74,999 | 7 (7.2%) | 1 (1.9%) |
| $75,000 to $99,999 | 7 (7.2%) | 0 (0.0%) |
| $100,000+ | 13 (13.4%) | 0 (0.0%) |
| Total | 97 (100.0%) | 52 (100.0%) |
Earnings by Sex by Educational Attainment in Mingus
Average earnings in Mingus are $44,531 for men and $33,393 for women, a difference of 25.0%. Men with an educational attainment of high school diploma enjoy the highest average annual earnings of $56,875, while those with less than high school education earn the least with $33,750. Women with an educational attainment of college or associate's degree earn the most with the average annual earnings of $33,750, while those with college or associate's degree education have the smallest earnings of $33,750.
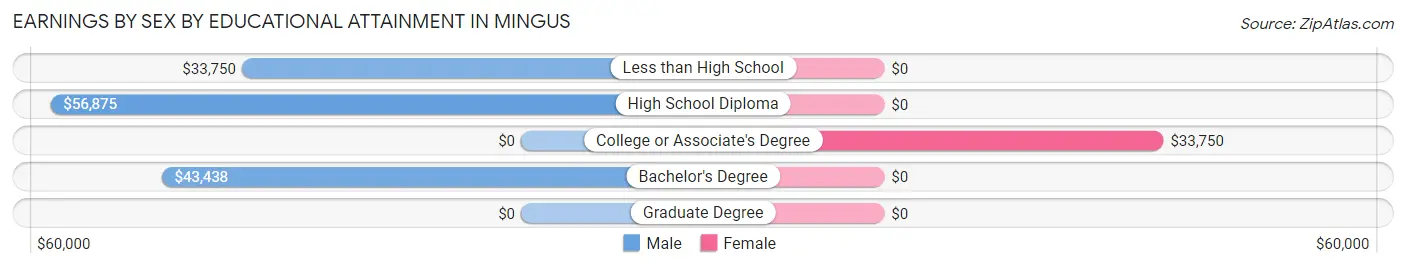
| Educational Attainment | Male Income | Female Income |
| Less than High School | $33,750 | $0 |
| High School Diploma | $56,875 | $0 |
| College or Associate's Degree | - | - |
| Bachelor's Degree | $43,438 | $0 |
| Graduate Degree | - | - |
| Total | $44,531 | $33,393 |
Family Income in Mingus
Family Income Brackets in Mingus
According to the Mingus family income data, there are 18 families falling into the $75,000 to $99,999 income range, which is the most common income bracket and makes up 27.3% of all families.
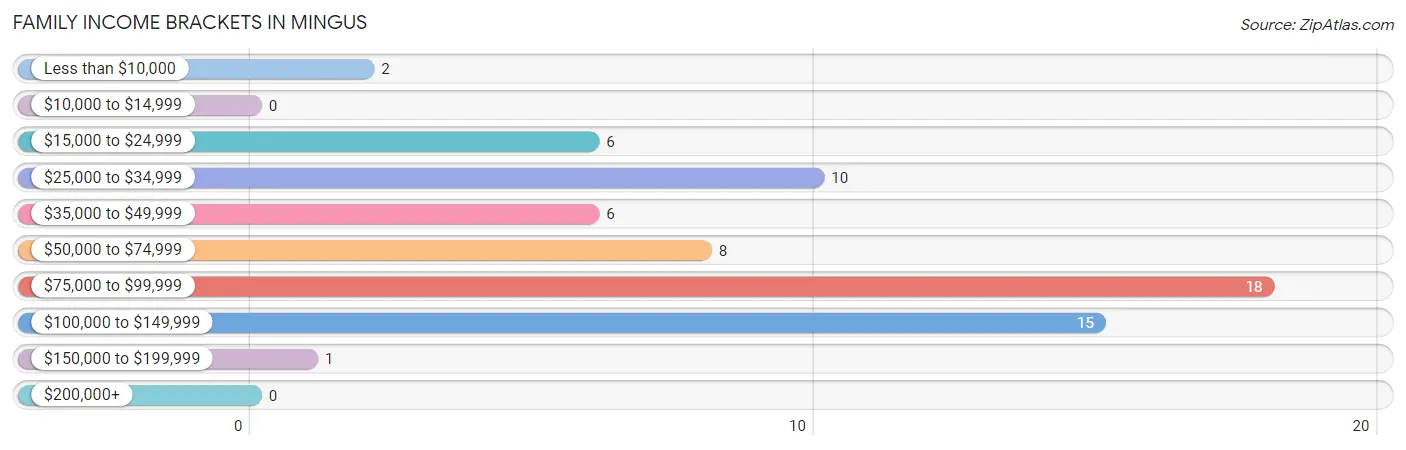
| Income Bracket | # Families | % Families |
| Less than $10,000 | 2 | 3.0% |
| $10,000 to $14,999 | 0 | 0.0% |
| $15,000 to $24,999 | 6 | 9.1% |
| $25,000 to $34,999 | 10 | 15.2% |
| $35,000 to $49,999 | 6 | 9.1% |
| $50,000 to $74,999 | 8 | 12.1% |
| $75,000 to $99,999 | 18 | 27.3% |
| $100,000 to $149,999 | 15 | 22.7% |
| $150,000 to $199,999 | 1 | 1.5% |
| $200,000+ | 0 | 0.0% |
Family Income by Famaliy Size in Mingus
2-person families (46 | 69.7%) account for the highest median family income in Mingus with $56,875 per family, while 2-person families (46 | 69.7%) have the highest median income of $28,438 per family member.
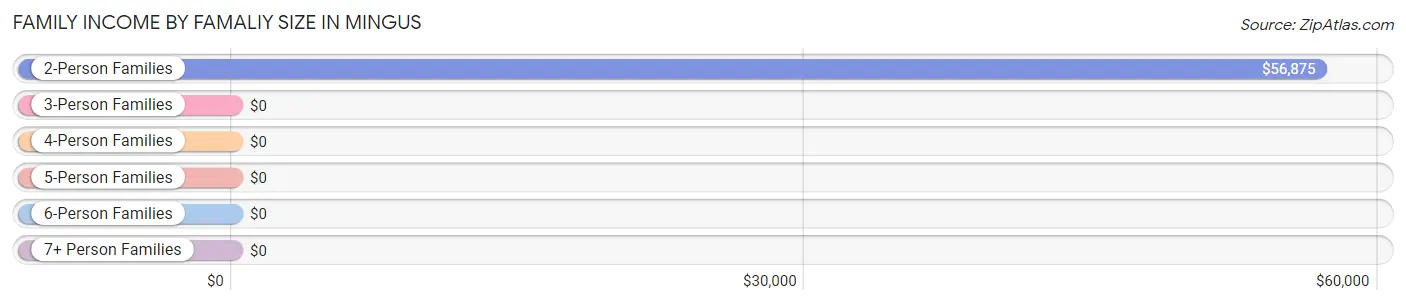
| Income Bracket | # Families | Median Income |
| 2-Person Families | 46 (69.7%) | $56,875 |
| 3-Person Families | 8 (12.1%) | $0 |
| 4-Person Families | 6 (9.1%) | $0 |
| 5-Person Families | 6 (9.1%) | $0 |
| 6-Person Families | 0 (0.0%) | $0 |
| 7+ Person Families | 0 (0.0%) | $0 |
| Total | 66 (100.0%) | $81,250 |
Family Income by Number of Earners in Mingus
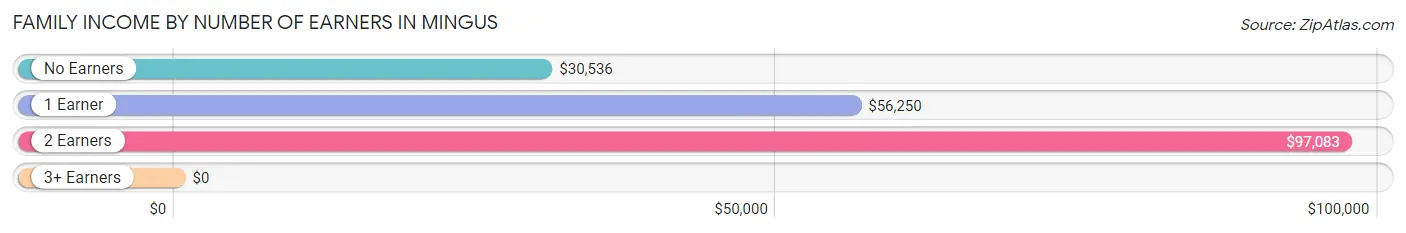
| Number of Earners | # Families | Median Income |
| No Earners | 17 (25.8%) | $30,536 |
| 1 Earner | 22 (33.3%) | $56,250 |
| 2 Earners | 27 (40.9%) | $97,083 |
| 3+ Earners | 0 (0.0%) | $0 |
| Total | 66 (100.0%) | $81,250 |
Household Income in Mingus
Household Income Brackets in Mingus
With 27 households falling in the category, the $100,000 to $149,999 income range is the most frequent in Mingus, accounting for 19.7% of all households.
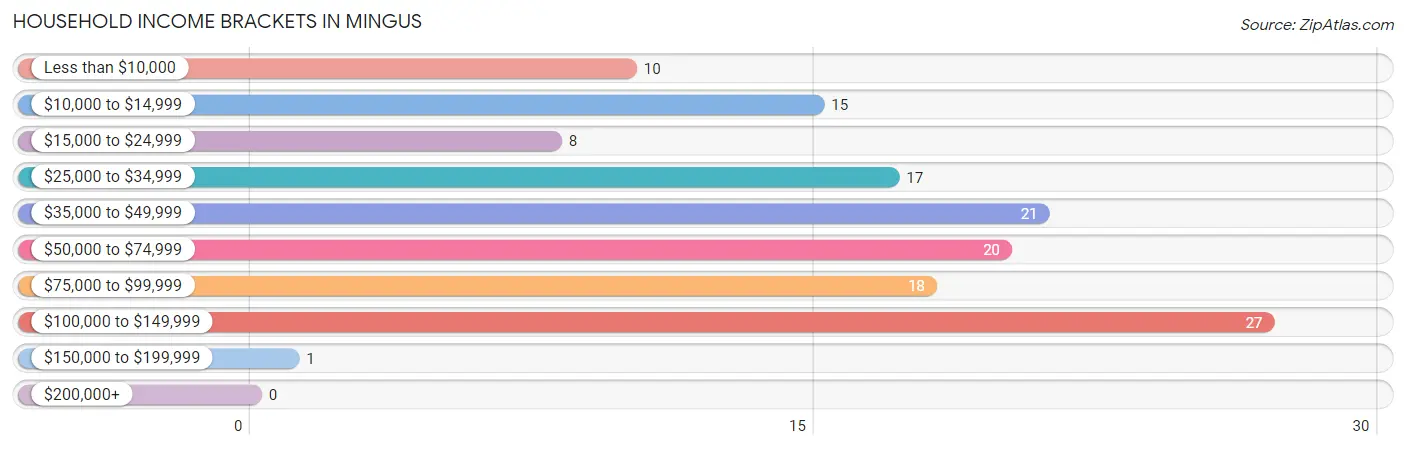
| Income Bracket | # Households | % Households |
| Less than $10,000 | 10 | 7.3% |
| $10,000 to $14,999 | 15 | 10.9% |
| $15,000 to $24,999 | 8 | 5.8% |
| $25,000 to $34,999 | 17 | 12.4% |
| $35,000 to $49,999 | 21 | 15.3% |
| $50,000 to $74,999 | 20 | 14.6% |
| $75,000 to $99,999 | 18 | 13.1% |
| $100,000 to $149,999 | 27 | 19.7% |
| $150,000 to $199,999 | 1 | 0.7% |
| $200,000+ | 0 | 0.0% |
Household Income by Householder Age in Mingus
The median household income in Mingus is $46,250, with the highest median household income of $105,833 found in the 25 to 44 years age bracket for the primary householder. A total of 24 households (17.5%) fall into this category.
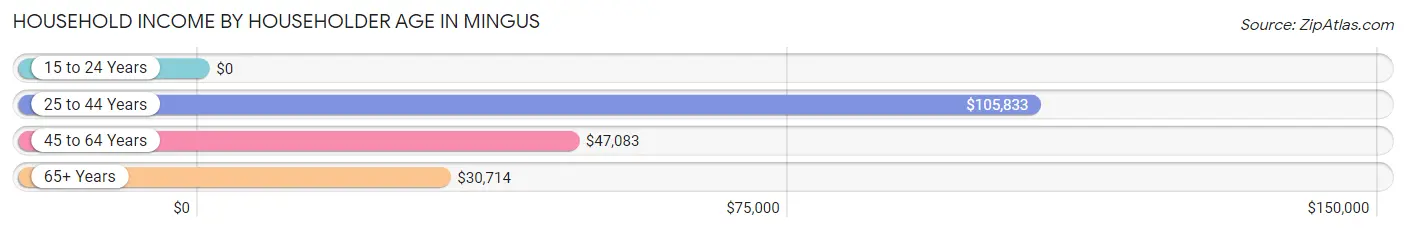
| Income Bracket | # Households | Median Income |
| 15 to 24 Years | 0 (0.0%) | $0 |
| 25 to 44 Years | 24 (17.5%) | $105,833 |
| 45 to 64 Years | 63 (46.0%) | $47,083 |
| 65+ Years | 50 (36.5%) | $30,714 |
| Total | 137 (100.0%) | $46,250 |
Poverty in Mingus
Income Below Poverty by Sex and Age in Mingus
With 8.7% poverty level for males and 23.4% for females among the residents of Mingus, 45 to 54 year old males and 45 to 54 year old females are the most vulnerable to poverty, with 4 males (33.3%) and 8 females (47.1%) in their respective age groups living below the poverty level.
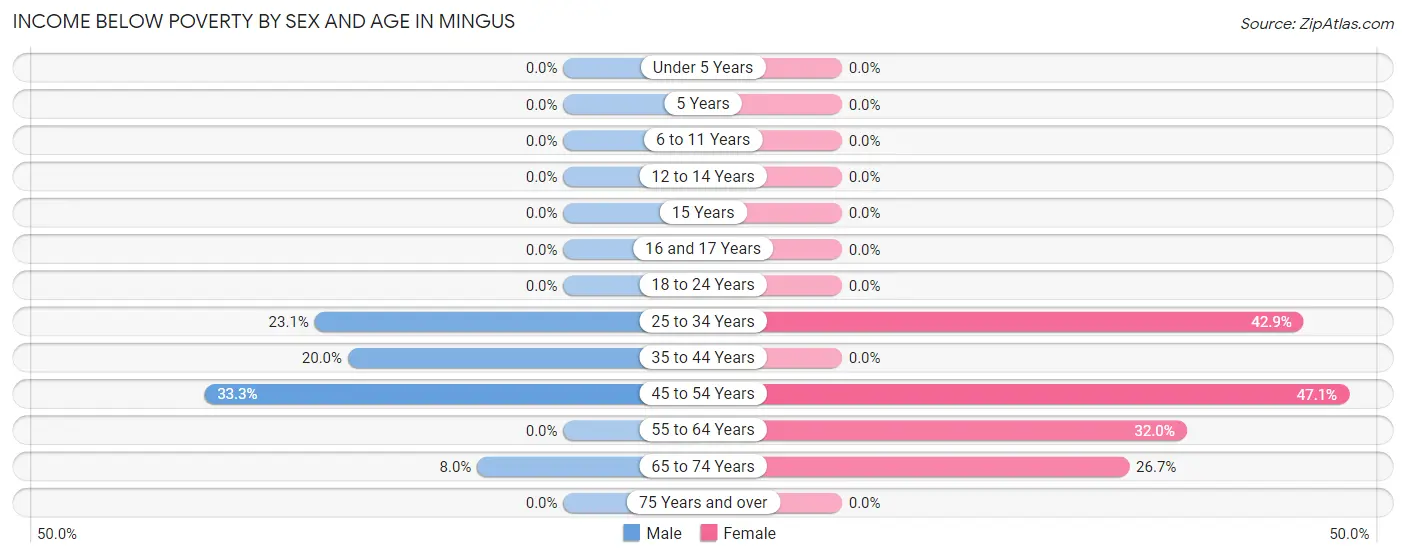
| Age Bracket | Male | Female |
| Under 5 Years | 0 (0.0%) | 0 (0.0%) |
| 5 Years | 0 (0.0%) | 0 (0.0%) |
| 6 to 11 Years | 0 (0.0%) | 0 (0.0%) |
| 12 to 14 Years | 0 (0.0%) | 0 (0.0%) |
| 15 Years | 0 (0.0%) | 0 (0.0%) |
| 16 and 17 Years | 0 (0.0%) | 0 (0.0%) |
| 18 to 24 Years | 0 (0.0%) | 0 (0.0%) |
| 25 to 34 Years | 6 (23.1%) | 6 (42.9%) |
| 35 to 44 Years | 3 (20.0%) | 0 (0.0%) |
| 45 to 54 Years | 4 (33.3%) | 8 (47.1%) |
| 55 to 64 Years | 0 (0.0%) | 8 (32.0%) |
| 65 to 74 Years | 2 (8.0%) | 8 (26.7%) |
| 75 Years and over | 0 (0.0%) | 0 (0.0%) |
| Total | 15 (8.7%) | 30 (23.4%) |
Income Above Poverty by Sex and Age in Mingus
According to the poverty statistics in Mingus, males aged under 5 years and females aged 16 and 17 years are the age groups that are most secure financially, with 100.0% of males and 100.0% of females in these age groups living above the poverty line.
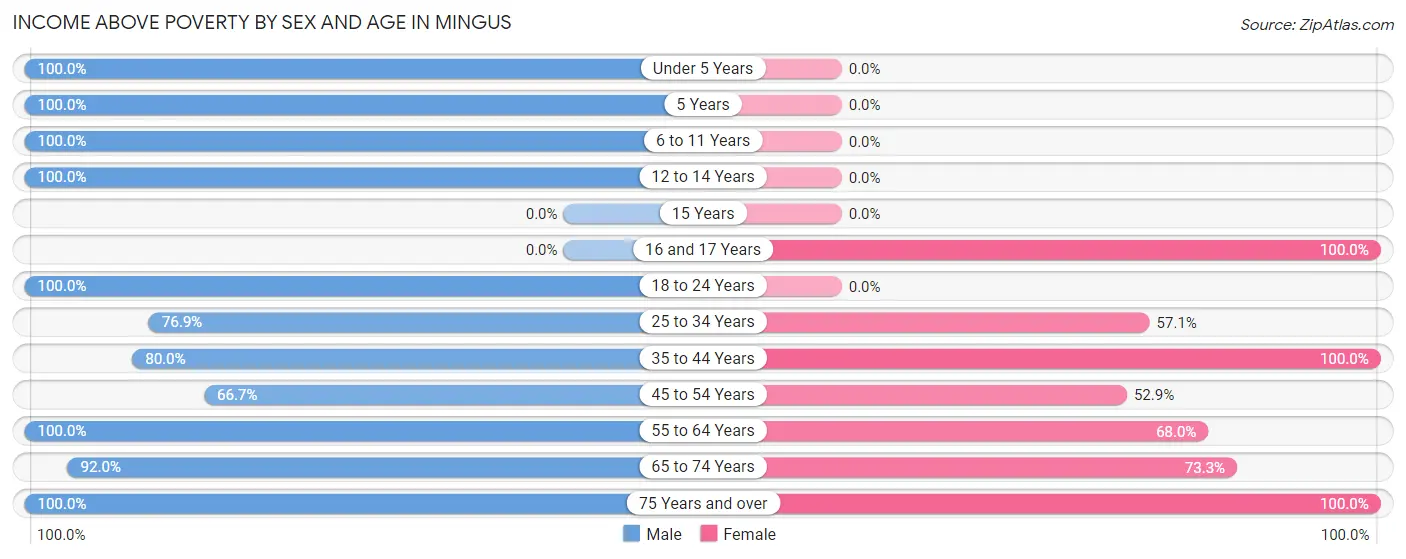
| Age Bracket | Male | Female |
| Under 5 Years | 17 (100.0%) | 0 (0.0%) |
| 5 Years | 3 (100.0%) | 0 (0.0%) |
| 6 to 11 Years | 9 (100.0%) | 0 (0.0%) |
| 12 to 14 Years | 3 (100.0%) | 0 (0.0%) |
| 15 Years | 0 (0.0%) | 0 (0.0%) |
| 16 and 17 Years | 0 (0.0%) | 22 (100.0%) |
| 18 to 24 Years | 3 (100.0%) | 0 (0.0%) |
| 25 to 34 Years | 20 (76.9%) | 8 (57.1%) |
| 35 to 44 Years | 12 (80.0%) | 6 (100.0%) |
| 45 to 54 Years | 8 (66.7%) | 9 (52.9%) |
| 55 to 64 Years | 44 (100.0%) | 17 (68.0%) |
| 65 to 74 Years | 23 (92.0%) | 22 (73.3%) |
| 75 Years and over | 16 (100.0%) | 14 (100.0%) |
| Total | 158 (91.3%) | 98 (76.6%) |
Income Below Poverty Among Married-Couple Families in Mingus
The poverty statistics for married-couple families in Mingus show that 7.3% or 4 of the total 55 families live below the poverty line. Families with no children have the highest poverty rate of 9.5%, comprising of 4 families. On the other hand, families with 1 or 2 children have the lowest poverty rate of 0.0%, which includes 0 families.
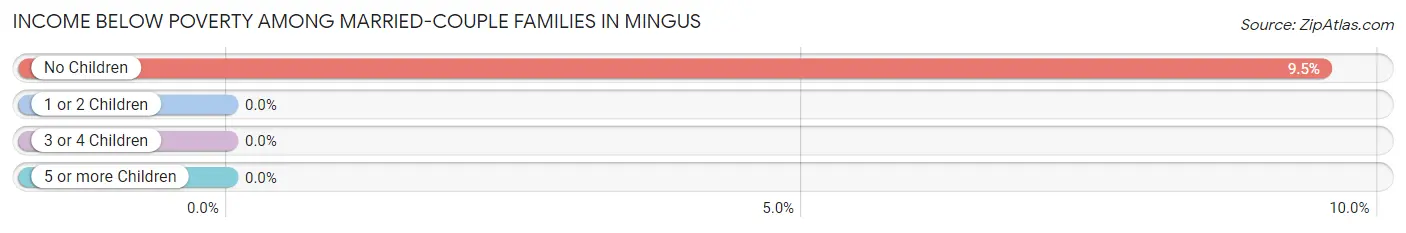
| Children | Above Poverty | Below Poverty |
| No Children | 38 (90.5%) | 4 (9.5%) |
| 1 or 2 Children | 7 (100.0%) | 0 (0.0%) |
| 3 or 4 Children | 6 (100.0%) | 0 (0.0%) |
| 5 or more Children | 0 (0.0%) | 0 (0.0%) |
| Total | 51 (92.7%) | 4 (7.3%) |
Income Below Poverty Among Single-Parent Households in Mingus
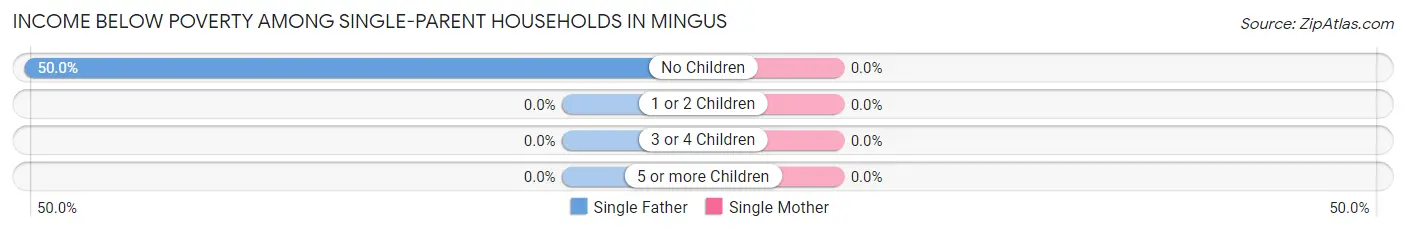
| Children | Single Father | Single Mother |
| No Children | 2 (50.0%) | 0 (0.0%) |
| 1 or 2 Children | 0 (0.0%) | 0 (0.0%) |
| 3 or 4 Children | 0 (0.0%) | 0 (0.0%) |
| 5 or more Children | 0 (0.0%) | 0 (0.0%) |
| Total | 2 (25.0%) | 0 (0.0%) |
Income Below Poverty Among Married-Couple vs Single-Parent Households in Mingus
The poverty data for Mingus shows that 4 of the married-couple family households (7.3%) and 2 of the single-parent households (18.2%) are living below the poverty level. Within the married-couple family households, those with no children have the highest poverty rate, with 4 households (9.5%) falling below the poverty line. Among the single-parent households, those with no children have the highest poverty rate, with 2 household (50.0%) living below poverty.
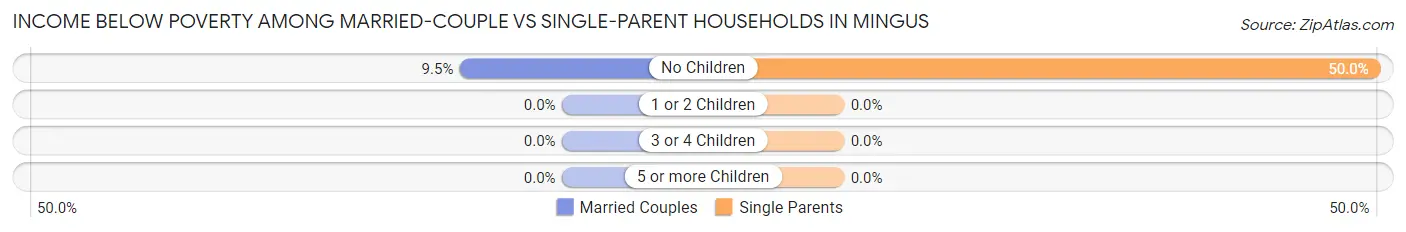
| Children | Married-Couple Families | Single-Parent Households |
| No Children | 4 (9.5%) | 2 (50.0%) |
| 1 or 2 Children | 0 (0.0%) | 0 (0.0%) |
| 3 or 4 Children | 0 (0.0%) | 0 (0.0%) |
| 5 or more Children | 0 (0.0%) | 0 (0.0%) |
| Total | 4 (7.3%) | 2 (18.2%) |
Race in Mingus
The most populous races in Mingus are White / Caucasian (234 | 77.7%), Hispanic or Latino (74 | 24.6%), and Two or more Races (61 | 20.3%).
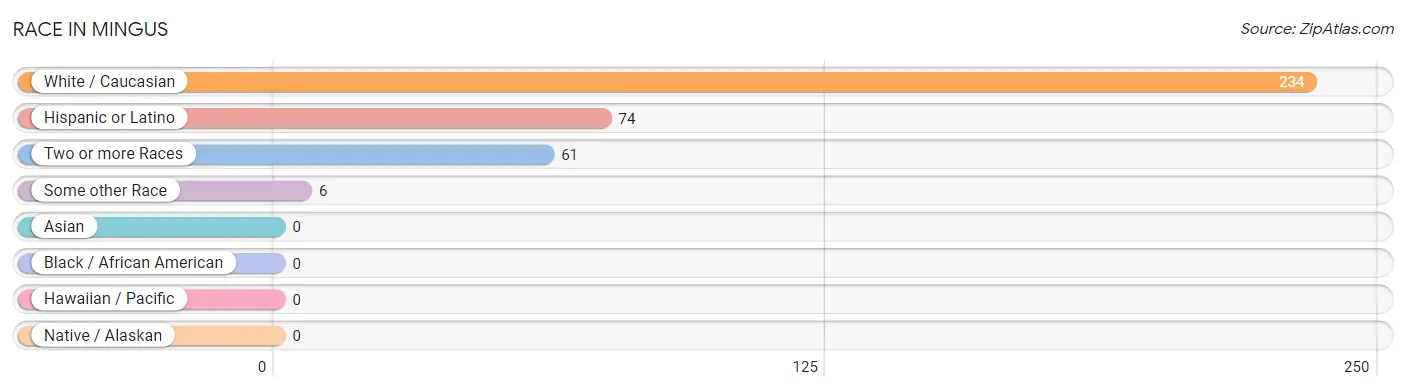
| Race | # Population | % Population |
| Asian | 0 | 0.0% |
| Black / African American | 0 | 0.0% |
| Hawaiian / Pacific | 0 | 0.0% |
| Hispanic or Latino | 74 | 24.6% |
| Native / Alaskan | 0 | 0.0% |
| White / Caucasian | 234 | 77.7% |
| Two or more Races | 61 | 20.3% |
| Some other Race | 6 | 2.0% |
| Total | 301 | 100.0% |
Ancestry in Mingus
The most populous ancestries reported in Mingus are Mexican (48 | 16.0%), American (28 | 9.3%), German (20 | 6.6%), Irish (20 | 6.6%), and Central American (19 | 6.3%), together accounting for 44.8% of all Mingus residents.

| Ancestry | # Population | % Population |
| American | 28 | 9.3% |
| Central American | 19 | 6.3% |
| Cherokee | 4 | 1.3% |
| Cuban | 7 | 2.3% |
| Dutch | 3 | 1.0% |
| English | 17 | 5.7% |
| German | 20 | 6.6% |
| Guatemalan | 19 | 6.3% |
| Irish | 20 | 6.6% |
| Italian | 11 | 3.6% |
| Mexican | 48 | 16.0% |
| Osage | 4 | 1.3% |
| Scottish | 2 | 0.7% | View All 13 Rows |
Immigrants in Mingus
The most numerous immigrant groups reported in Mingus came from Latin America (24 | 8.0%), Central America (17 | 5.7%), Mexico (17 | 5.7%), Caribbean (7 | 2.3%), and Cuba (7 | 2.3%), together accounting for 23.9% of all Mingus residents.
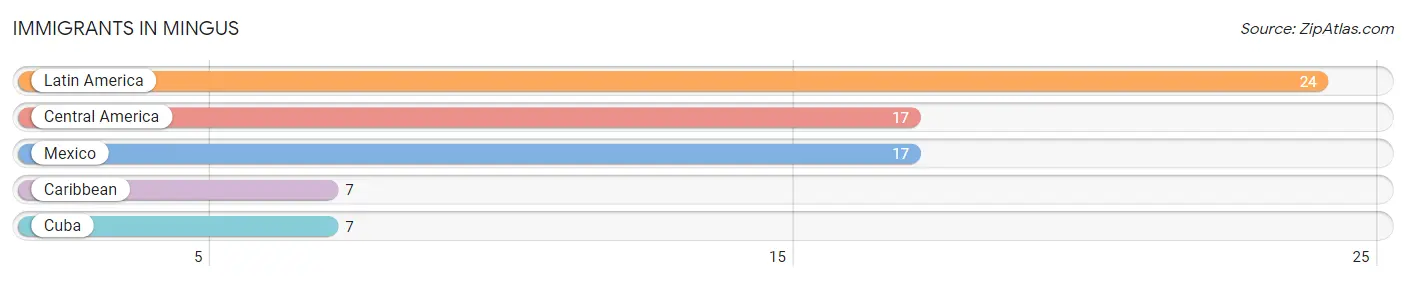
| Immigration Origin | # Population | % Population |
| Caribbean | 7 | 2.3% |
| Central America | 17 | 5.7% |
| Cuba | 7 | 2.3% |
| Latin America | 24 | 8.0% |
| Mexico | 17 | 5.7% | View All 5 Rows |
Sex and Age in Mingus
Sex and Age in Mingus
The most populous age groups in Mingus are 60 to 64 Years (32 | 18.5%) for men and 15 to 19 Years (22 | 17.2%) for women.
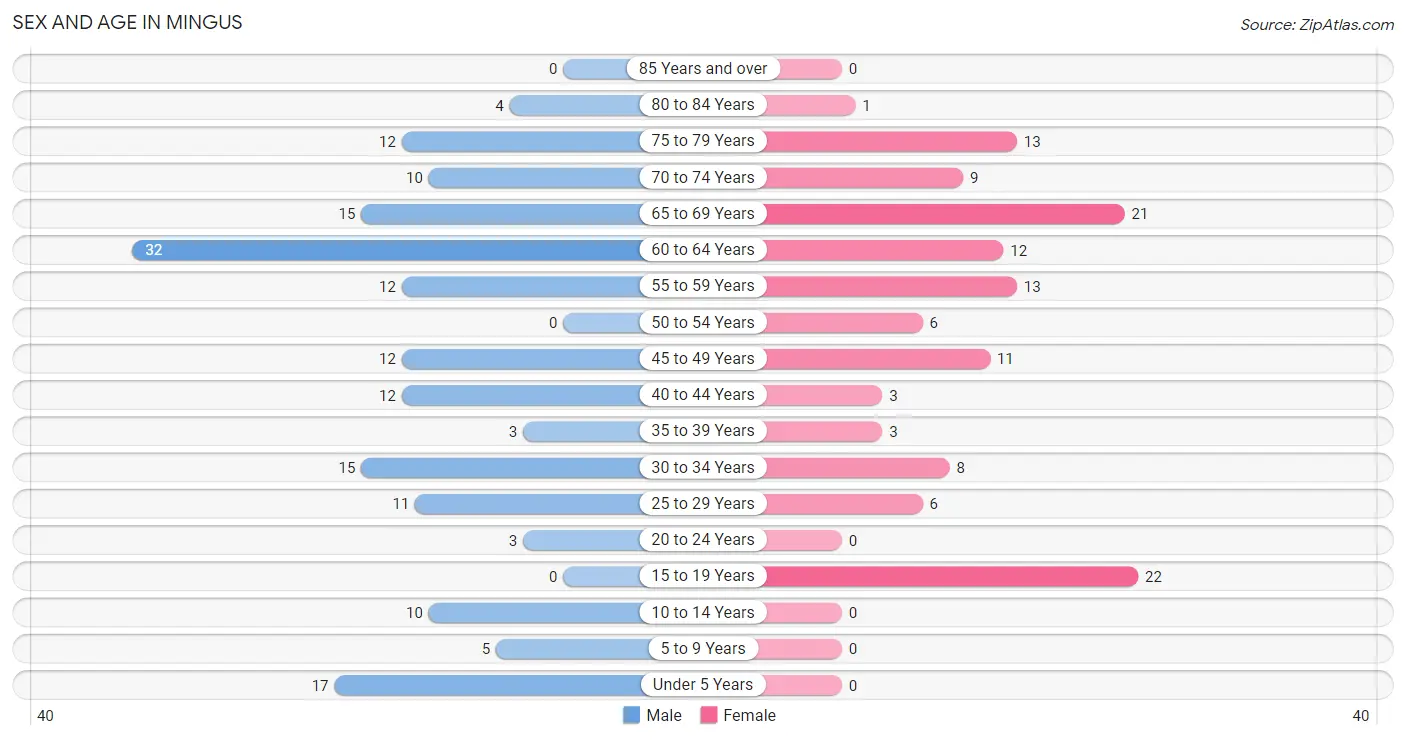
| Age Bracket | Male | Female |
| Under 5 Years | 17 (9.8%) | 0 (0.0%) |
| 5 to 9 Years | 5 (2.9%) | 0 (0.0%) |
| 10 to 14 Years | 10 (5.8%) | 0 (0.0%) |
| 15 to 19 Years | 0 (0.0%) | 22 (17.2%) |
| 20 to 24 Years | 3 (1.7%) | 0 (0.0%) |
| 25 to 29 Years | 11 (6.4%) | 6 (4.7%) |
| 30 to 34 Years | 15 (8.7%) | 8 (6.2%) |
| 35 to 39 Years | 3 (1.7%) | 3 (2.3%) |
| 40 to 44 Years | 12 (6.9%) | 3 (2.3%) |
| 45 to 49 Years | 12 (6.9%) | 11 (8.6%) |
| 50 to 54 Years | 0 (0.0%) | 6 (4.7%) |
| 55 to 59 Years | 12 (6.9%) | 13 (10.2%) |
| 60 to 64 Years | 32 (18.5%) | 12 (9.4%) |
| 65 to 69 Years | 15 (8.7%) | 21 (16.4%) |
| 70 to 74 Years | 10 (5.8%) | 9 (7.0%) |
| 75 to 79 Years | 12 (6.9%) | 13 (10.2%) |
| 80 to 84 Years | 4 (2.3%) | 1 (0.8%) |
| 85 Years and over | 0 (0.0%) | 0 (0.0%) |
| Total | 173 (100.0%) | 128 (100.0%) |
Families and Households in Mingus
Median Family Size in Mingus
The median family size in Mingus is 3.06 persons per family, with married-couple families (55 | 83.3%) accounting for the largest median family size of 3.13 persons per family. On the other hand, single female/mother families (3 | 4.5%) represent the smallest median family size with 2.00 persons per family.
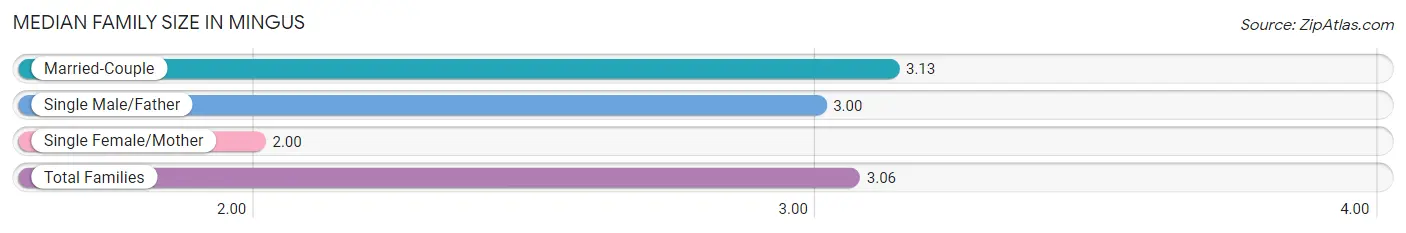
| Family Type | # Families | Family Size |
| Married-Couple | 55 (83.3%) | 3.13 |
| Single Male/Father | 8 (12.1%) | 3.00 |
| Single Female/Mother | 3 (4.5%) | 2.00 |
| Total Families | 66 (100.0%) | 3.06 |
Median Household Size in Mingus
The median household size in Mingus is 2.20 persons per household, with single male/father households (8 | 5.8%) accounting for the largest median household size of 4.5 persons per household. non-family households (71 | 51.8%) represent the smallest median household size with 1.14 persons per household.
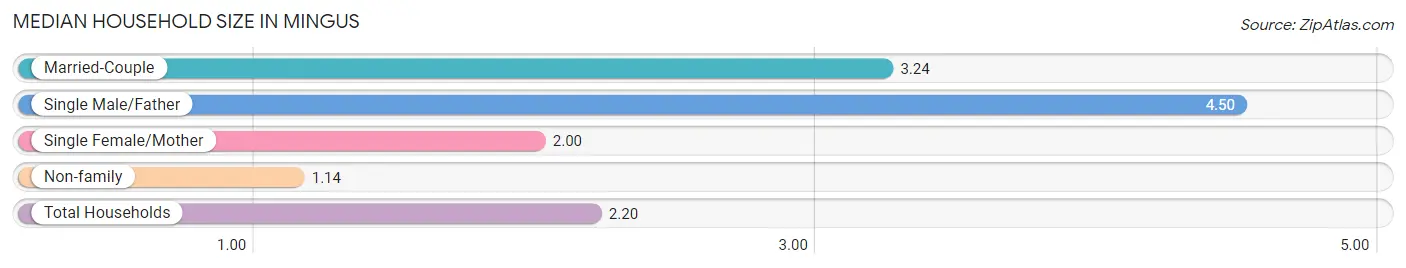
| Household Type | # Households | Household Size |
| Married-Couple | 55 (40.2%) | 3.24 |
| Single Male/Father | 8 (5.8%) | 4.50 |
| Single Female/Mother | 3 (2.2%) | 2.00 |
| Non-family | 71 (51.8%) | 1.14 |
| Total Households | 137 (100.0%) | 2.20 |
Household Size by Marriage Status in Mingus
Out of a total of 137 households in Mingus, 66 (48.2%) are family households, while 71 (51.8%) are nonfamily households. The most numerous type of family households are 2-person households, comprising 39, and the most common type of nonfamily households are 1-person households, comprising 68.
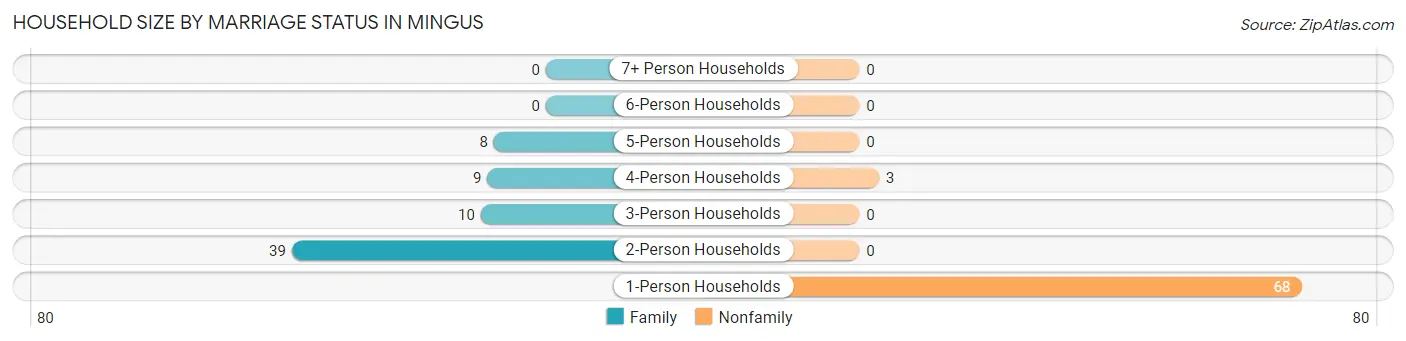
| Household Size | Family Households | Nonfamily Households |
| 1-Person Households | - | 68 (49.6%) |
| 2-Person Households | 39 (28.5%) | 0 (0.0%) |
| 3-Person Households | 10 (7.3%) | 0 (0.0%) |
| 4-Person Households | 9 (6.6%) | 3 (2.2%) |
| 5-Person Households | 8 (5.8%) | 0 (0.0%) |
| 6-Person Households | 0 (0.0%) | 0 (0.0%) |
| 7+ Person Households | 0 (0.0%) | 0 (0.0%) |
| Total | 66 (48.2%) | 71 (51.8%) |
Female Fertility in Mingus
Fertility by Age in Mingus
Average fertility rate in Mingus is 75.0 births per 1,000 women. Women in the age bracket of 20 to 34 years have the highest fertility rate with 286.0 births per 1,000 women. Women in the age bracket of 20 to 34 years acount for 100.0% of all women with births.
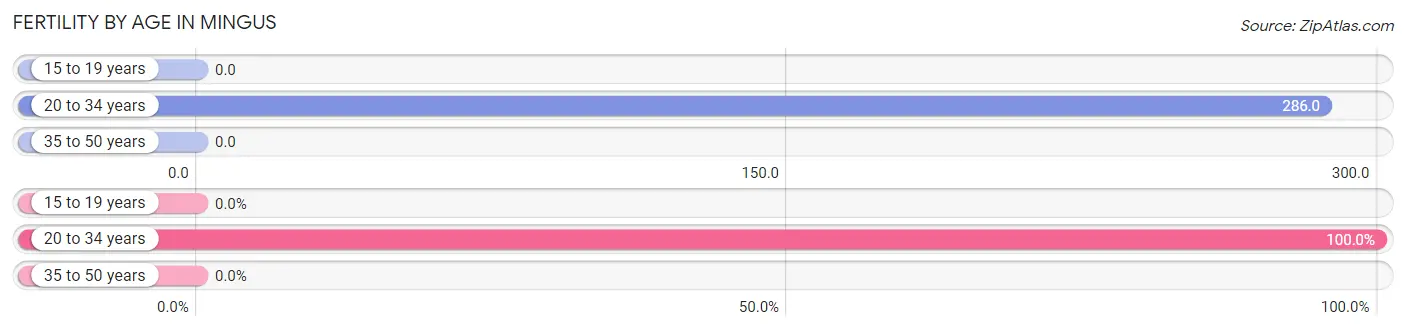
| Age Bracket | Women with Births | Births / 1,000 Women |
| 15 to 19 years | 0 (0.0%) | 0.0 |
| 20 to 34 years | 4 (100.0%) | 286.0 |
| 35 to 50 years | 0 (0.0%) | 0.0 |
| Total | 4 (100.0%) | 75.0 |
Fertility by Age by Marriage Status in Mingus
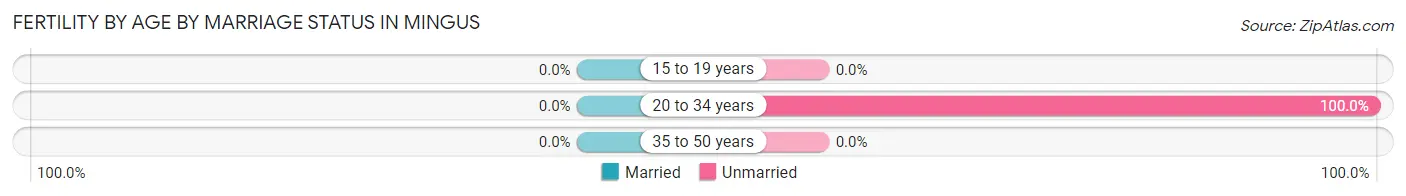
| Age Bracket | Married | Unmarried |
| 15 to 19 years | 0 (0.0%) | 0 (0.0%) |
| 20 to 34 years | 0 (0.0%) | 4 (100.0%) |
| 35 to 50 years | 0 (0.0%) | 0 (0.0%) |
| Total | 0 (0.0%) | 4 (100.0%) |
Fertility by Education in Mingus
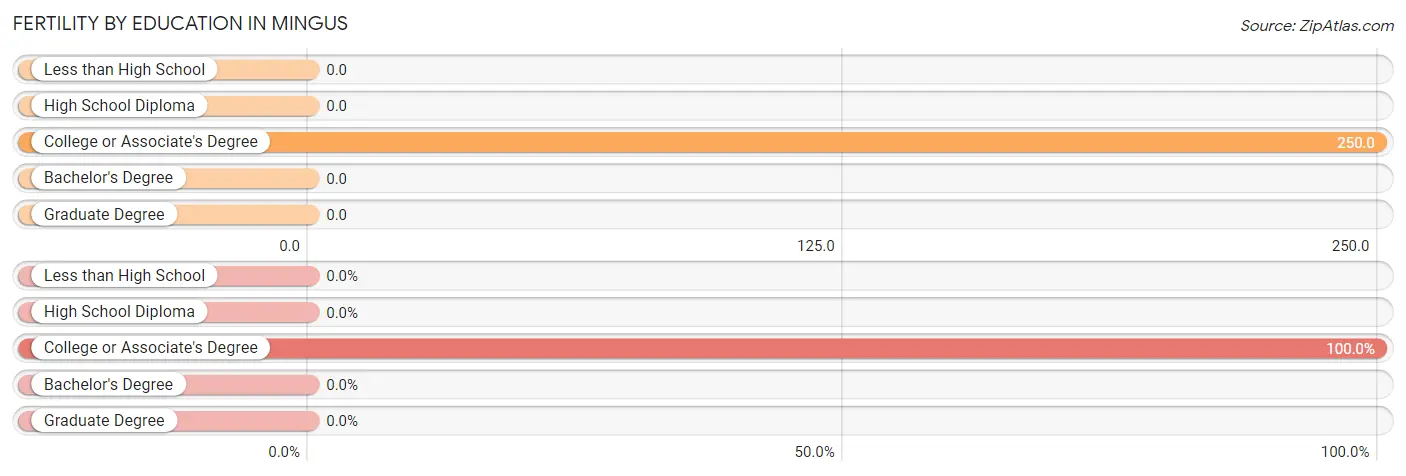
| Educational Attainment | Women with Births | Births / 1,000 Women |
| Less than High School | 0 (0.0%) | 0.0 |
| High School Diploma | 0 (0.0%) | 0.0 |
| College or Associate's Degree | 4 (100.0%) | 250.0 |
| Bachelor's Degree | 0 (0.0%) | 0.0 |
| Graduate Degree | 0 (0.0%) | 0.0 |
| Total | 4 (100.0%) | 75.0 |
Fertility by Education by Marriage Status in Mingus
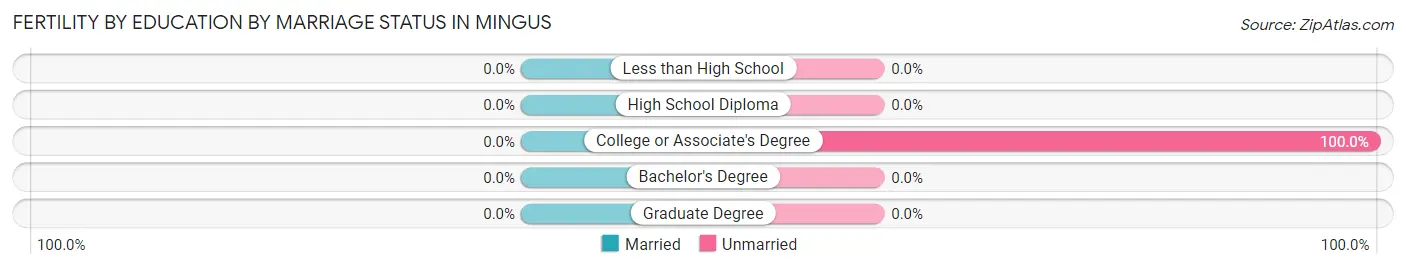
| Educational Attainment | Married | Unmarried |
| Less than High School | 0 (0.0%) | 0 (0.0%) |
| High School Diploma | 0 (0.0%) | 0 (0.0%) |
| College or Associate's Degree | 0 (0.0%) | 4 (100.0%) |
| Bachelor's Degree | 0 (0.0%) | 0 (0.0%) |
| Graduate Degree | 0 (0.0%) | 0 (0.0%) |
| Total | 0 (0.0%) | 4 (100.0%) |
Employment Characteristics in Mingus
Employment by Class of Employer in Mingus
Among the 140 employed individuals in Mingus, private company employees (105 | 75.0%), federal government employees (19 | 13.6%), and self-employed (not incorporated) (9 | 6.4%) make up the most common classes of employment.
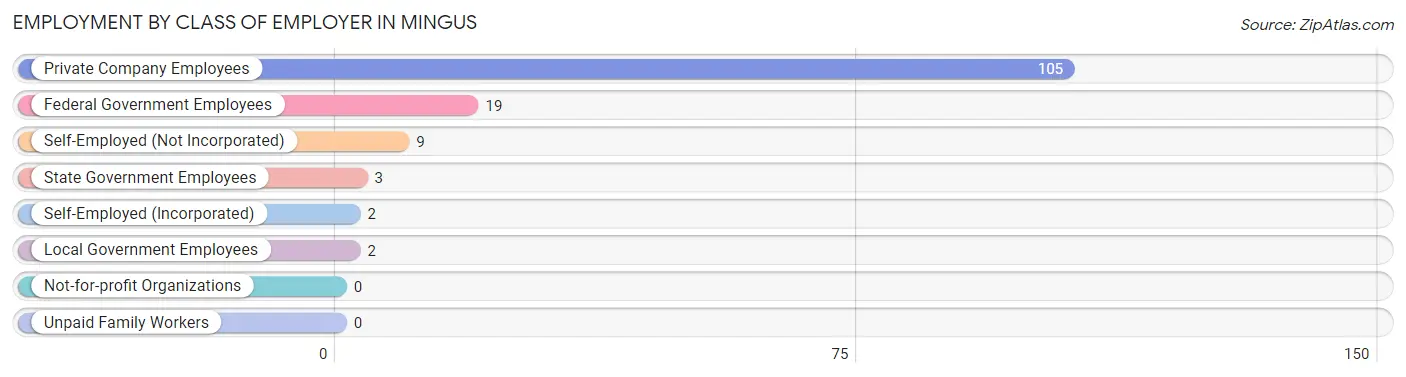
| Employer Class | # Employees | % Employees |
| Private Company Employees | 105 | 75.0% |
| Self-Employed (Incorporated) | 2 | 1.4% |
| Self-Employed (Not Incorporated) | 9 | 6.4% |
| Not-for-profit Organizations | 0 | 0.0% |
| Local Government Employees | 2 | 1.4% |
| State Government Employees | 3 | 2.1% |
| Federal Government Employees | 19 | 13.6% |
| Unpaid Family Workers | 0 | 0.0% |
| Total | 140 | 100.0% |
Employment Status by Age in Mingus
According to the labor force statistics for Mingus, out of the total population over 16 years of age (269), 53.5% or 144 individuals are in the labor force, with 2.8% or 4 of them unemployed. The age group with the highest labor force participation rate is 16 to 19 years, with 86.4% or 19 individuals in the labor force. Within the labor force, the 25 to 29 years age range has the highest percentage of unemployed individuals, with 25.0% or 2 of them being unemployed.
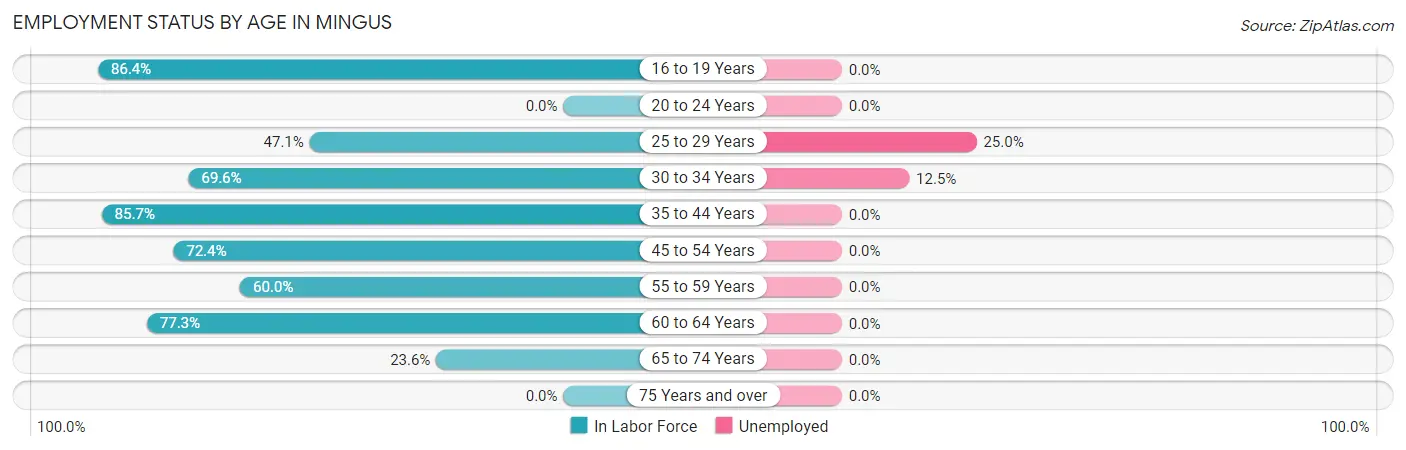
| Age Bracket | In Labor Force | Unemployed |
| 16 to 19 Years | 19 (86.4%) | 0 (0.0%) |
| 20 to 24 Years | 0 (0.0%) | 0 (0.0%) |
| 25 to 29 Years | 8 (47.1%) | 2 (25.0%) |
| 30 to 34 Years | 16 (69.6%) | 2 (12.5%) |
| 35 to 44 Years | 18 (85.7%) | 0 (0.0%) |
| 45 to 54 Years | 21 (72.4%) | 0 (0.0%) |
| 55 to 59 Years | 15 (60.0%) | 0 (0.0%) |
| 60 to 64 Years | 34 (77.3%) | 0 (0.0%) |
| 65 to 74 Years | 13 (23.6%) | 0 (0.0%) |
| 75 Years and over | 0 (0.0%) | 0 (0.0%) |
| Total | 144 (53.5%) | 4 (2.8%) |
Employment Status by Educational Attainment in Mingus
According to labor force statistics for Mingus, 70.4% of individuals (112) out of the total population between 25 and 64 years of age (159) are in the labor force, with 3.6% or 4 of them being unemployed. The group with the highest labor force participation rate are those with the educational attainment of bachelor's degree or higher, with 100.0% or 20 individuals in the labor force. Within the labor force, individuals with bachelor's degree or higher education have the highest percentage of unemployment, with 10.0% or 2 of them being unemployed.
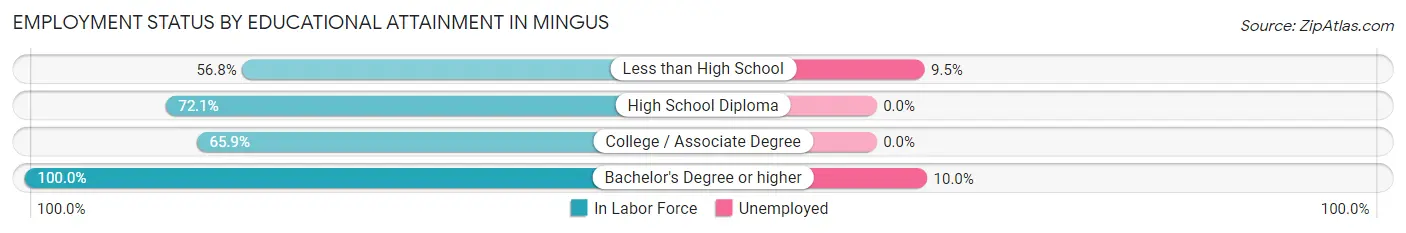
| Educational Attainment | In Labor Force | Unemployed |
| Less than High School | 21 (56.8%) | 4 (9.5%) |
| High School Diploma | 44 (72.1%) | 0 (0.0%) |
| College / Associate Degree | 27 (65.9%) | 0 (0.0%) |
| Bachelor's Degree or higher | 20 (100.0%) | 2 (10.0%) |
| Total | 112 (70.4%) | 6 (3.6%) |
Employment Occupations by Sex in Mingus
Management, Business, Science and Arts Occupations
The most common Management, Business, Science and Arts occupations in Mingus are Management (19 | 13.6%), Computers, Engineering & Science (12 | 8.6%), Architecture & Engineering (9 | 6.4%), Computers & Mathematics (3 | 2.1%), and Community & Social Service (3 | 2.1%).
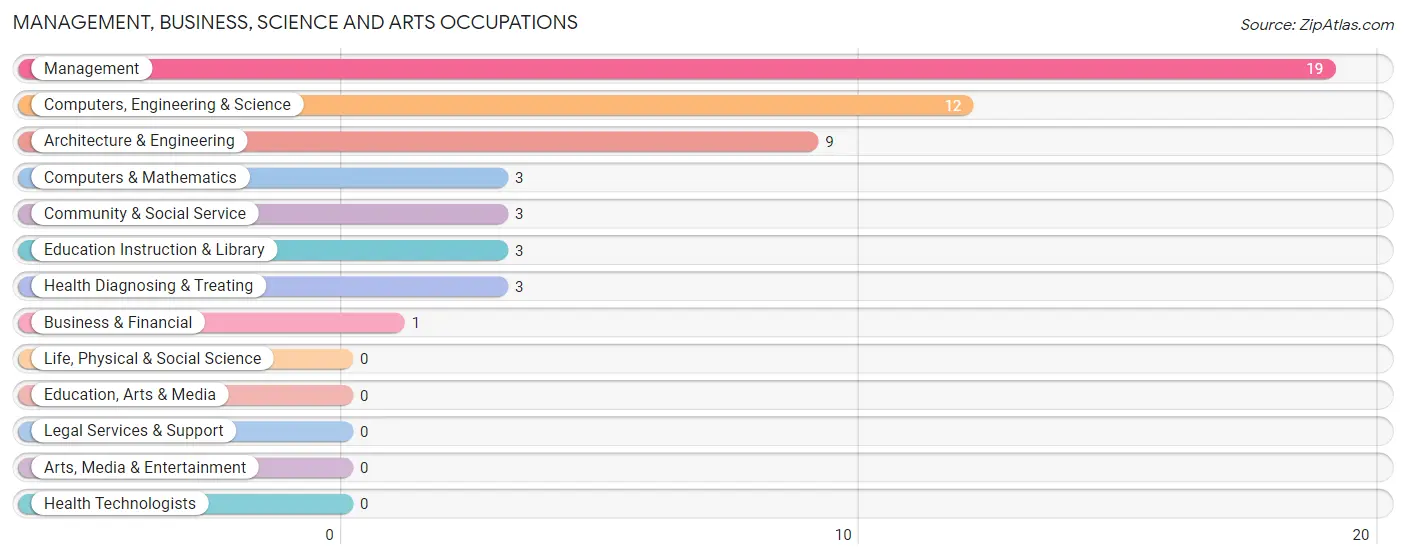
Management, Business, Science and Arts Occupations by Sex
Within the Management, Business, Science and Arts occupations in Mingus, the most male-oriented occupations are Business & Financial (100.0%), Computers, Engineering & Science (100.0%), and Computers & Mathematics (100.0%), while the most female-oriented occupations are Community & Social Service (100.0%), Education Instruction & Library (100.0%), and Health Diagnosing & Treating (100.0%).
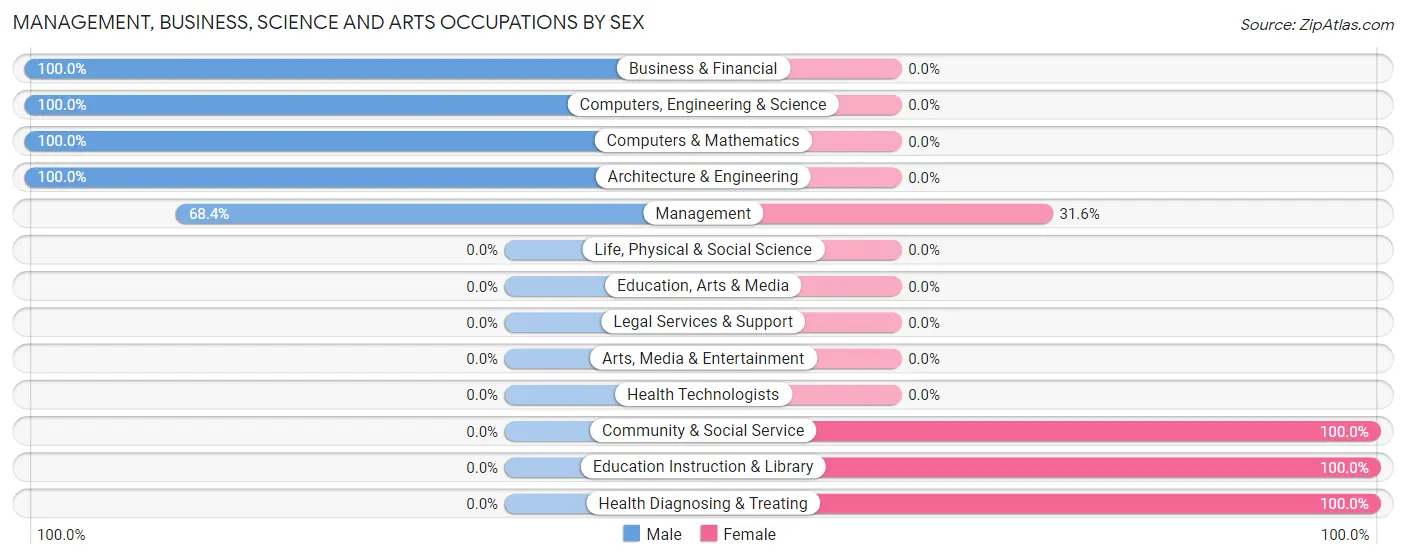
| Occupation | Male | Female |
| Management | 13 (68.4%) | 6 (31.6%) |
| Business & Financial | 1 (100.0%) | 0 (0.0%) |
| Computers, Engineering & Science | 12 (100.0%) | 0 (0.0%) |
| Computers & Mathematics | 3 (100.0%) | 0 (0.0%) |
| Architecture & Engineering | 9 (100.0%) | 0 (0.0%) |
| Life, Physical & Social Science | 0 (0.0%) | 0 (0.0%) |
| Community & Social Service | 0 (0.0%) | 3 (100.0%) |
| Education, Arts & Media | 0 (0.0%) | 0 (0.0%) |
| Legal Services & Support | 0 (0.0%) | 0 (0.0%) |
| Education Instruction & Library | 0 (0.0%) | 3 (100.0%) |
| Arts, Media & Entertainment | 0 (0.0%) | 0 (0.0%) |
| Health Diagnosing & Treating | 0 (0.0%) | 3 (100.0%) |
| Health Technologists | 0 (0.0%) | 0 (0.0%) |
| Total (Category) | 26 (68.4%) | 12 (31.6%) |
| Total (Overall) | 93 (66.4%) | 47 (33.6%) |
Services Occupations
The most common Services occupations in Mingus are Security & Protection (19 | 13.6%), Firefighting & Prevention (19 | 13.6%), Food Preparation & Serving (11 | 7.9%), Cleaning & Maintenance (7 | 5.0%), and Healthcare Support (3 | 2.1%).
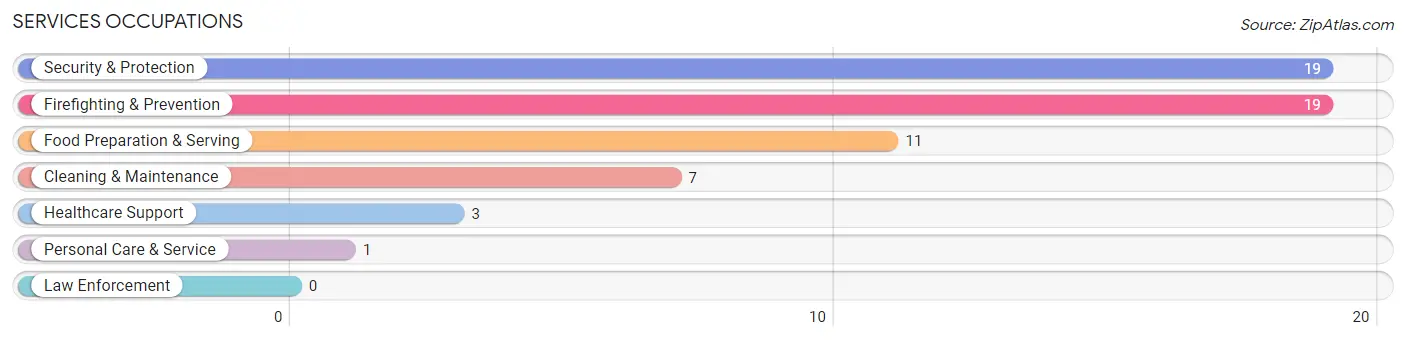
Services Occupations by Sex
Within the Services occupations in Mingus, the most male-oriented occupations are Cleaning & Maintenance (100.0%), and Food Preparation & Serving (72.7%), while the most female-oriented occupations are Healthcare Support (100.0%), Security & Protection (100.0%), and Firefighting & Prevention (100.0%).
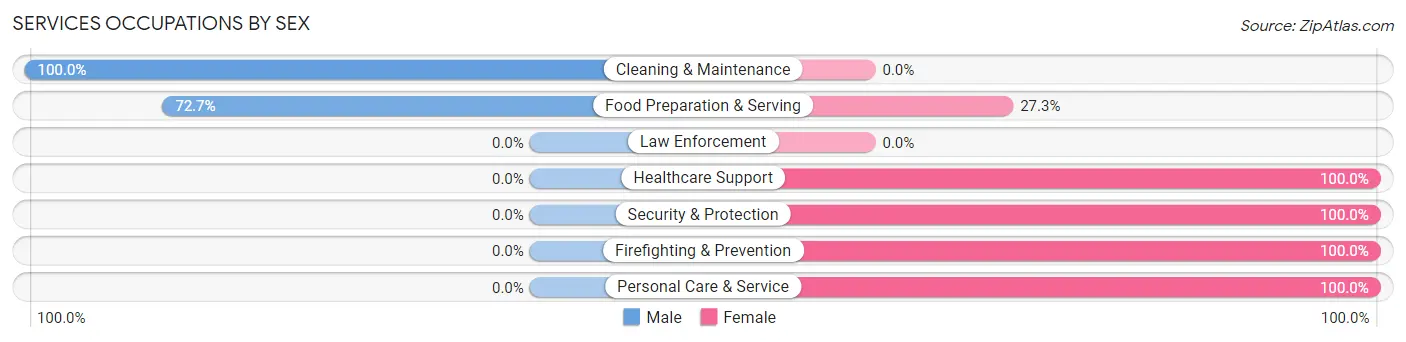
| Occupation | Male | Female |
| Healthcare Support | 0 (0.0%) | 3 (100.0%) |
| Security & Protection | 0 (0.0%) | 19 (100.0%) |
| Firefighting & Prevention | 0 (0.0%) | 19 (100.0%) |
| Law Enforcement | 0 (0.0%) | 0 (0.0%) |
| Food Preparation & Serving | 8 (72.7%) | 3 (27.3%) |
| Cleaning & Maintenance | 7 (100.0%) | 0 (0.0%) |
| Personal Care & Service | 0 (0.0%) | 1 (100.0%) |
| Total (Category) | 15 (36.6%) | 26 (63.4%) |
| Total (Overall) | 93 (66.4%) | 47 (33.6%) |
Sales and Office Occupations
The most common Sales and Office occupations in Mingus are , and Office & Administration (13 | 9.3%).
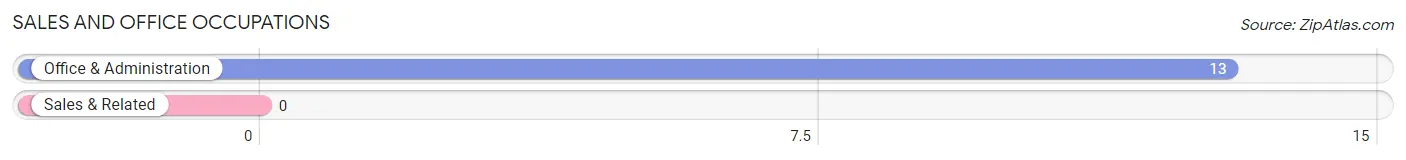
Sales and Office Occupations by Sex
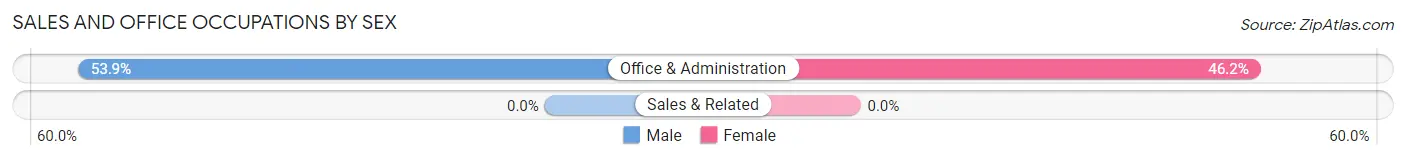
| Occupation | Male | Female |
| Sales & Related | 0 (0.0%) | 0 (0.0%) |
| Office & Administration | 7 (53.8%) | 6 (46.2%) |
| Total (Category) | 7 (53.8%) | 6 (46.2%) |
| Total (Overall) | 93 (66.4%) | 47 (33.6%) |
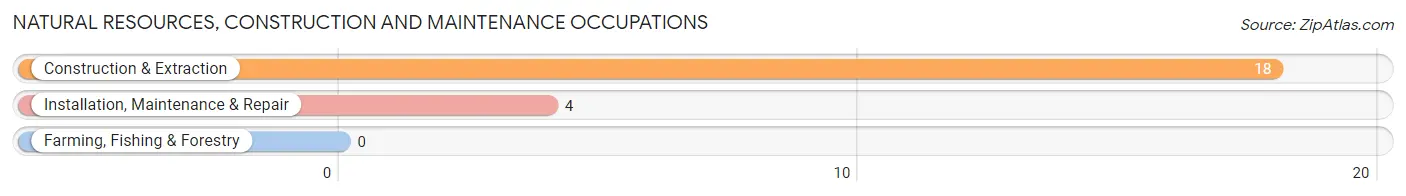
Natural Resources, Construction and Maintenance Occupations
The most common Natural Resources, Construction and Maintenance occupations in Mingus are Construction & Extraction (18 | 12.9%), and Installation, Maintenance & Repair (4 | 2.9%).
Natural Resources, Construction and Maintenance Occupations by Sex
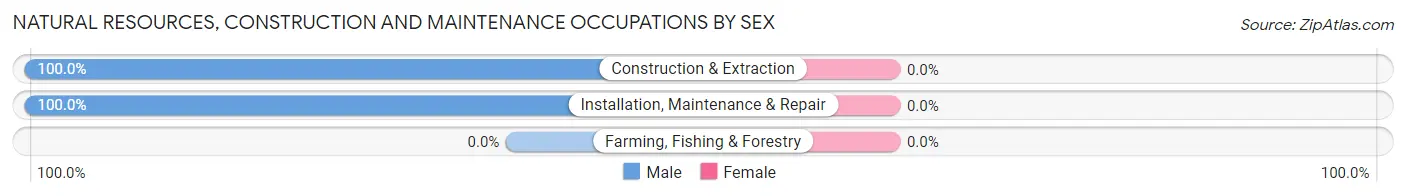
| Occupation | Male | Female |
| Farming, Fishing & Forestry | 0 (0.0%) | 0 (0.0%) |
| Construction & Extraction | 18 (100.0%) | 0 (0.0%) |
| Installation, Maintenance & Repair | 4 (100.0%) | 0 (0.0%) |
| Total (Category) | 22 (100.0%) | 0 (0.0%) |
| Total (Overall) | 93 (66.4%) | 47 (33.6%) |
Production, Transportation and Moving Occupations
The most common Production, Transportation and Moving occupations in Mingus are Transportation (21 | 15.0%), Production (3 | 2.1%), and Material Moving (2 | 1.4%).
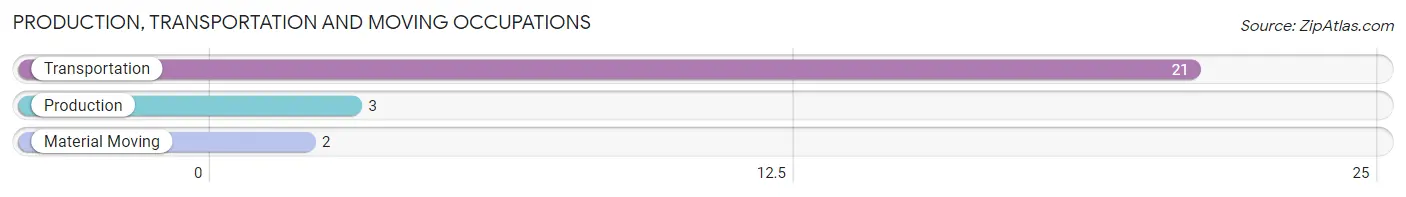
Production, Transportation and Moving Occupations by Sex
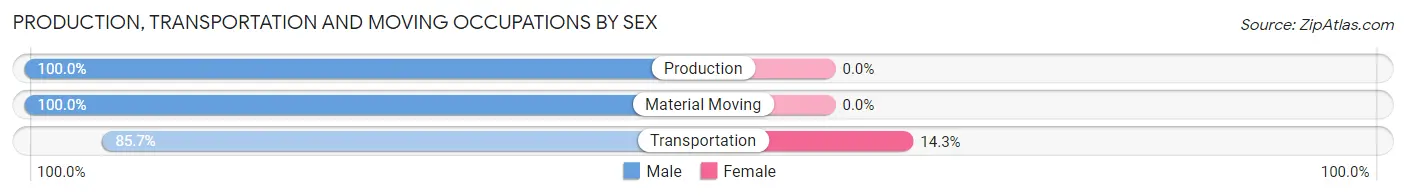
| Occupation | Male | Female |
| Production | 3 (100.0%) | 0 (0.0%) |
| Transportation | 18 (85.7%) | 3 (14.3%) |
| Material Moving | 2 (100.0%) | 0 (0.0%) |
| Total (Category) | 23 (88.5%) | 3 (11.5%) |
| Total (Overall) | 93 (66.4%) | 47 (33.6%) |
Employment Industries by Sex in Mingus
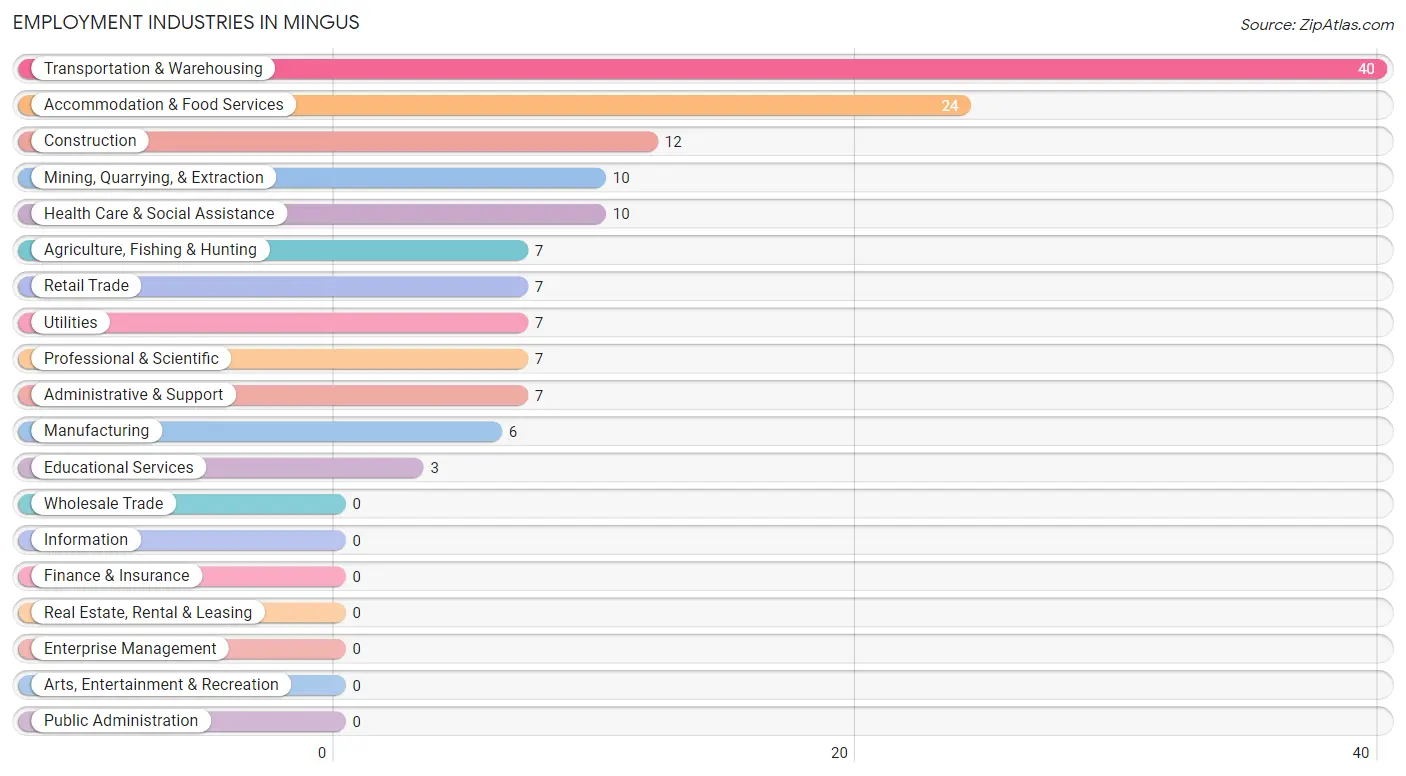
Employment Industries in Mingus
The major employment industries in Mingus include Transportation & Warehousing (40 | 28.6%), Accommodation & Food Services (24 | 17.1%), Construction (12 | 8.6%), Mining, Quarrying, & Extraction (10 | 7.1%), and Health Care & Social Assistance (10 | 7.1%).
Employment Industries by Sex in Mingus
The Mingus industries that see more men than women are Agriculture, Fishing & Hunting (100.0%), Construction (100.0%), and Manufacturing (100.0%), whereas the industries that tend to have a higher number of women are Educational Services (100.0%), Health Care & Social Assistance (100.0%), and Accommodation & Food Services (79.2%).
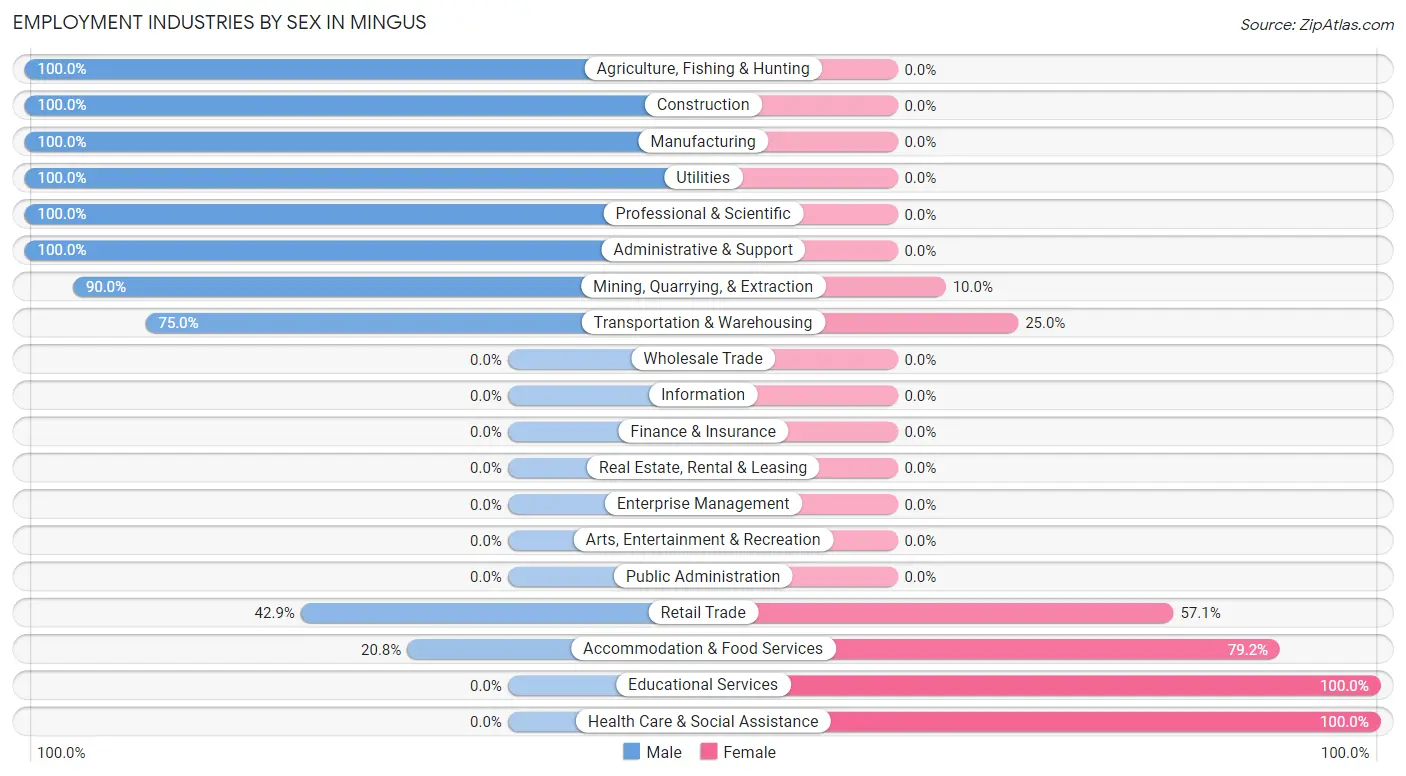
| Industry | Male | Female |
| Agriculture, Fishing & Hunting | 7 (100.0%) | 0 (0.0%) |
| Mining, Quarrying, & Extraction | 9 (90.0%) | 1 (10.0%) |
| Construction | 12 (100.0%) | 0 (0.0%) |
| Manufacturing | 6 (100.0%) | 0 (0.0%) |
| Wholesale Trade | 0 (0.0%) | 0 (0.0%) |
| Retail Trade | 3 (42.9%) | 4 (57.1%) |
| Transportation & Warehousing | 30 (75.0%) | 10 (25.0%) |
| Utilities | 7 (100.0%) | 0 (0.0%) |
| Information | 0 (0.0%) | 0 (0.0%) |
| Finance & Insurance | 0 (0.0%) | 0 (0.0%) |
| Real Estate, Rental & Leasing | 0 (0.0%) | 0 (0.0%) |
| Professional & Scientific | 7 (100.0%) | 0 (0.0%) |
| Enterprise Management | 0 (0.0%) | 0 (0.0%) |
| Administrative & Support | 7 (100.0%) | 0 (0.0%) |
| Educational Services | 0 (0.0%) | 3 (100.0%) |
| Health Care & Social Assistance | 0 (0.0%) | 10 (100.0%) |
| Arts, Entertainment & Recreation | 0 (0.0%) | 0 (0.0%) |
| Accommodation & Food Services | 5 (20.8%) | 19 (79.2%) |
| Public Administration | 0 (0.0%) | 0 (0.0%) |
| Total | 93 (66.4%) | 47 (33.6%) |
Education in Mingus
School Enrollment in Mingus
The most common levels of schooling among the 39 students in Mingus are high school (22 | 56.4%), middle school (10 | 25.6%), and kindergarten (5 | 12.8%).
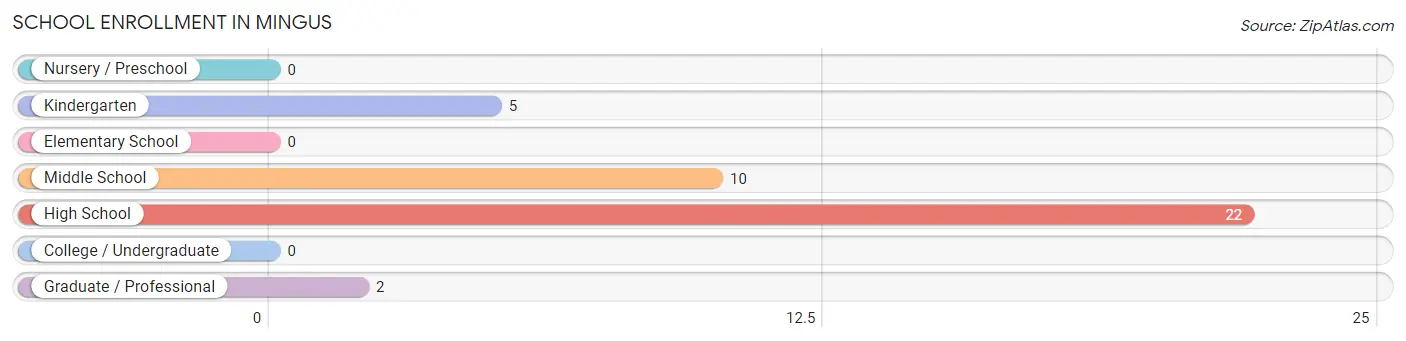
| School Level | # Students | % Students |
| Nursery / Preschool | 0 | 0.0% |
| Kindergarten | 5 | 12.8% |
| Elementary School | 0 | 0.0% |
| Middle School | 10 | 25.6% |
| High School | 22 | 56.4% |
| College / Undergraduate | 0 | 0.0% |
| Graduate / Professional | 2 | 5.1% |
| Total | 39 | 100.0% |
School Enrollment by Age by Funding Source in Mingus
Out of a total of 39 students who are enrolled in schools in Mingus, 3 (7.7%) attend a private institution, while the remaining 36 (92.3%) are enrolled in public schools. The age group of 15 to 17 year olds has the highest likelihood of being enrolled in private schools, with 3 (13.6% in the age bracket) enrolled. Conversely, the age group of 5 to 9 year old has the lowest likelihood of being enrolled in a private school, with 5 (100.0% in the age bracket) attending a public institution.
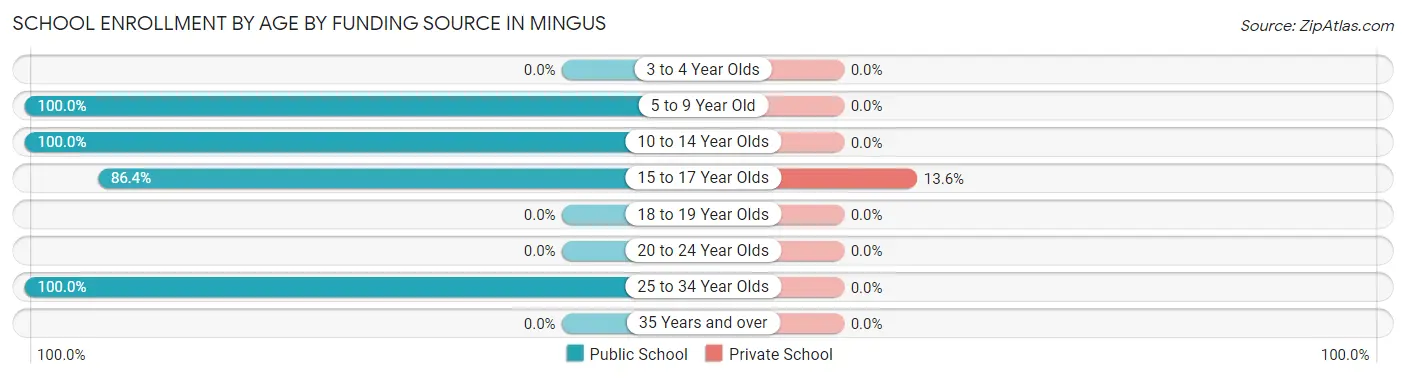
| Age Bracket | Public School | Private School |
| 3 to 4 Year Olds | 0 (0.0%) | 0 (0.0%) |
| 5 to 9 Year Old | 5 (100.0%) | 0 (0.0%) |
| 10 to 14 Year Olds | 10 (100.0%) | 0 (0.0%) |
| 15 to 17 Year Olds | 19 (86.4%) | 3 (13.6%) |
| 18 to 19 Year Olds | 0 (0.0%) | 0 (0.0%) |
| 20 to 24 Year Olds | 0 (0.0%) | 0 (0.0%) |
| 25 to 34 Year Olds | 2 (100.0%) | 0 (0.0%) |
| 35 Years and over | 0 (0.0%) | 0 (0.0%) |
| Total | 36 (92.3%) | 3 (7.7%) |
Educational Attainment by Field of Study in Mingus
Bio, nature & agricultural (13 | 65.0%), science & technology (3 | 15.0%), arts & humanities (3 | 15.0%), and engineering (1 | 5.0%) are the most common fields of study among 20 individuals in Mingus who have obtained a bachelor's degree or higher.
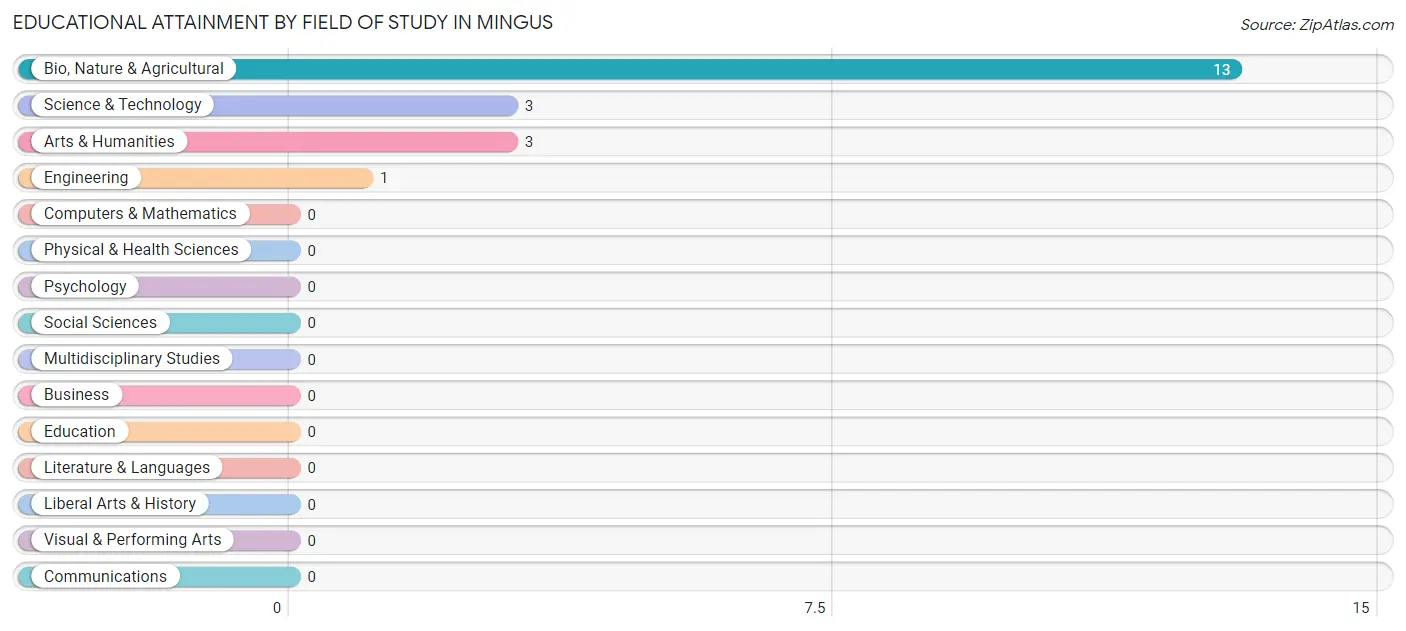
| Field of Study | # Graduates | % Graduates |
| Computers & Mathematics | 0 | 0.0% |
| Bio, Nature & Agricultural | 13 | 65.0% |
| Physical & Health Sciences | 0 | 0.0% |
| Psychology | 0 | 0.0% |
| Social Sciences | 0 | 0.0% |
| Engineering | 1 | 5.0% |
| Multidisciplinary Studies | 0 | 0.0% |
| Science & Technology | 3 | 15.0% |
| Business | 0 | 0.0% |
| Education | 0 | 0.0% |
| Literature & Languages | 0 | 0.0% |
| Liberal Arts & History | 0 | 0.0% |
| Visual & Performing Arts | 0 | 0.0% |
| Communications | 0 | 0.0% |
| Arts & Humanities | 3 | 15.0% |
| Total | 20 | 100.0% |
Transportation & Commute in Mingus
Vehicle Availability by Sex in Mingus
The most prevalent vehicle ownership categories in Mingus are males with 2 vehicles (51, accounting for 54.8%) and females with 2 vehicles (27, making up 108.5%).
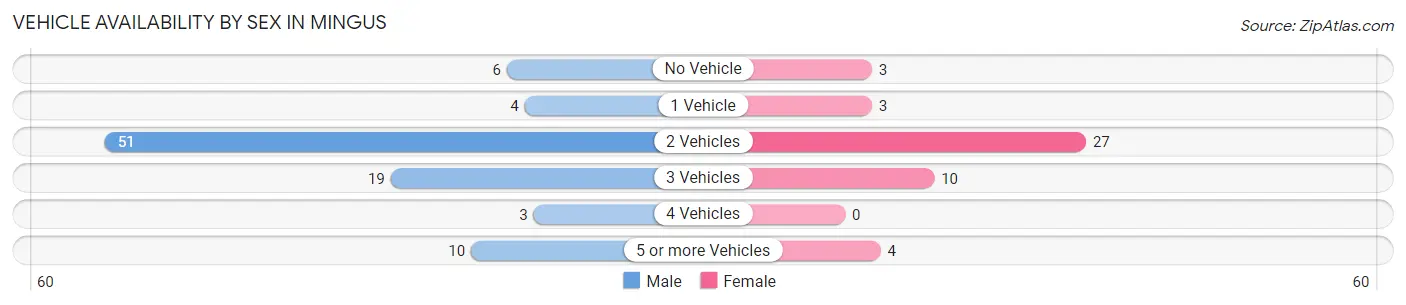
| Vehicles Available | Male | Female |
| No Vehicle | 6 (6.5%) | 3 (6.4%) |
| 1 Vehicle | 4 (4.3%) | 3 (6.4%) |
| 2 Vehicles | 51 (54.8%) | 27 (57.5%) |
| 3 Vehicles | 19 (20.4%) | 10 (21.3%) |
| 4 Vehicles | 3 (3.2%) | 0 (0.0%) |
| 5 or more Vehicles | 10 (10.7%) | 4 (8.5%) |
| Total | 93 (100.0%) | 47 (100.0%) |
Commute Time in Mingus
The most frequently occuring commute durations in Mingus are 60 to 89 minutes (45 commuters, 33.1%), 5 to 9 minutes (28 commuters, 20.6%), and 45 to 59 minutes (14 commuters, 10.3%).
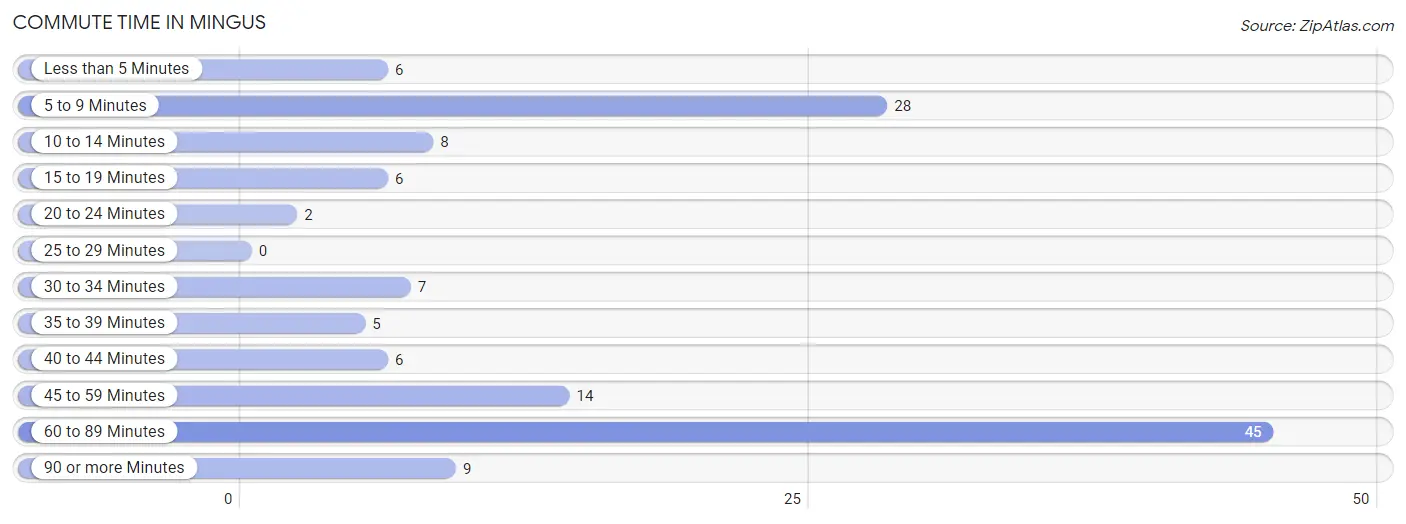
| Commute Time | # Commuters | % Commuters |
| Less than 5 Minutes | 6 | 4.4% |
| 5 to 9 Minutes | 28 | 20.6% |
| 10 to 14 Minutes | 8 | 5.9% |
| 15 to 19 Minutes | 6 | 4.4% |
| 20 to 24 Minutes | 2 | 1.5% |
| 25 to 29 Minutes | 0 | 0.0% |
| 30 to 34 Minutes | 7 | 5.1% |
| 35 to 39 Minutes | 5 | 3.7% |
| 40 to 44 Minutes | 6 | 4.4% |
| 45 to 59 Minutes | 14 | 10.3% |
| 60 to 89 Minutes | 45 | 33.1% |
| 90 or more Minutes | 9 | 6.6% |
Commute Time by Sex in Mingus
The most common commute times in Mingus are 5 to 9 minutes (28 commuters, 31.5%) for males and 60 to 89 minutes (26 commuters, 55.3%) for females.
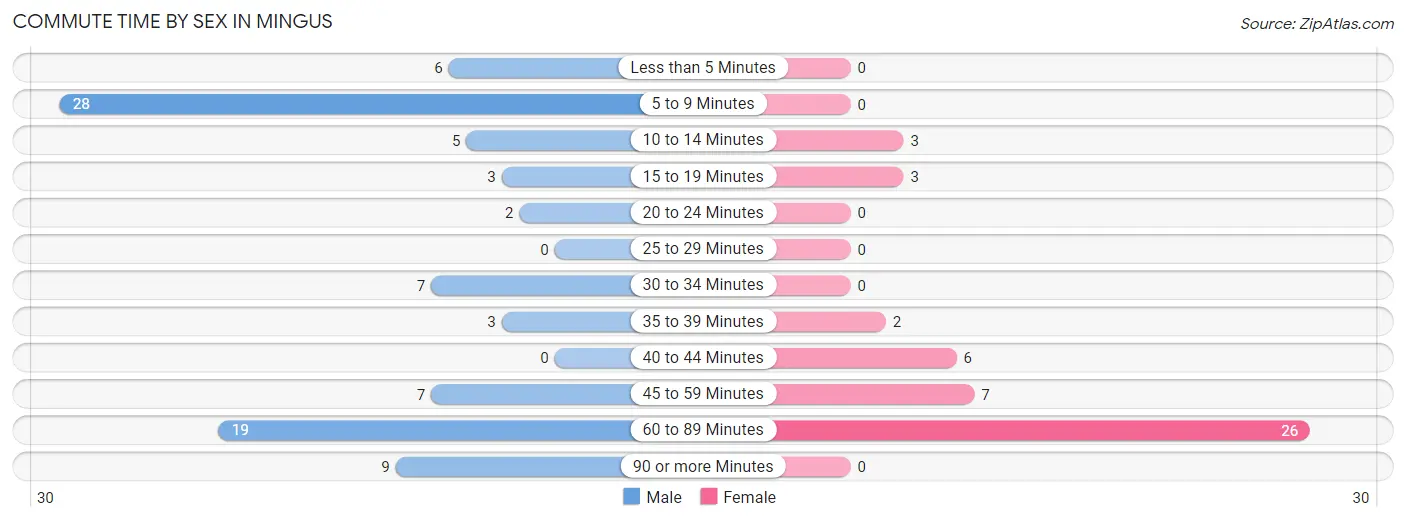
| Commute Time | Male | Female |
| Less than 5 Minutes | 6 (6.7%) | 0 (0.0%) |
| 5 to 9 Minutes | 28 (31.5%) | 0 (0.0%) |
| 10 to 14 Minutes | 5 (5.6%) | 3 (6.4%) |
| 15 to 19 Minutes | 3 (3.4%) | 3 (6.4%) |
| 20 to 24 Minutes | 2 (2.2%) | 0 (0.0%) |
| 25 to 29 Minutes | 0 (0.0%) | 0 (0.0%) |
| 30 to 34 Minutes | 7 (7.9%) | 0 (0.0%) |
| 35 to 39 Minutes | 3 (3.4%) | 2 (4.3%) |
| 40 to 44 Minutes | 0 (0.0%) | 6 (12.8%) |
| 45 to 59 Minutes | 7 (7.9%) | 7 (14.9%) |
| 60 to 89 Minutes | 19 (21.3%) | 26 (55.3%) |
| 90 or more Minutes | 9 (10.1%) | 0 (0.0%) |
Time of Departure to Work by Sex in Mingus
The most frequent times of departure to work in Mingus are 12:00 AM to 4:59 AM (31, 34.8%) for males and 5:00 AM to 5:29 AM (22, 46.8%) for females.
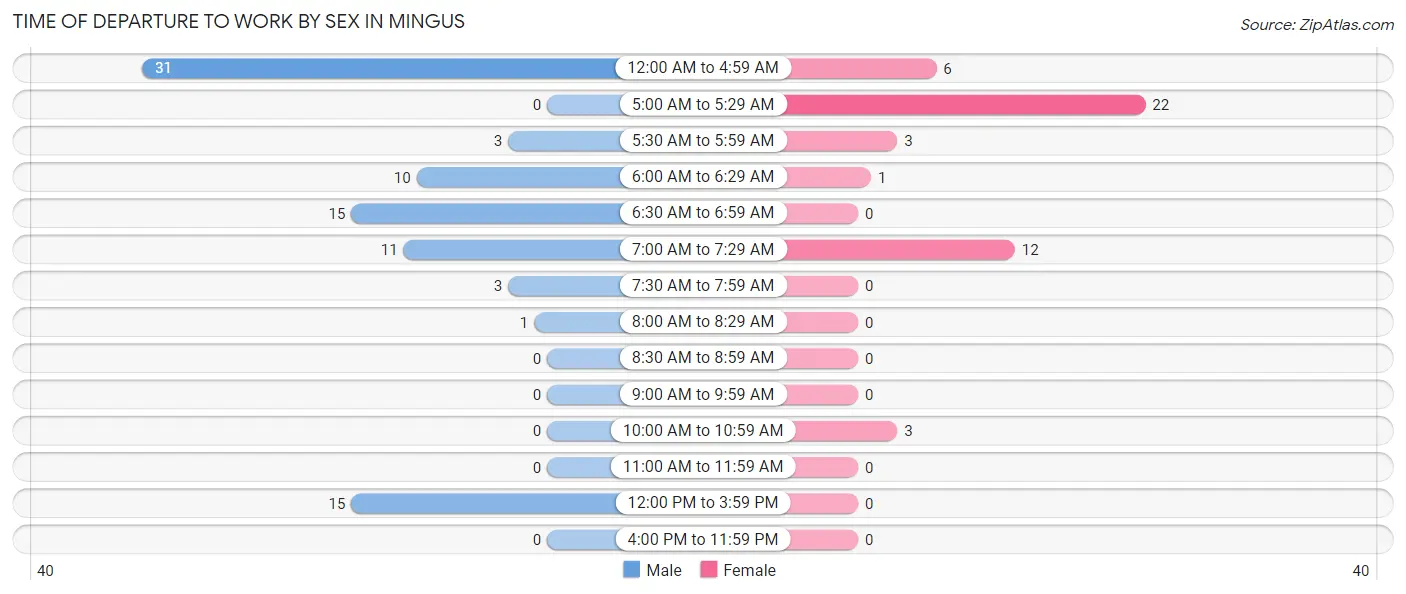
| Time of Departure | Male | Female |
| 12:00 AM to 4:59 AM | 31 (34.8%) | 6 (12.8%) |
| 5:00 AM to 5:29 AM | 0 (0.0%) | 22 (46.8%) |
| 5:30 AM to 5:59 AM | 3 (3.4%) | 3 (6.4%) |
| 6:00 AM to 6:29 AM | 10 (11.2%) | 1 (2.1%) |
| 6:30 AM to 6:59 AM | 15 (16.9%) | 0 (0.0%) |
| 7:00 AM to 7:29 AM | 11 (12.4%) | 12 (25.5%) |
| 7:30 AM to 7:59 AM | 3 (3.4%) | 0 (0.0%) |
| 8:00 AM to 8:29 AM | 1 (1.1%) | 0 (0.0%) |
| 8:30 AM to 8:59 AM | 0 (0.0%) | 0 (0.0%) |
| 9:00 AM to 9:59 AM | 0 (0.0%) | 0 (0.0%) |
| 10:00 AM to 10:59 AM | 0 (0.0%) | 3 (6.4%) |
| 11:00 AM to 11:59 AM | 0 (0.0%) | 0 (0.0%) |
| 12:00 PM to 3:59 PM | 15 (16.9%) | 0 (0.0%) |
| 4:00 PM to 11:59 PM | 0 (0.0%) | 0 (0.0%) |
| Total | 89 (100.0%) | 47 (100.0%) |
Housing Occupancy in Mingus
Occupancy by Ownership in Mingus
Of the total 137 dwellings in Mingus, owner-occupied units account for 109 (79.6%), while renter-occupied units make up 28 (20.4%).
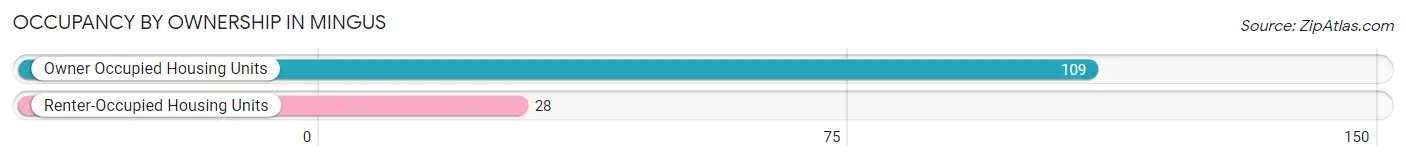
| Occupancy | # Housing Units | % Housing Units |
| Owner Occupied Housing Units | 109 | 79.6% |
| Renter-Occupied Housing Units | 28 | 20.4% |
| Total Occupied Housing Units | 137 | 100.0% |
Occupancy by Household Size in Mingus
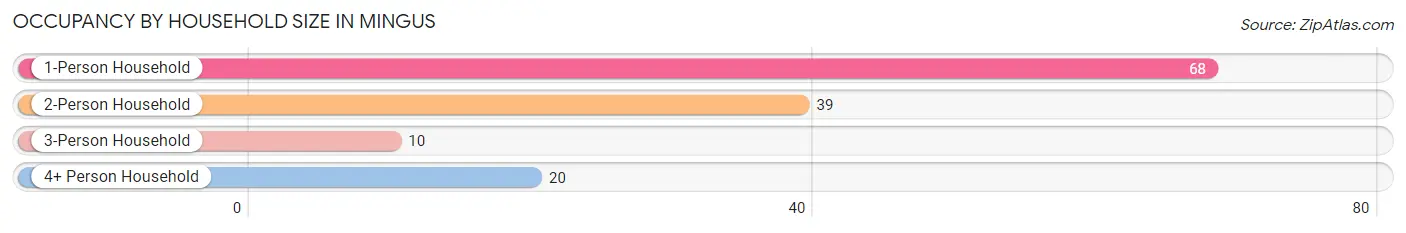
| Household Size | # Housing Units | % Housing Units |
| 1-Person Household | 68 | 49.6% |
| 2-Person Household | 39 | 28.5% |
| 3-Person Household | 10 | 7.3% |
| 4+ Person Household | 20 | 14.6% |
| Total Housing Units | 137 | 100.0% |
Occupancy by Ownership by Household Size in Mingus
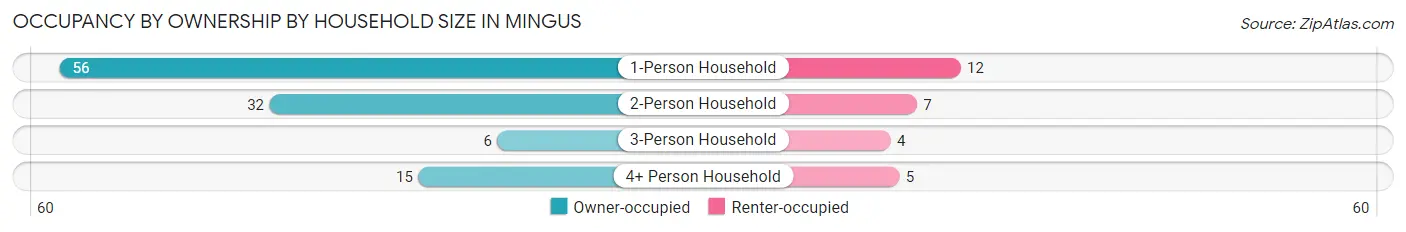
| Household Size | Owner-occupied | Renter-occupied |
| 1-Person Household | 56 (82.4%) | 12 (17.6%) |
| 2-Person Household | 32 (82.1%) | 7 (17.9%) |
| 3-Person Household | 6 (60.0%) | 4 (40.0%) |
| 4+ Person Household | 15 (75.0%) | 5 (25.0%) |
| Total Housing Units | 109 (79.6%) | 28 (20.4%) |
Occupancy by Educational Attainment in Mingus
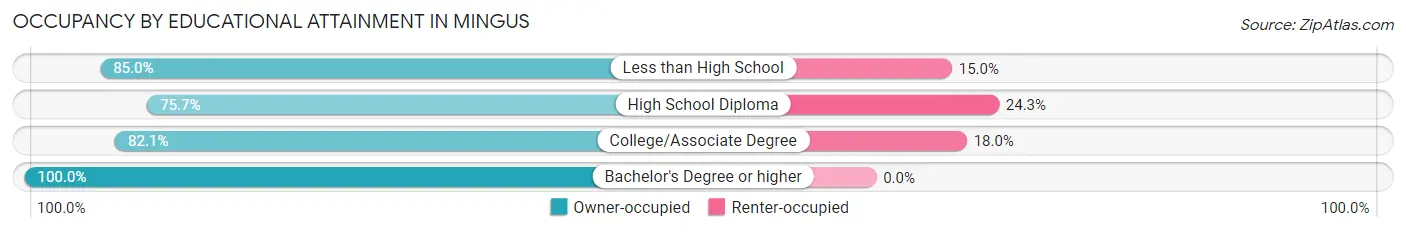
| Household Size | Owner-occupied | Renter-occupied |
| Less than High School | 17 (85.0%) | 3 (15.0%) |
| High School Diploma | 56 (75.7%) | 18 (24.3%) |
| College/Associate Degree | 32 (82.1%) | 7 (17.9%) |
| Bachelor's Degree or higher | 4 (100.0%) | 0 (0.0%) |
Occupancy by Age of Householder in Mingus
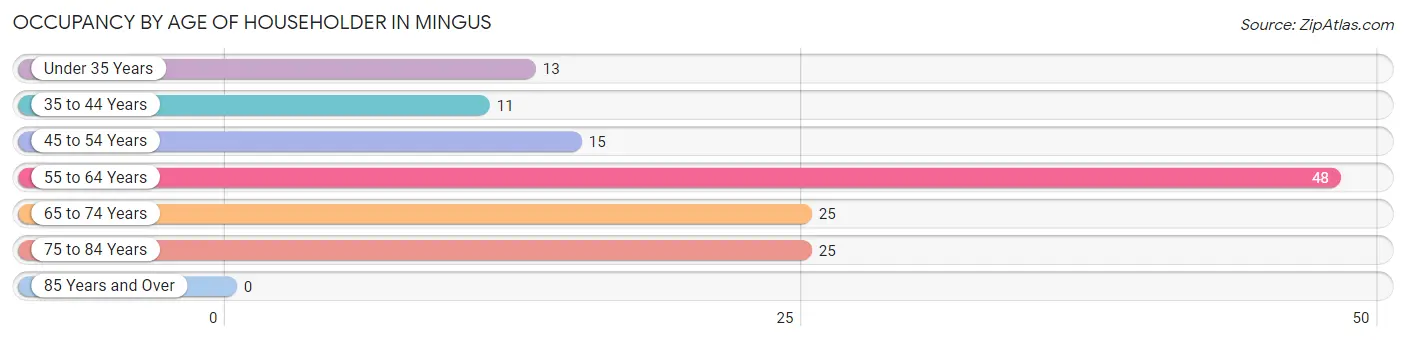
| Age Bracket | # Households | % Households |
| Under 35 Years | 13 | 9.5% |
| 35 to 44 Years | 11 | 8.0% |
| 45 to 54 Years | 15 | 11.0% |
| 55 to 64 Years | 48 | 35.0% |
| 65 to 74 Years | 25 | 18.2% |
| 75 to 84 Years | 25 | 18.2% |
| 85 Years and Over | 0 | 0.0% |
| Total | 137 | 100.0% |
Housing Finances in Mingus
Median Income by Occupancy in Mingus
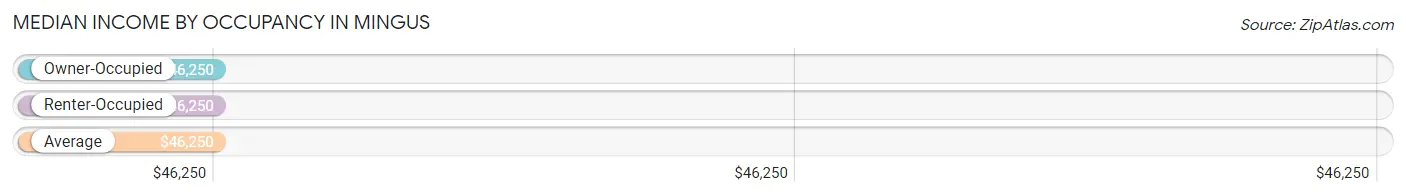
| Occupancy Type | # Households | Median Income |
| Owner-Occupied | 109 (79.6%) | $46,250 |
| Renter-Occupied | 28 (20.4%) | $46,250 |
| Average | 137 (100.0%) | $46,250 |
Occupancy by Householder Income Bracket in Mingus
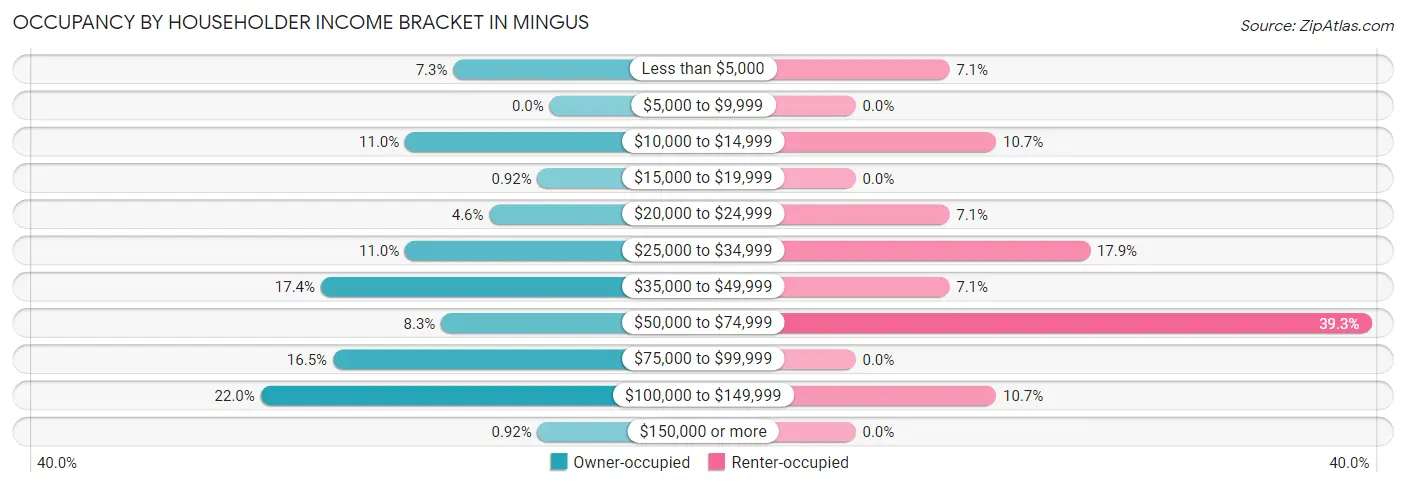
| Income Bracket | Owner-occupied | Renter-occupied |
| Less than $5,000 | 8 (7.3%) | 2 (7.1%) |
| $5,000 to $9,999 | 0 (0.0%) | 0 (0.0%) |
| $10,000 to $14,999 | 12 (11.0%) | 3 (10.7%) |
| $15,000 to $19,999 | 1 (0.9%) | 0 (0.0%) |
| $20,000 to $24,999 | 5 (4.6%) | 2 (7.1%) |
| $25,000 to $34,999 | 12 (11.0%) | 5 (17.9%) |
| $35,000 to $49,999 | 19 (17.4%) | 2 (7.1%) |
| $50,000 to $74,999 | 9 (8.3%) | 11 (39.3%) |
| $75,000 to $99,999 | 18 (16.5%) | 0 (0.0%) |
| $100,000 to $149,999 | 24 (22.0%) | 3 (10.7%) |
| $150,000 or more | 1 (0.9%) | 0 (0.0%) |
| Total | 109 (100.0%) | 28 (100.0%) |
Monthly Housing Cost Tiers in Mingus
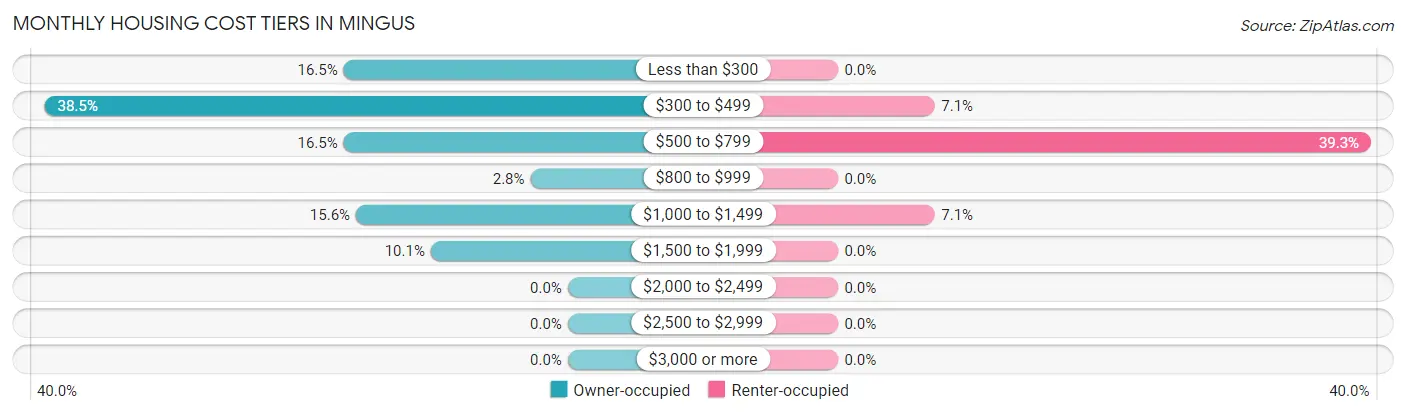
| Monthly Cost | Owner-occupied | Renter-occupied |
| Less than $300 | 18 (16.5%) | 0 (0.0%) |
| $300 to $499 | 42 (38.5%) | 2 (7.1%) |
| $500 to $799 | 18 (16.5%) | 11 (39.3%) |
| $800 to $999 | 3 (2.8%) | 0 (0.0%) |
| $1,000 to $1,499 | 17 (15.6%) | 2 (7.1%) |
| $1,500 to $1,999 | 11 (10.1%) | 0 (0.0%) |
| $2,000 to $2,499 | 0 (0.0%) | 0 (0.0%) |
| $2,500 to $2,999 | 0 (0.0%) | 0 (0.0%) |
| $3,000 or more | 0 (0.0%) | 0 (0.0%) |
| Total | 109 (100.0%) | 28 (100.0%) |
Physical Housing Characteristics in Mingus
Housing Structures in Mingus
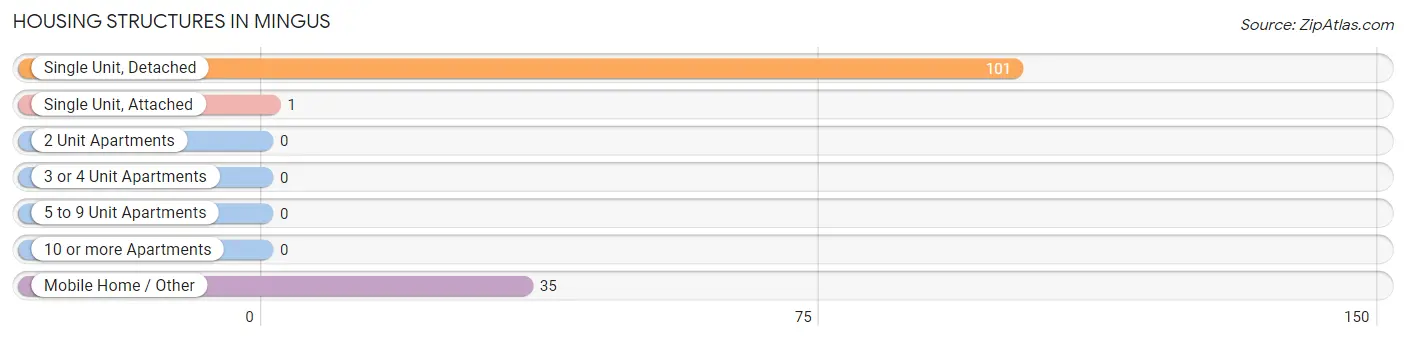
| Structure Type | # Housing Units | % Housing Units |
| Single Unit, Detached | 101 | 73.7% |
| Single Unit, Attached | 1 | 0.7% |
| 2 Unit Apartments | 0 | 0.0% |
| 3 or 4 Unit Apartments | 0 | 0.0% |
| 5 to 9 Unit Apartments | 0 | 0.0% |
| 10 or more Apartments | 0 | 0.0% |
| Mobile Home / Other | 35 | 25.6% |
| Total | 137 | 100.0% |
Housing Structures by Occupancy in Mingus
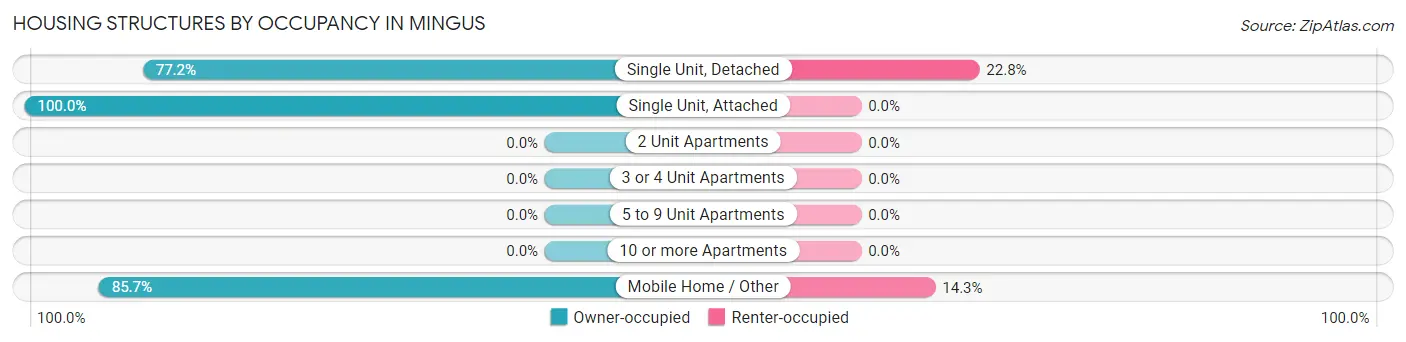
| Structure Type | Owner-occupied | Renter-occupied |
| Single Unit, Detached | 78 (77.2%) | 23 (22.8%) |
| Single Unit, Attached | 1 (100.0%) | 0 (0.0%) |
| 2 Unit Apartments | 0 (0.0%) | 0 (0.0%) |
| 3 or 4 Unit Apartments | 0 (0.0%) | 0 (0.0%) |
| 5 to 9 Unit Apartments | 0 (0.0%) | 0 (0.0%) |
| 10 or more Apartments | 0 (0.0%) | 0 (0.0%) |
| Mobile Home / Other | 30 (85.7%) | 5 (14.3%) |
| Total | 109 (79.6%) | 28 (20.4%) |
Housing Structures by Number of Rooms in Mingus
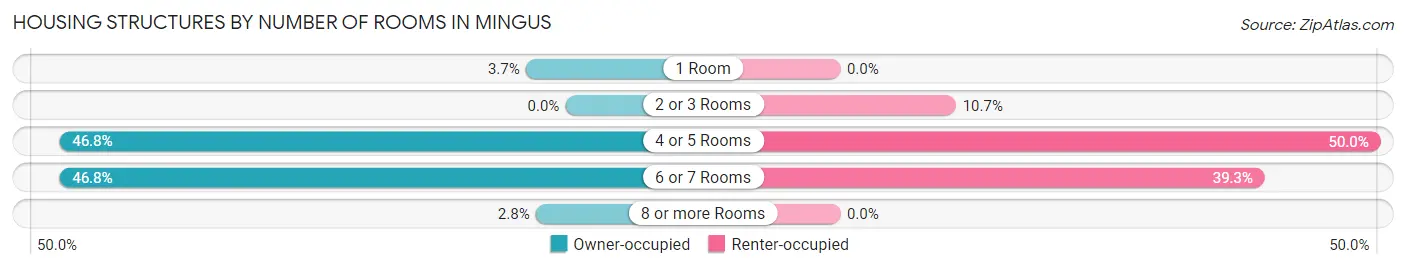
| Number of Rooms | Owner-occupied | Renter-occupied |
| 1 Room | 4 (3.7%) | 0 (0.0%) |
| 2 or 3 Rooms | 0 (0.0%) | 3 (10.7%) |
| 4 or 5 Rooms | 51 (46.8%) | 14 (50.0%) |
| 6 or 7 Rooms | 51 (46.8%) | 11 (39.3%) |
| 8 or more Rooms | 3 (2.8%) | 0 (0.0%) |
| Total | 109 (100.0%) | 28 (100.0%) |
Housing Structure by Heating Type in Mingus
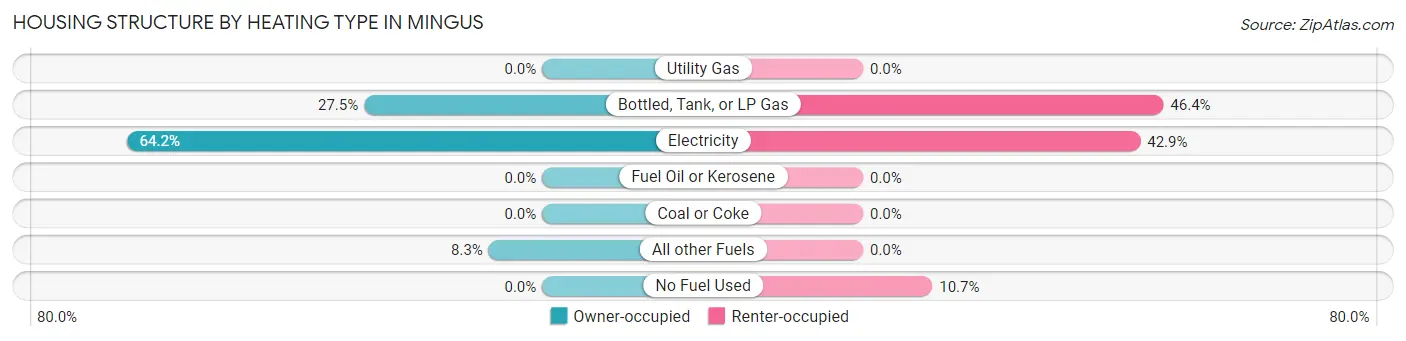
| Heating Type | Owner-occupied | Renter-occupied |
| Utility Gas | 0 (0.0%) | 0 (0.0%) |
| Bottled, Tank, or LP Gas | 30 (27.5%) | 13 (46.4%) |
| Electricity | 70 (64.2%) | 12 (42.9%) |
| Fuel Oil or Kerosene | 0 (0.0%) | 0 (0.0%) |
| Coal or Coke | 0 (0.0%) | 0 (0.0%) |
| All other Fuels | 9 (8.3%) | 0 (0.0%) |
| No Fuel Used | 0 (0.0%) | 3 (10.7%) |
| Total | 109 (100.0%) | 28 (100.0%) |
Household Vehicle Usage in Mingus
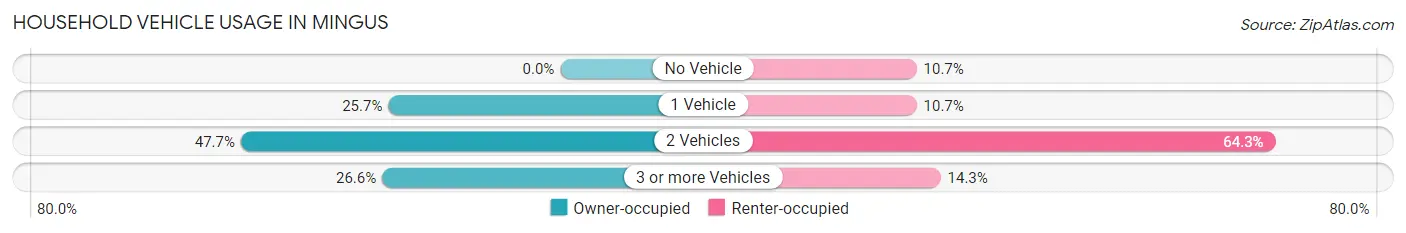
| Vehicles per Household | Owner-occupied | Renter-occupied |
| No Vehicle | 0 (0.0%) | 3 (10.7%) |
| 1 Vehicle | 28 (25.7%) | 3 (10.7%) |
| 2 Vehicles | 52 (47.7%) | 18 (64.3%) |
| 3 or more Vehicles | 29 (26.6%) | 4 (14.3%) |
| Total | 109 (100.0%) | 28 (100.0%) |
Real Estate & Mortgages in Mingus
Real Estate and Mortgage Overview in Mingus
| Characteristic | Without Mortgage | With Mortgage |
| Housing Units | 78 | 31 |
| Median Property Value | $52,500 | $157,300 |
| Median Household Income | $38,750 | $1 |
| Monthly Housing Costs | $333 | $0 |
| Real Estate Taxes | $725 | $0 |
Property Value by Mortgage Status in Mingus
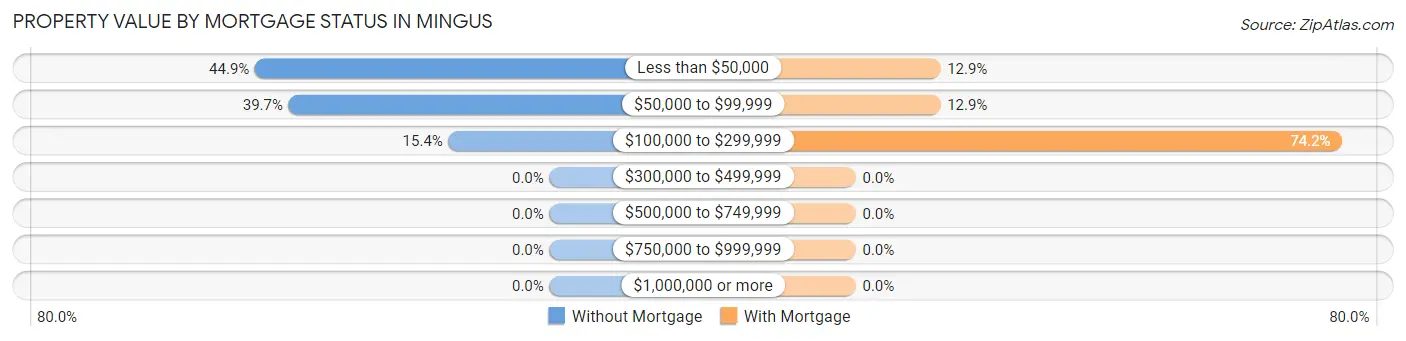
| Property Value | Without Mortgage | With Mortgage |
| Less than $50,000 | 35 (44.9%) | 4 (12.9%) |
| $50,000 to $99,999 | 31 (39.7%) | 4 (12.9%) |
| $100,000 to $299,999 | 12 (15.4%) | 23 (74.2%) |
| $300,000 to $499,999 | 0 (0.0%) | 0 (0.0%) |
| $500,000 to $749,999 | 0 (0.0%) | 0 (0.0%) |
| $750,000 to $999,999 | 0 (0.0%) | 0 (0.0%) |
| $1,000,000 or more | 0 (0.0%) | 0 (0.0%) |
| Total | 78 (100.0%) | 31 (100.0%) |
Household Income by Mortgage Status in Mingus
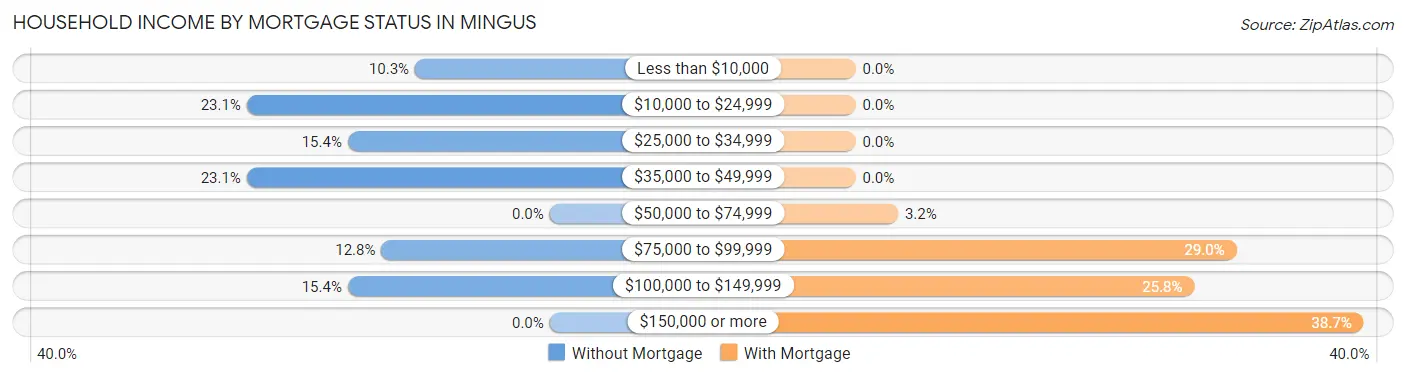
| Household Income | Without Mortgage | With Mortgage |
| Less than $10,000 | 8 (10.3%) | 0 (0.0%) |
| $10,000 to $24,999 | 18 (23.1%) | 0 (0.0%) |
| $25,000 to $34,999 | 12 (15.4%) | 0 (0.0%) |
| $35,000 to $49,999 | 18 (23.1%) | 0 (0.0%) |
| $50,000 to $74,999 | 0 (0.0%) | 1 (3.2%) |
| $75,000 to $99,999 | 10 (12.8%) | 9 (29.0%) |
| $100,000 to $149,999 | 12 (15.4%) | 8 (25.8%) |
| $150,000 or more | 0 (0.0%) | 12 (38.7%) |
| Total | 78 (100.0%) | 31 (100.0%) |
Property Value to Household Income Ratio in Mingus
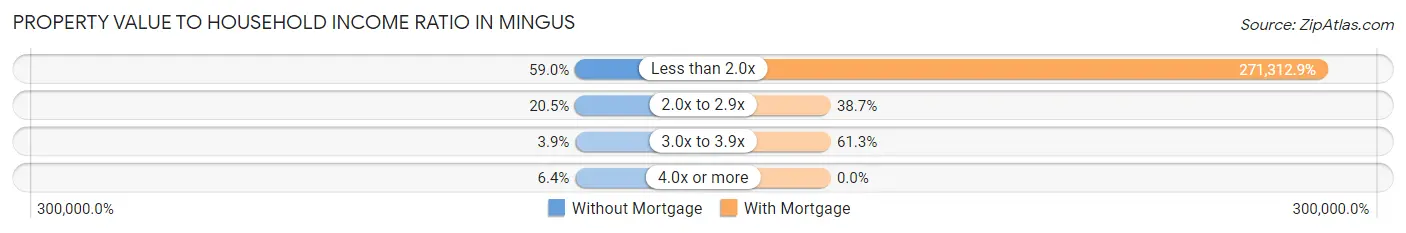
| Value-to-Income Ratio | Without Mortgage | With Mortgage |
| Less than 2.0x | 46 (59.0%) | 84,107 (271,312.9%) |
| 2.0x to 2.9x | 16 (20.5%) | 12 (38.7%) |
| 3.0x to 3.9x | 3 (3.8%) | 19 (61.3%) |
| 4.0x or more | 5 (6.4%) | 0 (0.0%) |
| Total | 78 (100.0%) | 31 (100.0%) |
Real Estate Taxes by Mortgage Status in Mingus
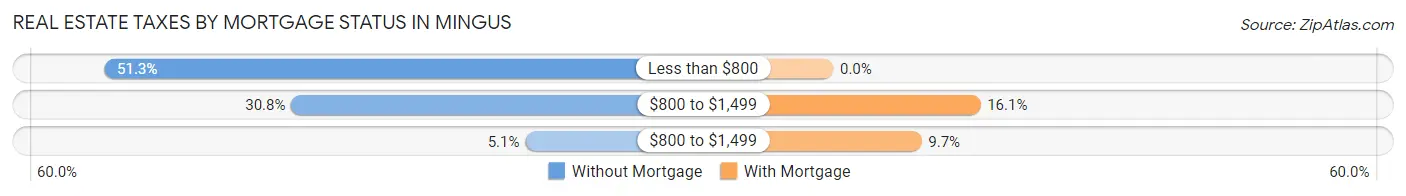
| Property Taxes | Without Mortgage | With Mortgage |
| Less than $800 | 40 (51.3%) | 0 (0.0%) |
| $800 to $1,499 | 24 (30.8%) | 5 (16.1%) |
| $800 to $1,499 | 4 (5.1%) | 3 (9.7%) |
| Total | 78 (100.0%) | 31 (100.0%) |
Health & Disability in Mingus
Health Insurance Coverage by Age in Mingus
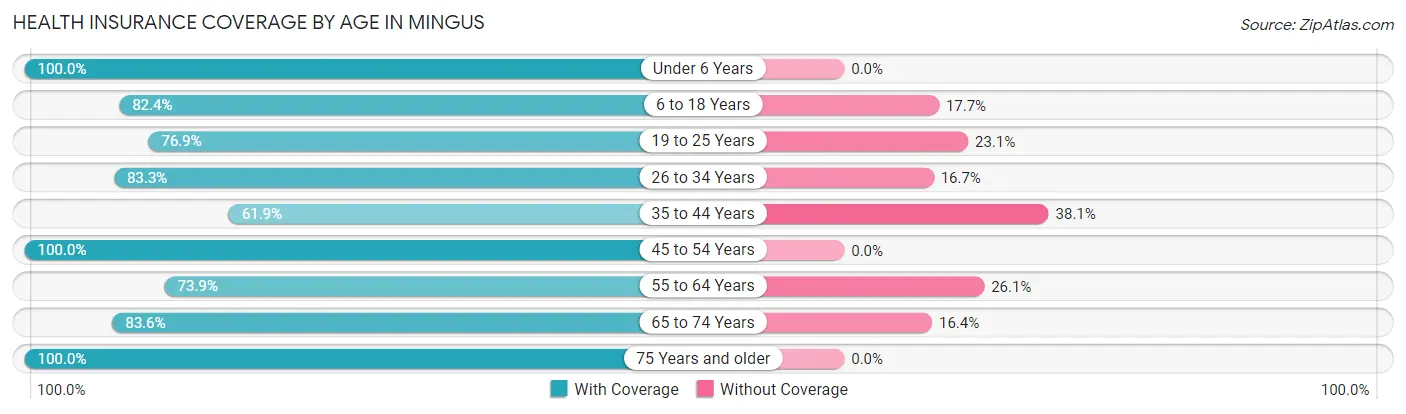
| Age Bracket | With Coverage | Without Coverage |
| Under 6 Years | 20 (100.0%) | 0 (0.0%) |
| 6 to 18 Years | 28 (82.4%) | 6 (17.6%) |
| 19 to 25 Years | 10 (76.9%) | 3 (23.1%) |
| 26 to 34 Years | 25 (83.3%) | 5 (16.7%) |
| 35 to 44 Years | 13 (61.9%) | 8 (38.1%) |
| 45 to 54 Years | 29 (100.0%) | 0 (0.0%) |
| 55 to 64 Years | 51 (73.9%) | 18 (26.1%) |
| 65 to 74 Years | 46 (83.6%) | 9 (16.4%) |
| 75 Years and older | 30 (100.0%) | 0 (0.0%) |
| Total | 252 (83.7%) | 49 (16.3%) |
Health Insurance Coverage by Citizenship Status in Mingus
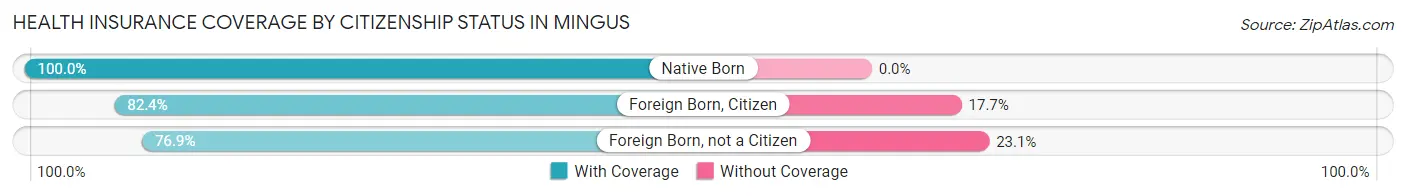
| Citizenship Status | With Coverage | Without Coverage |
| Native Born | 20 (100.0%) | 0 (0.0%) |
| Foreign Born, Citizen | 28 (82.4%) | 6 (17.6%) |
| Foreign Born, not a Citizen | 10 (76.9%) | 3 (23.1%) |
Health Insurance Coverage by Household Income in Mingus
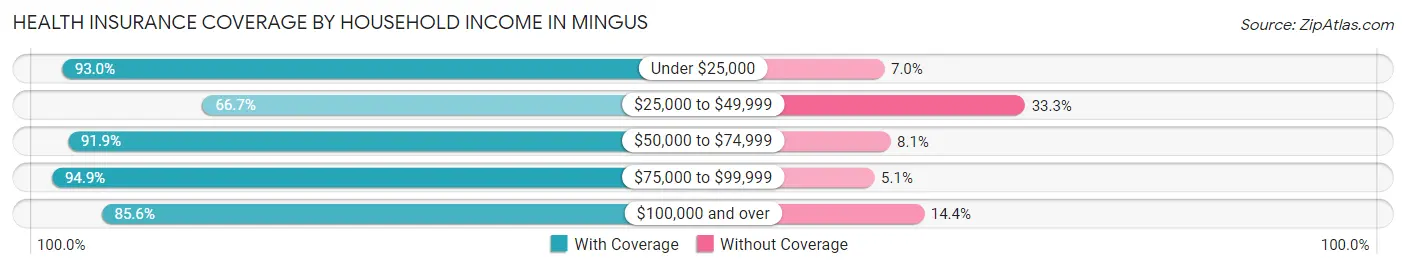
| Household Income | With Coverage | Without Coverage |
| Under $25,000 | 40 (93.0%) | 3 (7.0%) |
| $25,000 to $49,999 | 52 (66.7%) | 26 (33.3%) |
| $50,000 to $74,999 | 34 (91.9%) | 3 (8.1%) |
| $75,000 to $99,999 | 37 (94.9%) | 2 (5.1%) |
| $100,000 and over | 89 (85.6%) | 15 (14.4%) |
Public vs Private Health Insurance Coverage by Age in Mingus
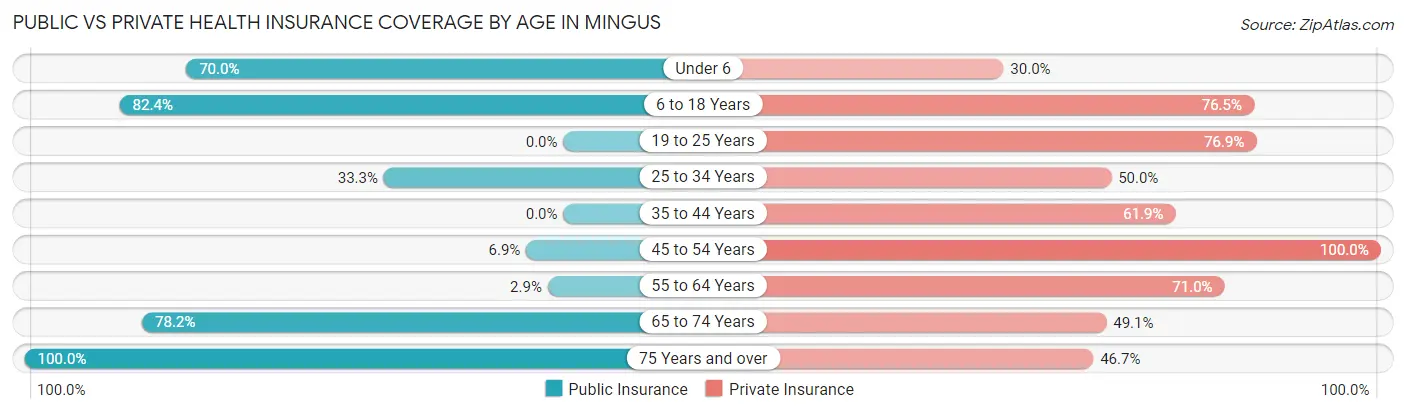
| Age Bracket | Public Insurance | Private Insurance |
| Under 6 | 14 (70.0%) | 6 (30.0%) |
| 6 to 18 Years | 28 (82.4%) | 26 (76.5%) |
| 19 to 25 Years | 0 (0.0%) | 10 (76.9%) |
| 25 to 34 Years | 10 (33.3%) | 15 (50.0%) |
| 35 to 44 Years | 0 (0.0%) | 13 (61.9%) |
| 45 to 54 Years | 2 (6.9%) | 29 (100.0%) |
| 55 to 64 Years | 2 (2.9%) | 49 (71.0%) |
| 65 to 74 Years | 43 (78.2%) | 27 (49.1%) |
| 75 Years and over | 30 (100.0%) | 14 (46.7%) |
| Total | 129 (42.9%) | 189 (62.8%) |
Disability Status by Sex by Age in Mingus
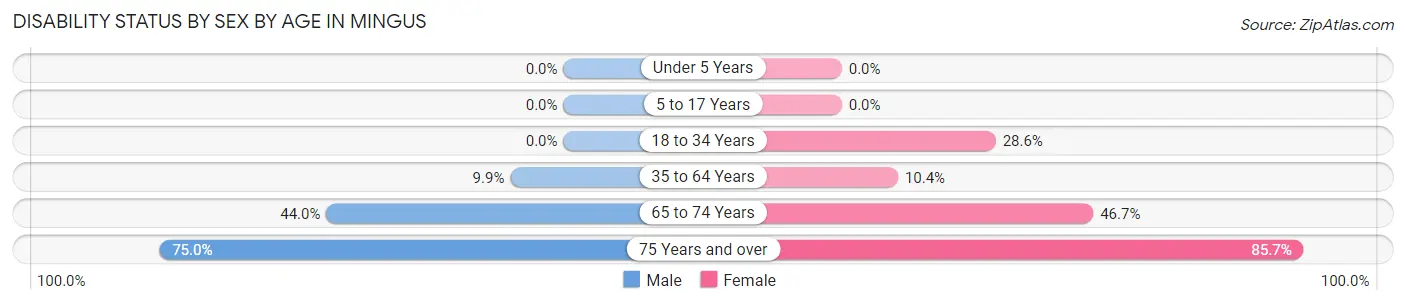
| Age Bracket | Male | Female |
| Under 5 Years | 0 (0.0%) | 0 (0.0%) |
| 5 to 17 Years | 0 (0.0%) | 0 (0.0%) |
| 18 to 34 Years | 0 (0.0%) | 4 (28.6%) |
| 35 to 64 Years | 7 (9.9%) | 5 (10.4%) |
| 65 to 74 Years | 11 (44.0%) | 14 (46.7%) |
| 75 Years and over | 12 (75.0%) | 12 (85.7%) |
Disability Class by Sex by Age in Mingus
Disability Class: Hearing Difficulty
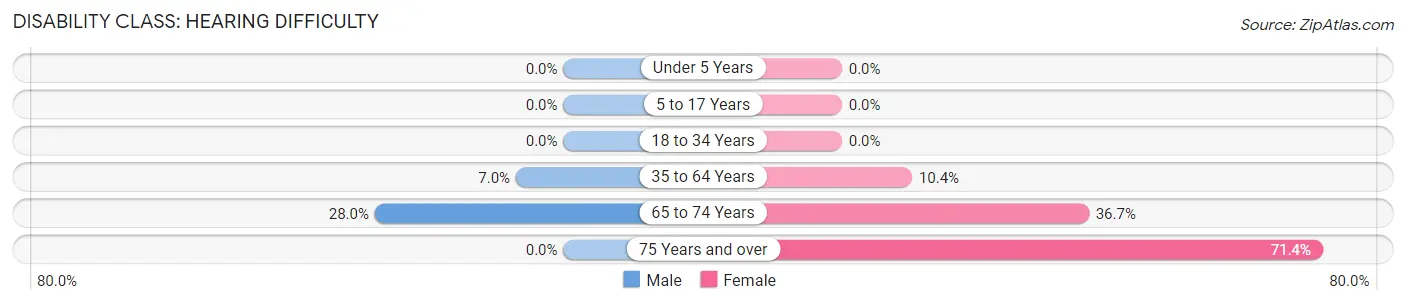
| Age Bracket | Male | Female |
| Under 5 Years | 0 (0.0%) | 0 (0.0%) |
| 5 to 17 Years | 0 (0.0%) | 0 (0.0%) |
| 18 to 34 Years | 0 (0.0%) | 0 (0.0%) |
| 35 to 64 Years | 5 (7.0%) | 5 (10.4%) |
| 65 to 74 Years | 7 (28.0%) | 11 (36.7%) |
| 75 Years and over | 0 (0.0%) | 10 (71.4%) |
Disability Class: Vision Difficulty
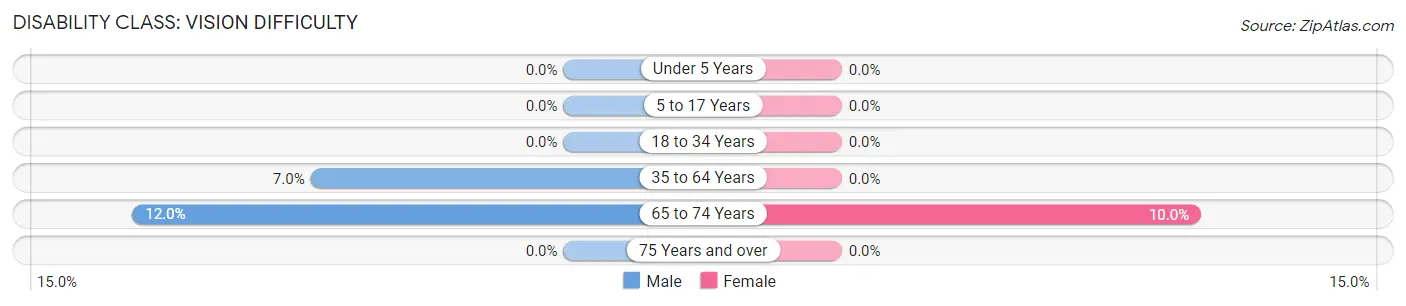
| Age Bracket | Male | Female |
| Under 5 Years | 0 (0.0%) | 0 (0.0%) |
| 5 to 17 Years | 0 (0.0%) | 0 (0.0%) |
| 18 to 34 Years | 0 (0.0%) | 0 (0.0%) |
| 35 to 64 Years | 5 (7.0%) | 0 (0.0%) |
| 65 to 74 Years | 3 (12.0%) | 3 (10.0%) |
| 75 Years and over | 0 (0.0%) | 0 (0.0%) |
Disability Class: Cognitive Difficulty
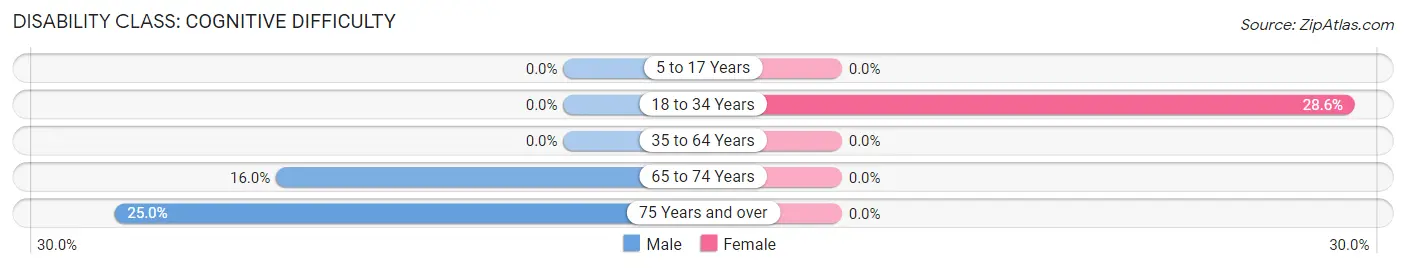
| Age Bracket | Male | Female |
| 5 to 17 Years | 0 (0.0%) | 0 (0.0%) |
| 18 to 34 Years | 0 (0.0%) | 4 (28.6%) |
| 35 to 64 Years | 0 (0.0%) | 0 (0.0%) |
| 65 to 74 Years | 4 (16.0%) | 0 (0.0%) |
| 75 Years and over | 4 (25.0%) | 0 (0.0%) |
Disability Class: Ambulatory Difficulty
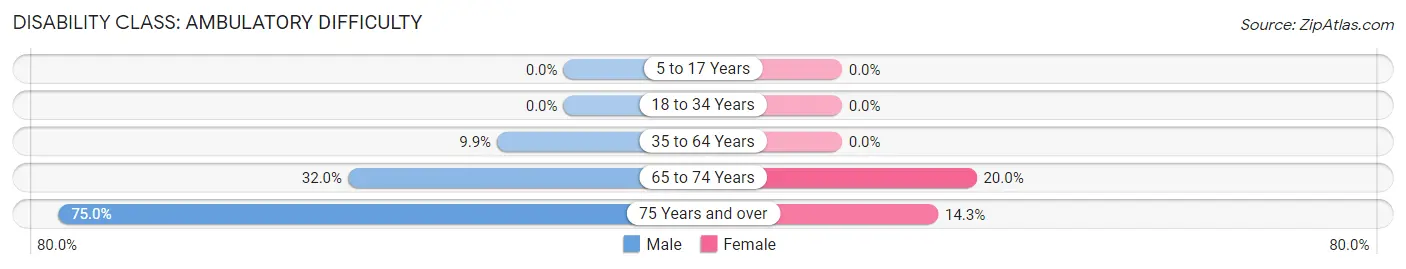
| Age Bracket | Male | Female |
| 5 to 17 Years | 0 (0.0%) | 0 (0.0%) |
| 18 to 34 Years | 0 (0.0%) | 0 (0.0%) |
| 35 to 64 Years | 7 (9.9%) | 0 (0.0%) |
| 65 to 74 Years | 8 (32.0%) | 6 (20.0%) |
| 75 Years and over | 12 (75.0%) | 2 (14.3%) |
Disability Class: Self-Care Difficulty
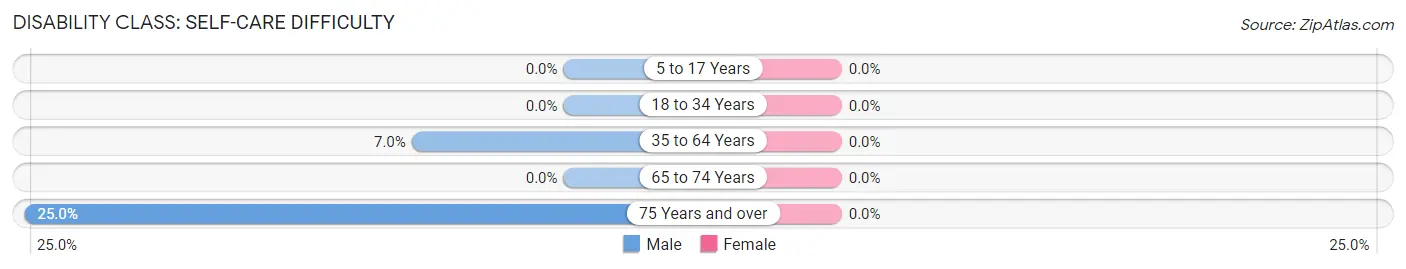
| Age Bracket | Male | Female |
| 5 to 17 Years | 0 (0.0%) | 0 (0.0%) |
| 18 to 34 Years | 0 (0.0%) | 0 (0.0%) |
| 35 to 64 Years | 5 (7.0%) | 0 (0.0%) |
| 65 to 74 Years | 0 (0.0%) | 0 (0.0%) |
| 75 Years and over | 4 (25.0%) | 0 (0.0%) |
Technology Access in Mingus
Computing Device Access in Mingus
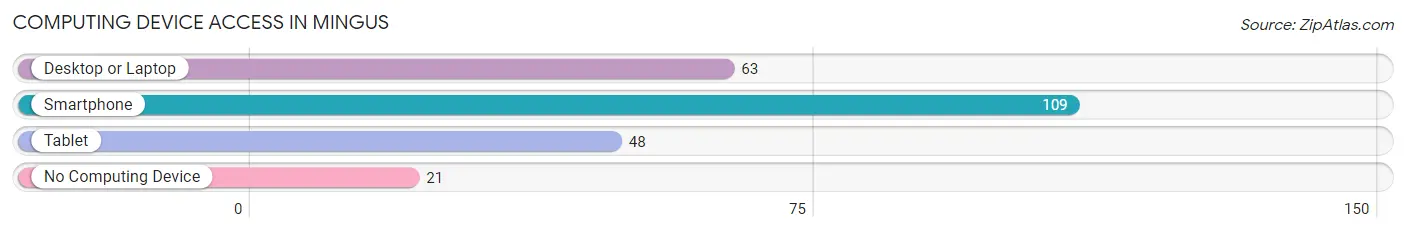
| Device Type | # Households | % Households |
| Desktop or Laptop | 63 | 46.0% |
| Smartphone | 109 | 79.6% |
| Tablet | 48 | 35.0% |
| No Computing Device | 21 | 15.3% |
| Total | 137 | 100.0% |
Internet Access in Mingus
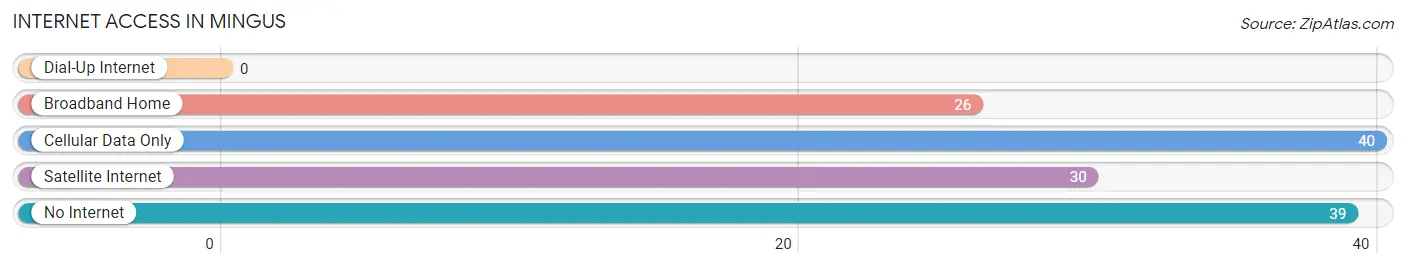
| Internet Type | # Households | % Households |
| Dial-Up Internet | 0 | 0.0% |
| Broadband Home | 26 | 19.0% |
| Cellular Data Only | 40 | 29.2% |
| Satellite Internet | 30 | 21.9% |
| No Internet | 39 | 28.5% |
| Total | 137 | 100.0% |
Mingus Summary
Mingus is a small town located in Palo Pinto County, Texas. It is situated in the western part of the state, about 80 miles west of Fort Worth. The town was founded in 1881 and named after a local rancher, John Mingus. The population of Mingus was estimated to be around 500 people in 2020.
History
Mingus was founded in 1881 by John Mingus, a local rancher. The town was originally called Mingusville, but the name was changed to Mingus in 1883. The town was incorporated in 1884 and the first post office was established in 1885.
The town grew slowly but steadily over the years, and by the early 1900s, it had become a thriving community. The town was home to several businesses, including a general store, a blacksmith shop, a livery stable, and a hotel.
In the early 1900s, Mingus was also home to a number of churches, including the Methodist, Baptist, and Presbyterian churches. The town also had a school, which was established in 1891.
Geography
Mingus is located in the western part of Palo Pinto County, Texas. It is situated about 80 miles west of Fort Worth. The town is located in the Palo Pinto Mountains, which are part of the larger Cross Timbers region. The town is surrounded by rolling hills and grasslands, and is home to several creeks and streams.
The climate in Mingus is generally mild, with hot summers and cool winters. The average annual temperature is around 65 degrees Fahrenheit. The town receives an average of 33 inches of rain per year.
Economy
Mingus is a small, rural town with a limited economy. The town is home to a few small businesses, including a general store, a gas station, and a few restaurants. The town is also home to a few small farms and ranches.
The town is also home to a few manufacturing companies, including a furniture factory and a metal fabrication plant. The town is also home to a few oil and gas companies, which are involved in the exploration and production of oil and gas in the area.
Demographics
The population of Mingus was estimated to be around 500 people in 2020. The town is predominantly white, with around 95% of the population being white. The remaining 5% of the population is made up of African Americans, Hispanics, and Native Americans.
The median household income in Mingus is around $35,000 per year. The town has a poverty rate of around 20%, which is higher than the national average. The town also has a high unemployment rate, with around 10% of the population being unemployed.
Conclusion
Mingus is a small town located in Palo Pinto County, Texas. It was founded in 1881 and has a population of around 500 people. The town is predominantly white, with a median household income of around $35,000 per year. The town has a limited economy, with a few small businesses and manufacturing companies. The town also has a high poverty rate and a high unemployment rate.
Common Questions
What is Per Capita Income in Mingus?
Per Capita income in Mingus is $26,748.
What is the Median Family Income in Mingus?
Median Family Income in Mingus is $81,250.
What is the Median Household income in Mingus?
Median Household Income in Mingus is $46,250.
What is Inequality or Gini Index in Mingus?
Inequality or Gini Index in Mingus is 0.40.
What is the Total Population of Mingus?
Total Population of Mingus is 301.
What is the Total Male Population of Mingus?
Total Male Population of Mingus is 173.
What is the Total Female Population of Mingus?
Total Female Population of Mingus is 128.
What is the Ratio of Males per 100 Females in Mingus?
There are 135.16 Males per 100 Females in Mingus.
What is the Ratio of Females per 100 Males in Mingus?
There are 73.99 Females per 100 Males in Mingus.
What is the Median Population Age in Mingus?
Median Population Age in Mingus is 56.7 Years.
What is the Average Family Size in Mingus
Average Family Size in Mingus is 3.1 People.
What is the Average Household Size in Mingus
Average Household Size in Mingus is 2.2 People.
How Large is the Labor Force in Mingus?
There are 144 People in the Labor Forcein in Mingus.
What is the Percentage of People in the Labor Force in Mingus?
53.5% of People are in the Labor Force in Mingus.
What is the Unemployment Rate in Mingus?
Unemployment Rate in Mingus is 2.8%.