Orange, TX Map & Demographics
Orange Map
Orange Overview
$30,786
PER CAPITA INCOME
$70,703
AVG FAMILY INCOME
$58,756
AVG HOUSEHOLD INCOME
30.7%
WAGE / INCOME GAP [ % ]
69.3¢/ $1
WAGE / INCOME GAP [ $ ]
$10,600
FAMILY INCOME DEFICIT
0.46
INEQUALITY / GINI INDEX
19,221
TOTAL POPULATION
9,480
MALE POPULATION
9,741
FEMALE POPULATION
97.32
MALES / 100 FEMALES
102.75
FEMALES / 100 MALES
34.7
MEDIAN AGE
3.4
AVG FAMILY SIZE
2.7
AVG HOUSEHOLD SIZE
8,740
LABOR FORCE [ PEOPLE ]
59.8%
PERCENT IN LABOR FORCE
8.7%
UNEMPLOYMENT RATE
Orange Area Codes
Income in Orange
Income Overview in Orange
Per Capita Income in Orange is $30,786, while median incomes of families and households are $70,703 and $58,756 respectively.
| Characteristic | Number | Measure |
| Per Capita Income | 19,221 | $30,786 |
| Median Family Income | 4,514 | $70,703 |
| Mean Family Income | 4,514 | $89,779 |
| Median Household Income | 6,901 | $58,756 |
| Mean Household Income | 6,901 | $80,729 |
| Income Deficit | 4,514 | $10,600 |
| Wage / Income Gap (%) | 19,221 | 30.69% |
| Wage / Income Gap ($) | 19,221 | 69.31¢ per $1 |
| Gini / Inequality Index | 19,221 | 0.46 |
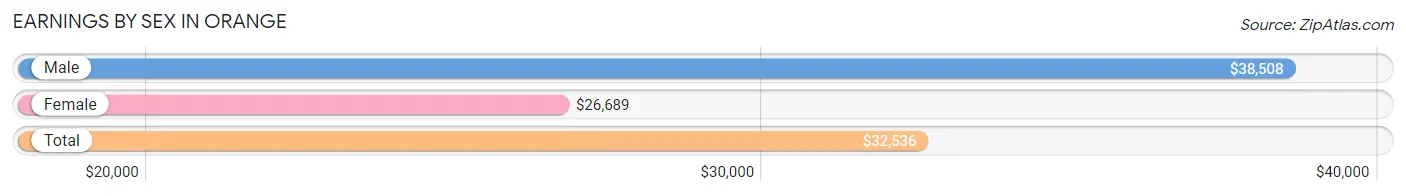
Earnings by Sex in Orange
Average Earnings in Orange are $32,536, $38,508 for men and $26,689 for women, a difference of 30.7%.
| Sex | Number | Average Earnings |
| Male | 4,598 (50.9%) | $38,508 |
| Female | 4,440 (49.1%) | $26,689 |
| Total | 9,038 (100.0%) | $32,536 |
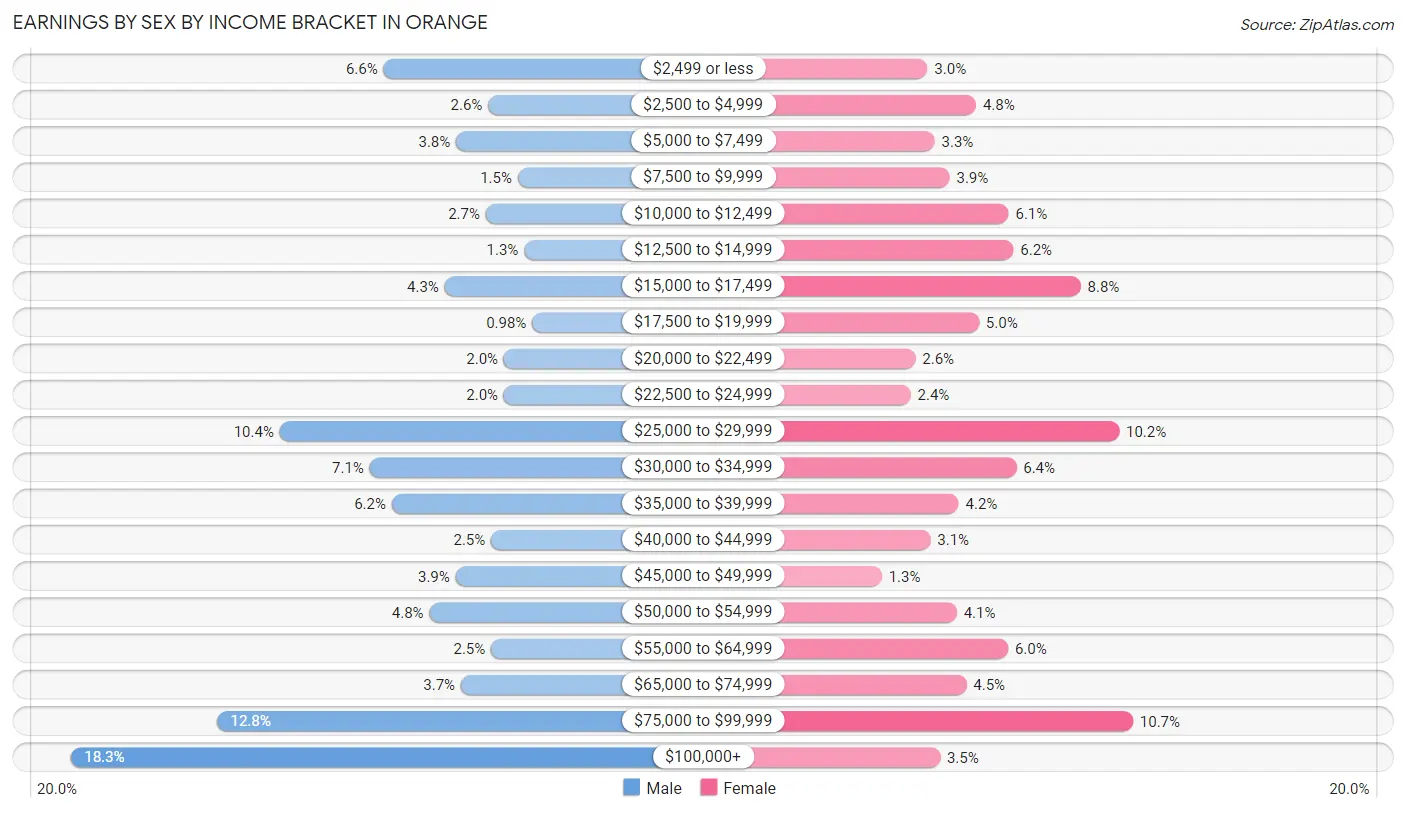
Earnings by Sex by Income Bracket in Orange
The most common earnings brackets in Orange are $100,000+ for men (839 | 18.2%) and $75,000 to $99,999 for women (476 | 10.7%).
| Income | Male | Female |
| $2,499 or less | 301 (6.6%) | 134 (3.0%) |
| $2,500 to $4,999 | 121 (2.6%) | 215 (4.8%) |
| $5,000 to $7,499 | 176 (3.8%) | 146 (3.3%) |
| $7,500 to $9,999 | 70 (1.5%) | 171 (3.8%) |
| $10,000 to $12,499 | 125 (2.7%) | 269 (6.1%) |
| $12,500 to $14,999 | 59 (1.3%) | 277 (6.2%) |
| $15,000 to $17,499 | 196 (4.3%) | 389 (8.8%) |
| $17,500 to $19,999 | 45 (1.0%) | 220 (5.0%) |
| $20,000 to $22,499 | 94 (2.0%) | 114 (2.6%) |
| $22,500 to $24,999 | 94 (2.0%) | 106 (2.4%) |
| $25,000 to $29,999 | 480 (10.4%) | 453 (10.2%) |
| $30,000 to $34,999 | 325 (7.1%) | 282 (6.4%) |
| $35,000 to $39,999 | 287 (6.2%) | 186 (4.2%) |
| $40,000 to $44,999 | 116 (2.5%) | 139 (3.1%) |
| $45,000 to $49,999 | 177 (3.8%) | 58 (1.3%) |
| $50,000 to $54,999 | 222 (4.8%) | 183 (4.1%) |
| $55,000 to $64,999 | 116 (2.5%) | 268 (6.0%) |
| $65,000 to $74,999 | 168 (3.6%) | 199 (4.5%) |
| $75,000 to $99,999 | 587 (12.8%) | 476 (10.7%) |
| $100,000+ | 839 (18.2%) | 155 (3.5%) |
| Total | 4,598 (100.0%) | 4,440 (100.0%) |
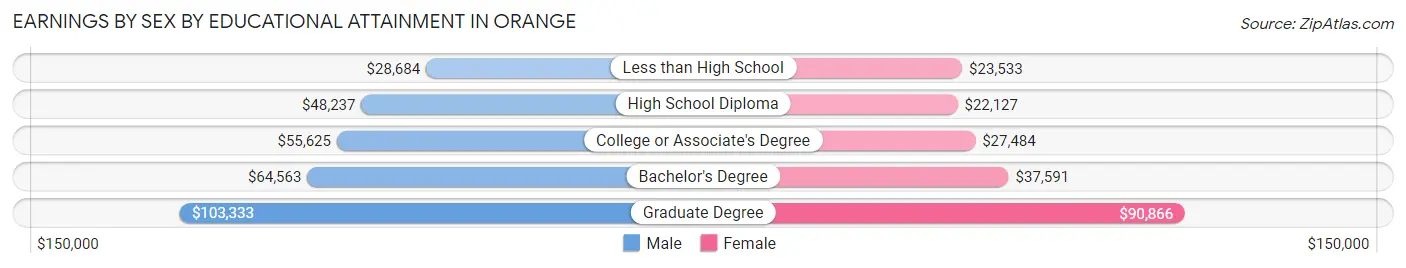
Earnings by Sex by Educational Attainment in Orange
Average earnings in Orange are $47,742 for men and $29,202 for women, a difference of 38.8%. Men with an educational attainment of graduate degree enjoy the highest average annual earnings of $103,333, while those with less than high school education earn the least with $28,684. Women with an educational attainment of graduate degree earn the most with the average annual earnings of $90,866, while those with high school diploma education have the smallest earnings of $22,127.
| Educational Attainment | Male Income | Female Income |
| Less than High School | $28,684 | $23,533 |
| High School Diploma | $48,237 | $22,127 |
| College or Associate's Degree | $55,625 | $27,484 |
| Bachelor's Degree | $64,563 | $37,591 |
| Graduate Degree | $103,333 | $90,866 |
| Total | $47,742 | $29,202 |
Family Income in Orange
Family Income Brackets in Orange
According to the Orange family income data, there are 989 families falling into the $100,000 to $149,999 income range, which is the most common income bracket and makes up 21.9% of all families. Conversely, the $10,000 to $14,999 income bracket is the least frequent group with only 41 families (0.9%) belonging to this category.
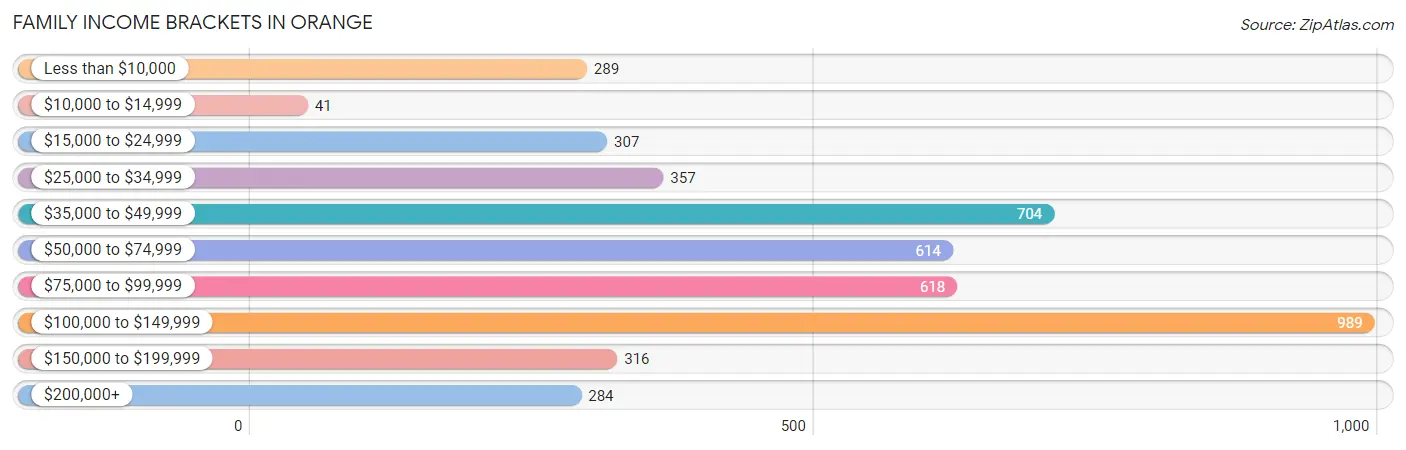
| Income Bracket | # Families | % Families |
| Less than $10,000 | 289 | 6.4% |
| $10,000 to $14,999 | 41 | 0.9% |
| $15,000 to $24,999 | 307 | 6.8% |
| $25,000 to $34,999 | 357 | 7.9% |
| $35,000 to $49,999 | 704 | 15.6% |
| $50,000 to $74,999 | 614 | 13.6% |
| $75,000 to $99,999 | 618 | 13.7% |
| $100,000 to $149,999 | 989 | 21.9% |
| $150,000 to $199,999 | 316 | 7.0% |
| $200,000+ | 284 | 6.3% |
Family Income by Famaliy Size in Orange
5-person families (637 | 14.1%) account for the highest median family income in Orange with $92,836 per family, while 2-person families (2,310 | 51.2%) have the highest median income of $35,198 per family member.
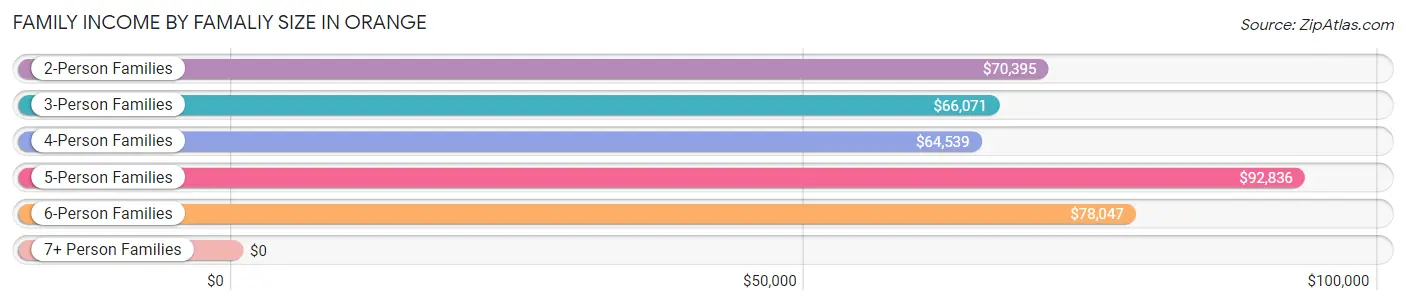
| Income Bracket | # Families | Median Income |
| 2-Person Families | 2,310 (51.2%) | $70,395 |
| 3-Person Families | 842 (18.6%) | $66,071 |
| 4-Person Families | 531 (11.8%) | $64,539 |
| 5-Person Families | 637 (14.1%) | $92,836 |
| 6-Person Families | 105 (2.3%) | $78,047 |
| 7+ Person Families | 89 (2.0%) | $0 |
| Total | 4,514 (100.0%) | $70,703 |
Family Income by Number of Earners in Orange
The median family income in Orange is $70,703, with families comprising 3+ earners (365) having the highest median family income of $116,250, while families with 1 earner (2,090) have the lowest median family income of $55,000, accounting for 8.1% and 46.3% of families, respectively.
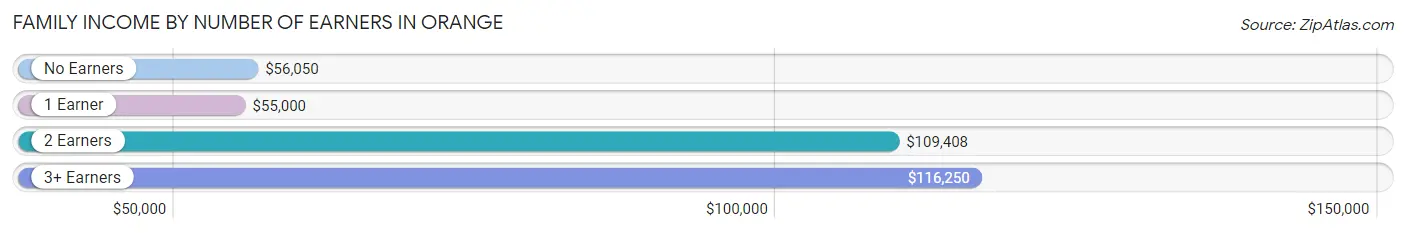
| Number of Earners | # Families | Median Income |
| No Earners | 606 (13.4%) | $56,050 |
| 1 Earner | 2,090 (46.3%) | $55,000 |
| 2 Earners | 1,453 (32.2%) | $109,408 |
| 3+ Earners | 365 (8.1%) | $116,250 |
| Total | 4,514 (100.0%) | $70,703 |
Household Income in Orange
Household Income Brackets in Orange
With 1,097 households falling in the category, the $50,000 to $74,999 income range is the most frequent in Orange, accounting for 15.9% of all households. In contrast, only 235 households (3.4%) fall into the $10,000 to $14,999 income bracket, making it the least populous group.
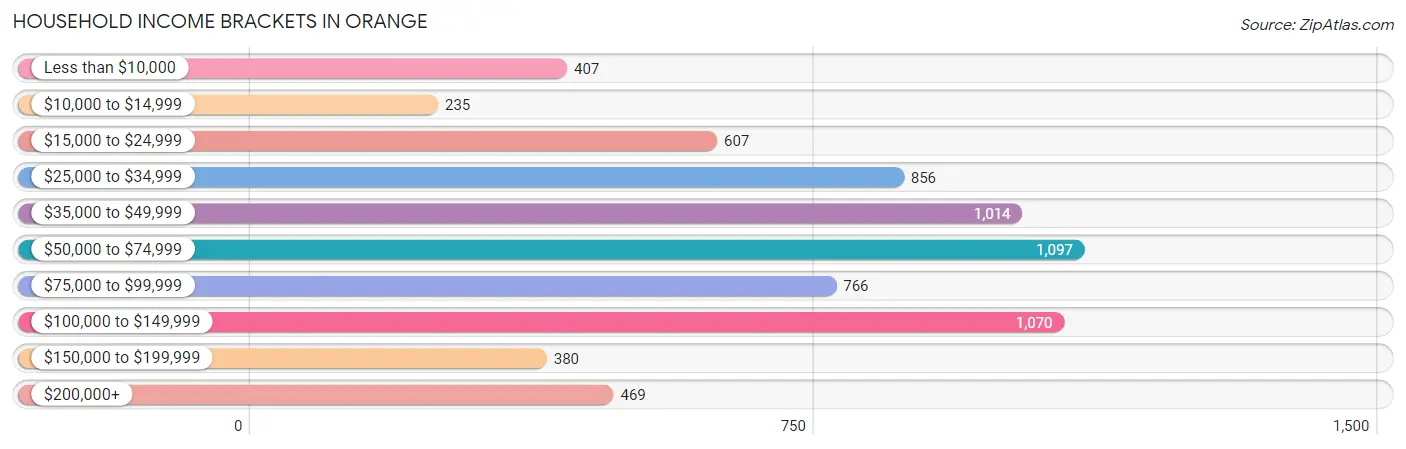
| Income Bracket | # Households | % Households |
| Less than $10,000 | 407 | 5.9% |
| $10,000 to $14,999 | 235 | 3.4% |
| $15,000 to $24,999 | 607 | 8.8% |
| $25,000 to $34,999 | 856 | 12.4% |
| $35,000 to $49,999 | 1,014 | 14.7% |
| $50,000 to $74,999 | 1,097 | 15.9% |
| $75,000 to $99,999 | 766 | 11.1% |
| $100,000 to $149,999 | 1,070 | 15.5% |
| $150,000 to $199,999 | 380 | 5.5% |
| $200,000+ | 469 | 6.8% |
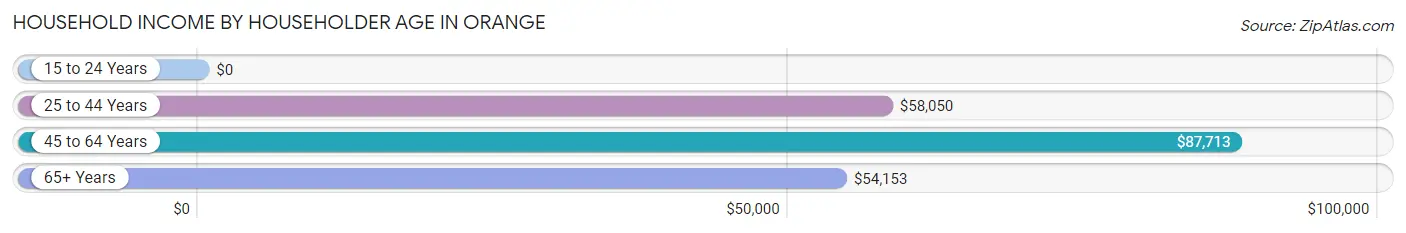
Household Income by Householder Age in Orange
The median household income in Orange is $58,756, with the highest median household income of $87,713 found in the 45 to 64 years age bracket for the primary householder. A total of 2,155 households (31.2%) fall into this category. Meanwhile, the 15 to 24 years age bracket for the primary householder has the lowest median household income of $0, with 469 households (6.8%) in this group.
| Income Bracket | # Households | Median Income |
| 15 to 24 Years | 469 (6.8%) | $0 |
| 25 to 44 Years | 2,302 (33.4%) | $58,050 |
| 45 to 64 Years | 2,155 (31.2%) | $87,713 |
| 65+ Years | 1,975 (28.6%) | $54,153 |
| Total | 6,901 (100.0%) | $58,756 |
Poverty in Orange
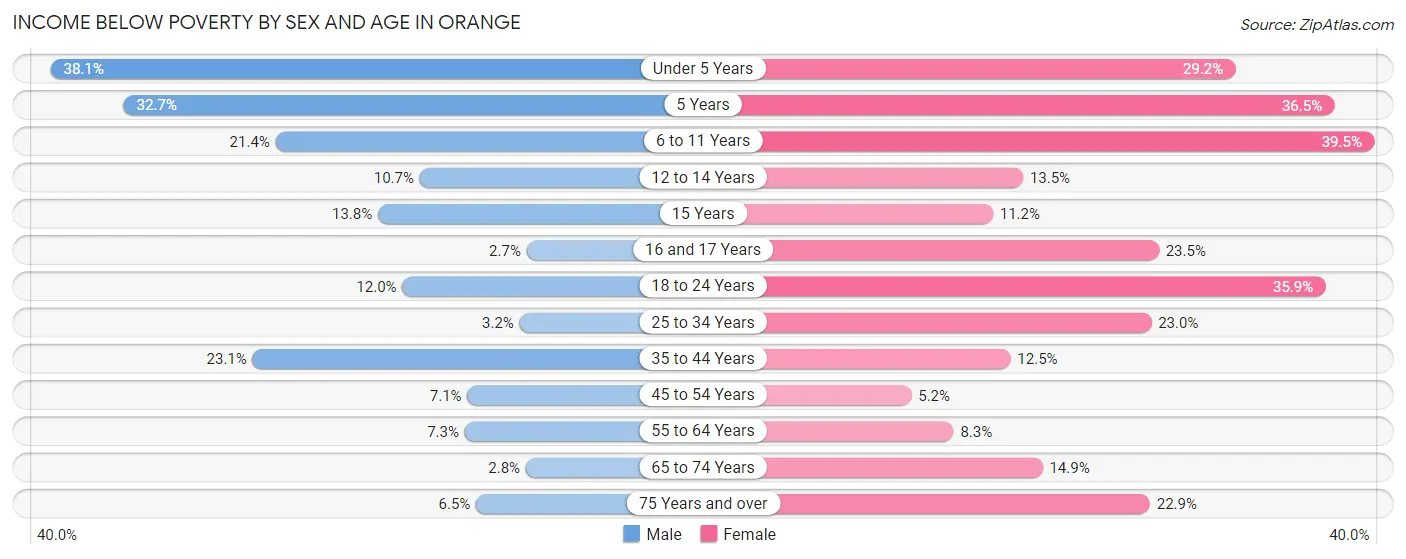
Income Below Poverty by Sex and Age in Orange
With 13.1% poverty level for males and 19.7% for females among the residents of Orange, under 5 year old males and 6 to 11 year old females are the most vulnerable to poverty, with 311 males (38.1%) and 293 females (39.5%) in their respective age groups living below the poverty level.
| Age Bracket | Male | Female |
| Under 5 Years | 311 (38.1%) | 207 (29.2%) |
| 5 Years | 32 (32.7%) | 38 (36.5%) |
| 6 to 11 Years | 185 (21.4%) | 293 (39.5%) |
| 12 to 14 Years | 61 (10.7%) | 30 (13.5%) |
| 15 Years | 15 (13.8%) | 36 (11.2%) |
| 16 and 17 Years | 7 (2.7%) | 52 (23.5%) |
| 18 to 24 Years | 87 (11.9%) | 221 (35.9%) |
| 25 to 34 Years | 50 (3.2%) | 351 (23.0%) |
| 35 to 44 Years | 263 (23.1%) | 152 (12.5%) |
| 45 to 54 Years | 55 (7.1%) | 55 (5.2%) |
| 55 to 64 Years | 76 (7.3%) | 73 (8.3%) |
| 65 to 74 Years | 18 (2.8%) | 122 (14.9%) |
| 75 Years and over | 38 (6.5%) | 266 (22.9%) |
| Total | 1,198 (13.1%) | 1,896 (19.7%) |
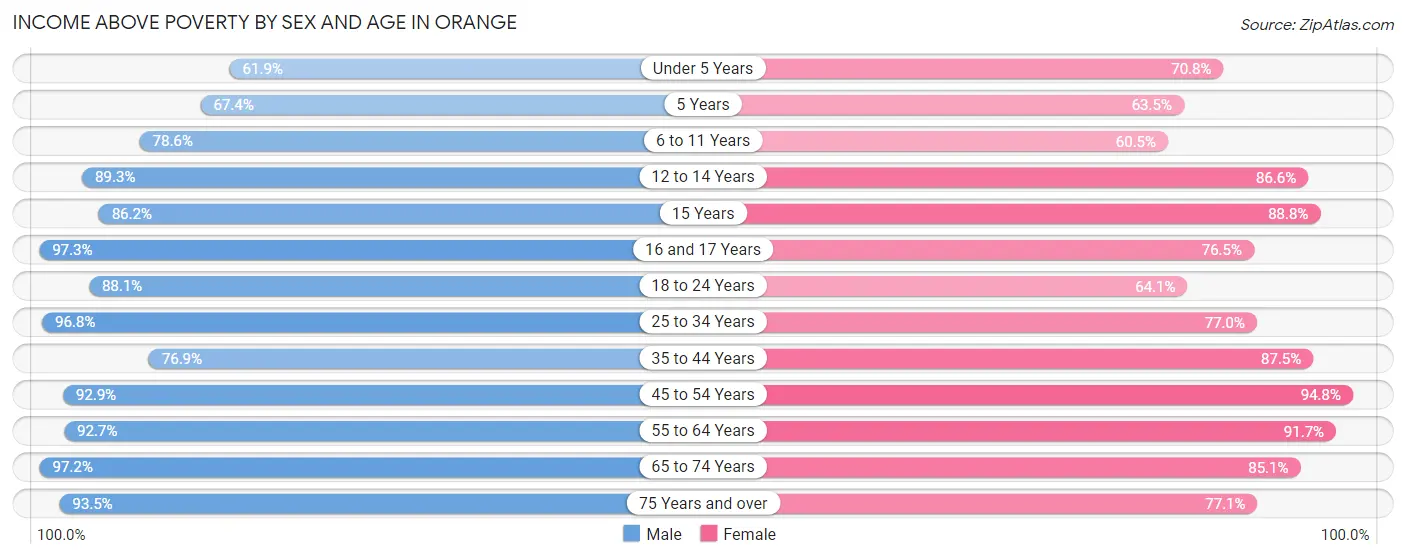
Income Above Poverty by Sex and Age in Orange
According to the poverty statistics in Orange, males aged 16 and 17 years and females aged 45 to 54 years are the age groups that are most secure financially, with 97.3% of males and 94.8% of females in these age groups living above the poverty line.
| Age Bracket | Male | Female |
| Under 5 Years | 506 (61.9%) | 502 (70.8%) |
| 5 Years | 66 (67.3%) | 66 (63.5%) |
| 6 to 11 Years | 681 (78.6%) | 449 (60.5%) |
| 12 to 14 Years | 511 (89.3%) | 193 (86.6%) |
| 15 Years | 94 (86.2%) | 285 (88.8%) |
| 16 and 17 Years | 250 (97.3%) | 169 (76.5%) |
| 18 to 24 Years | 641 (88.0%) | 395 (64.1%) |
| 25 to 34 Years | 1,494 (96.8%) | 1,177 (77.0%) |
| 35 to 44 Years | 877 (76.9%) | 1,062 (87.5%) |
| 45 to 54 Years | 717 (92.9%) | 1,011 (94.8%) |
| 55 to 64 Years | 962 (92.7%) | 808 (91.7%) |
| 65 to 74 Years | 630 (97.2%) | 697 (85.1%) |
| 75 Years and over | 549 (93.5%) | 897 (77.1%) |
| Total | 7,978 (86.9%) | 7,711 (80.3%) |
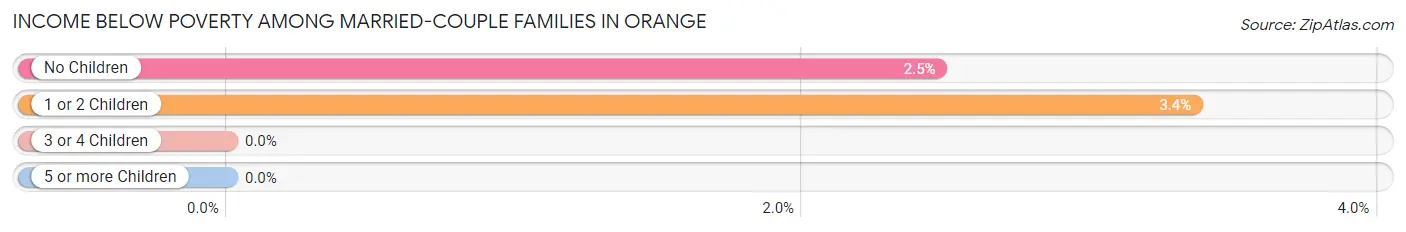
Income Below Poverty Among Married-Couple Families in Orange
The poverty statistics for married-couple families in Orange show that 2.4% or 66 of the total 2,804 families live below the poverty line. Families with 1 or 2 children have the highest poverty rate of 3.4%, comprising of 25 families. On the other hand, families with 3 or 4 children have the lowest poverty rate of 0.0%, which includes 0 families.
| Children | Above Poverty | Below Poverty |
| No Children | 1,622 (97.5%) | 41 (2.5%) |
| 1 or 2 Children | 720 (96.6%) | 25 (3.4%) |
| 3 or 4 Children | 342 (100.0%) | 0 (0.0%) |
| 5 or more Children | 54 (100.0%) | 0 (0.0%) |
| Total | 2,738 (97.7%) | 66 (2.4%) |
Income Below Poverty Among Single-Parent Households in Orange
According to the poverty data in Orange, 27.5% or 121 single-father households and 37.4% or 475 single-mother households are living below the poverty line. Among single-father households, those with 1 or 2 children have the highest poverty rate, with 109 households (50.5%) experiencing poverty. Likewise, among single-mother households, those with 5 or more children have the highest poverty rate, with 35 households (100.0%) falling below the poverty line.
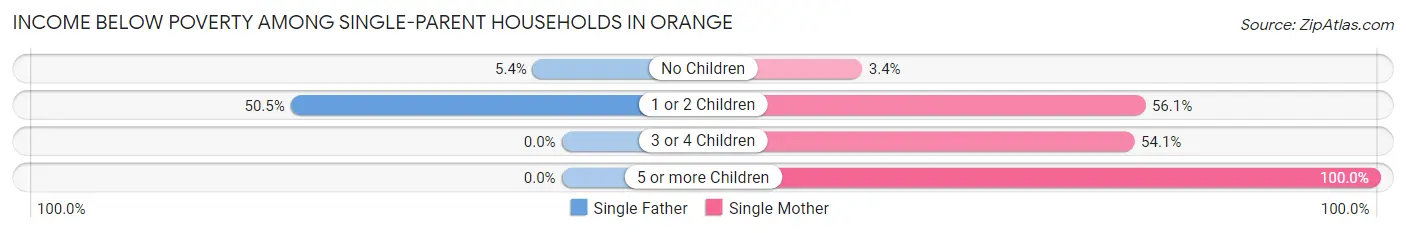
| Children | Single Father | Single Mother |
| No Children | 12 (5.4%) | 16 (3.4%) |
| 1 or 2 Children | 109 (50.5%) | 312 (56.1%) |
| 3 or 4 Children | 0 (0.0%) | 112 (54.1%) |
| 5 or more Children | 0 (0.0%) | 35 (100.0%) |
| Total | 121 (27.5%) | 475 (37.4%) |
Income Below Poverty Among Married-Couple vs Single-Parent Households in Orange
The poverty data for Orange shows that 66 of the married-couple family households (2.4%) and 596 of the single-parent households (34.8%) are living below the poverty level. Within the married-couple family households, those with 1 or 2 children have the highest poverty rate, with 25 households (3.4%) falling below the poverty line. Among the single-parent households, those with 5 or more children have the highest poverty rate, with 35 household (100.0%) living below poverty.
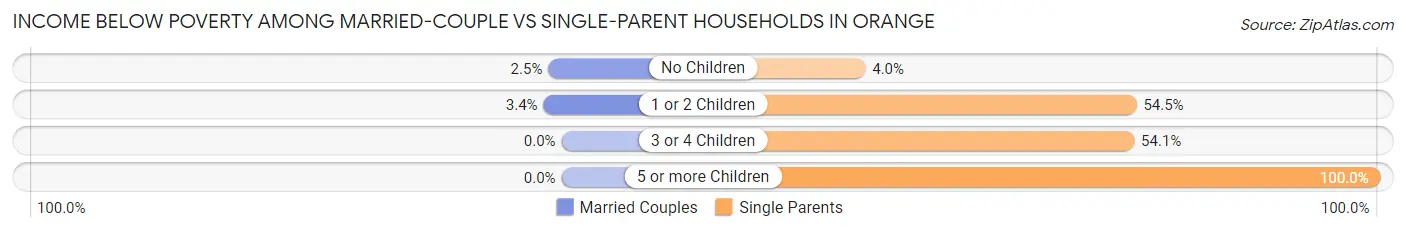
| Children | Married-Couple Families | Single-Parent Households |
| No Children | 41 (2.5%) | 28 (4.0%) |
| 1 or 2 Children | 25 (3.4%) | 421 (54.5%) |
| 3 or 4 Children | 0 (0.0%) | 112 (54.1%) |
| 5 or more Children | 0 (0.0%) | 35 (100.0%) |
| Total | 66 (2.4%) | 596 (34.8%) |
Race in Orange
The most populous races in Orange are White / Caucasian (11,273 | 58.7%), Black / African American (6,048 | 31.5%), and Hispanic or Latino (1,767 | 9.2%).
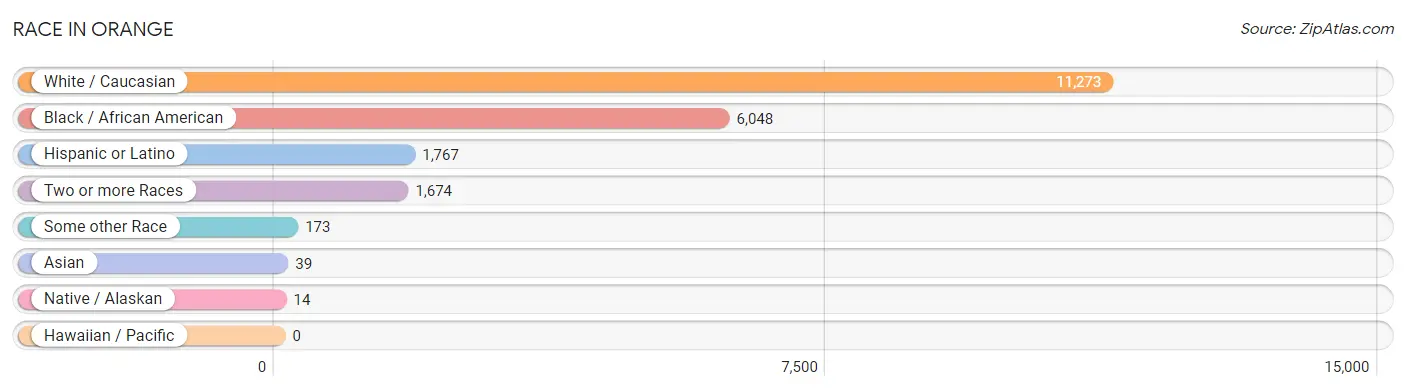
| Race | # Population | % Population |
| Asian | 39 | 0.2% |
| Black / African American | 6,048 | 31.5% |
| Hawaiian / Pacific | 0 | 0.0% |
| Hispanic or Latino | 1,767 | 9.2% |
| Native / Alaskan | 14 | 0.1% |
| White / Caucasian | 11,273 | 58.7% |
| Two or more Races | 1,674 | 8.7% |
| Some other Race | 173 | 0.9% |
| Total | 19,221 | 100.0% |
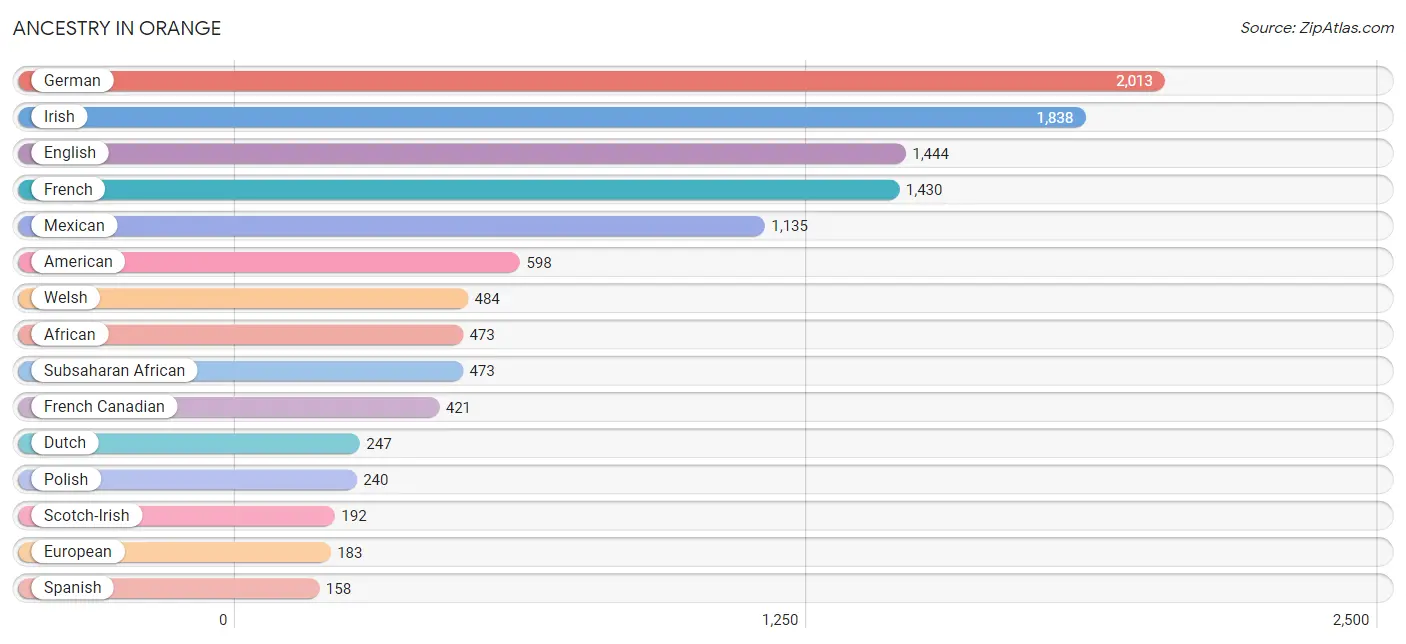
Ancestry in Orange
The most populous ancestries reported in Orange are German (2,013 | 10.5%), Irish (1,838 | 9.6%), English (1,444 | 7.5%), French (1,430 | 7.4%), and Mexican (1,135 | 5.9%), together accounting for 40.9% of all Orange residents.
| Ancestry | # Population | % Population |
| African | 473 | 2.5% |
| American | 598 | 3.1% |
| Apache | 10 | 0.1% |
| Arab | 48 | 0.3% |
| Blackfeet | 4 | 0.0% |
| British | 24 | 0.1% |
| Cajun | 88 | 0.5% |
| Central American | 137 | 0.7% |
| Cherokee | 20 | 0.1% |
| Chickasaw | 26 | 0.1% |
| Choctaw | 23 | 0.1% |
| Comanche | 16 | 0.1% |
| Creek | 7 | 0.0% |
| Czech | 13 | 0.1% |
| Czechoslovakian | 7 | 0.0% |
| Danish | 7 | 0.0% |
| Dominican | 121 | 0.6% |
| Dutch | 247 | 1.3% |
| English | 1,444 | 7.5% |
| European | 183 | 0.9% |
| French | 1,430 | 7.4% |
| French Canadian | 421 | 2.2% |
| German | 2,013 | 10.5% |
| Guatemalan | 15 | 0.1% |
| Haitian | 48 | 0.3% |
| Honduran | 6 | 0.0% |
| Hungarian | 6 | 0.0% |
| Irish | 1,838 | 9.6% |
| Italian | 133 | 0.7% |
| Mexican | 1,135 | 5.9% |
| Moroccan | 26 | 0.1% |
| Northern European | 10 | 0.1% |
| Norwegian | 55 | 0.3% |
| Palestinian | 2 | 0.0% |
| Polish | 240 | 1.3% |
| Puerto Rican | 74 | 0.4% |
| Russian | 12 | 0.1% |
| Salvadoran | 116 | 0.6% |
| Scandinavian | 24 | 0.1% |
| Scotch-Irish | 192 | 1.0% |
| Scottish | 92 | 0.5% |
| Sioux | 4 | 0.0% |
| Slovak | 76 | 0.4% |
| Spanish | 158 | 0.8% |
| Sri Lankan | 3 | 0.0% |
| Subsaharan African | 473 | 2.5% |
| Swedish | 7 | 0.0% |
| Swiss | 5 | 0.0% |
| Syrian | 1 | 0.0% |
| Thai | 36 | 0.2% |
| Welsh | 484 | 2.5% | View All 51 Rows |
Immigrants in Orange
The most numerous immigrant groups reported in Orange came from Latin America (675 | 3.5%), Central America (546 | 2.8%), Mexico (460 | 2.4%), Caribbean (129 | 0.7%), and Dominican Republic (114 | 0.6%), together accounting for 10.0% of all Orange residents.
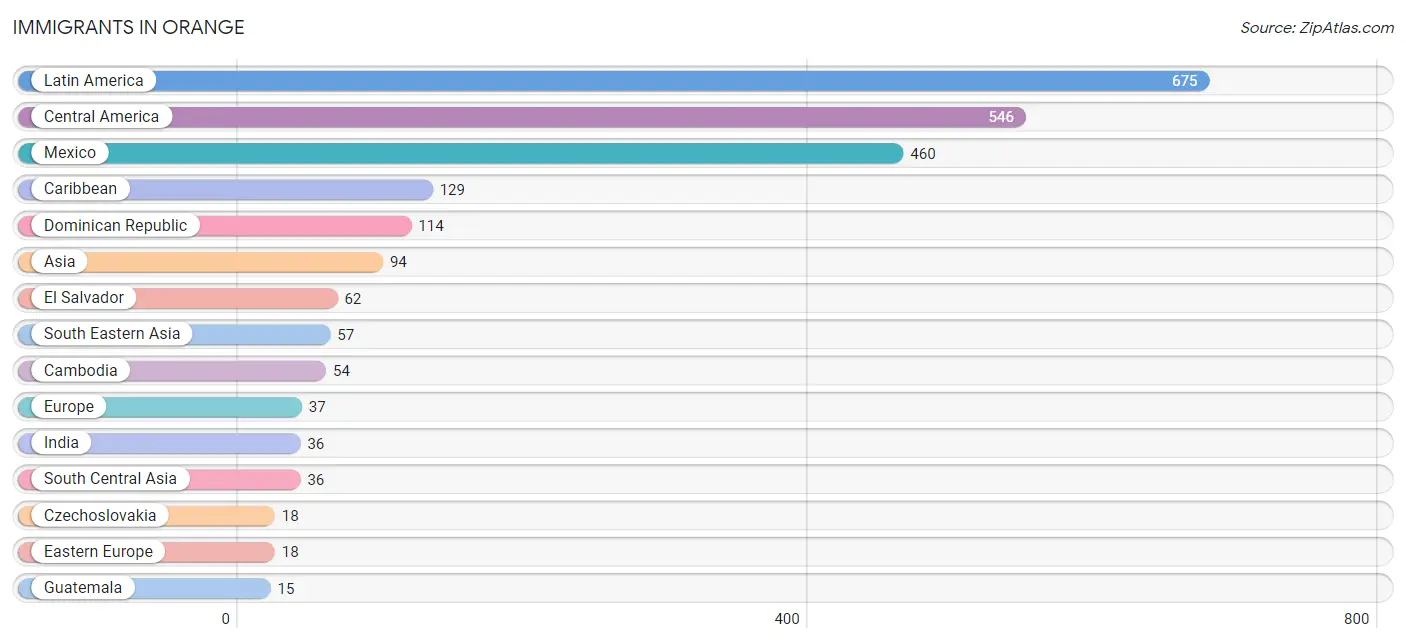
| Immigration Origin | # Population | % Population |
| Asia | 94 | 0.5% |
| Cambodia | 54 | 0.3% |
| Canada | 5 | 0.0% |
| Caribbean | 129 | 0.7% |
| Central America | 546 | 2.8% |
| Czechoslovakia | 18 | 0.1% |
| Dominican Republic | 114 | 0.6% |
| Eastern Europe | 18 | 0.1% |
| El Salvador | 62 | 0.3% |
| Europe | 37 | 0.2% |
| Guatemala | 15 | 0.1% |
| Haiti | 15 | 0.1% |
| Honduras | 6 | 0.0% |
| India | 36 | 0.2% |
| Italy | 5 | 0.0% |
| Latin America | 675 | 3.5% |
| Mexico | 460 | 2.4% |
| Northern Europe | 14 | 0.1% |
| Panama | 3 | 0.0% |
| Scotland | 14 | 0.1% |
| South Central Asia | 36 | 0.2% |
| South Eastern Asia | 57 | 0.3% |
| Southern Europe | 5 | 0.0% |
| Syria | 1 | 0.0% |
| Vietnam | 3 | 0.0% |
| Western Asia | 1 | 0.0% | View All 26 Rows |
Sex and Age in Orange
Sex and Age in Orange
The most populous age groups in Orange are 25 to 29 Years (1,022 | 10.8%) for men and 30 to 34 Years (808 | 8.3%) for women.
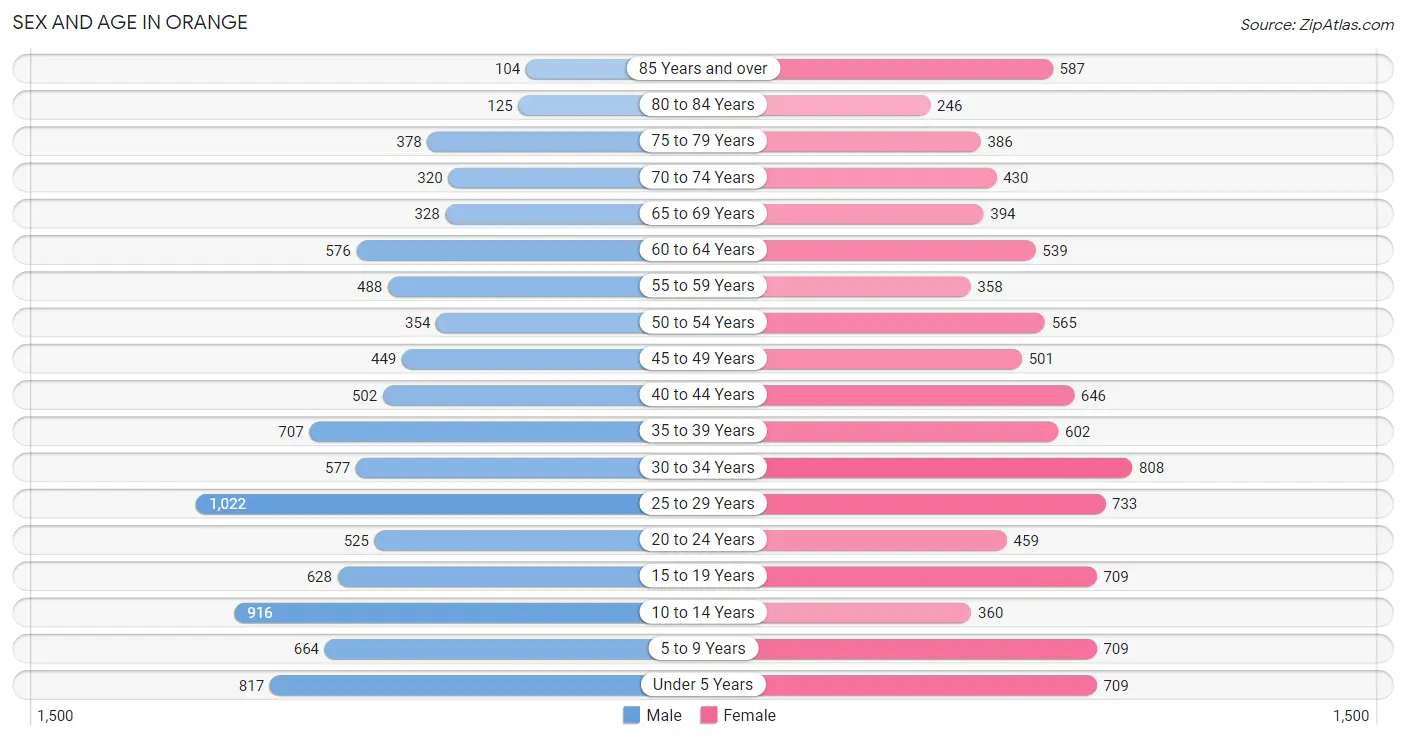
| Age Bracket | Male | Female |
| Under 5 Years | 817 (8.6%) | 709 (7.3%) |
| 5 to 9 Years | 664 (7.0%) | 709 (7.3%) |
| 10 to 14 Years | 916 (9.7%) | 360 (3.7%) |
| 15 to 19 Years | 628 (6.6%) | 709 (7.3%) |
| 20 to 24 Years | 525 (5.5%) | 459 (4.7%) |
| 25 to 29 Years | 1,022 (10.8%) | 733 (7.5%) |
| 30 to 34 Years | 577 (6.1%) | 808 (8.3%) |
| 35 to 39 Years | 707 (7.5%) | 602 (6.2%) |
| 40 to 44 Years | 502 (5.3%) | 646 (6.6%) |
| 45 to 49 Years | 449 (4.7%) | 501 (5.1%) |
| 50 to 54 Years | 354 (3.7%) | 565 (5.8%) |
| 55 to 59 Years | 488 (5.1%) | 358 (3.7%) |
| 60 to 64 Years | 576 (6.1%) | 539 (5.5%) |
| 65 to 69 Years | 328 (3.5%) | 394 (4.0%) |
| 70 to 74 Years | 320 (3.4%) | 430 (4.4%) |
| 75 to 79 Years | 378 (4.0%) | 386 (4.0%) |
| 80 to 84 Years | 125 (1.3%) | 246 (2.5%) |
| 85 Years and over | 104 (1.1%) | 587 (6.0%) |
| Total | 9,480 (100.0%) | 9,741 (100.0%) |
Families and Households in Orange
Median Family Size in Orange
The median family size in Orange is 3.35 persons per family, with single female/mother families (1,270 | 28.1%) accounting for the largest median family size of 3.51 persons per family. On the other hand, single male/father families (440 | 9.8%) represent the smallest median family size with 2.98 persons per family.
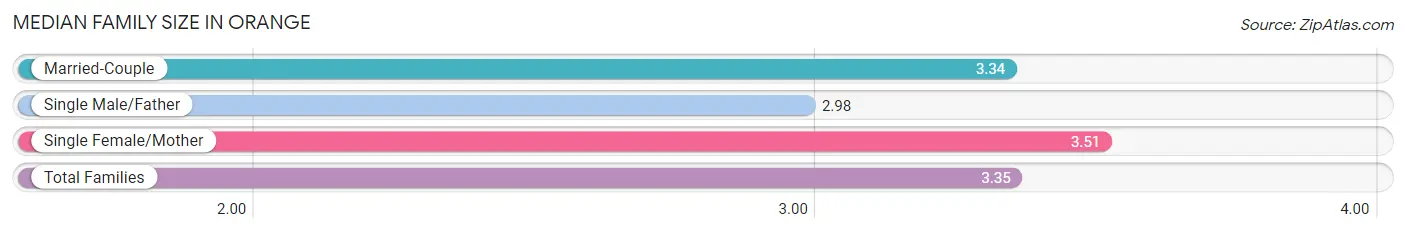
| Family Type | # Families | Family Size |
| Married-Couple | 2,804 (62.1%) | 3.34 |
| Single Male/Father | 440 (9.8%) | 2.98 |
| Single Female/Mother | 1,270 (28.1%) | 3.51 |
| Total Families | 4,514 (100.0%) | 3.35 |
Median Household Size in Orange
The median household size in Orange is 2.72 persons per household, with single female/mother households (1,270 | 18.4%) accounting for the largest median household size of 3.67 persons per household. non-family households (2,387 | 34.6%) represent the smallest median household size with 1.30 persons per household.
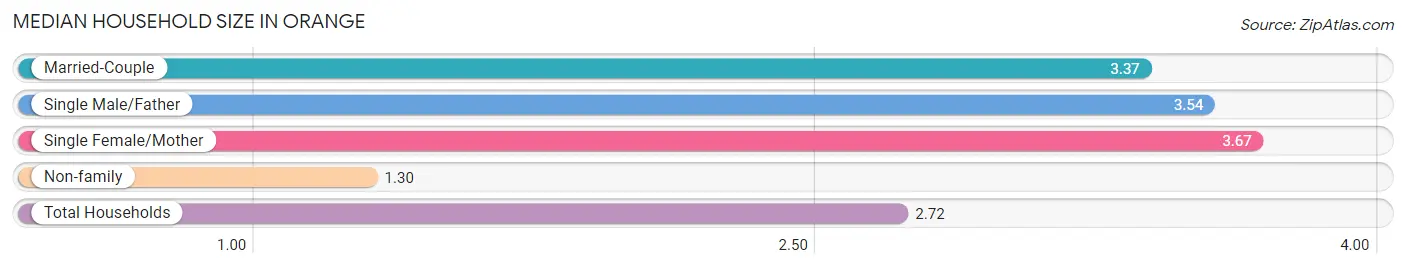
| Household Type | # Households | Household Size |
| Married-Couple | 2,804 (40.6%) | 3.37 |
| Single Male/Father | 440 (6.4%) | 3.54 |
| Single Female/Mother | 1,270 (18.4%) | 3.67 |
| Non-family | 2,387 (34.6%) | 1.30 |
| Total Households | 6,901 (100.0%) | 2.72 |
Household Size by Marriage Status in Orange
Out of a total of 6,901 households in Orange, 4,514 (65.4%) are family households, while 2,387 (34.6%) are nonfamily households. The most numerous type of family households are 2-person households, comprising 2,104, and the most common type of nonfamily households are 1-person households, comprising 1,887.
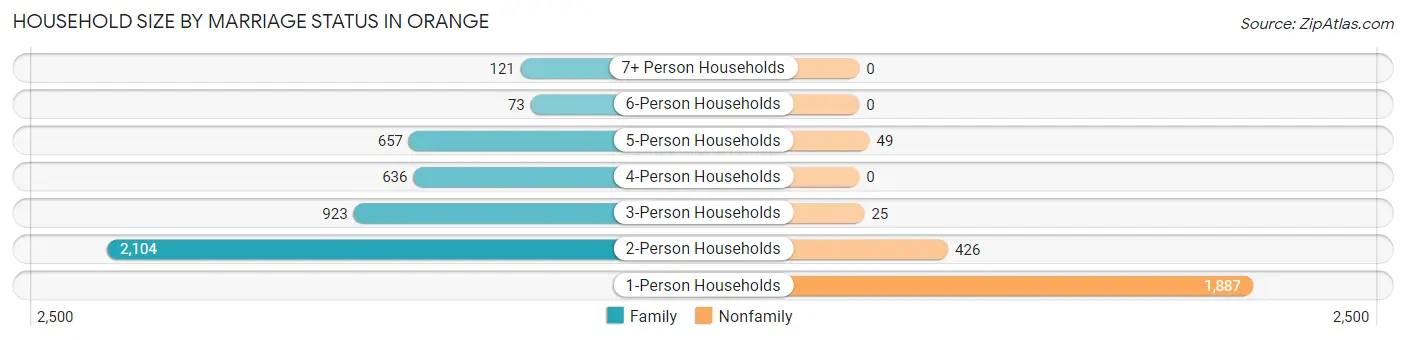
| Household Size | Family Households | Nonfamily Households |
| 1-Person Households | - | 1,887 (27.3%) |
| 2-Person Households | 2,104 (30.5%) | 426 (6.2%) |
| 3-Person Households | 923 (13.4%) | 25 (0.4%) |
| 4-Person Households | 636 (9.2%) | 0 (0.0%) |
| 5-Person Households | 657 (9.5%) | 49 (0.7%) |
| 6-Person Households | 73 (1.1%) | 0 (0.0%) |
| 7+ Person Households | 121 (1.8%) | 0 (0.0%) |
| Total | 4,514 (65.4%) | 2,387 (34.6%) |
Female Fertility in Orange
Fertility by Age in Orange
Average fertility rate in Orange is 73.0 births per 1,000 women. Women in the age bracket of 20 to 34 years have the highest fertility rate with 147.0 births per 1,000 women. Women in the age bracket of 20 to 34 years acount for 88.8% of all women with births.
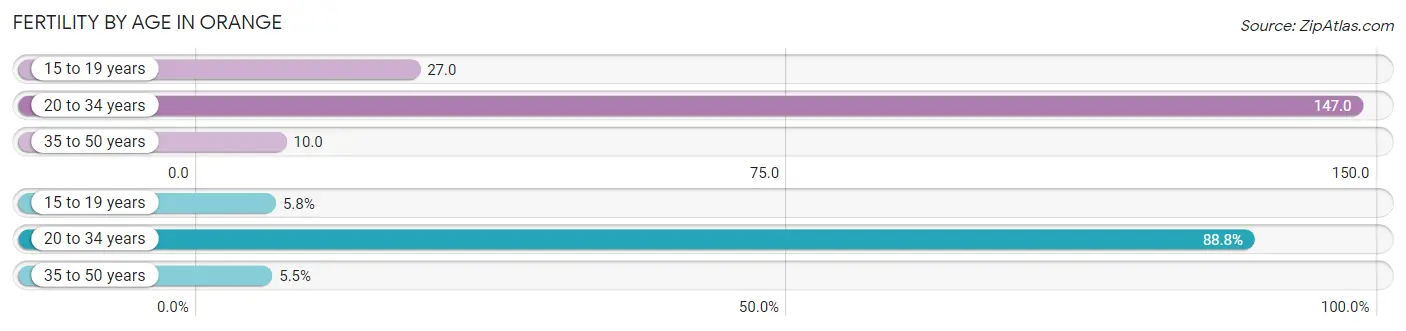
| Age Bracket | Women with Births | Births / 1,000 Women |
| 15 to 19 years | 19 (5.8%) | 27.0 |
| 20 to 34 years | 293 (88.8%) | 147.0 |
| 35 to 50 years | 18 (5.4%) | 10.0 |
| Total | 330 (100.0%) | 73.0 |
Fertility by Age by Marriage Status in Orange
52.1% of women with births (330) in Orange are married. The highest percentage of unmarried women with births falls into 15 to 19 years age bracket with 100.0% of them unmarried at the time of birth, while the lowest percentage of unmarried women with births belong to 20 to 34 years age bracket with 43.0% of them unmarried.
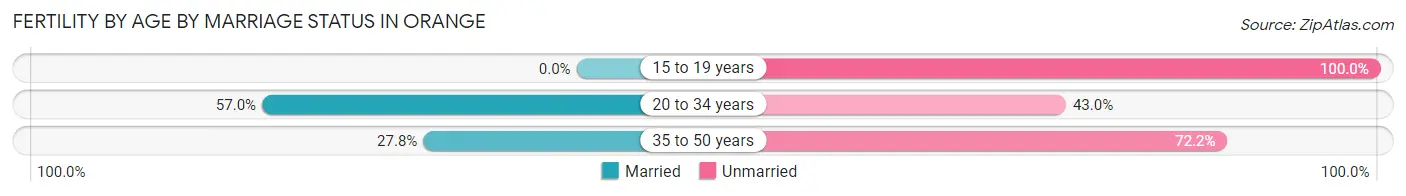
| Age Bracket | Married | Unmarried |
| 15 to 19 years | 0 (0.0%) | 19 (100.0%) |
| 20 to 34 years | 167 (57.0%) | 126 (43.0%) |
| 35 to 50 years | 5 (27.8%) | 13 (72.2%) |
| Total | 172 (52.1%) | 158 (47.9%) |
Fertility by Education in Orange
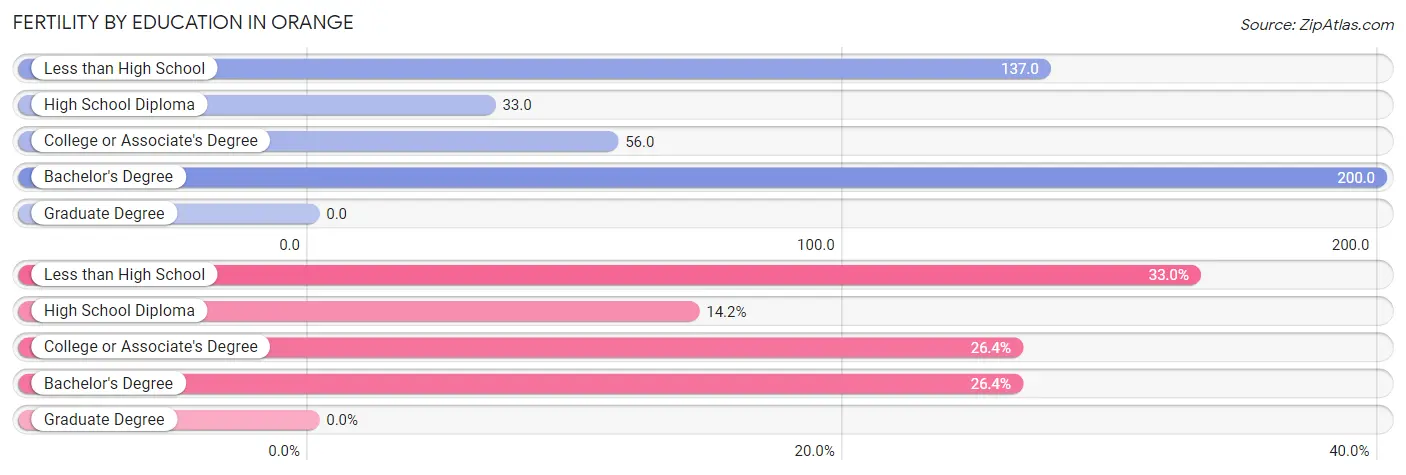
| Educational Attainment | Women with Births | Births / 1,000 Women |
| Less than High School | 109 (33.0%) | 137.0 |
| High School Diploma | 47 (14.2%) | 33.0 |
| College or Associate's Degree | 87 (26.4%) | 56.0 |
| Bachelor's Degree | 87 (26.4%) | 200.0 |
| Graduate Degree | 0 (0.0%) | 0.0 |
| Total | 330 (100.0%) | 73.0 |
Fertility by Education by Marriage Status in Orange
47.9% of women with births in Orange are unmarried. Women with the educational attainment of high school diploma are most likely to be married with 100.0% of them married at childbirth, while women with the educational attainment of college or associate's degree are least likely to be married with 83.9% of them unmarried at childbirth.
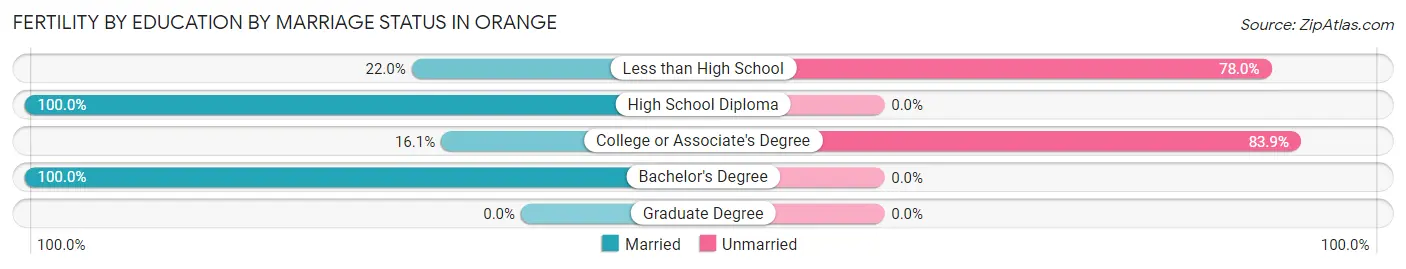
| Educational Attainment | Married | Unmarried |
| Less than High School | 24 (22.0%) | 85 (78.0%) |
| High School Diploma | 47 (100.0%) | 0 (0.0%) |
| College or Associate's Degree | 14 (16.1%) | 73 (83.9%) |
| Bachelor's Degree | 87 (100.0%) | 0 (0.0%) |
| Graduate Degree | 0 (0.0%) | 0 (0.0%) |
| Total | 172 (52.1%) | 158 (47.9%) |
Employment Characteristics in Orange
Employment by Class of Employer in Orange
Among the 7,829 employed individuals in Orange, private company employees (5,866 | 74.9%), self-employed (not incorporated) (603 | 7.7%), and local government employees (540 | 6.9%) make up the most common classes of employment.
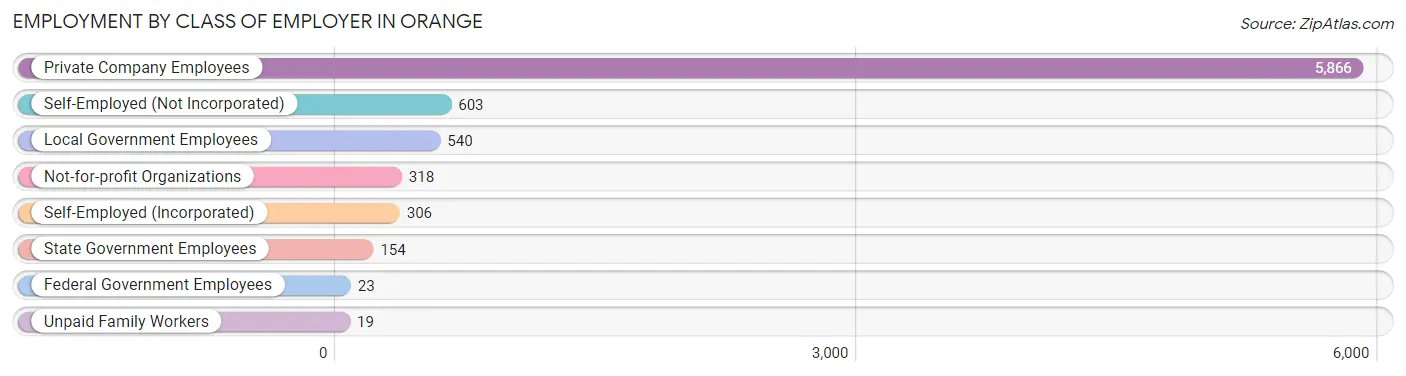
| Employer Class | # Employees | % Employees |
| Private Company Employees | 5,866 | 74.9% |
| Self-Employed (Incorporated) | 306 | 3.9% |
| Self-Employed (Not Incorporated) | 603 | 7.7% |
| Not-for-profit Organizations | 318 | 4.1% |
| Local Government Employees | 540 | 6.9% |
| State Government Employees | 154 | 2.0% |
| Federal Government Employees | 23 | 0.3% |
| Unpaid Family Workers | 19 | 0.2% |
| Total | 7,829 | 100.0% |
Employment Status by Age in Orange
According to the labor force statistics for Orange, out of the total population over 16 years of age (14,615), 59.8% or 8,740 individuals are in the labor force, with 8.7% or 760 of them unemployed. The age group with the highest labor force participation rate is 45 to 54 years, with 82.0% or 1,533 individuals in the labor force. Within the labor force, the 60 to 64 years age range has the highest percentage of unemployed individuals, with 31.5% or 181 of them being unemployed.
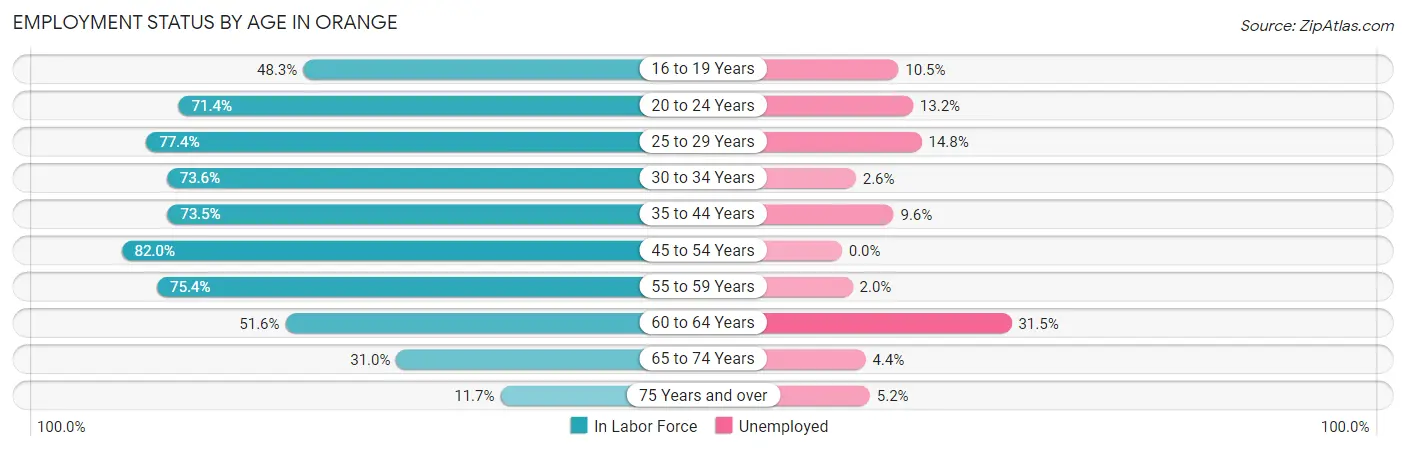
| Age Bracket | In Labor Force | Unemployed |
| 16 to 19 Years | 438 (48.3%) | 46 (10.5%) |
| 20 to 24 Years | 703 (71.4%) | 93 (13.2%) |
| 25 to 29 Years | 1,358 (77.4%) | 201 (14.8%) |
| 30 to 34 Years | 1,019 (73.6%) | 26 (2.6%) |
| 35 to 44 Years | 1,806 (73.5%) | 173 (9.6%) |
| 45 to 54 Years | 1,533 (82.0%) | 0 (0.0%) |
| 55 to 59 Years | 638 (75.4%) | 13 (2.0%) |
| 60 to 64 Years | 575 (51.6%) | 181 (31.5%) |
| 65 to 74 Years | 456 (31.0%) | 20 (4.4%) |
| 75 Years and over | 214 (11.7%) | 11 (5.2%) |
| Total | 8,740 (59.8%) | 760 (8.7%) |
Employment Status by Educational Attainment in Orange
According to labor force statistics for Orange, 73.5% of individuals (6,929) out of the total population between 25 and 64 years of age (9,427) are in the labor force, with 8.6% or 596 of them being unemployed. The group with the highest labor force participation rate are those with the educational attainment of bachelor's degree or higher, with 83.9% or 1,278 individuals in the labor force. Within the labor force, individuals with less than high school education have the highest percentage of unemployment, with 12.6% or 94 of them being unemployed.
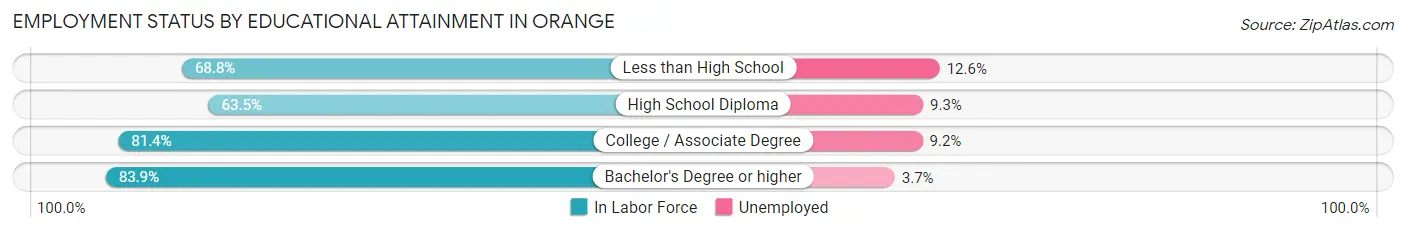
| Educational Attainment | In Labor Force | Unemployed |
| Less than High School | 747 (68.8%) | 137 (12.6%) |
| High School Diploma | 2,293 (63.5%) | 336 (9.3%) |
| College / Associate Degree | 2,610 (81.4%) | 295 (9.2%) |
| Bachelor's Degree or higher | 1,278 (83.9%) | 56 (3.7%) |
| Total | 6,929 (73.5%) | 811 (8.6%) |
Employment Occupations by Sex in Orange
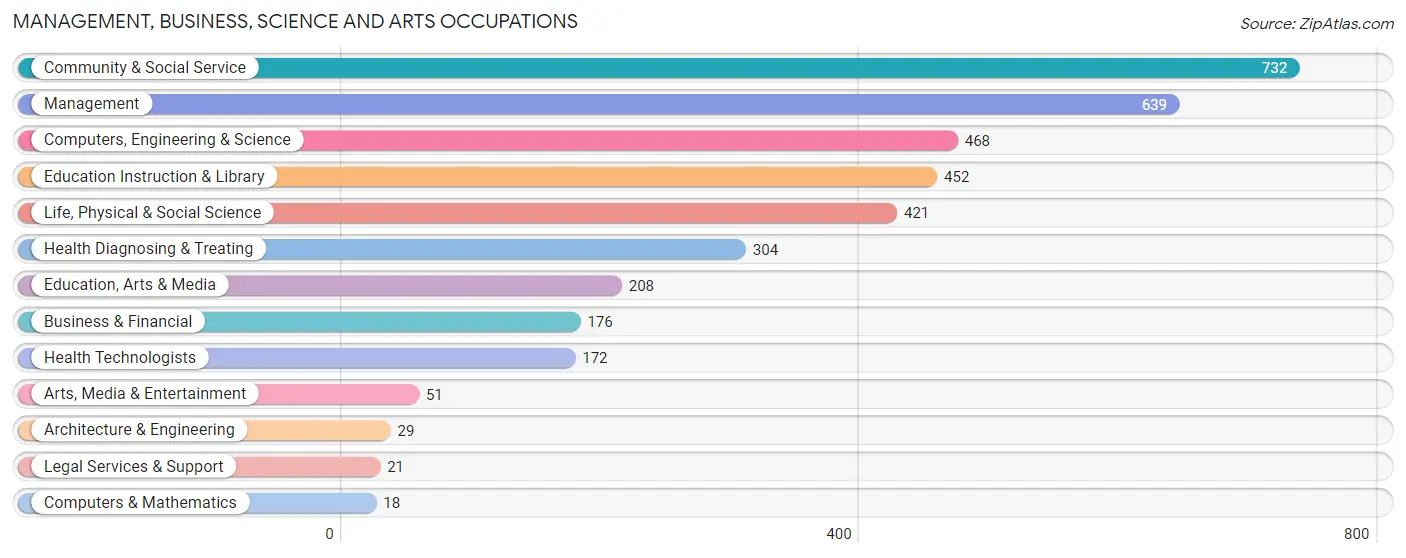
Management, Business, Science and Arts Occupations
The most common Management, Business, Science and Arts occupations in Orange are Community & Social Service (732 | 9.2%), Management (639 | 8.0%), Computers, Engineering & Science (468 | 5.9%), Education Instruction & Library (452 | 5.7%), and Life, Physical & Social Science (421 | 5.3%).
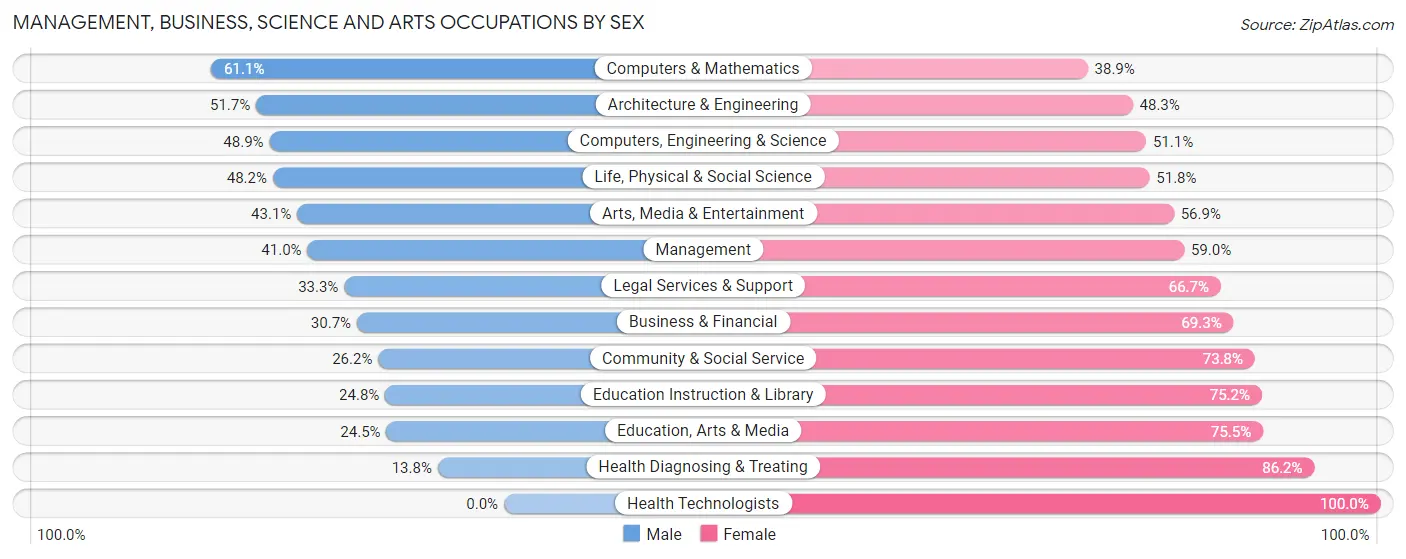
Management, Business, Science and Arts Occupations by Sex
Within the Management, Business, Science and Arts occupations in Orange, the most male-oriented occupations are Computers & Mathematics (61.1%), Architecture & Engineering (51.7%), and Computers, Engineering & Science (48.9%), while the most female-oriented occupations are Health Technologists (100.0%), Health Diagnosing & Treating (86.2%), and Education, Arts & Media (75.5%).
| Occupation | Male | Female |
| Management | 262 (41.0%) | 377 (59.0%) |
| Business & Financial | 54 (30.7%) | 122 (69.3%) |
| Computers, Engineering & Science | 229 (48.9%) | 239 (51.1%) |
| Computers & Mathematics | 11 (61.1%) | 7 (38.9%) |
| Architecture & Engineering | 15 (51.7%) | 14 (48.3%) |
| Life, Physical & Social Science | 203 (48.2%) | 218 (51.8%) |
| Community & Social Service | 192 (26.2%) | 540 (73.8%) |
| Education, Arts & Media | 51 (24.5%) | 157 (75.5%) |
| Legal Services & Support | 7 (33.3%) | 14 (66.7%) |
| Education Instruction & Library | 112 (24.8%) | 340 (75.2%) |
| Arts, Media & Entertainment | 22 (43.1%) | 29 (56.9%) |
| Health Diagnosing & Treating | 42 (13.8%) | 262 (86.2%) |
| Health Technologists | 0 (0.0%) | 172 (100.0%) |
| Total (Category) | 779 (33.6%) | 1,540 (66.4%) |
| Total (Overall) | 4,062 (51.0%) | 3,896 (49.0%) |
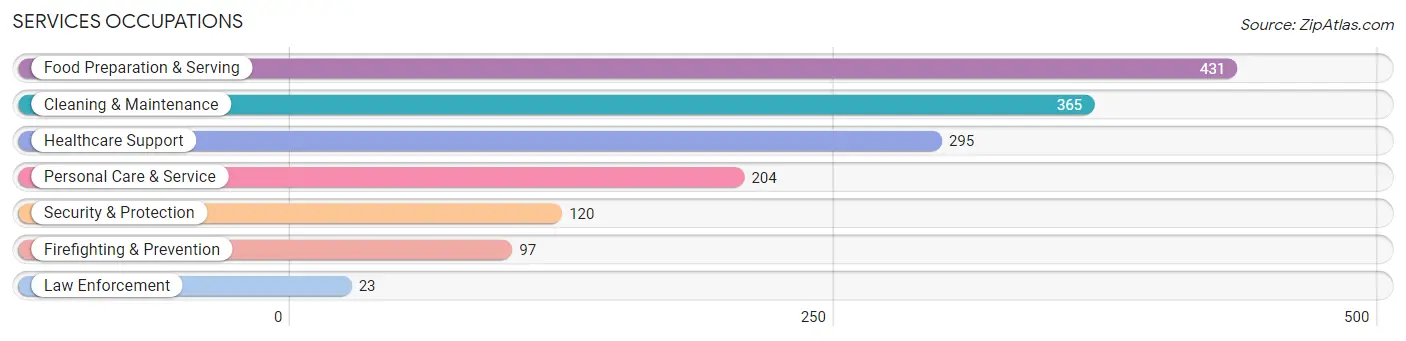
Services Occupations
The most common Services occupations in Orange are Food Preparation & Serving (431 | 5.4%), Cleaning & Maintenance (365 | 4.6%), Healthcare Support (295 | 3.7%), Personal Care & Service (204 | 2.6%), and Security & Protection (120 | 1.5%).
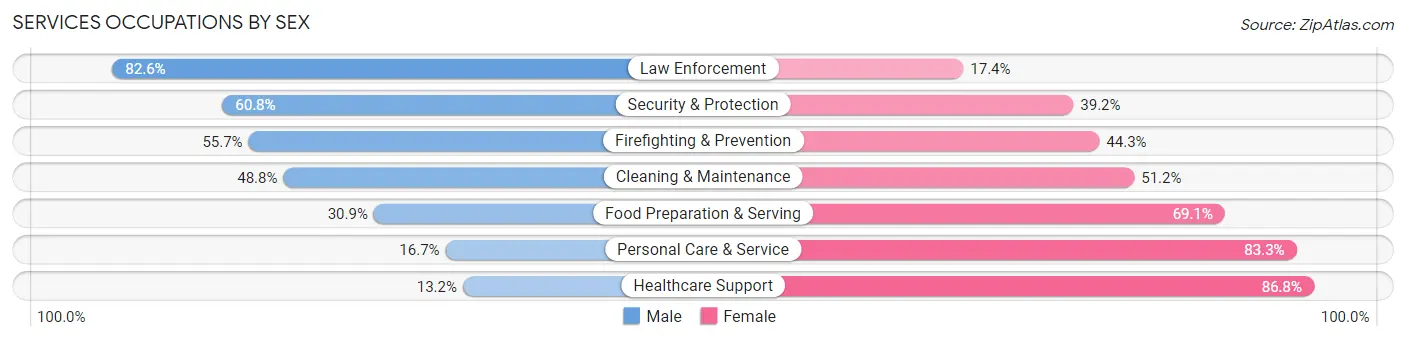
Services Occupations by Sex
Within the Services occupations in Orange, the most male-oriented occupations are Law Enforcement (82.6%), Security & Protection (60.8%), and Firefighting & Prevention (55.7%), while the most female-oriented occupations are Healthcare Support (86.8%), Personal Care & Service (83.3%), and Food Preparation & Serving (69.1%).
| Occupation | Male | Female |
| Healthcare Support | 39 (13.2%) | 256 (86.8%) |
| Security & Protection | 73 (60.8%) | 47 (39.2%) |
| Firefighting & Prevention | 54 (55.7%) | 43 (44.3%) |
| Law Enforcement | 19 (82.6%) | 4 (17.4%) |
| Food Preparation & Serving | 133 (30.9%) | 298 (69.1%) |
| Cleaning & Maintenance | 178 (48.8%) | 187 (51.2%) |
| Personal Care & Service | 34 (16.7%) | 170 (83.3%) |
| Total (Category) | 457 (32.3%) | 958 (67.7%) |
| Total (Overall) | 4,062 (51.0%) | 3,896 (49.0%) |
Sales and Office Occupations
The most common Sales and Office occupations in Orange are Sales & Related (768 | 9.7%), and Office & Administration (751 | 9.4%).
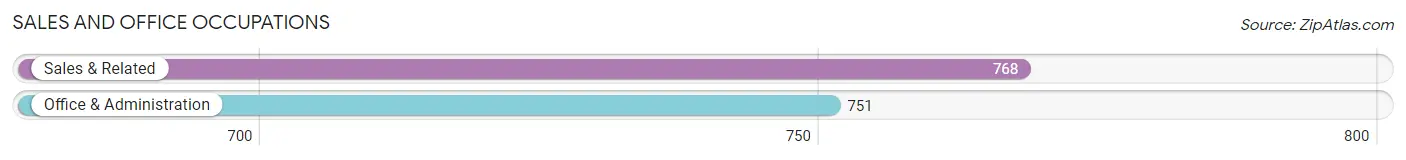
Sales and Office Occupations by Sex
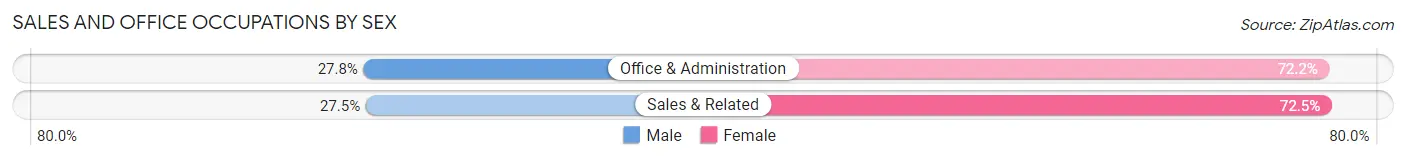
| Occupation | Male | Female |
| Sales & Related | 211 (27.5%) | 557 (72.5%) |
| Office & Administration | 209 (27.8%) | 542 (72.2%) |
| Total (Category) | 420 (27.7%) | 1,099 (72.4%) |
| Total (Overall) | 4,062 (51.0%) | 3,896 (49.0%) |
Natural Resources, Construction and Maintenance Occupations
The most common Natural Resources, Construction and Maintenance occupations in Orange are Construction & Extraction (818 | 10.3%), and Installation, Maintenance & Repair (456 | 5.7%).
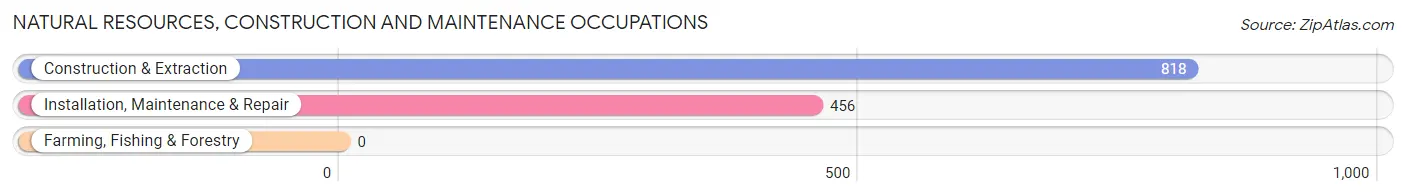
Natural Resources, Construction and Maintenance Occupations by Sex
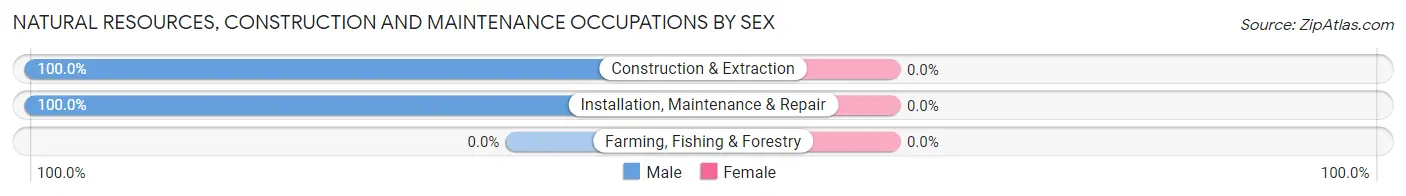
| Occupation | Male | Female |
| Farming, Fishing & Forestry | 0 (0.0%) | 0 (0.0%) |
| Construction & Extraction | 818 (100.0%) | 0 (0.0%) |
| Installation, Maintenance & Repair | 456 (100.0%) | 0 (0.0%) |
| Total (Category) | 1,274 (100.0%) | 0 (0.0%) |
| Total (Overall) | 4,062 (51.0%) | 3,896 (49.0%) |
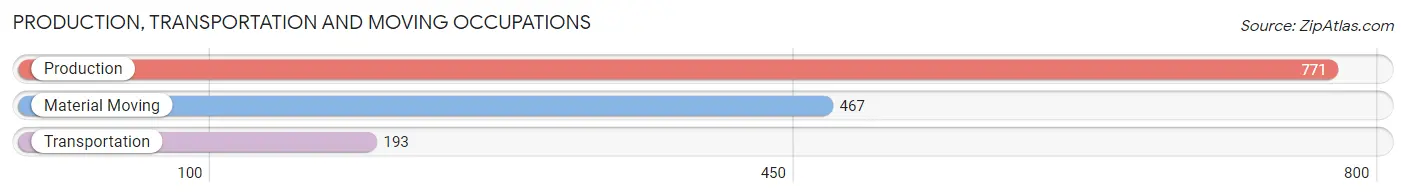
Production, Transportation and Moving Occupations
The most common Production, Transportation and Moving occupations in Orange are Production (771 | 9.7%), Material Moving (467 | 5.9%), and Transportation (193 | 2.4%).
Production, Transportation and Moving Occupations by Sex
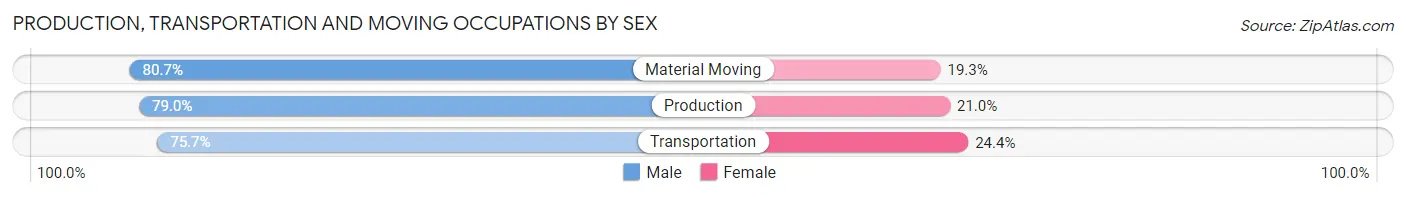
| Occupation | Male | Female |
| Production | 609 (79.0%) | 162 (21.0%) |
| Transportation | 146 (75.6%) | 47 (24.3%) |
| Material Moving | 377 (80.7%) | 90 (19.3%) |
| Total (Category) | 1,132 (79.1%) | 299 (20.9%) |
| Total (Overall) | 4,062 (51.0%) | 3,896 (49.0%) |
Employment Industries by Sex in Orange
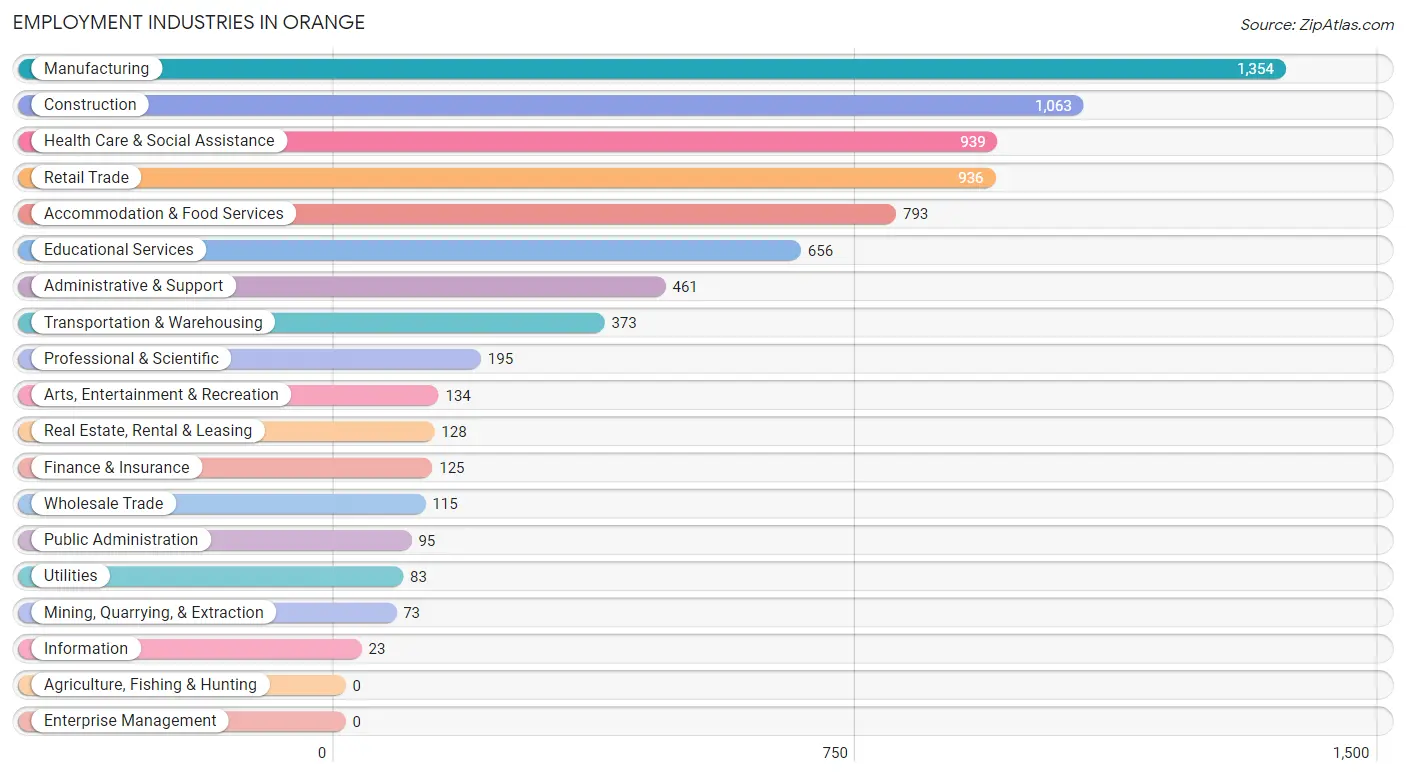
Employment Industries in Orange
The major employment industries in Orange include Manufacturing (1,354 | 17.0%), Construction (1,063 | 13.4%), Health Care & Social Assistance (939 | 11.8%), Retail Trade (936 | 11.8%), and Accommodation & Food Services (793 | 10.0%).
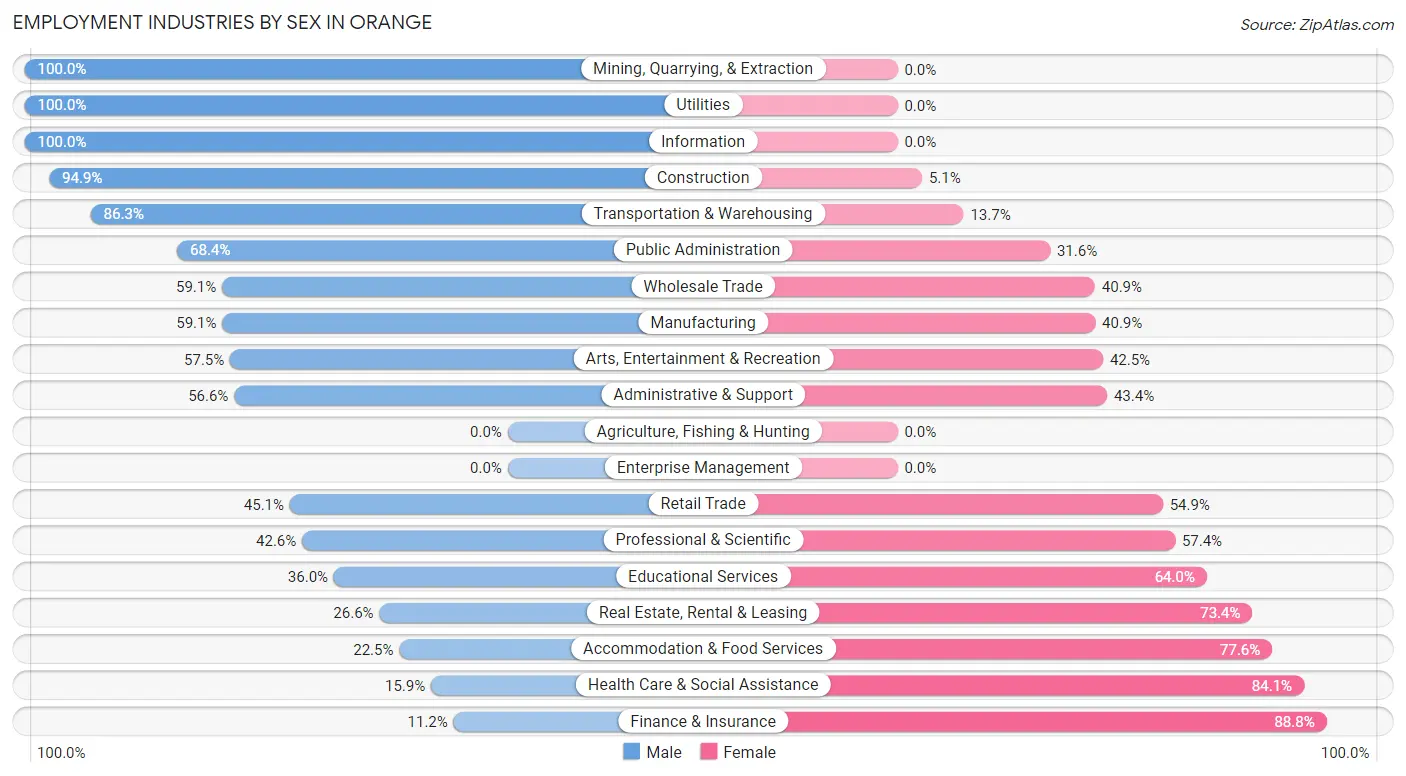
Employment Industries by Sex in Orange
The Orange industries that see more men than women are Mining, Quarrying, & Extraction (100.0%), Utilities (100.0%), and Information (100.0%), whereas the industries that tend to have a higher number of women are Finance & Insurance (88.8%), Health Care & Social Assistance (84.1%), and Accommodation & Food Services (77.5%).
| Industry | Male | Female |
| Agriculture, Fishing & Hunting | 0 (0.0%) | 0 (0.0%) |
| Mining, Quarrying, & Extraction | 73 (100.0%) | 0 (0.0%) |
| Construction | 1,009 (94.9%) | 54 (5.1%) |
| Manufacturing | 800 (59.1%) | 554 (40.9%) |
| Wholesale Trade | 68 (59.1%) | 47 (40.9%) |
| Retail Trade | 422 (45.1%) | 514 (54.9%) |
| Transportation & Warehousing | 322 (86.3%) | 51 (13.7%) |
| Utilities | 83 (100.0%) | 0 (0.0%) |
| Information | 23 (100.0%) | 0 (0.0%) |
| Finance & Insurance | 14 (11.2%) | 111 (88.8%) |
| Real Estate, Rental & Leasing | 34 (26.6%) | 94 (73.4%) |
| Professional & Scientific | 83 (42.6%) | 112 (57.4%) |
| Enterprise Management | 0 (0.0%) | 0 (0.0%) |
| Administrative & Support | 261 (56.6%) | 200 (43.4%) |
| Educational Services | 236 (36.0%) | 420 (64.0%) |
| Health Care & Social Assistance | 149 (15.9%) | 790 (84.1%) |
| Arts, Entertainment & Recreation | 77 (57.5%) | 57 (42.5%) |
| Accommodation & Food Services | 178 (22.5%) | 615 (77.5%) |
| Public Administration | 65 (68.4%) | 30 (31.6%) |
| Total | 4,062 (51.0%) | 3,896 (49.0%) |
Education in Orange
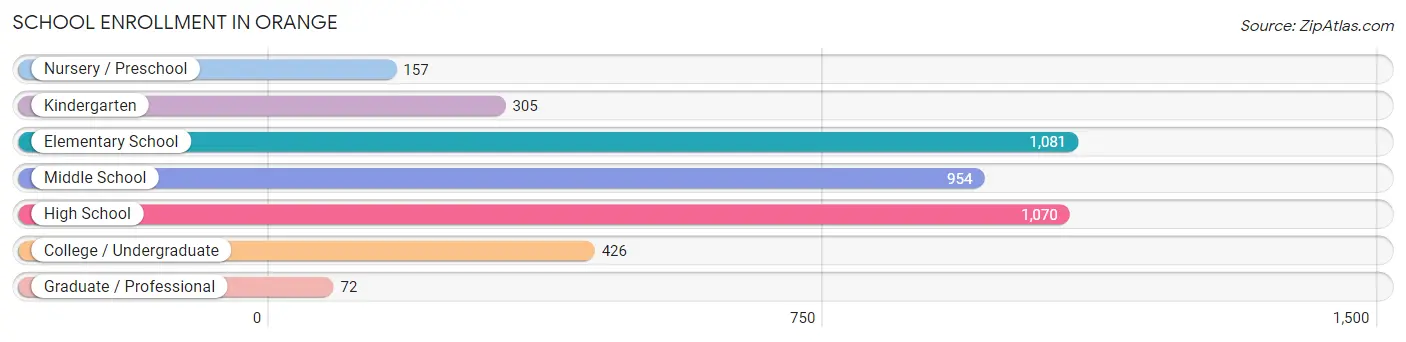
School Enrollment in Orange
The most common levels of schooling among the 4,065 students in Orange are elementary school (1,081 | 26.6%), high school (1,070 | 26.3%), and middle school (954 | 23.5%).
| School Level | # Students | % Students |
| Nursery / Preschool | 157 | 3.9% |
| Kindergarten | 305 | 7.5% |
| Elementary School | 1,081 | 26.6% |
| Middle School | 954 | 23.5% |
| High School | 1,070 | 26.3% |
| College / Undergraduate | 426 | 10.5% |
| Graduate / Professional | 72 | 1.8% |
| Total | 4,065 | 100.0% |
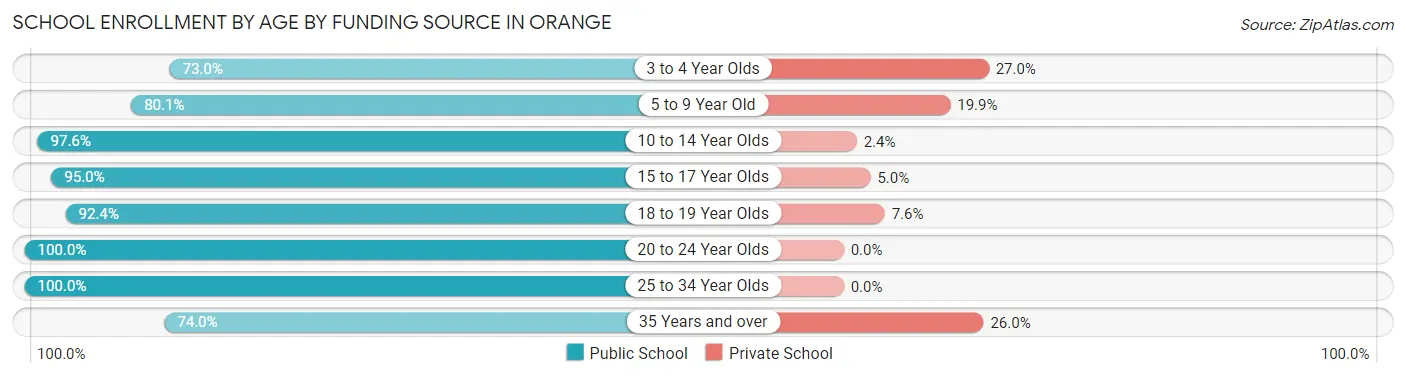
School Enrollment by Age by Funding Source in Orange
Out of a total of 4,065 students who are enrolled in schools in Orange, 427 (10.5%) attend a private institution, while the remaining 3,638 (89.5%) are enrolled in public schools. The age group of 3 to 4 year olds has the highest likelihood of being enrolled in private schools, with 47 (27.0% in the age bracket) enrolled. Conversely, the age group of 20 to 24 year olds has the lowest likelihood of being enrolled in a private school, with 131 (100.0% in the age bracket) attending a public institution.
| Age Bracket | Public School | Private School |
| 3 to 4 Year Olds | 127 (73.0%) | 47 (27.0%) |
| 5 to 9 Year Old | 1,001 (80.1%) | 248 (19.9%) |
| 10 to 14 Year Olds | 1,245 (97.6%) | 31 (2.4%) |
| 15 to 17 Year Olds | 743 (95.0%) | 39 (5.0%) |
| 18 to 19 Year Olds | 145 (92.4%) | 12 (7.6%) |
| 20 to 24 Year Olds | 131 (100.0%) | 0 (0.0%) |
| 25 to 34 Year Olds | 104 (100.0%) | 0 (0.0%) |
| 35 Years and over | 142 (74.0%) | 50 (26.0%) |
| Total | 3,638 (89.5%) | 427 (10.5%) |
Educational Attainment by Field of Study in Orange
Education (350 | 16.5%), business (328 | 15.5%), science & technology (278 | 13.1%), psychology (258 | 12.2%), and arts & humanities (178 | 8.4%) are the most common fields of study among 2,118 individuals in Orange who have obtained a bachelor's degree or higher.
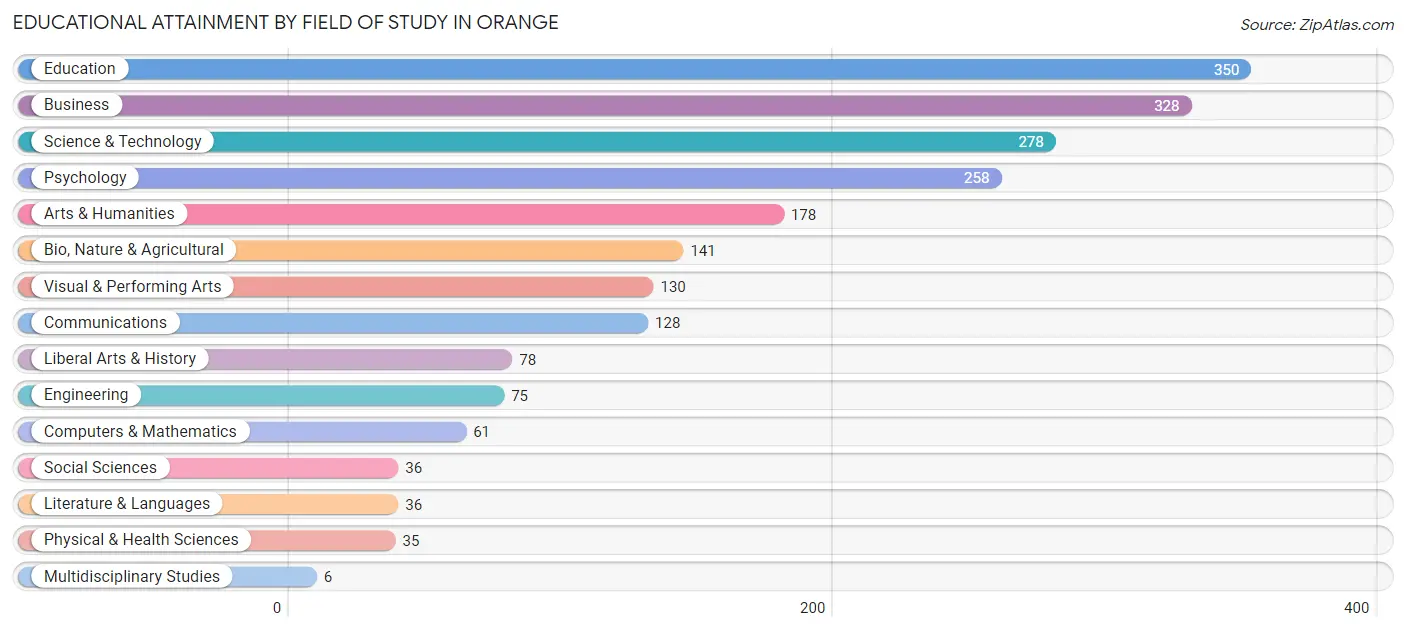
| Field of Study | # Graduates | % Graduates |
| Computers & Mathematics | 61 | 2.9% |
| Bio, Nature & Agricultural | 141 | 6.7% |
| Physical & Health Sciences | 35 | 1.7% |
| Psychology | 258 | 12.2% |
| Social Sciences | 36 | 1.7% |
| Engineering | 75 | 3.5% |
| Multidisciplinary Studies | 6 | 0.3% |
| Science & Technology | 278 | 13.1% |
| Business | 328 | 15.5% |
| Education | 350 | 16.5% |
| Literature & Languages | 36 | 1.7% |
| Liberal Arts & History | 78 | 3.7% |
| Visual & Performing Arts | 130 | 6.1% |
| Communications | 128 | 6.0% |
| Arts & Humanities | 178 | 8.4% |
| Total | 2,118 | 100.0% |
Transportation & Commute in Orange
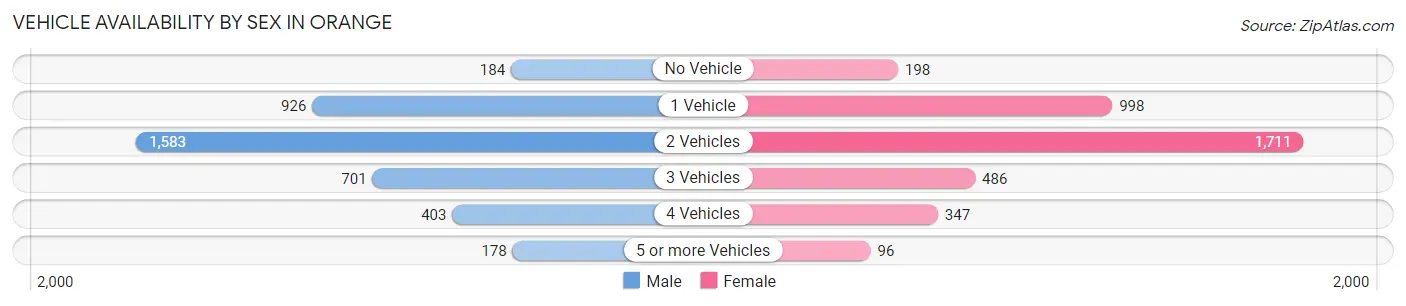
Vehicle Availability by Sex in Orange
The most prevalent vehicle ownership categories in Orange are males with 2 vehicles (1,583, accounting for 39.8%) and females with 2 vehicles (1,711, making up 41.3%).
| Vehicles Available | Male | Female |
| No Vehicle | 184 (4.6%) | 198 (5.2%) |
| 1 Vehicle | 926 (23.3%) | 998 (26.0%) |
| 2 Vehicles | 1,583 (39.8%) | 1,711 (44.6%) |
| 3 Vehicles | 701 (17.6%) | 486 (12.7%) |
| 4 Vehicles | 403 (10.1%) | 347 (9.0%) |
| 5 or more Vehicles | 178 (4.5%) | 96 (2.5%) |
| Total | 3,975 (100.0%) | 3,836 (100.0%) |
Commute Time in Orange
The most frequently occuring commute durations in Orange are 5 to 9 minutes (1,212 commuters, 15.8%), 10 to 14 minutes (1,185 commuters, 15.5%), and 30 to 34 minutes (1,077 commuters, 14.1%).
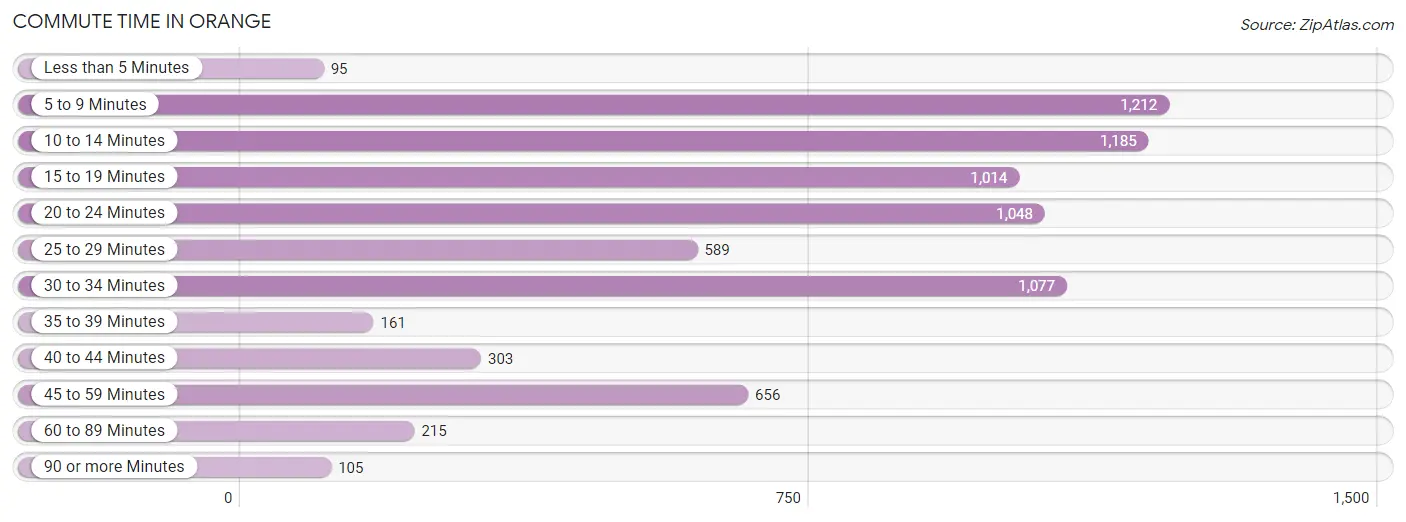
| Commute Time | # Commuters | % Commuters |
| Less than 5 Minutes | 95 | 1.2% |
| 5 to 9 Minutes | 1,212 | 15.8% |
| 10 to 14 Minutes | 1,185 | 15.5% |
| 15 to 19 Minutes | 1,014 | 13.2% |
| 20 to 24 Minutes | 1,048 | 13.7% |
| 25 to 29 Minutes | 589 | 7.7% |
| 30 to 34 Minutes | 1,077 | 14.1% |
| 35 to 39 Minutes | 161 | 2.1% |
| 40 to 44 Minutes | 303 | 4.0% |
| 45 to 59 Minutes | 656 | 8.6% |
| 60 to 89 Minutes | 215 | 2.8% |
| 90 or more Minutes | 105 | 1.4% |
Commute Time by Sex in Orange
The most common commute times in Orange are 20 to 24 minutes (721 commuters, 18.6%) for males and 5 to 9 minutes (764 commuters, 20.2%) for females.
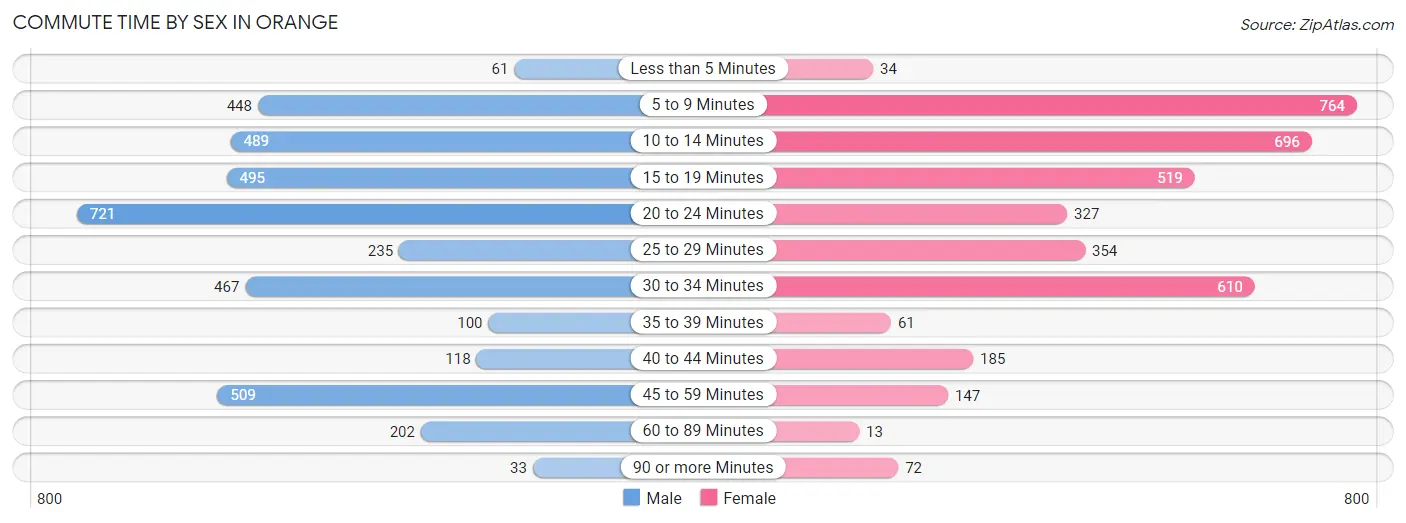
| Commute Time | Male | Female |
| Less than 5 Minutes | 61 (1.6%) | 34 (0.9%) |
| 5 to 9 Minutes | 448 (11.6%) | 764 (20.2%) |
| 10 to 14 Minutes | 489 (12.6%) | 696 (18.4%) |
| 15 to 19 Minutes | 495 (12.8%) | 519 (13.7%) |
| 20 to 24 Minutes | 721 (18.6%) | 327 (8.6%) |
| 25 to 29 Minutes | 235 (6.1%) | 354 (9.4%) |
| 30 to 34 Minutes | 467 (12.0%) | 610 (16.1%) |
| 35 to 39 Minutes | 100 (2.6%) | 61 (1.6%) |
| 40 to 44 Minutes | 118 (3.0%) | 185 (4.9%) |
| 45 to 59 Minutes | 509 (13.1%) | 147 (3.9%) |
| 60 to 89 Minutes | 202 (5.2%) | 13 (0.3%) |
| 90 or more Minutes | 33 (0.9%) | 72 (1.9%) |
Time of Departure to Work by Sex in Orange
The most frequent times of departure to work in Orange are 7:00 AM to 7:29 AM (612, 15.8%) for males and 7:30 AM to 7:59 AM (750, 19.8%) for females.
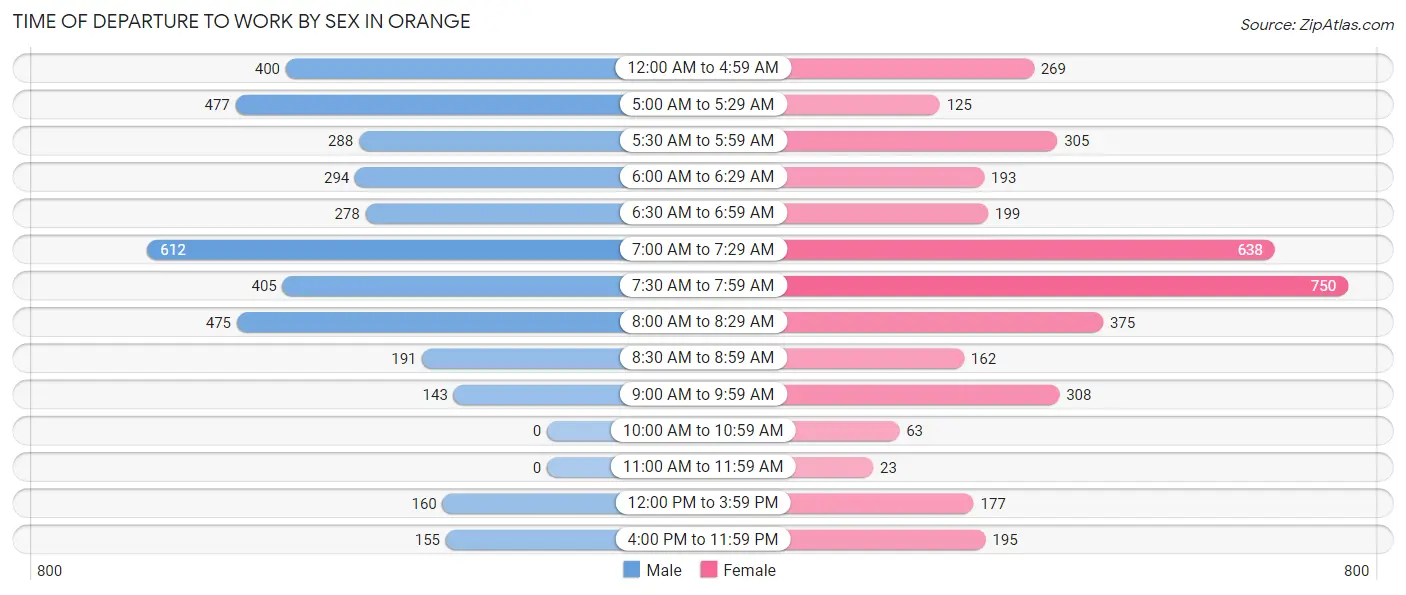
| Time of Departure | Male | Female |
| 12:00 AM to 4:59 AM | 400 (10.3%) | 269 (7.1%) |
| 5:00 AM to 5:29 AM | 477 (12.3%) | 125 (3.3%) |
| 5:30 AM to 5:59 AM | 288 (7.4%) | 305 (8.1%) |
| 6:00 AM to 6:29 AM | 294 (7.6%) | 193 (5.1%) |
| 6:30 AM to 6:59 AM | 278 (7.2%) | 199 (5.3%) |
| 7:00 AM to 7:29 AM | 612 (15.8%) | 638 (16.9%) |
| 7:30 AM to 7:59 AM | 405 (10.4%) | 750 (19.8%) |
| 8:00 AM to 8:29 AM | 475 (12.2%) | 375 (9.9%) |
| 8:30 AM to 8:59 AM | 191 (4.9%) | 162 (4.3%) |
| 9:00 AM to 9:59 AM | 143 (3.7%) | 308 (8.1%) |
| 10:00 AM to 10:59 AM | 0 (0.0%) | 63 (1.7%) |
| 11:00 AM to 11:59 AM | 0 (0.0%) | 23 (0.6%) |
| 12:00 PM to 3:59 PM | 160 (4.1%) | 177 (4.7%) |
| 4:00 PM to 11:59 PM | 155 (4.0%) | 195 (5.2%) |
| Total | 3,878 (100.0%) | 3,782 (100.0%) |
Housing Occupancy in Orange
Occupancy by Ownership in Orange
Of the total 6,901 dwellings in Orange, owner-occupied units account for 3,908 (56.6%), while renter-occupied units make up 2,993 (43.4%).
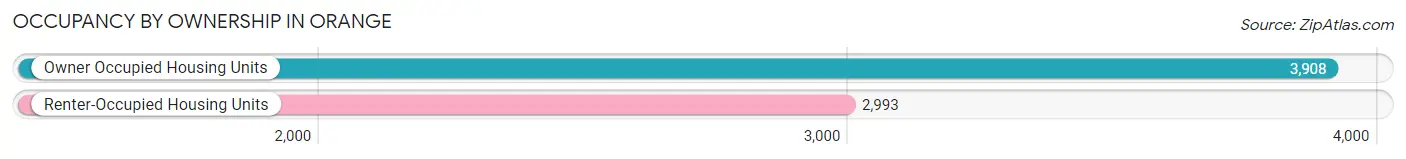
| Occupancy | # Housing Units | % Housing Units |
| Owner Occupied Housing Units | 3,908 | 56.6% |
| Renter-Occupied Housing Units | 2,993 | 43.4% |
| Total Occupied Housing Units | 6,901 | 100.0% |
Occupancy by Household Size in Orange
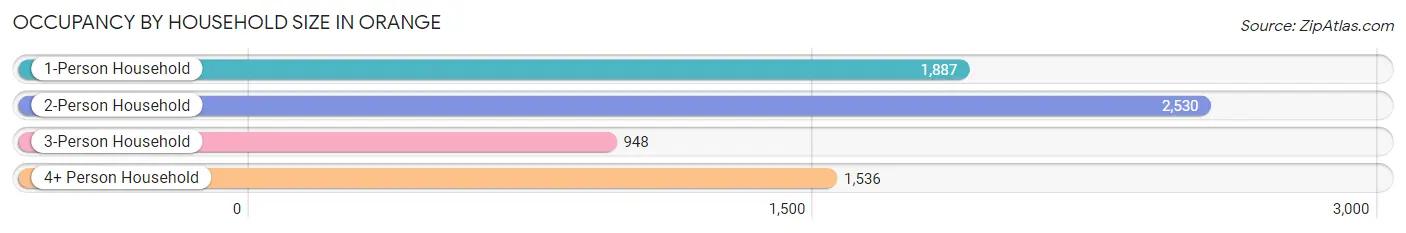
| Household Size | # Housing Units | % Housing Units |
| 1-Person Household | 1,887 | 27.3% |
| 2-Person Household | 2,530 | 36.7% |
| 3-Person Household | 948 | 13.7% |
| 4+ Person Household | 1,536 | 22.3% |
| Total Housing Units | 6,901 | 100.0% |
Occupancy by Ownership by Household Size in Orange
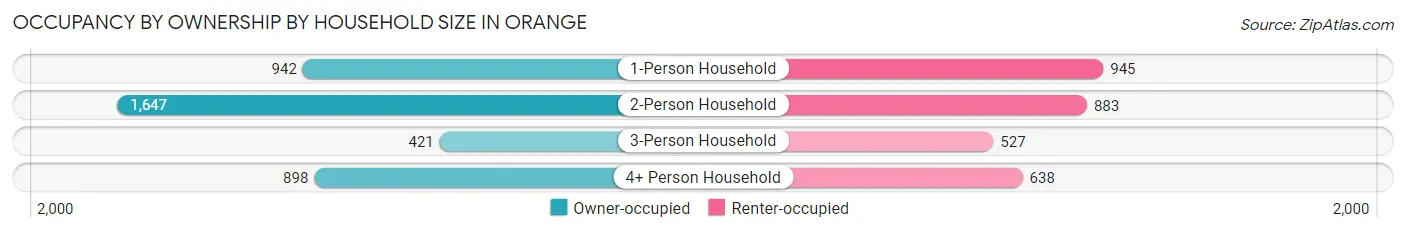
| Household Size | Owner-occupied | Renter-occupied |
| 1-Person Household | 942 (49.9%) | 945 (50.1%) |
| 2-Person Household | 1,647 (65.1%) | 883 (34.9%) |
| 3-Person Household | 421 (44.4%) | 527 (55.6%) |
| 4+ Person Household | 898 (58.5%) | 638 (41.5%) |
| Total Housing Units | 3,908 (56.6%) | 2,993 (43.4%) |
Occupancy by Educational Attainment in Orange
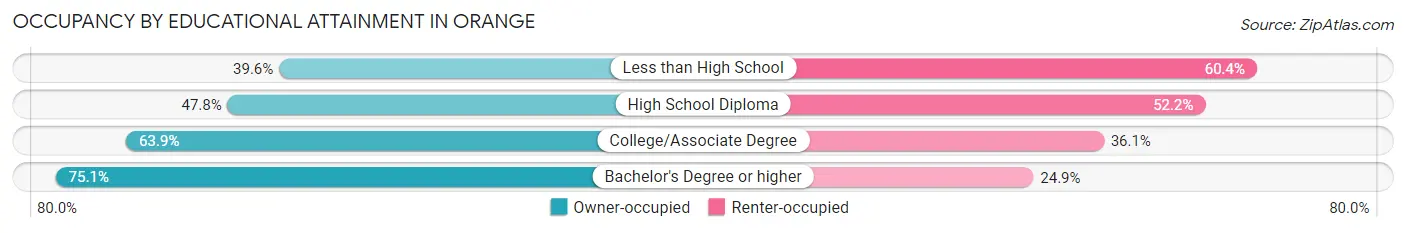
| Household Size | Owner-occupied | Renter-occupied |
| Less than High School | 346 (39.6%) | 527 (60.4%) |
| High School Diploma | 1,200 (47.8%) | 1,310 (52.2%) |
| College/Associate Degree | 1,597 (63.9%) | 902 (36.1%) |
| Bachelor's Degree or higher | 765 (75.1%) | 254 (24.9%) |
Occupancy by Age of Householder in Orange
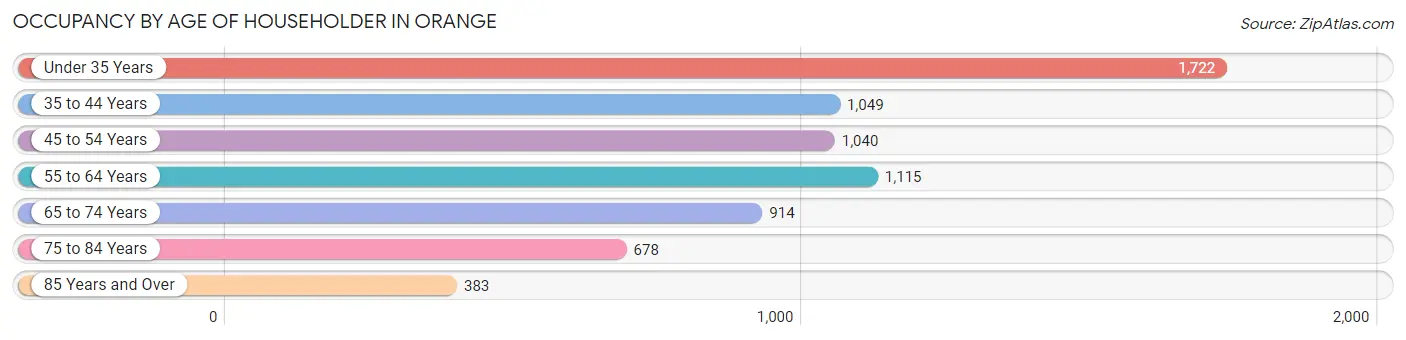
| Age Bracket | # Households | % Households |
| Under 35 Years | 1,722 | 24.9% |
| 35 to 44 Years | 1,049 | 15.2% |
| 45 to 54 Years | 1,040 | 15.1% |
| 55 to 64 Years | 1,115 | 16.2% |
| 65 to 74 Years | 914 | 13.2% |
| 75 to 84 Years | 678 | 9.8% |
| 85 Years and Over | 383 | 5.6% |
| Total | 6,901 | 100.0% |
Housing Finances in Orange
Median Income by Occupancy in Orange
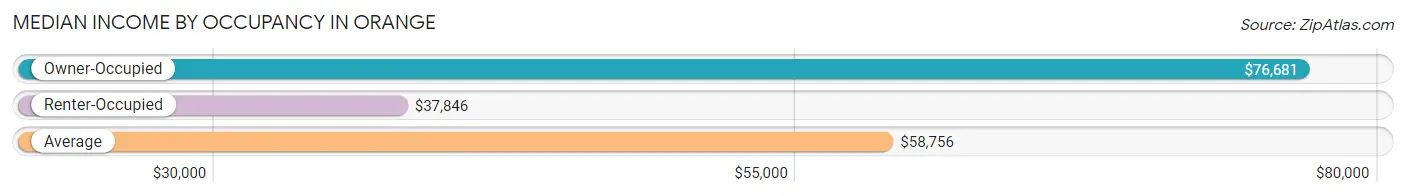
| Occupancy Type | # Households | Median Income |
| Owner-Occupied | 3,908 (56.6%) | $76,681 |
| Renter-Occupied | 2,993 (43.4%) | $37,846 |
| Average | 6,901 (100.0%) | $58,756 |
Occupancy by Householder Income Bracket in Orange
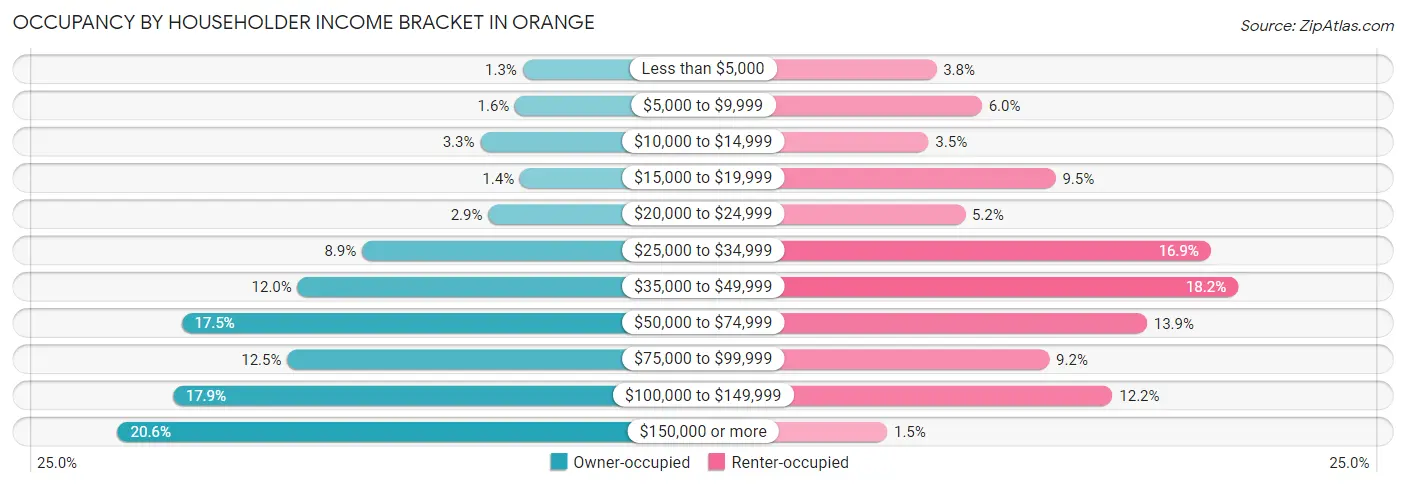
| Income Bracket | Owner-occupied | Renter-occupied |
| Less than $5,000 | 50 (1.3%) | 115 (3.8%) |
| $5,000 to $9,999 | 64 (1.6%) | 180 (6.0%) |
| $10,000 to $14,999 | 129 (3.3%) | 104 (3.5%) |
| $15,000 to $19,999 | 55 (1.4%) | 285 (9.5%) |
| $20,000 to $24,999 | 114 (2.9%) | 156 (5.2%) |
| $25,000 to $34,999 | 349 (8.9%) | 506 (16.9%) |
| $35,000 to $49,999 | 469 (12.0%) | 545 (18.2%) |
| $50,000 to $74,999 | 685 (17.5%) | 415 (13.9%) |
| $75,000 to $99,999 | 488 (12.5%) | 276 (9.2%) |
| $100,000 to $149,999 | 701 (17.9%) | 366 (12.2%) |
| $150,000 or more | 804 (20.6%) | 45 (1.5%) |
| Total | 3,908 (100.0%) | 2,993 (100.0%) |
Monthly Housing Cost Tiers in Orange
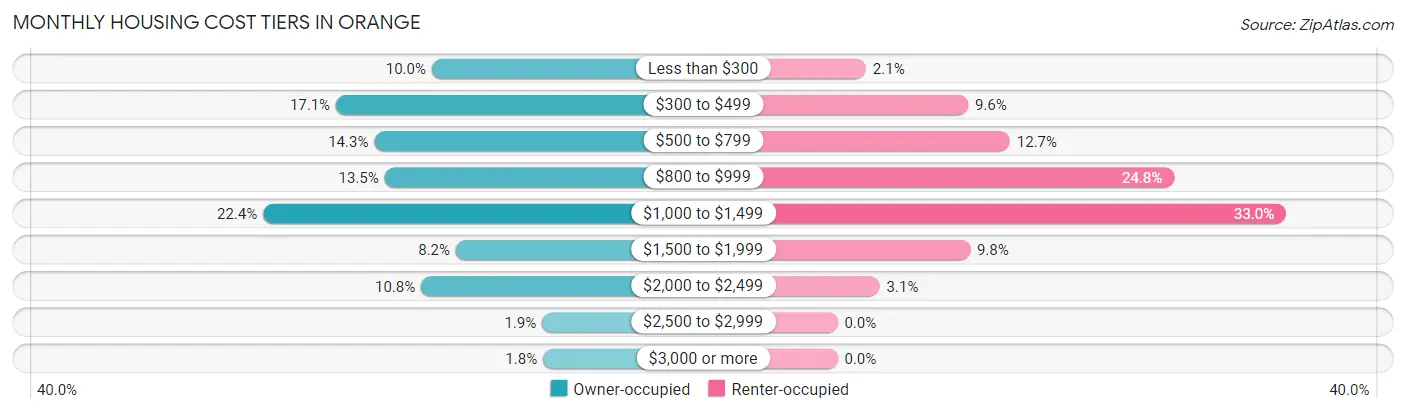
| Monthly Cost | Owner-occupied | Renter-occupied |
| Less than $300 | 391 (10.0%) | 63 (2.1%) |
| $300 to $499 | 667 (17.1%) | 288 (9.6%) |
| $500 to $799 | 557 (14.2%) | 380 (12.7%) |
| $800 to $999 | 527 (13.5%) | 742 (24.8%) |
| $1,000 to $1,499 | 877 (22.4%) | 989 (33.0%) |
| $1,500 to $1,999 | 322 (8.2%) | 292 (9.8%) |
| $2,000 to $2,499 | 422 (10.8%) | 93 (3.1%) |
| $2,500 to $2,999 | 74 (1.9%) | 0 (0.0%) |
| $3,000 or more | 71 (1.8%) | 0 (0.0%) |
| Total | 3,908 (100.0%) | 2,993 (100.0%) |
Physical Housing Characteristics in Orange
Housing Structures in Orange
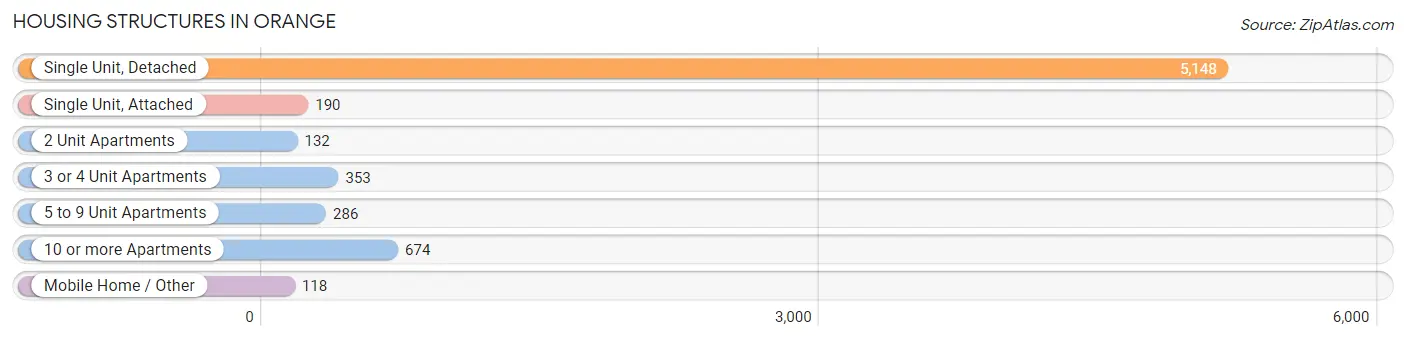
| Structure Type | # Housing Units | % Housing Units |
| Single Unit, Detached | 5,148 | 74.6% |
| Single Unit, Attached | 190 | 2.8% |
| 2 Unit Apartments | 132 | 1.9% |
| 3 or 4 Unit Apartments | 353 | 5.1% |
| 5 to 9 Unit Apartments | 286 | 4.1% |
| 10 or more Apartments | 674 | 9.8% |
| Mobile Home / Other | 118 | 1.7% |
| Total | 6,901 | 100.0% |
Housing Structures by Occupancy in Orange
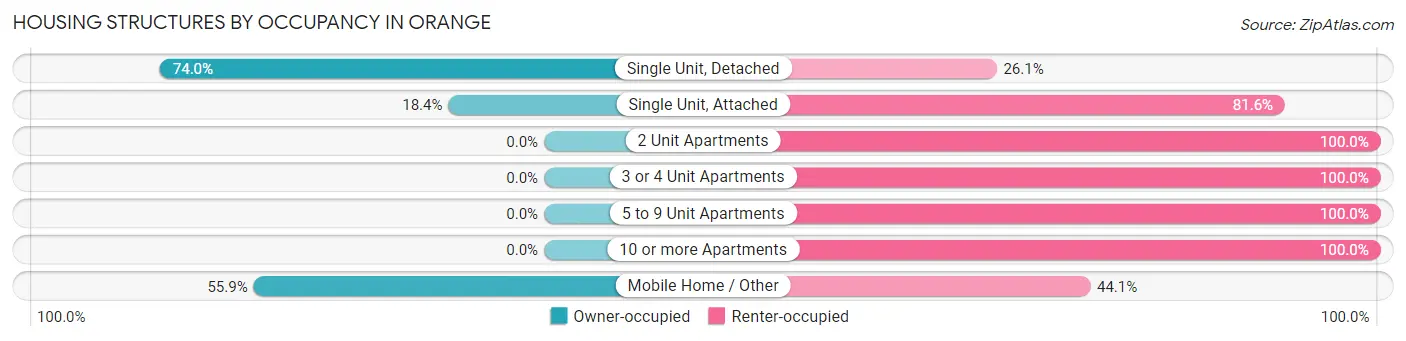
| Structure Type | Owner-occupied | Renter-occupied |
| Single Unit, Detached | 3,807 (74.0%) | 1,341 (26.1%) |
| Single Unit, Attached | 35 (18.4%) | 155 (81.6%) |
| 2 Unit Apartments | 0 (0.0%) | 132 (100.0%) |
| 3 or 4 Unit Apartments | 0 (0.0%) | 353 (100.0%) |
| 5 to 9 Unit Apartments | 0 (0.0%) | 286 (100.0%) |
| 10 or more Apartments | 0 (0.0%) | 674 (100.0%) |
| Mobile Home / Other | 66 (55.9%) | 52 (44.1%) |
| Total | 3,908 (56.6%) | 2,993 (43.4%) |
Housing Structures by Number of Rooms in Orange
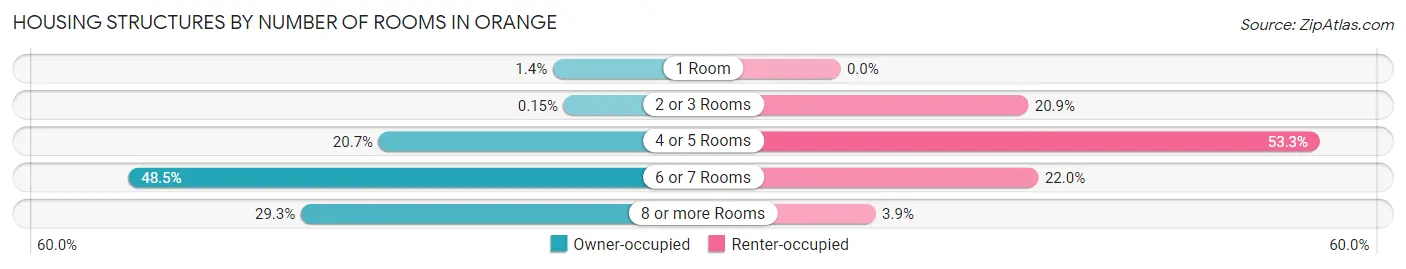
| Number of Rooms | Owner-occupied | Renter-occupied |
| 1 Room | 53 (1.4%) | 0 (0.0%) |
| 2 or 3 Rooms | 6 (0.2%) | 624 (20.8%) |
| 4 or 5 Rooms | 808 (20.7%) | 1,594 (53.3%) |
| 6 or 7 Rooms | 1,895 (48.5%) | 658 (22.0%) |
| 8 or more Rooms | 1,146 (29.3%) | 117 (3.9%) |
| Total | 3,908 (100.0%) | 2,993 (100.0%) |
Housing Structure by Heating Type in Orange
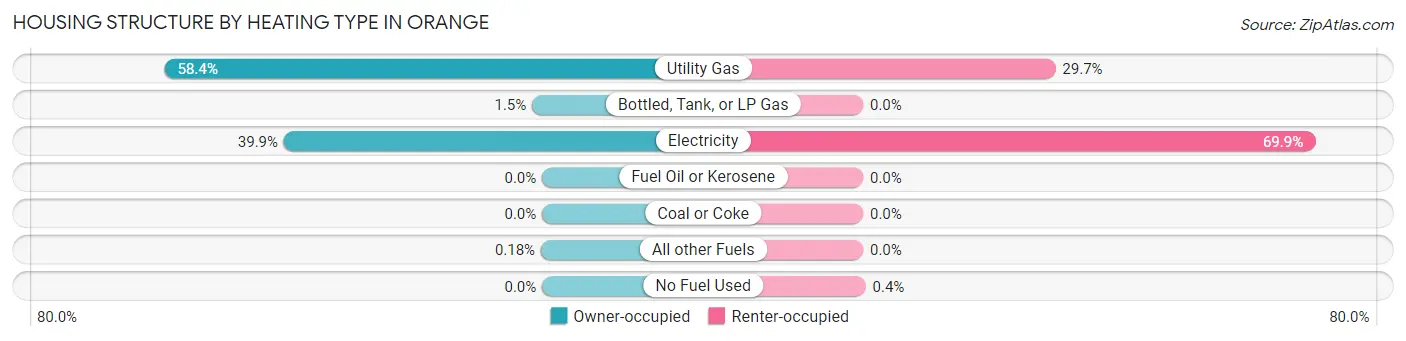
| Heating Type | Owner-occupied | Renter-occupied |
| Utility Gas | 2,281 (58.4%) | 890 (29.7%) |
| Bottled, Tank, or LP Gas | 60 (1.5%) | 0 (0.0%) |
| Electricity | 1,560 (39.9%) | 2,091 (69.9%) |
| Fuel Oil or Kerosene | 0 (0.0%) | 0 (0.0%) |
| Coal or Coke | 0 (0.0%) | 0 (0.0%) |
| All other Fuels | 7 (0.2%) | 0 (0.0%) |
| No Fuel Used | 0 (0.0%) | 12 (0.4%) |
| Total | 3,908 (100.0%) | 2,993 (100.0%) |
Household Vehicle Usage in Orange
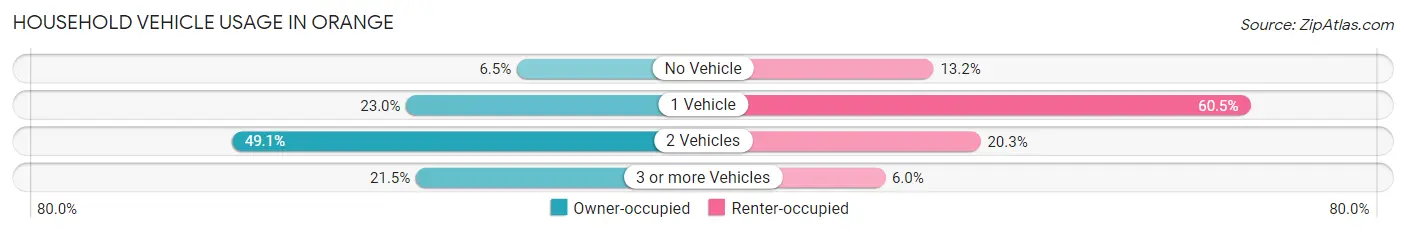
| Vehicles per Household | Owner-occupied | Renter-occupied |
| No Vehicle | 252 (6.5%) | 396 (13.2%) |
| 1 Vehicle | 898 (23.0%) | 1,812 (60.5%) |
| 2 Vehicles | 1,917 (49.0%) | 606 (20.3%) |
| 3 or more Vehicles | 841 (21.5%) | 179 (6.0%) |
| Total | 3,908 (100.0%) | 2,993 (100.0%) |
Real Estate & Mortgages in Orange
Real Estate and Mortgage Overview in Orange
| Characteristic | Without Mortgage | With Mortgage |
| Housing Units | 2,027 | 1,881 |
| Median Property Value | $100,800 | $188,800 |
| Median Household Income | $56,996 | $497 |
| Monthly Housing Costs | $489 | $71 |
| Real Estate Taxes | $1,517 | $9 |
Property Value by Mortgage Status in Orange
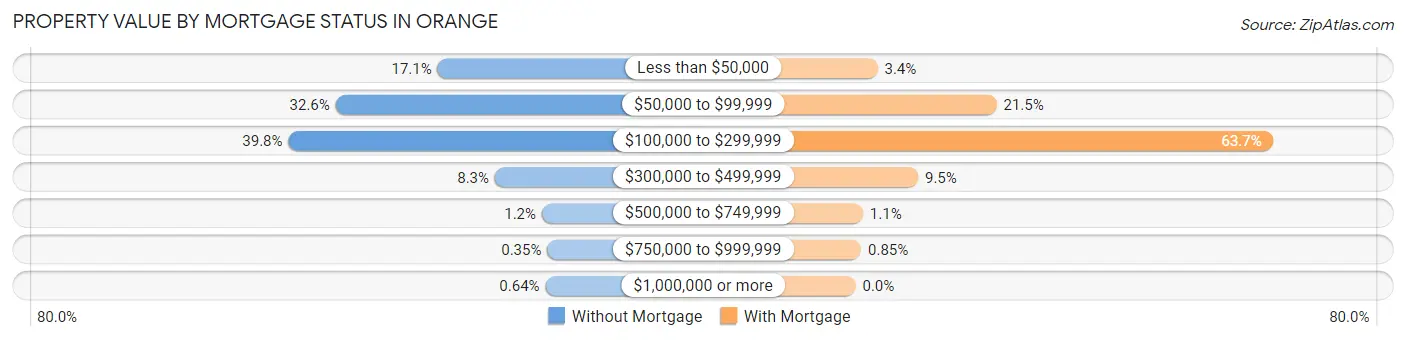
| Property Value | Without Mortgage | With Mortgage |
| Less than $50,000 | 346 (17.1%) | 63 (3.4%) |
| $50,000 to $99,999 | 661 (32.6%) | 404 (21.5%) |
| $100,000 to $299,999 | 807 (39.8%) | 1,198 (63.7%) |
| $300,000 to $499,999 | 169 (8.3%) | 179 (9.5%) |
| $500,000 to $749,999 | 24 (1.2%) | 21 (1.1%) |
| $750,000 to $999,999 | 7 (0.4%) | 16 (0.9%) |
| $1,000,000 or more | 13 (0.6%) | 0 (0.0%) |
| Total | 2,027 (100.0%) | 1,881 (100.0%) |
Household Income by Mortgage Status in Orange
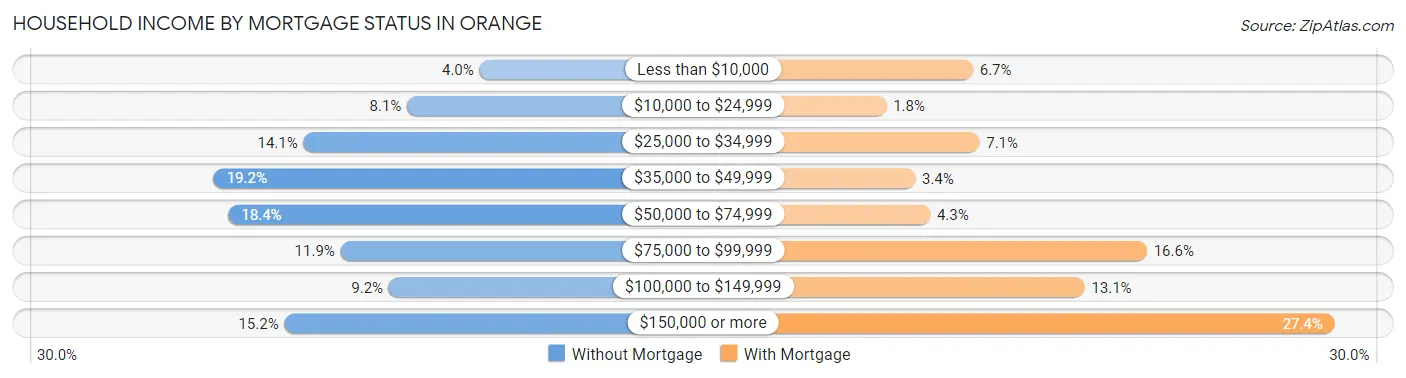
| Household Income | Without Mortgage | With Mortgage |
| Less than $10,000 | 81 (4.0%) | 126 (6.7%) |
| $10,000 to $24,999 | 165 (8.1%) | 33 (1.8%) |
| $25,000 to $34,999 | 285 (14.1%) | 133 (7.1%) |
| $35,000 to $49,999 | 389 (19.2%) | 64 (3.4%) |
| $50,000 to $74,999 | 372 (18.3%) | 80 (4.3%) |
| $75,000 to $99,999 | 242 (11.9%) | 313 (16.6%) |
| $100,000 to $149,999 | 186 (9.2%) | 246 (13.1%) |
| $150,000 or more | 307 (15.1%) | 515 (27.4%) |
| Total | 2,027 (100.0%) | 1,881 (100.0%) |
Property Value to Household Income Ratio in Orange
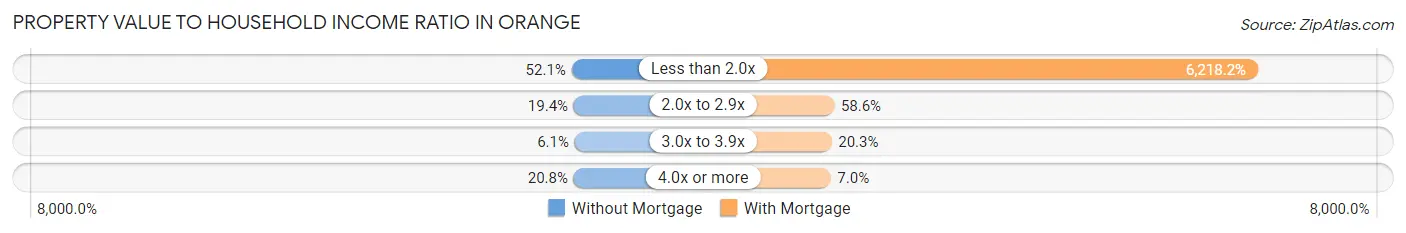
| Value-to-Income Ratio | Without Mortgage | With Mortgage |
| Less than 2.0x | 1,056 (52.1%) | 116,964 (6,218.2%) |
| 2.0x to 2.9x | 393 (19.4%) | 1,102 (58.6%) |
| 3.0x to 3.9x | 123 (6.1%) | 381 (20.3%) |
| 4.0x or more | 421 (20.8%) | 132 (7.0%) |
| Total | 2,027 (100.0%) | 1,881 (100.0%) |
Real Estate Taxes by Mortgage Status in Orange
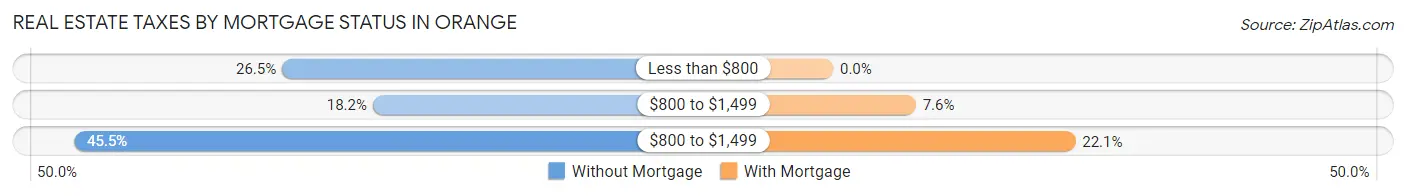
| Property Taxes | Without Mortgage | With Mortgage |
| Less than $800 | 537 (26.5%) | 0 (0.0%) |
| $800 to $1,499 | 369 (18.2%) | 142 (7.5%) |
| $800 to $1,499 | 922 (45.5%) | 416 (22.1%) |
| Total | 2,027 (100.0%) | 1,881 (100.0%) |
Health & Disability in Orange
Health Insurance Coverage by Age in Orange
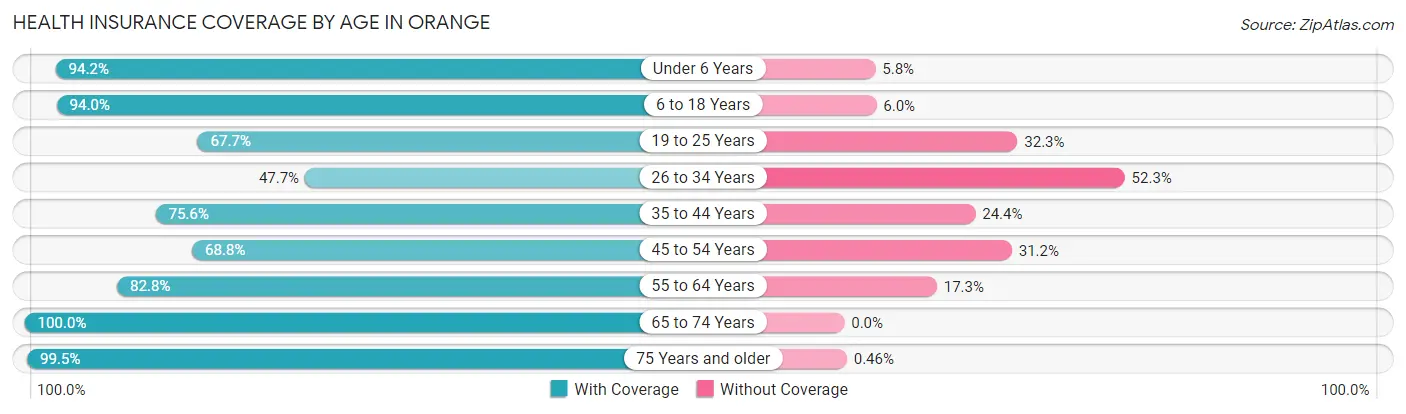
| Age Bracket | With Coverage | Without Coverage |
| Under 6 Years | 1,628 (94.2%) | 100 (5.8%) |
| 6 to 18 Years | 3,364 (94.0%) | 214 (6.0%) |
| 19 to 25 Years | 1,037 (67.7%) | 494 (32.3%) |
| 26 to 34 Years | 1,264 (47.7%) | 1,385 (52.3%) |
| 35 to 44 Years | 1,779 (75.6%) | 575 (24.4%) |
| 45 to 54 Years | 1,264 (68.8%) | 574 (31.2%) |
| 55 to 64 Years | 1,588 (82.8%) | 331 (17.2%) |
| 65 to 74 Years | 1,467 (100.0%) | 0 (0.0%) |
| 75 Years and older | 1,742 (99.5%) | 8 (0.5%) |
| Total | 15,133 (80.4%) | 3,681 (19.6%) |
Health Insurance Coverage by Citizenship Status in Orange
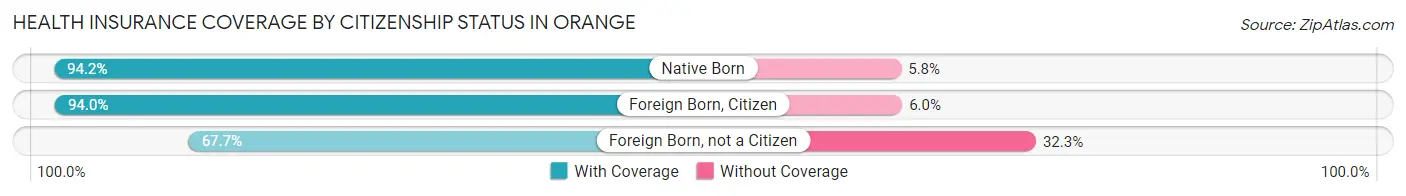
| Citizenship Status | With Coverage | Without Coverage |
| Native Born | 1,628 (94.2%) | 100 (5.8%) |
| Foreign Born, Citizen | 3,364 (94.0%) | 214 (6.0%) |
| Foreign Born, not a Citizen | 1,037 (67.7%) | 494 (32.3%) |
Health Insurance Coverage by Household Income in Orange
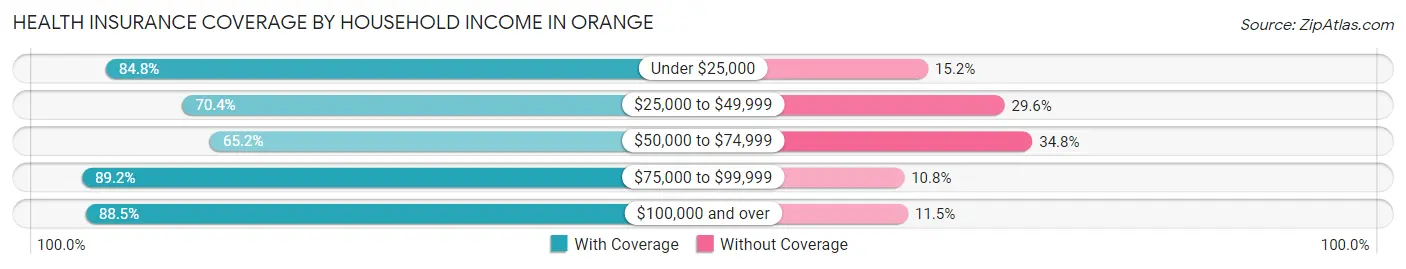
| Household Income | With Coverage | Without Coverage |
| Under $25,000 | 2,308 (84.8%) | 415 (15.2%) |
| $25,000 to $49,999 | 2,980 (70.4%) | 1,251 (29.6%) |
| $50,000 to $74,999 | 1,866 (65.2%) | 994 (34.8%) |
| $75,000 to $99,999 | 2,637 (89.2%) | 318 (10.8%) |
| $100,000 and over | 5,305 (88.5%) | 688 (11.5%) |
Public vs Private Health Insurance Coverage by Age in Orange
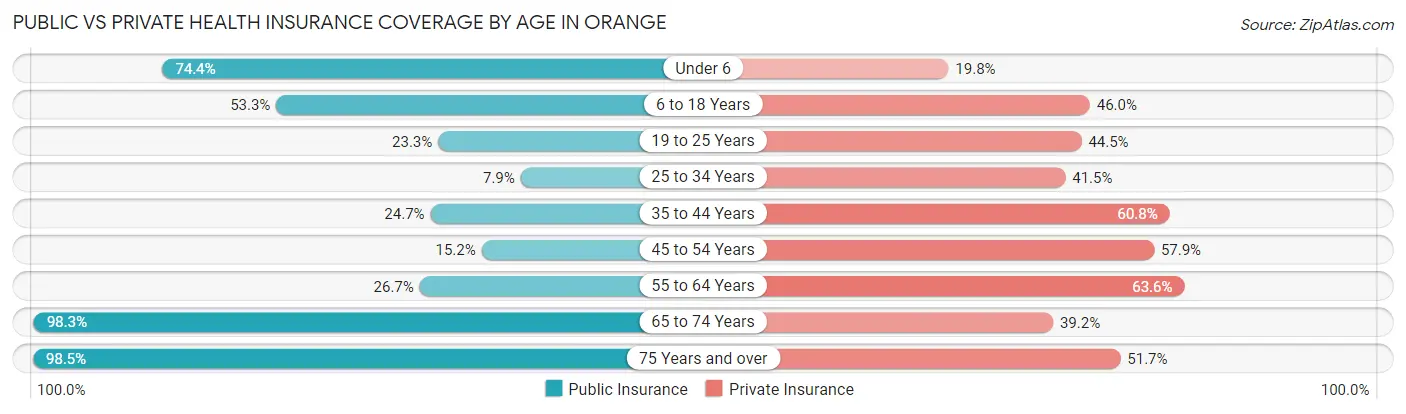
| Age Bracket | Public Insurance | Private Insurance |
| Under 6 | 1,286 (74.4%) | 342 (19.8%) |
| 6 to 18 Years | 1,907 (53.3%) | 1,647 (46.0%) |
| 19 to 25 Years | 356 (23.3%) | 681 (44.5%) |
| 25 to 34 Years | 210 (7.9%) | 1,099 (41.5%) |
| 35 to 44 Years | 581 (24.7%) | 1,432 (60.8%) |
| 45 to 54 Years | 279 (15.2%) | 1,065 (57.9%) |
| 55 to 64 Years | 512 (26.7%) | 1,220 (63.6%) |
| 65 to 74 Years | 1,442 (98.3%) | 575 (39.2%) |
| 75 Years and over | 1,723 (98.5%) | 905 (51.7%) |
| Total | 8,296 (44.1%) | 8,966 (47.7%) |
Disability Status by Sex by Age in Orange
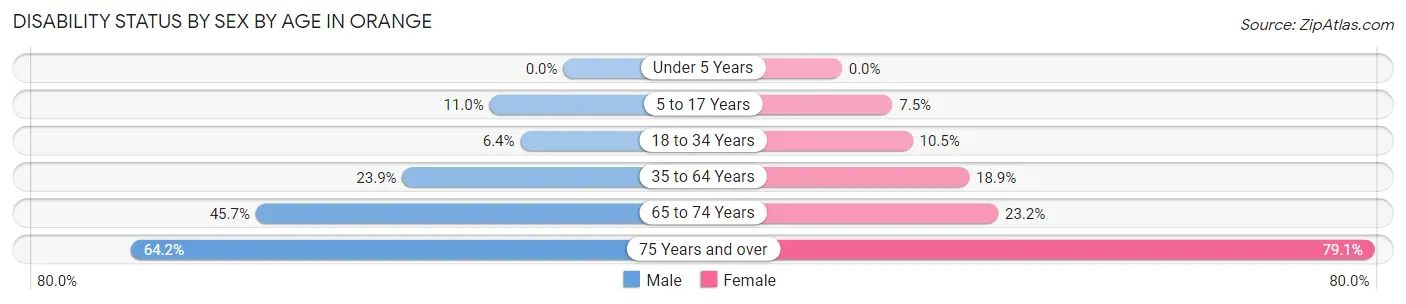
| Age Bracket | Male | Female |
| Under 5 Years | 0 (0.0%) | 0 (0.0%) |
| 5 to 17 Years | 213 (11.0%) | 121 (7.5%) |
| 18 to 34 Years | 145 (6.4%) | 224 (10.5%) |
| 35 to 64 Years | 705 (23.9%) | 597 (18.9%) |
| 65 to 74 Years | 296 (45.7%) | 190 (23.2%) |
| 75 Years and over | 377 (64.2%) | 920 (79.1%) |
Disability Class by Sex by Age in Orange
Disability Class: Hearing Difficulty
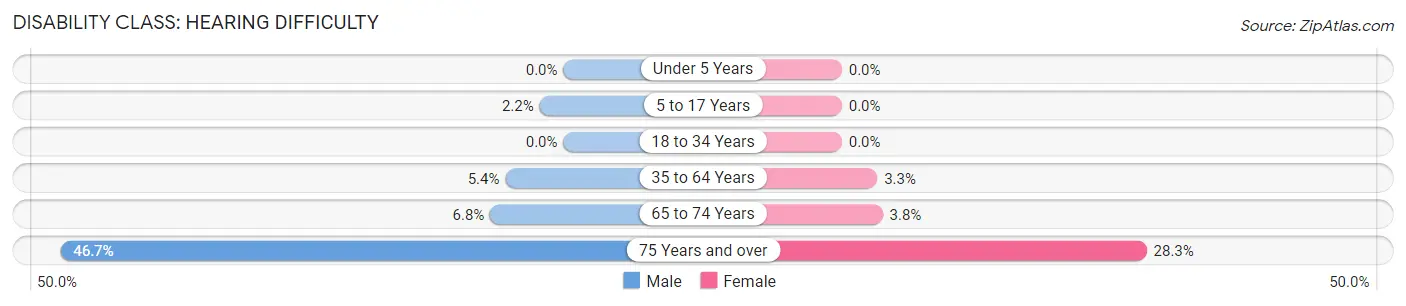
| Age Bracket | Male | Female |
| Under 5 Years | 0 (0.0%) | 0 (0.0%) |
| 5 to 17 Years | 43 (2.2%) | 0 (0.0%) |
| 18 to 34 Years | 0 (0.0%) | 0 (0.0%) |
| 35 to 64 Years | 159 (5.4%) | 104 (3.3%) |
| 65 to 74 Years | 44 (6.8%) | 31 (3.8%) |
| 75 Years and over | 274 (46.7%) | 329 (28.3%) |
Disability Class: Vision Difficulty
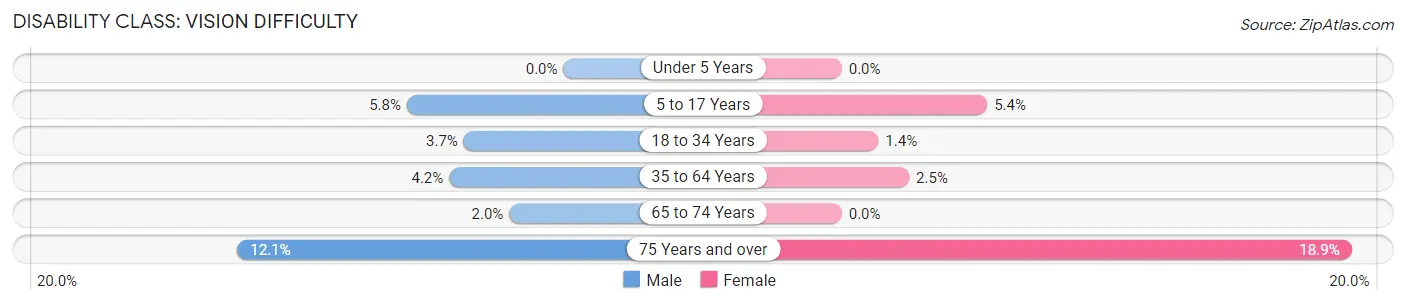
| Age Bracket | Male | Female |
| Under 5 Years | 0 (0.0%) | 0 (0.0%) |
| 5 to 17 Years | 113 (5.8%) | 87 (5.4%) |
| 18 to 34 Years | 84 (3.7%) | 29 (1.4%) |
| 35 to 64 Years | 125 (4.2%) | 79 (2.5%) |
| 65 to 74 Years | 13 (2.0%) | 0 (0.0%) |
| 75 Years and over | 71 (12.1%) | 220 (18.9%) |
Disability Class: Cognitive Difficulty
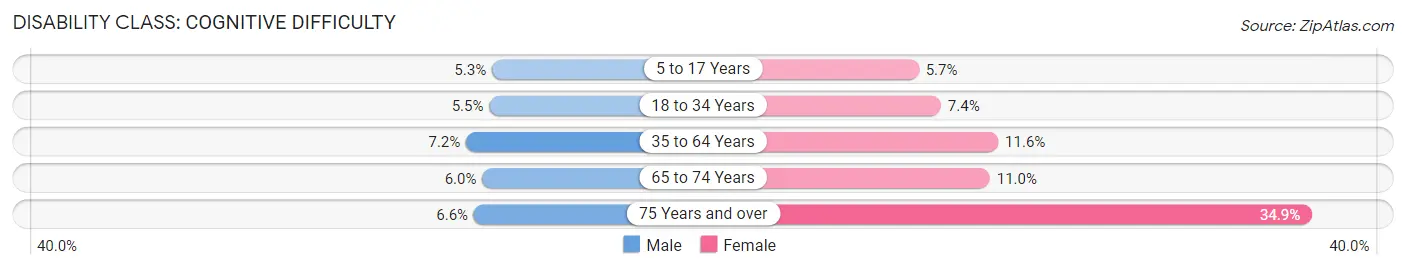
| Age Bracket | Male | Female |
| 5 to 17 Years | 103 (5.3%) | 92 (5.7%) |
| 18 to 34 Years | 125 (5.5%) | 157 (7.4%) |
| 35 to 64 Years | 213 (7.2%) | 367 (11.6%) |
| 65 to 74 Years | 39 (6.0%) | 90 (11.0%) |
| 75 Years and over | 39 (6.6%) | 406 (34.9%) |
Disability Class: Ambulatory Difficulty
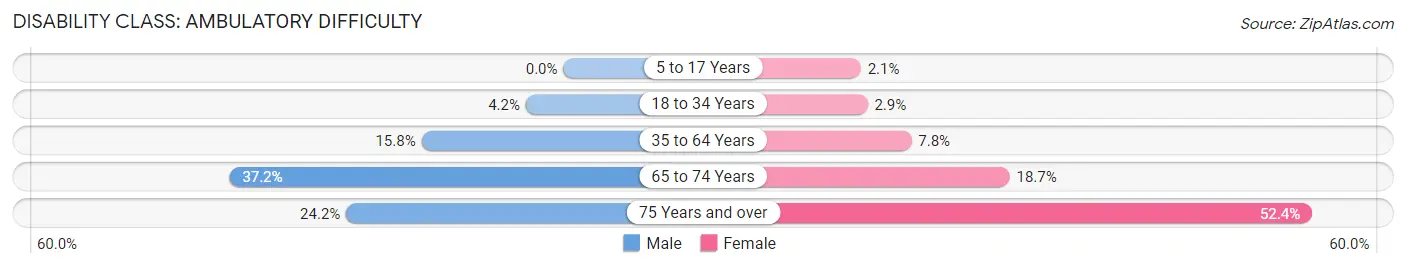
| Age Bracket | Male | Female |
| 5 to 17 Years | 0 (0.0%) | 34 (2.1%) |
| 18 to 34 Years | 95 (4.2%) | 61 (2.9%) |
| 35 to 64 Years | 466 (15.8%) | 245 (7.7%) |
| 65 to 74 Years | 241 (37.2%) | 153 (18.7%) |
| 75 Years and over | 142 (24.2%) | 609 (52.4%) |
Disability Class: Self-Care Difficulty
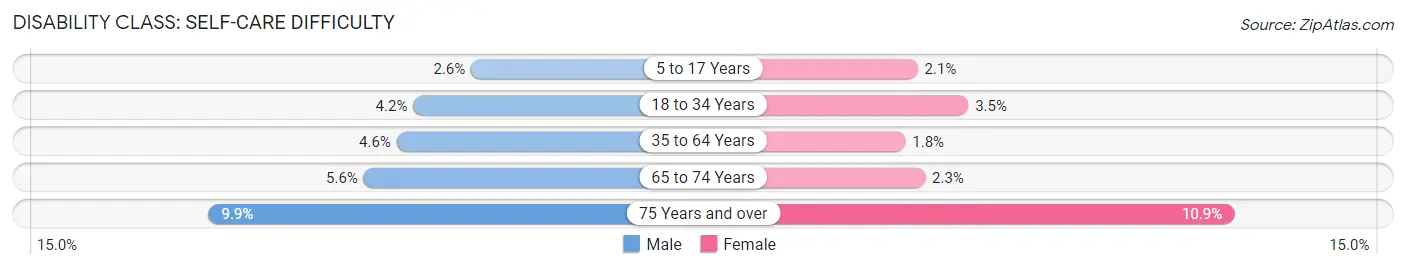
| Age Bracket | Male | Female |
| 5 to 17 Years | 50 (2.6%) | 34 (2.1%) |
| 18 to 34 Years | 95 (4.2%) | 75 (3.5%) |
| 35 to 64 Years | 137 (4.6%) | 56 (1.8%) |
| 65 to 74 Years | 36 (5.6%) | 19 (2.3%) |
| 75 Years and over | 58 (9.9%) | 127 (10.9%) |
Technology Access in Orange
Computing Device Access in Orange
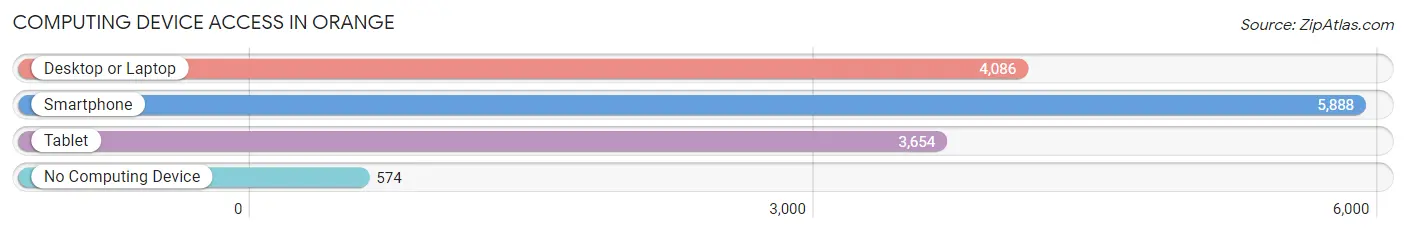
| Device Type | # Households | % Households |
| Desktop or Laptop | 4,086 | 59.2% |
| Smartphone | 5,888 | 85.3% |
| Tablet | 3,654 | 52.9% |
| No Computing Device | 574 | 8.3% |
| Total | 6,901 | 100.0% |
Internet Access in Orange
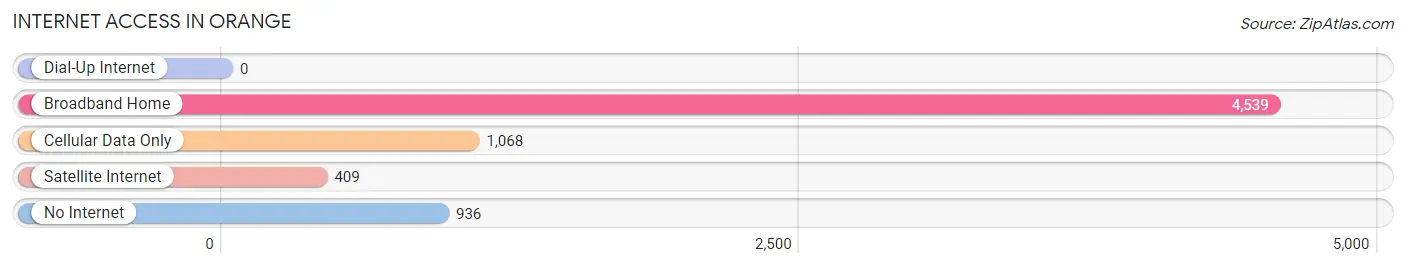
| Internet Type | # Households | % Households |
| Dial-Up Internet | 0 | 0.0% |
| Broadband Home | 4,539 | 65.8% |
| Cellular Data Only | 1,068 | 15.5% |
| Satellite Internet | 409 | 5.9% |
| No Internet | 936 | 13.6% |
| Total | 6,901 | 100.0% |
Orange Summary
Orange, Texas is a city located in Orange County, Texas, United States. It is situated on the Sabine River, near the Louisiana border. The city is the county seat of Orange County and is the easternmost city in Texas. As of the 2010 census, the city had a population of 18,595.
Geography
Orange is located at 30°5'25" North, 93°45'45" West (30.090278, -93.7625). It is situated on the Sabine River, near the Louisiana border. The city is the county seat of Orange County and is the easternmost city in Texas. The city has a total area of 10.2 square miles, of which 10.1 square miles is land and 0.1 square miles is water.
Climate
Orange has a humid subtropical climate, with hot, humid summers and mild winters. The average annual temperature is 68°F, with an average high of 81°F in July and an average low of 54°F in January. The average annual precipitation is 51.2 inches, with an average of 4.7 inches of snow per year.
Demographics
As of the 2010 census, the city had a population of 18,595. The racial makeup of the city was 68.2% White, 24.3% African American, 0.5% Native American, 1.2% Asian, 0.1% Pacific Islander, 3.7% from other races, and 2.1% from two or more races. Hispanic or Latino of any race were 8.3% of the population.
Economy
Orange is home to several major industries, including oil and gas, petrochemicals, and shipbuilding. The city is also home to the Orange County Airport, which serves as a hub for air travel in the region. The city is also home to several major employers, including the Port of Orange, the Orange County Courthouse, and the Orange County Convention and Visitors Bureau.
The city's economy is largely based on the oil and gas industry, with several major oil and gas companies having operations in the city. The city is also home to several major petrochemical companies, including Chevron, ExxonMobil, and Valero. The city is also home to several major shipbuilding companies, including Austal USA and Bollinger Shipyards.
Education
Orange is served by the Orange Independent School District, which consists of seven elementary schools, two middle schools, and one high school. The city is also home to Lamar State College-Orange, a two-year college offering associate's degrees and certificate programs.
Conclusion
Orange, Texas is a city located in Orange County, Texas, United States. It is situated on the Sabine River, near the Louisiana border. The city is the county seat of Orange County and is the easternmost city in Texas. As of the 2010 census, the city had a population of 18,595. The city has a humid subtropical climate, with hot, humid summers and mild winters. The city's economy is largely based on the oil and gas industry, with several major oil and gas companies having operations in the city. The city is also home to several major employers, including the Port of Orange, the Orange County Courthouse, and the Orange County Convention and Visitors Bureau. The city is served by the Orange Independent School District, which consists of seven elementary schools, two middle schools, and one high school. The city is also home to Lamar State College-Orange, a two-year college offering associate's degrees and certificate programs.
Common Questions
What is Per Capita Income in Orange?
Per Capita income in Orange is $30,786.
What is the Median Family Income in Orange?
Median Family Income in Orange is $70,703.
What is the Median Household income in Orange?
Median Household Income in Orange is $58,756.
What is Income or Wage Gap in Orange?
Income or Wage Gap in Orange is 30.7%.
Women in Orange earn 69.3 cents for every dollar earned by a man.
What is Family Income Deficit in Orange?
Family Income Deficit in Orange is $10,600.
Families that are below poverty line in Orange earn $10,600 less on average than the poverty threshold level.
What is Inequality or Gini Index in Orange?
Inequality or Gini Index in Orange is 0.46.
What is the Total Population of Orange?
Total Population of Orange is 19,221.
What is the Total Male Population of Orange?
Total Male Population of Orange is 9,480.
What is the Total Female Population of Orange?
Total Female Population of Orange is 9,741.
What is the Ratio of Males per 100 Females in Orange?
There are 97.32 Males per 100 Females in Orange.
What is the Ratio of Females per 100 Males in Orange?
There are 102.75 Females per 100 Males in Orange.
What is the Median Population Age in Orange?
Median Population Age in Orange is 34.7 Years.
What is the Average Family Size in Orange
Average Family Size in Orange is 3.4 People.
What is the Average Household Size in Orange
Average Household Size in Orange is 2.7 People.
How Large is the Labor Force in Orange?
There are 8,740 People in the Labor Forcein in Orange.
What is the Percentage of People in the Labor Force in Orange?
59.8% of People are in the Labor Force in Orange.
What is the Unemployment Rate in Orange?
Unemployment Rate in Orange is 8.7%.