Addison, TX Map & Demographics
Addison Map
Addison Overview
$56,083
PER CAPITA INCOME
$87,515
AVG FAMILY INCOME
$78,153
AVG HOUSEHOLD INCOME
20.6%
WAGE / INCOME GAP [ % ]
79.4¢/ $1
WAGE / INCOME GAP [ $ ]
0.42
INEQUALITY / GINI INDEX
17,026
TOTAL POPULATION
8,544
MALE POPULATION
8,482
FEMALE POPULATION
100.73
MALES / 100 FEMALES
99.27
FEMALES / 100 MALES
34.0
MEDIAN AGE
2.6
AVG FAMILY SIZE
1.8
AVG HOUSEHOLD SIZE
12,322
LABOR FORCE [ PEOPLE ]
80.9%
PERCENT IN LABOR FORCE
3.3%
UNEMPLOYMENT RATE
Addison Zip Codes
Addison Area Codes
Income in Addison
Income Overview in Addison
Per Capita Income in Addison is $56,083, while median incomes of families and households are $87,515 and $78,153 respectively.
| Characteristic | Number | Measure |
| Per Capita Income | 17,026 | $56,083 |
| Median Family Income | 3,457 | $87,515 |
| Mean Family Income | 3,457 | $118,499 |
| Median Household Income | 9,561 | $78,153 |
| Mean Household Income | 9,561 | $98,668 |
| Income Deficit | 3,457 | $0 |
| Wage / Income Gap (%) | 17,026 | 20.60% |
| Wage / Income Gap ($) | 17,026 | 79.40¢ per $1 |
| Gini / Inequality Index | 17,026 | 0.42 |
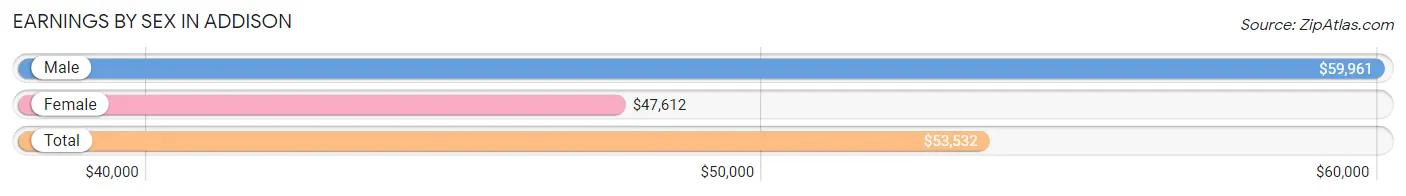
Earnings by Sex in Addison
Average Earnings in Addison are $53,532, $59,961 for men and $47,612 for women, a difference of 20.6%.
| Sex | Number | Average Earnings |
| Male | 6,624 (51.7%) | $59,961 |
| Female | 6,191 (48.3%) | $47,612 |
| Total | 12,815 (100.0%) | $53,532 |
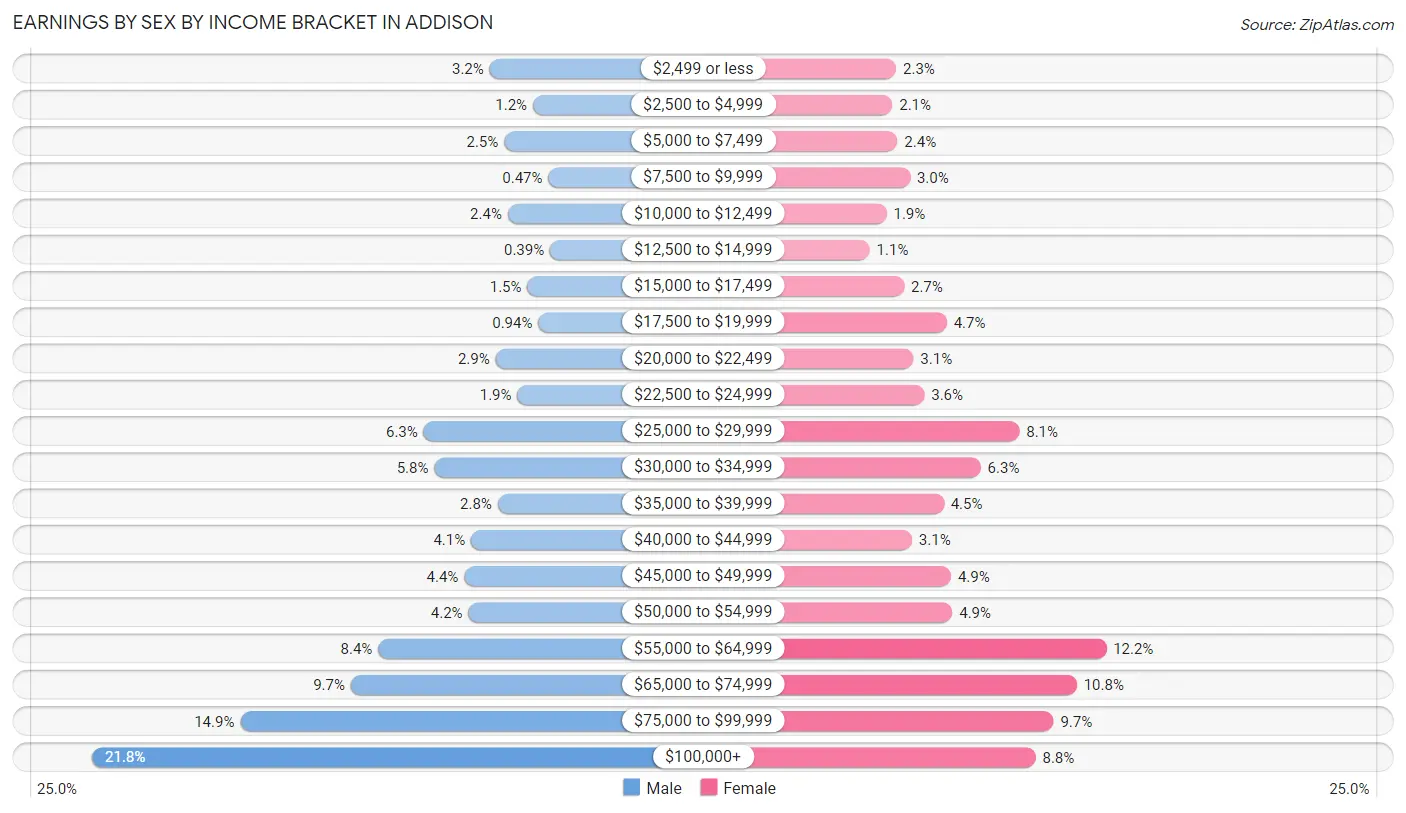
Earnings by Sex by Income Bracket in Addison
The most common earnings brackets in Addison are $100,000+ for men (1,447 | 21.8%) and $55,000 to $64,999 for women (752 | 12.1%).
| Income | Male | Female |
| $2,499 or less | 213 (3.2%) | 143 (2.3%) |
| $2,500 to $4,999 | 79 (1.2%) | 132 (2.1%) |
| $5,000 to $7,499 | 168 (2.5%) | 147 (2.4%) |
| $7,500 to $9,999 | 31 (0.5%) | 183 (3.0%) |
| $10,000 to $12,499 | 157 (2.4%) | 115 (1.9%) |
| $12,500 to $14,999 | 26 (0.4%) | 66 (1.1%) |
| $15,000 to $17,499 | 96 (1.5%) | 166 (2.7%) |
| $17,500 to $19,999 | 62 (0.9%) | 290 (4.7%) |
| $20,000 to $22,499 | 195 (2.9%) | 193 (3.1%) |
| $22,500 to $24,999 | 127 (1.9%) | 225 (3.6%) |
| $25,000 to $29,999 | 418 (6.3%) | 500 (8.1%) |
| $30,000 to $34,999 | 385 (5.8%) | 388 (6.3%) |
| $35,000 to $39,999 | 188 (2.8%) | 281 (4.5%) |
| $40,000 to $44,999 | 271 (4.1%) | 189 (3.0%) |
| $45,000 to $49,999 | 292 (4.4%) | 302 (4.9%) |
| $50,000 to $54,999 | 279 (4.2%) | 306 (4.9%) |
| $55,000 to $64,999 | 559 (8.4%) | 752 (12.1%) |
| $65,000 to $74,999 | 644 (9.7%) | 667 (10.8%) |
| $75,000 to $99,999 | 987 (14.9%) | 599 (9.7%) |
| $100,000+ | 1,447 (21.8%) | 547 (8.8%) |
| Total | 6,624 (100.0%) | 6,191 (100.0%) |
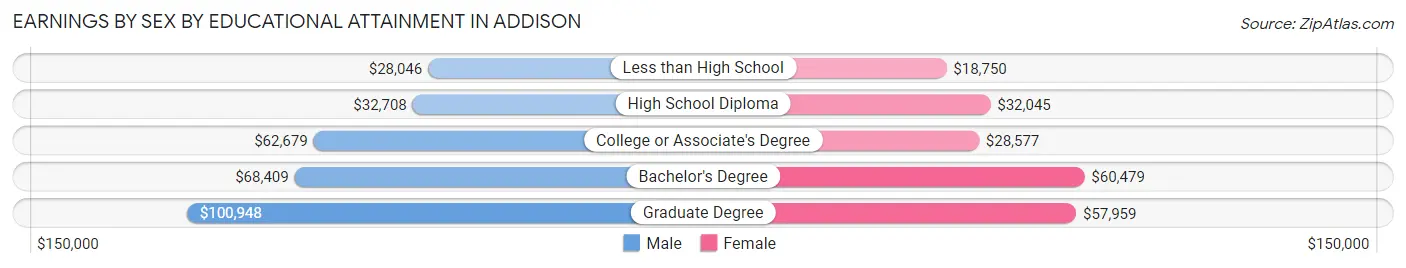
Earnings by Sex by Educational Attainment in Addison
Average earnings in Addison are $65,625 for men and $53,040 for women, a difference of 19.2%. Men with an educational attainment of graduate degree enjoy the highest average annual earnings of $100,948, while those with less than high school education earn the least with $28,046. Women with an educational attainment of bachelor's degree earn the most with the average annual earnings of $60,479, while those with less than high school education have the smallest earnings of $18,750.
| Educational Attainment | Male Income | Female Income |
| Less than High School | $28,046 | $18,750 |
| High School Diploma | $32,708 | $32,045 |
| College or Associate's Degree | $62,679 | $28,577 |
| Bachelor's Degree | $68,409 | $60,479 |
| Graduate Degree | $100,948 | $57,959 |
| Total | $65,625 | $53,040 |
Family Income in Addison
Family Income Brackets in Addison
According to the Addison family income data, there are 733 families falling into the $100,000 to $149,999 income range, which is the most common income bracket and makes up 21.2% of all families. Conversely, the $10,000 to $14,999 income bracket is the least frequent group with only 28 families (0.8%) belonging to this category.
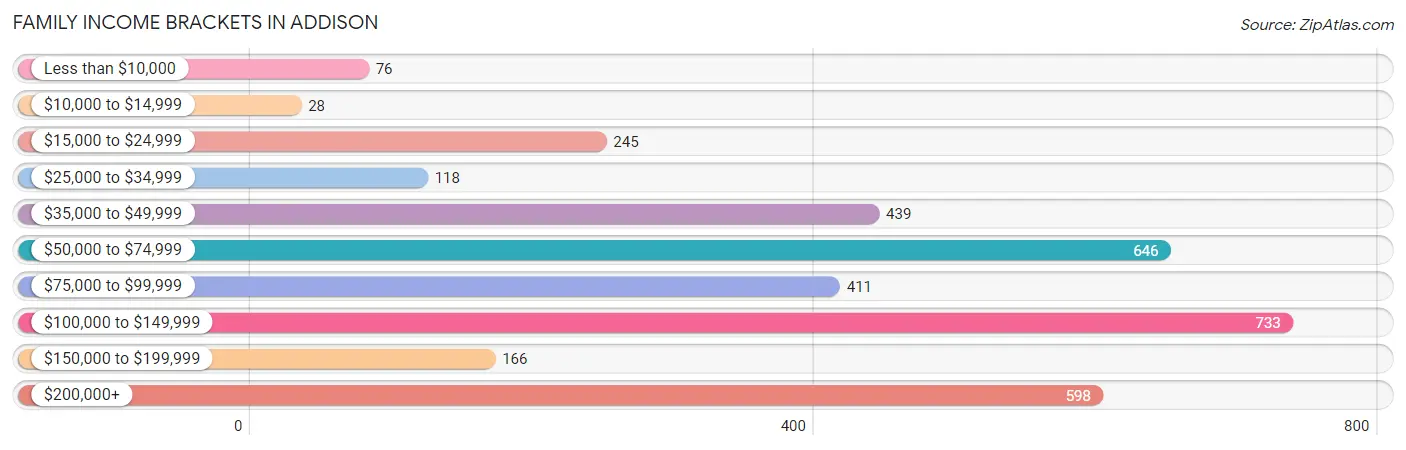
| Income Bracket | # Families | % Families |
| Less than $10,000 | 76 | 2.2% |
| $10,000 to $14,999 | 28 | 0.8% |
| $15,000 to $24,999 | 245 | 7.1% |
| $25,000 to $34,999 | 118 | 3.4% |
| $35,000 to $49,999 | 439 | 12.7% |
| $50,000 to $74,999 | 646 | 18.7% |
| $75,000 to $99,999 | 411 | 11.9% |
| $100,000 to $149,999 | 733 | 21.2% |
| $150,000 to $199,999 | 166 | 4.8% |
| $200,000+ | 598 | 17.3% |
Family Income by Famaliy Size in Addison
2-person families (2,068 | 59.8%) account for the highest median family income in Addison with $110,417 per family, while 2-person families (2,068 | 59.8%) have the highest median income of $55,208 per family member.
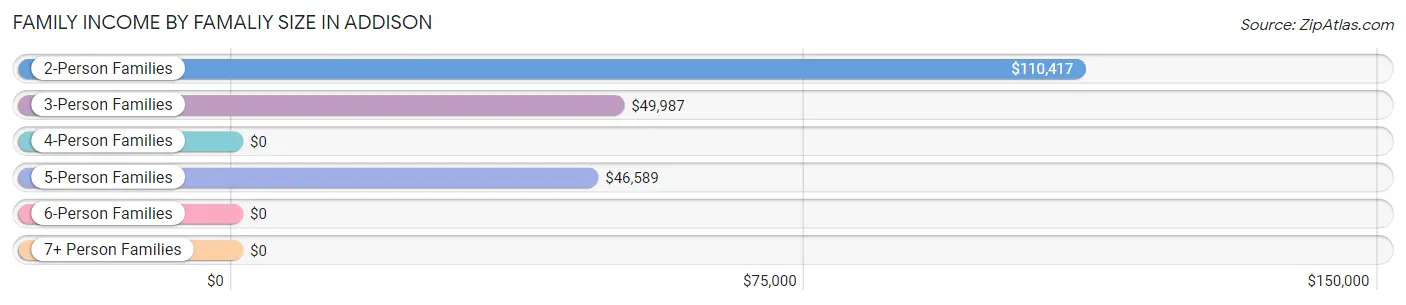
| Income Bracket | # Families | Median Income |
| 2-Person Families | 2,068 (59.8%) | $110,417 |
| 3-Person Families | 1,030 (29.8%) | $49,987 |
| 4-Person Families | 222 (6.4%) | $0 |
| 5-Person Families | 85 (2.5%) | $46,589 |
| 6-Person Families | 52 (1.5%) | $0 |
| 7+ Person Families | 0 (0.0%) | $0 |
| Total | 3,457 (100.0%) | $87,515 |
Family Income by Number of Earners in Addison
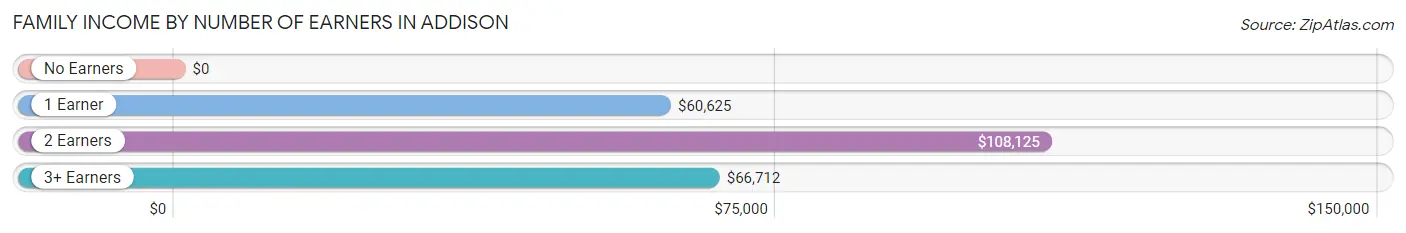
| Number of Earners | # Families | Median Income |
| No Earners | 237 (6.9%) | $0 |
| 1 Earner | 1,204 (34.8%) | $60,625 |
| 2 Earners | 1,761 (50.9%) | $108,125 |
| 3+ Earners | 255 (7.4%) | $66,712 |
| Total | 3,457 (100.0%) | $87,515 |
Household Income in Addison
Household Income Brackets in Addison
With 1,941 households falling in the category, the $50,000 to $74,999 income range is the most frequent in Addison, accounting for 20.3% of all households. In contrast, only 124 households (1.3%) fall into the $10,000 to $14,999 income bracket, making it the least populous group.
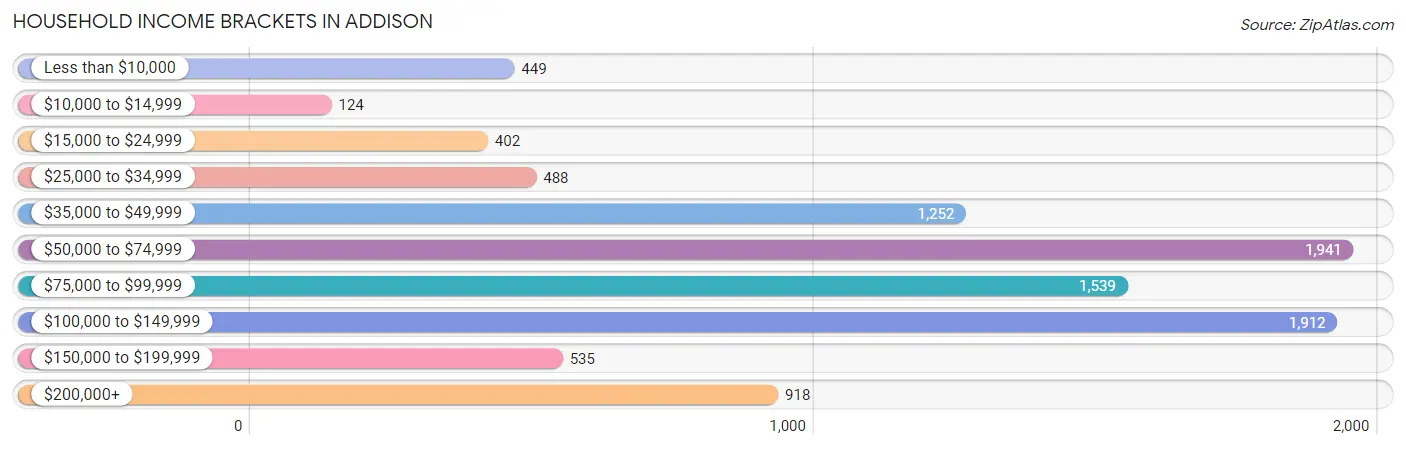
| Income Bracket | # Households | % Households |
| Less than $10,000 | 449 | 4.7% |
| $10,000 to $14,999 | 124 | 1.3% |
| $15,000 to $24,999 | 402 | 4.2% |
| $25,000 to $34,999 | 488 | 5.1% |
| $35,000 to $49,999 | 1,252 | 13.1% |
| $50,000 to $74,999 | 1,941 | 20.3% |
| $75,000 to $99,999 | 1,539 | 16.1% |
| $100,000 to $149,999 | 1,912 | 20.0% |
| $150,000 to $199,999 | 535 | 5.6% |
| $200,000+ | 918 | 9.6% |
Household Income by Householder Age in Addison
The median household income in Addison is $78,153, with the highest median household income of $81,872 found in the 25 to 44 years age bracket for the primary householder. A total of 5,253 households (54.9%) fall into this category. Meanwhile, the 15 to 24 years age bracket for the primary householder has the lowest median household income of $50,781, with 805 households (8.4%) in this group.
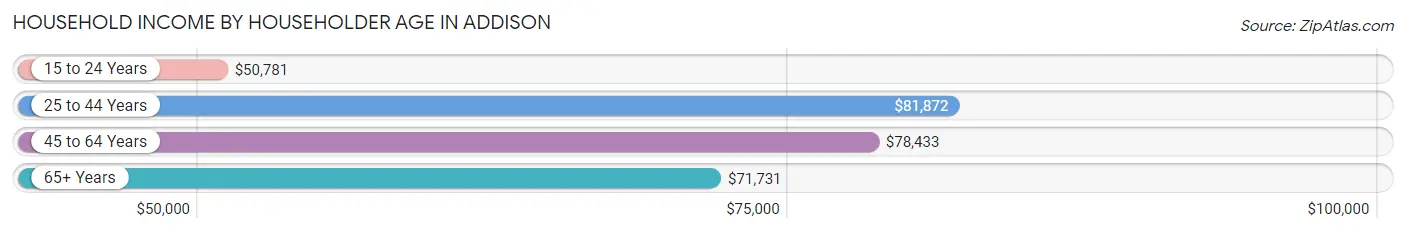
| Income Bracket | # Households | Median Income |
| 15 to 24 Years | 805 (8.4%) | $50,781 |
| 25 to 44 Years | 5,253 (54.9%) | $81,872 |
| 45 to 64 Years | 2,317 (24.2%) | $78,433 |
| 65+ Years | 1,186 (12.4%) | $71,731 |
| Total | 9,561 (100.0%) | $78,153 |
Poverty in Addison
Income Below Poverty by Sex and Age in Addison
With 7.9% poverty level for males and 8.8% for females among the residents of Addison, 18 to 24 year old males and 16 and 17 year old females are the most vulnerable to poverty, with 172 males (20.9%) and 20 females (20.8%) in their respective age groups living below the poverty level.
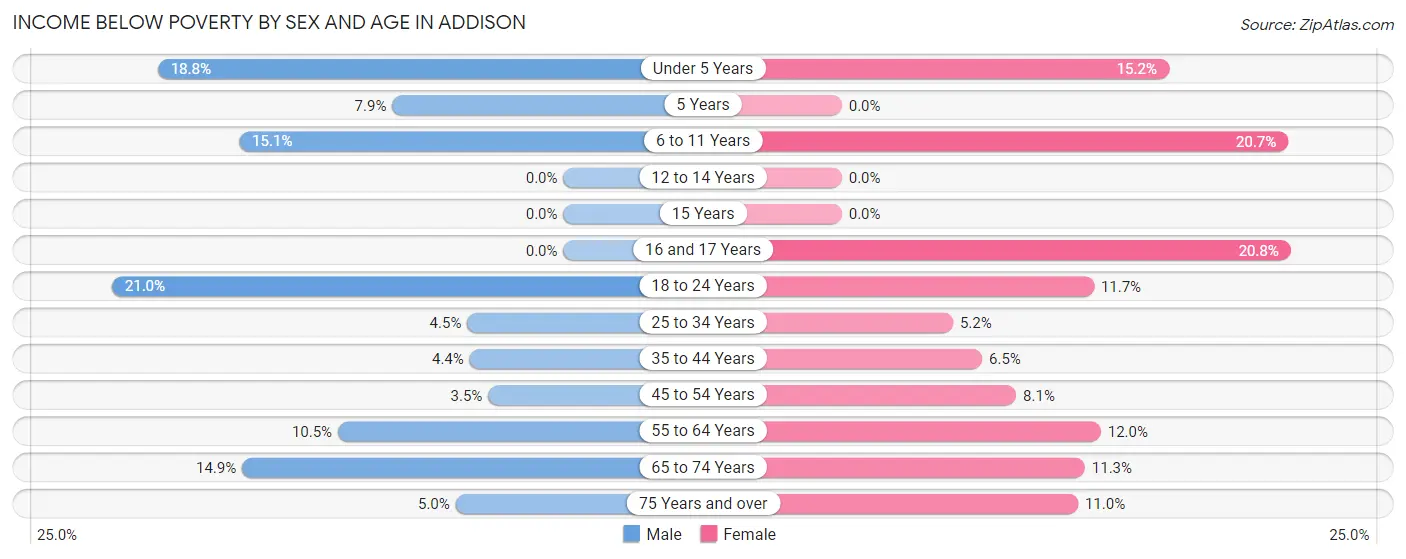
| Age Bracket | Male | Female |
| Under 5 Years | 70 (18.8%) | 49 (15.2%) |
| 5 Years | 5 (7.9%) | 0 (0.0%) |
| 6 to 11 Years | 48 (15.0%) | 64 (20.7%) |
| 12 to 14 Years | 0 (0.0%) | 0 (0.0%) |
| 15 Years | 0 (0.0%) | 0 (0.0%) |
| 16 and 17 Years | 0 (0.0%) | 20 (20.8%) |
| 18 to 24 Years | 172 (20.9%) | 106 (11.7%) |
| 25 to 34 Years | 121 (4.5%) | 124 (5.2%) |
| 35 to 44 Years | 63 (4.3%) | 92 (6.5%) |
| 45 to 54 Years | 44 (3.5%) | 75 (8.1%) |
| 55 to 64 Years | 61 (10.5%) | 106 (12.0%) |
| 65 to 74 Years | 78 (14.9%) | 89 (11.3%) |
| 75 Years and over | 9 (5.0%) | 24 (11.0%) |
| Total | 671 (7.9%) | 749 (8.8%) |
Income Above Poverty by Sex and Age in Addison
According to the poverty statistics in Addison, males aged 12 to 14 years and females aged 5 years are the age groups that are most secure financially, with 100.0% of males and 100.0% of females in these age groups living above the poverty line.
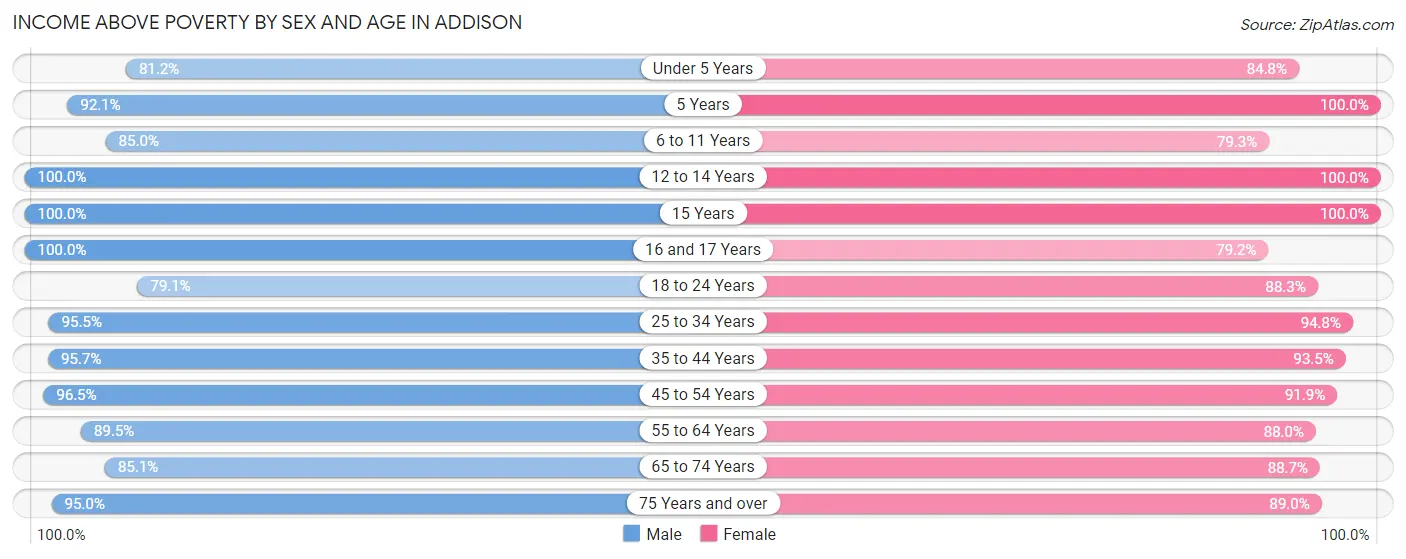
| Age Bracket | Male | Female |
| Under 5 Years | 302 (81.2%) | 274 (84.8%) |
| 5 Years | 58 (92.1%) | 76 (100.0%) |
| 6 to 11 Years | 271 (85.0%) | 245 (79.3%) |
| 12 to 14 Years | 136 (100.0%) | 96 (100.0%) |
| 15 Years | 17 (100.0%) | 43 (100.0%) |
| 16 and 17 Years | 62 (100.0%) | 76 (79.2%) |
| 18 to 24 Years | 649 (79.0%) | 800 (88.3%) |
| 25 to 34 Years | 2,595 (95.5%) | 2,279 (94.8%) |
| 35 to 44 Years | 1,386 (95.7%) | 1,321 (93.5%) |
| 45 to 54 Years | 1,218 (96.5%) | 852 (91.9%) |
| 55 to 64 Years | 522 (89.5%) | 776 (88.0%) |
| 65 to 74 Years | 445 (85.1%) | 700 (88.7%) |
| 75 Years and over | 171 (95.0%) | 195 (89.0%) |
| Total | 7,832 (92.1%) | 7,733 (91.2%) |
Income Below Poverty Among Married-Couple Families in Addison
The poverty statistics for married-couple families in Addison show that 8.5% or 209 of the total 2,466 families live below the poverty line. Families with 3 or 4 children have the highest poverty rate of 35.7%, comprising of 5 families. On the other hand, families with no children have the lowest poverty rate of 6.2%, which includes 110 families.
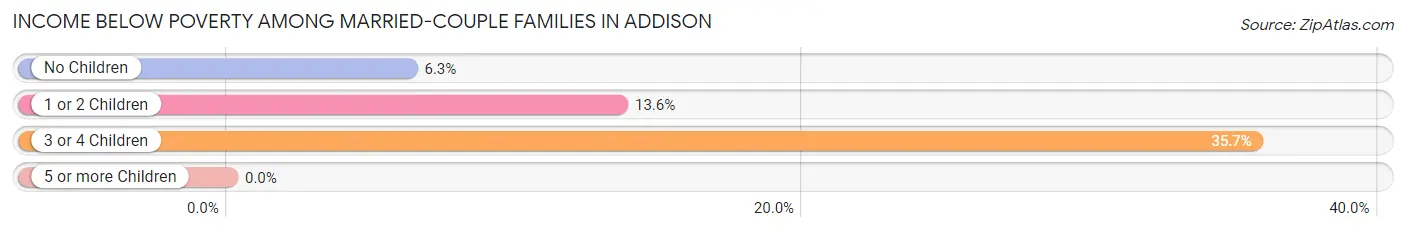
| Children | Above Poverty | Below Poverty |
| No Children | 1,650 (93.8%) | 110 (6.2%) |
| 1 or 2 Children | 598 (86.4%) | 94 (13.6%) |
| 3 or 4 Children | 9 (64.3%) | 5 (35.7%) |
| 5 or more Children | 0 (0.0%) | 0 (0.0%) |
| Total | 2,257 (91.5%) | 209 (8.5%) |
Income Below Poverty Among Single-Parent Households in Addison
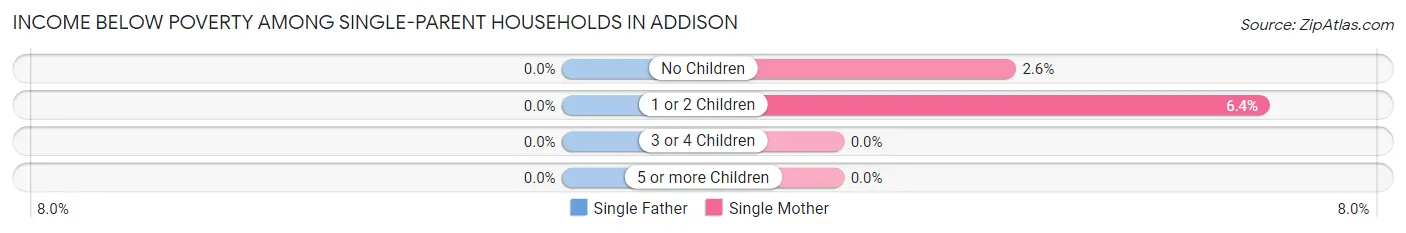
| Children | Single Father | Single Mother |
| No Children | 0 (0.0%) | 7 (2.6%) |
| 1 or 2 Children | 0 (0.0%) | 29 (6.4%) |
| 3 or 4 Children | 0 (0.0%) | 0 (0.0%) |
| 5 or more Children | 0 (0.0%) | 0 (0.0%) |
| Total | 0 (0.0%) | 36 (4.9%) |
Income Below Poverty Among Married-Couple vs Single-Parent Households in Addison
The poverty data for Addison shows that 209 of the married-couple family households (8.5%) and 36 of the single-parent households (3.6%) are living below the poverty level. Within the married-couple family households, those with 3 or 4 children have the highest poverty rate, with 5 households (35.7%) falling below the poverty line. Among the single-parent households, those with 1 or 2 children have the highest poverty rate, with 29 household (4.5%) living below poverty.
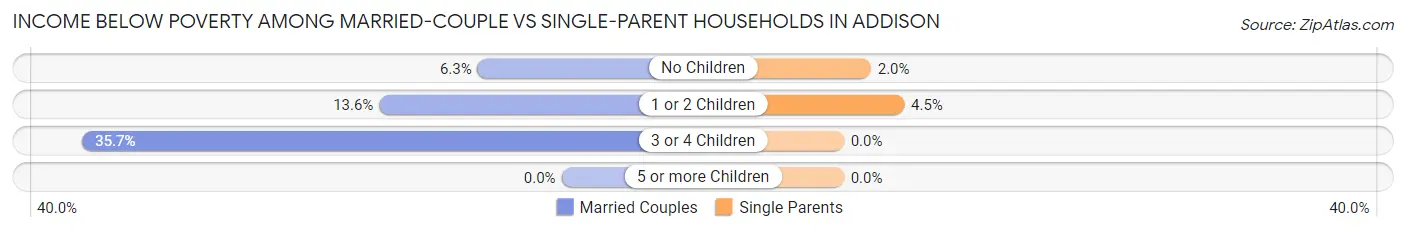
| Children | Married-Couple Families | Single-Parent Households |
| No Children | 110 (6.2%) | 7 (2.0%) |
| 1 or 2 Children | 94 (13.6%) | 29 (4.5%) |
| 3 or 4 Children | 5 (35.7%) | 0 (0.0%) |
| 5 or more Children | 0 (0.0%) | 0 (0.0%) |
| Total | 209 (8.5%) | 36 (3.6%) |
Race in Addison
The most populous races in Addison are White / Caucasian (9,585 | 56.3%), Hispanic or Latino (4,597 | 27.0%), and Black / African American (2,949 | 17.3%).
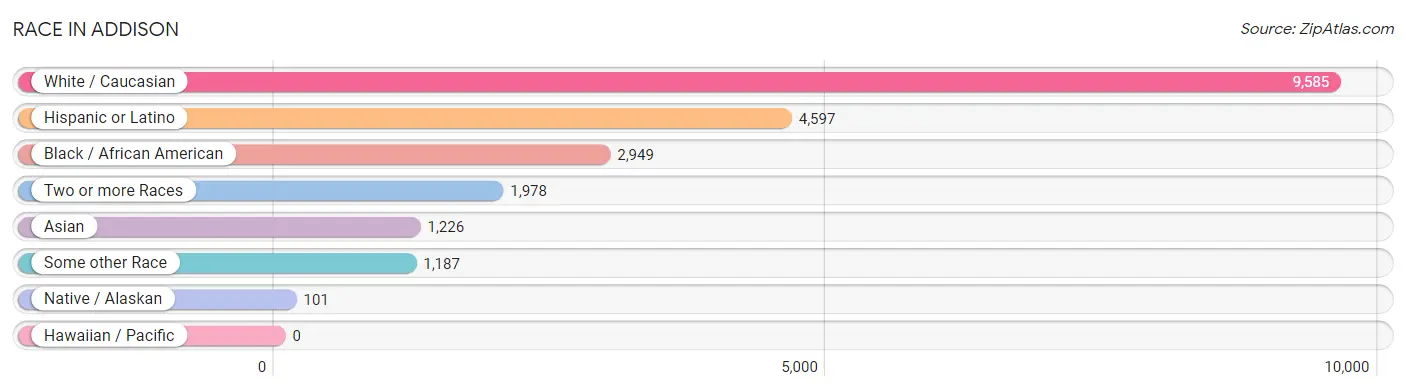
| Race | # Population | % Population |
| Asian | 1,226 | 7.2% |
| Black / African American | 2,949 | 17.3% |
| Hawaiian / Pacific | 0 | 0.0% |
| Hispanic or Latino | 4,597 | 27.0% |
| Native / Alaskan | 101 | 0.6% |
| White / Caucasian | 9,585 | 56.3% |
| Two or more Races | 1,978 | 11.6% |
| Some other Race | 1,187 | 7.0% |
| Total | 17,026 | 100.0% |
Ancestry in Addison
The most populous ancestries reported in Addison are Mexican (2,378 | 14.0%), German (1,910 | 11.2%), English (1,523 | 8.9%), Irish (1,447 | 8.5%), and Central American (925 | 5.4%), together accounting for 48.1% of all Addison residents.
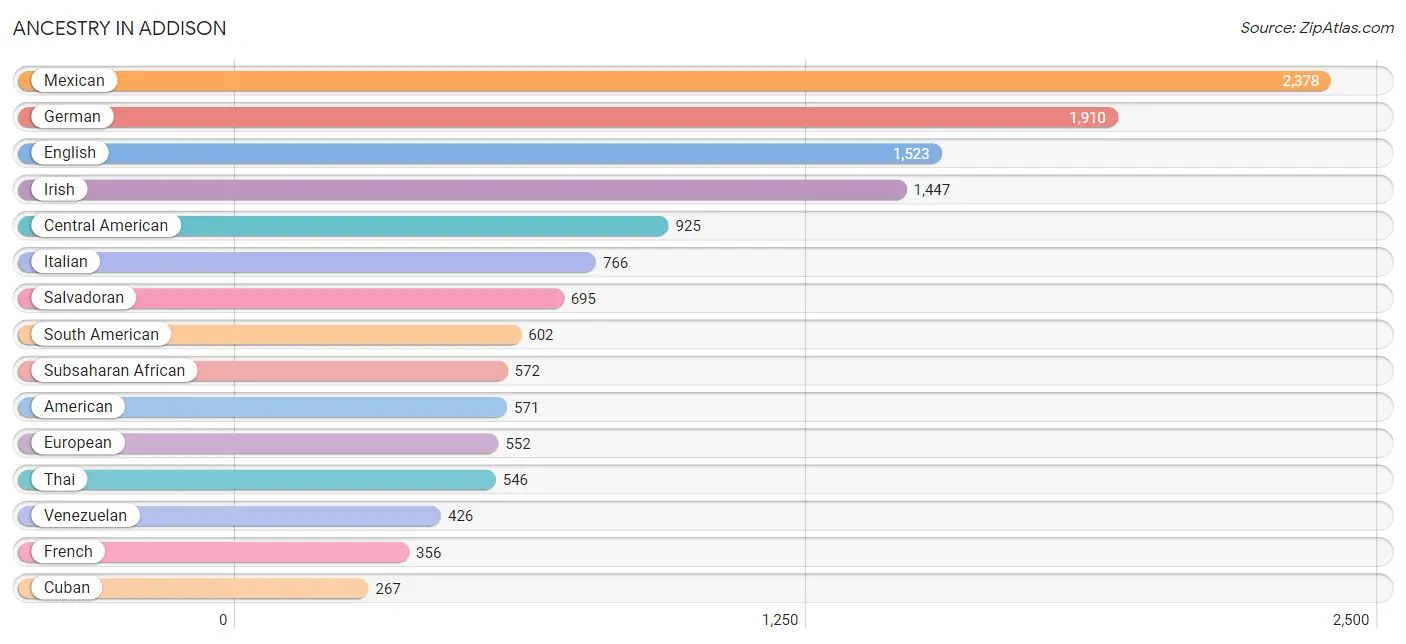
| Ancestry | # Population | % Population |
| African | 22 | 0.1% |
| Albanian | 44 | 0.3% |
| American | 571 | 3.4% |
| Apache | 37 | 0.2% |
| Arab | 100 | 0.6% |
| Australian | 7 | 0.0% |
| Austrian | 18 | 0.1% |
| Belgian | 107 | 0.6% |
| Bhutanese | 94 | 0.5% |
| British | 190 | 1.1% |
| Bulgarian | 44 | 0.3% |
| Burmese | 251 | 1.5% |
| Cajun | 7 | 0.0% |
| Central American | 925 | 5.4% |
| Cherokee | 46 | 0.3% |
| Chilean | 22 | 0.1% |
| Colombian | 79 | 0.5% |
| Comanche | 7 | 0.0% |
| Croatian | 6 | 0.0% |
| Cuban | 267 | 1.6% |
| Czech | 156 | 0.9% |
| Czechoslovakian | 16 | 0.1% |
| Danish | 60 | 0.4% |
| Dominican | 27 | 0.2% |
| Dutch | 107 | 0.6% |
| Eastern European | 87 | 0.5% |
| Egyptian | 14 | 0.1% |
| English | 1,523 | 8.9% |
| European | 552 | 3.2% |
| Filipino | 21 | 0.1% |
| Finnish | 20 | 0.1% |
| French | 356 | 2.1% |
| French Canadian | 83 | 0.5% |
| German | 1,910 | 11.2% |
| German Russian | 8 | 0.1% |
| Ghanaian | 157 | 0.9% |
| Greek | 18 | 0.1% |
| Guatemalan | 158 | 0.9% |
| Honduran | 29 | 0.2% |
| Indian (Asian) | 164 | 1.0% |
| Indonesian | 11 | 0.1% |
| Iranian | 61 | 0.4% |
| Irish | 1,447 | 8.5% |
| Iroquois | 47 | 0.3% |
| Italian | 766 | 4.5% |
| Jamaican | 15 | 0.1% |
| Kenyan | 70 | 0.4% |
| Korean | 155 | 0.9% |
| Laotian | 12 | 0.1% |
| Lebanese | 27 | 0.2% |
| Lithuanian | 19 | 0.1% |
| Macedonian | 45 | 0.3% |
| Malaysian | 15 | 0.1% |
| Mexican | 2,378 | 14.0% |
| Mexican American Indian | 11 | 0.1% |
| Navajo | 57 | 0.3% |
| Nicaraguan | 21 | 0.1% |
| Nigerian | 202 | 1.2% |
| Norwegian | 185 | 1.1% |
| Pakistani | 20 | 0.1% |
| Panamanian | 22 | 0.1% |
| Peruvian | 75 | 0.4% |
| Polish | 264 | 1.5% |
| Portuguese | 28 | 0.2% |
| Puerto Rican | 122 | 0.7% |
| Romanian | 6 | 0.0% |
| Russian | 48 | 0.3% |
| Salvadoran | 695 | 4.1% |
| Scandinavian | 37 | 0.2% |
| Scotch-Irish | 267 | 1.6% |
| Scottish | 232 | 1.4% |
| Sioux | 11 | 0.1% |
| Slavic | 16 | 0.1% |
| Slovak | 17 | 0.1% |
| Slovene | 97 | 0.6% |
| South African | 62 | 0.4% |
| South American | 602 | 3.5% |
| Spaniard | 57 | 0.3% |
| Spanish | 7 | 0.0% |
| Sri Lankan | 152 | 0.9% |
| Subsaharan African | 572 | 3.4% |
| Swedish | 114 | 0.7% |
| Swiss | 35 | 0.2% |
| Thai | 546 | 3.2% |
| Trinidadian and Tobagonian | 45 | 0.3% |
| Ukrainian | 56 | 0.3% |
| Venezuelan | 426 | 2.5% |
| Welsh | 31 | 0.2% |
| West Indian | 13 | 0.1% | View All 89 Rows |
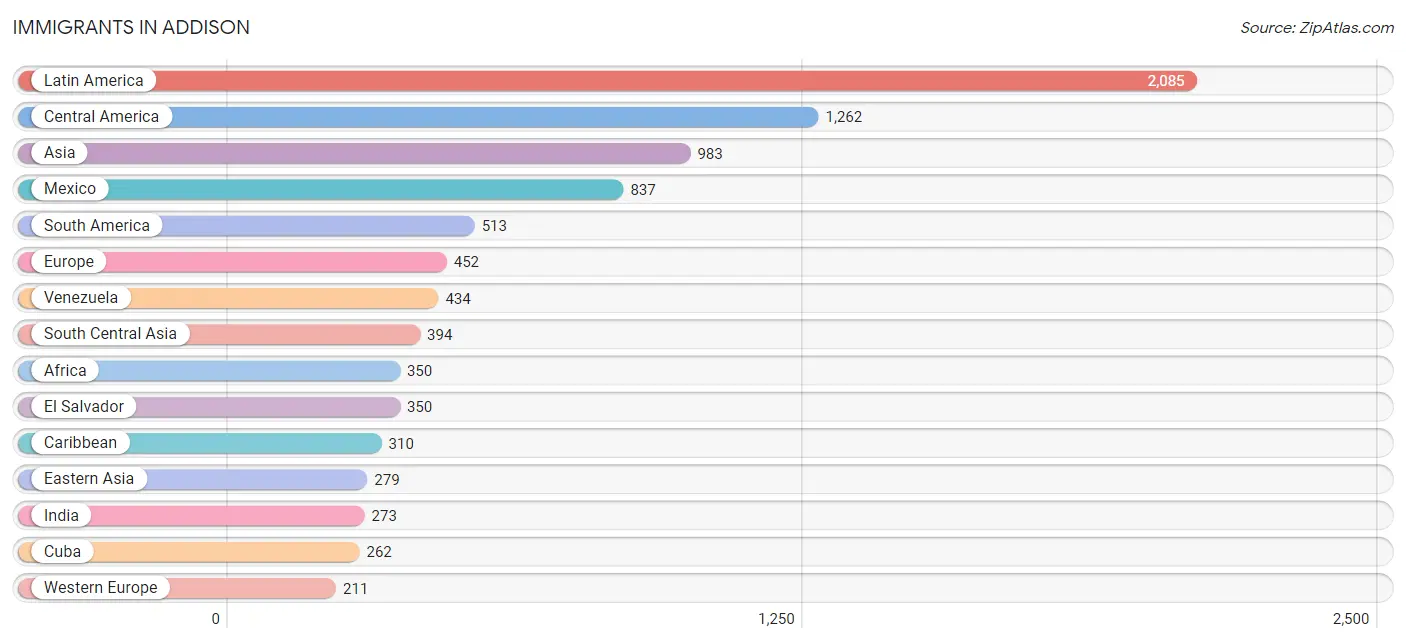
Immigrants in Addison
The most numerous immigrant groups reported in Addison came from Latin America (2,085 | 12.2%), Central America (1,262 | 7.4%), Asia (983 | 5.8%), Mexico (837 | 4.9%), and South America (513 | 3.0%), together accounting for 33.4% of all Addison residents.
| Immigration Origin | # Population | % Population |
| Africa | 350 | 2.1% |
| Albania | 22 | 0.1% |
| Asia | 983 | 5.8% |
| Brazil | 11 | 0.1% |
| Bulgaria | 44 | 0.3% |
| Cambodia | 9 | 0.1% |
| Canada | 72 | 0.4% |
| Caribbean | 310 | 1.8% |
| Central America | 1,262 | 7.4% |
| China | 72 | 0.4% |
| Colombia | 53 | 0.3% |
| Cuba | 262 | 1.5% |
| Denmark | 66 | 0.4% |
| Dominican Republic | 20 | 0.1% |
| Eastern Africa | 160 | 0.9% |
| Eastern Asia | 279 | 1.6% |
| Eastern Europe | 117 | 0.7% |
| El Salvador | 350 | 2.1% |
| England | 23 | 0.1% |
| Europe | 452 | 2.6% |
| France | 182 | 1.1% |
| Germany | 29 | 0.2% |
| Ghana | 26 | 0.2% |
| Guatemala | 34 | 0.2% |
| Honduras | 29 | 0.2% |
| Hong Kong | 22 | 0.1% |
| India | 273 | 1.6% |
| Indonesia | 12 | 0.1% |
| Iran | 36 | 0.2% |
| Israel | 11 | 0.1% |
| Italy | 8 | 0.1% |
| Jamaica | 15 | 0.1% |
| Japan | 59 | 0.4% |
| Kenya | 160 | 0.9% |
| Korea | 148 | 0.9% |
| Latin America | 2,085 | 12.2% |
| Lebanon | 19 | 0.1% |
| Malaysia | 7 | 0.0% |
| Mexico | 837 | 4.9% |
| Nepal | 80 | 0.5% |
| Nicaragua | 12 | 0.1% |
| Nigeria | 75 | 0.4% |
| Northern Europe | 107 | 0.6% |
| Oceania | 20 | 0.1% |
| Peru | 15 | 0.1% |
| Philippines | 49 | 0.3% |
| Russia | 21 | 0.1% |
| Scotland | 6 | 0.0% |
| Sierra Leone | 20 | 0.1% |
| South Africa | 11 | 0.1% |
| South America | 513 | 3.0% |
| South Central Asia | 394 | 2.3% |
| South Eastern Asia | 165 | 1.0% |
| Southern Europe | 17 | 0.1% |
| Spain | 9 | 0.1% |
| Taiwan | 21 | 0.1% |
| Thailand | 20 | 0.1% |
| Ukraine | 7 | 0.0% |
| Uzbekistan | 5 | 0.0% |
| Venezuela | 434 | 2.5% |
| Vietnam | 57 | 0.3% |
| Western Africa | 179 | 1.1% |
| Western Asia | 145 | 0.9% |
| Western Europe | 211 | 1.2% | View All 64 Rows |
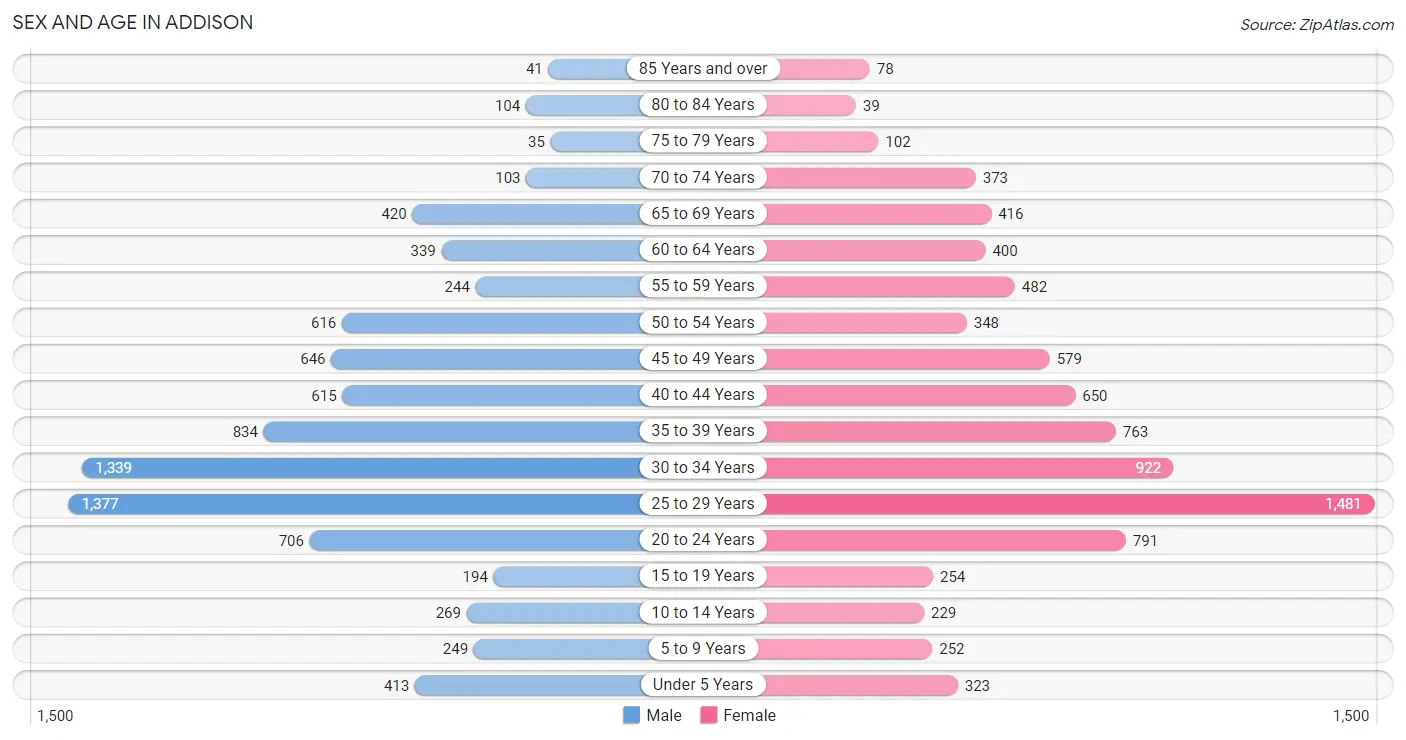
Sex and Age in Addison
Sex and Age in Addison
The most populous age groups in Addison are 25 to 29 Years (1,377 | 16.1%) for men and 25 to 29 Years (1,481 | 17.5%) for women.
| Age Bracket | Male | Female |
| Under 5 Years | 413 (4.8%) | 323 (3.8%) |
| 5 to 9 Years | 249 (2.9%) | 252 (3.0%) |
| 10 to 14 Years | 269 (3.2%) | 229 (2.7%) |
| 15 to 19 Years | 194 (2.3%) | 254 (3.0%) |
| 20 to 24 Years | 706 (8.3%) | 791 (9.3%) |
| 25 to 29 Years | 1,377 (16.1%) | 1,481 (17.5%) |
| 30 to 34 Years | 1,339 (15.7%) | 922 (10.9%) |
| 35 to 39 Years | 834 (9.8%) | 763 (9.0%) |
| 40 to 44 Years | 615 (7.2%) | 650 (7.7%) |
| 45 to 49 Years | 646 (7.6%) | 579 (6.8%) |
| 50 to 54 Years | 616 (7.2%) | 348 (4.1%) |
| 55 to 59 Years | 244 (2.9%) | 482 (5.7%) |
| 60 to 64 Years | 339 (4.0%) | 400 (4.7%) |
| 65 to 69 Years | 420 (4.9%) | 416 (4.9%) |
| 70 to 74 Years | 103 (1.2%) | 373 (4.4%) |
| 75 to 79 Years | 35 (0.4%) | 102 (1.2%) |
| 80 to 84 Years | 104 (1.2%) | 39 (0.5%) |
| 85 Years and over | 41 (0.5%) | 78 (0.9%) |
| Total | 8,544 (100.0%) | 8,482 (100.0%) |
Families and Households in Addison
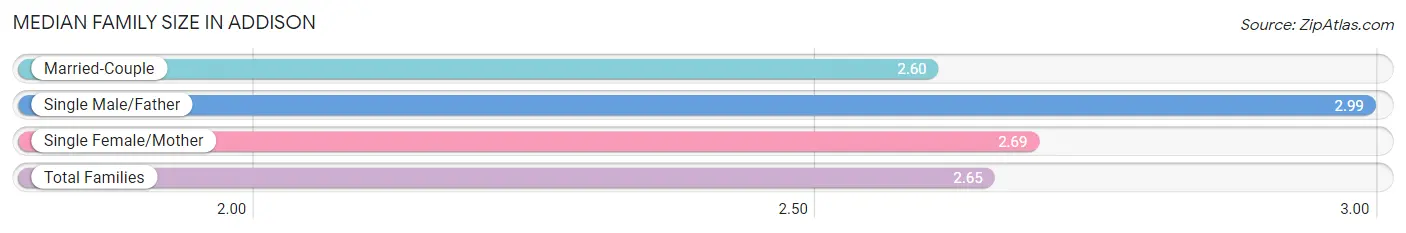
Median Family Size in Addison
The median family size in Addison is 2.65 persons per family, with single male/father families (261 | 7.5%) accounting for the largest median family size of 2.99 persons per family. On the other hand, married-couple families (2,466 | 71.3%) represent the smallest median family size with 2.60 persons per family.
| Family Type | # Families | Family Size |
| Married-Couple | 2,466 (71.3%) | 2.60 |
| Single Male/Father | 261 (7.5%) | 2.99 |
| Single Female/Mother | 730 (21.1%) | 2.69 |
| Total Families | 3,457 (100.0%) | 2.65 |
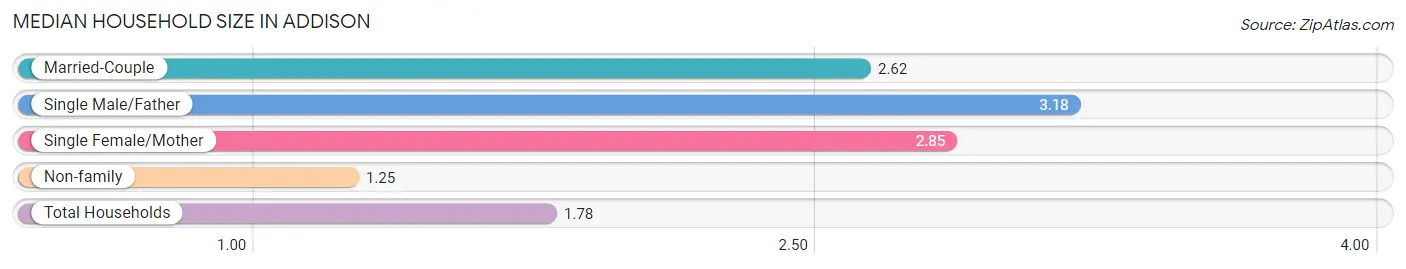
Median Household Size in Addison
The median household size in Addison is 1.78 persons per household, with single male/father households (261 | 2.7%) accounting for the largest median household size of 3.18 persons per household. non-family households (6,104 | 63.8%) represent the smallest median household size with 1.25 persons per household.
| Household Type | # Households | Household Size |
| Married-Couple | 2,466 (25.8%) | 2.62 |
| Single Male/Father | 261 (2.7%) | 3.18 |
| Single Female/Mother | 730 (7.6%) | 2.85 |
| Non-family | 6,104 (63.8%) | 1.25 |
| Total Households | 9,561 (100.0%) | 1.78 |
Household Size by Marriage Status in Addison
Out of a total of 9,561 households in Addison, 3,457 (36.2%) are family households, while 6,104 (63.8%) are nonfamily households. The most numerous type of family households are 2-person households, comprising 1,983, and the most common type of nonfamily households are 1-person households, comprising 4,736.
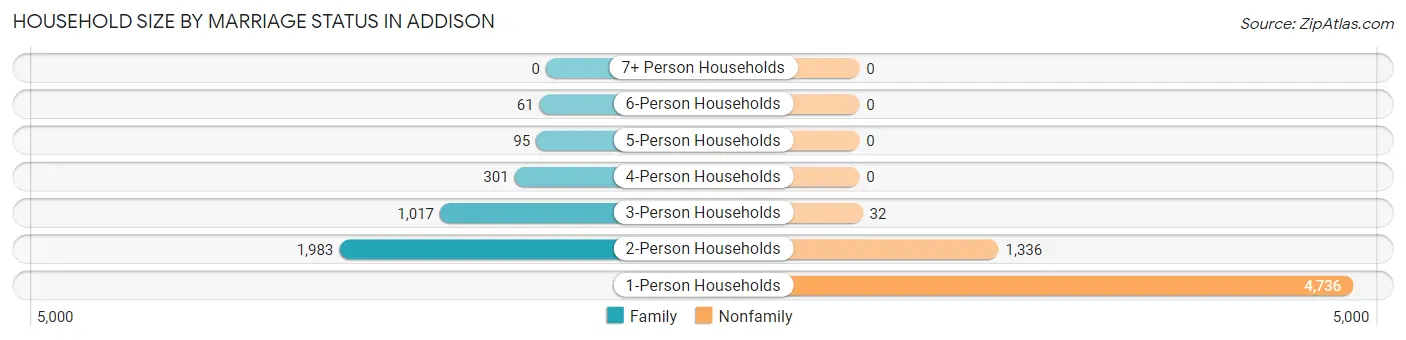
| Household Size | Family Households | Nonfamily Households |
| 1-Person Households | - | 4,736 (49.5%) |
| 2-Person Households | 1,983 (20.7%) | 1,336 (14.0%) |
| 3-Person Households | 1,017 (10.6%) | 32 (0.3%) |
| 4-Person Households | 301 (3.2%) | 0 (0.0%) |
| 5-Person Households | 95 (1.0%) | 0 (0.0%) |
| 6-Person Households | 61 (0.6%) | 0 (0.0%) |
| 7+ Person Households | 0 (0.0%) | 0 (0.0%) |
| Total | 3,457 (36.2%) | 6,104 (63.8%) |
Female Fertility in Addison
Fertility by Age in Addison
Average fertility rate in Addison is 58.0 births per 1,000 women. Women in the age bracket of 20 to 34 years have the highest fertility rate with 73.0 births per 1,000 women. Women in the age bracket of 20 to 34 years acount for 73.4% of all women with births.
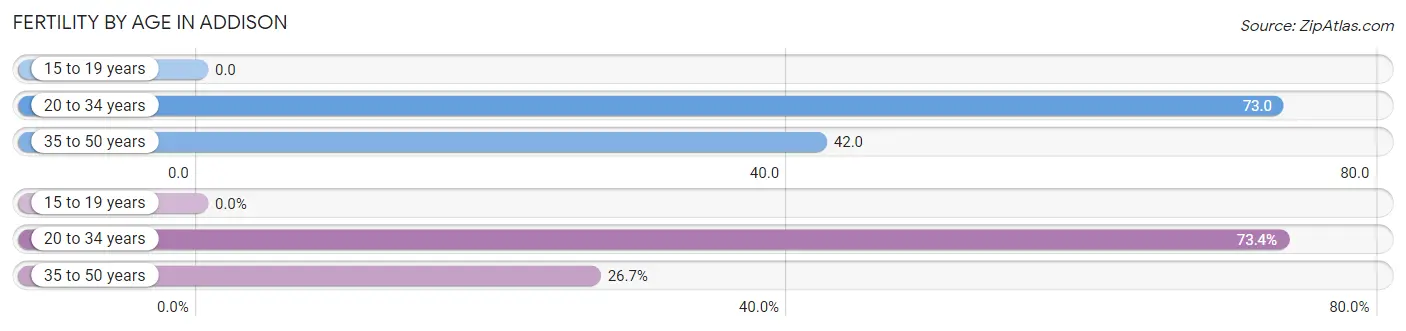
| Age Bracket | Women with Births | Births / 1,000 Women |
| 15 to 19 years | 0 (0.0%) | 0.0 |
| 20 to 34 years | 234 (73.4%) | 73.0 |
| 35 to 50 years | 85 (26.7%) | 42.0 |
| Total | 319 (100.0%) | 58.0 |
Fertility by Age by Marriage Status in Addison
86.8% of women with births (319) in Addison are married. The highest percentage of unmarried women with births falls into 20 to 34 years age bracket with 17.9% of them unmarried at the time of birth, while the lowest percentage of unmarried women with births belong to 35 to 50 years age bracket with 0.0% of them unmarried.
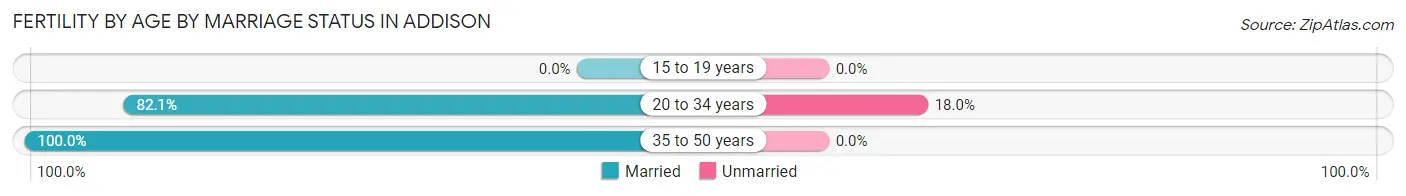
| Age Bracket | Married | Unmarried |
| 15 to 19 years | 0 (0.0%) | 0 (0.0%) |
| 20 to 34 years | 192 (82.1%) | 42 (17.9%) |
| 35 to 50 years | 85 (100.0%) | 0 (0.0%) |
| Total | 277 (86.8%) | 42 (13.2%) |
Fertility by Education in Addison
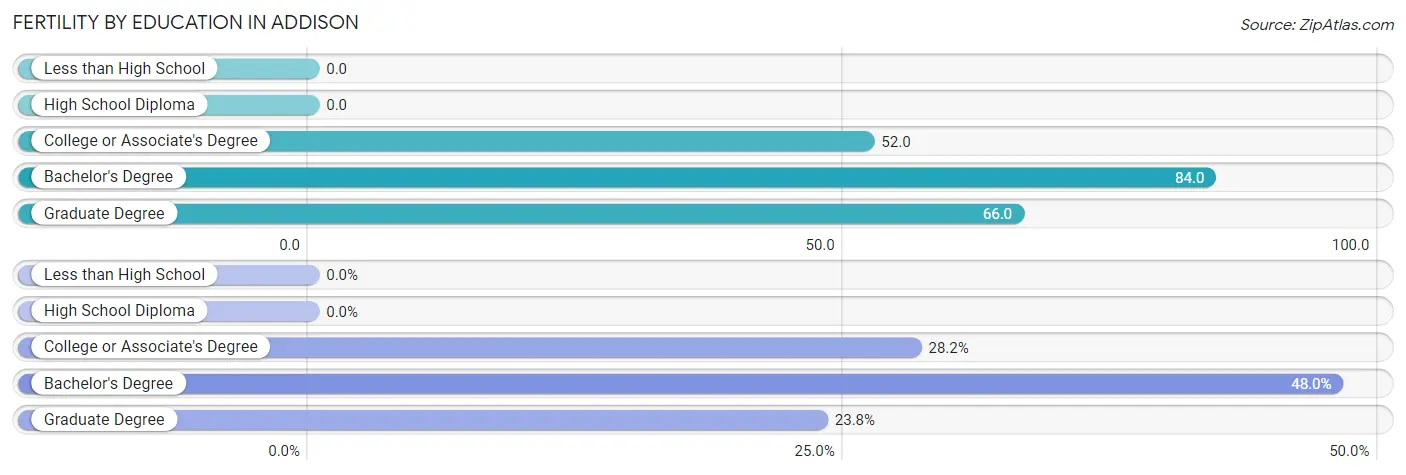
| Educational Attainment | Women with Births | Births / 1,000 Women |
| Less than High School | 0 (0.0%) | 0.0 |
| High School Diploma | 0 (0.0%) | 0.0 |
| College or Associate's Degree | 90 (28.2%) | 52.0 |
| Bachelor's Degree | 153 (48.0%) | 84.0 |
| Graduate Degree | 76 (23.8%) | 66.0 |
| Total | 319 (100.0%) | 58.0 |
Fertility by Education by Marriage Status in Addison
13.2% of women with births in Addison are unmarried. Women with the educational attainment of graduate degree are most likely to be married with 100.0% of them married at childbirth, while women with the educational attainment of college or associate's degree are least likely to be married with 18.9% of them unmarried at childbirth.
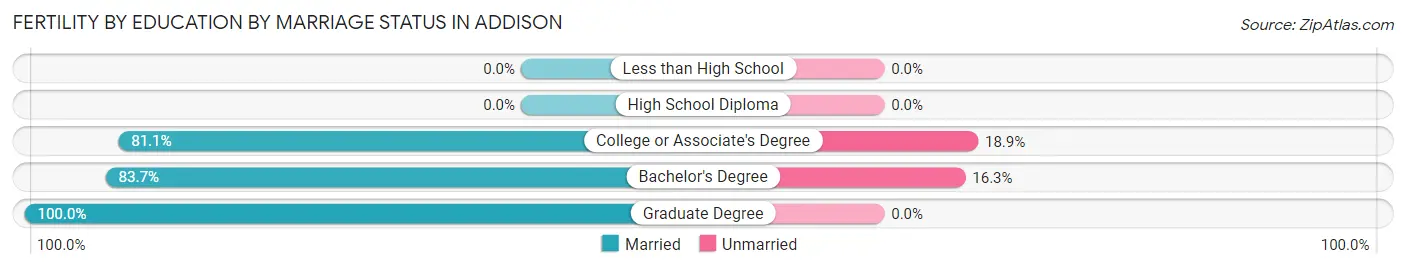
| Educational Attainment | Married | Unmarried |
| Less than High School | 0 (0.0%) | 0 (0.0%) |
| High School Diploma | 0 (0.0%) | 0 (0.0%) |
| College or Associate's Degree | 73 (81.1%) | 17 (18.9%) |
| Bachelor's Degree | 128 (83.7%) | 25 (16.3%) |
| Graduate Degree | 76 (100.0%) | 0 (0.0%) |
| Total | 277 (86.8%) | 42 (13.2%) |
Employment Characteristics in Addison
Employment by Class of Employer in Addison
Among the 11,773 employed individuals in Addison, private company employees (9,306 | 79.0%), self-employed (not incorporated) (795 | 6.8%), and self-employed (incorporated) (521 | 4.4%) make up the most common classes of employment.
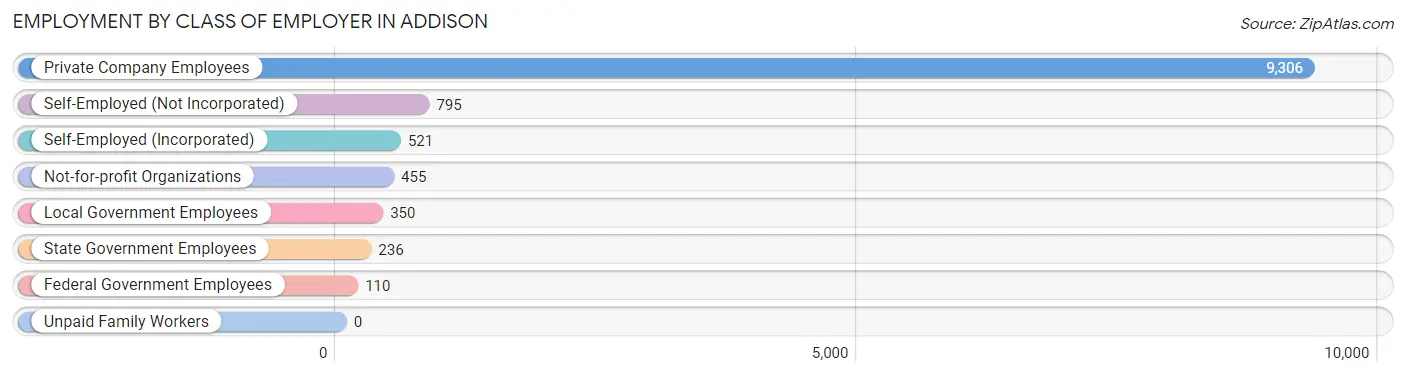
| Employer Class | # Employees | % Employees |
| Private Company Employees | 9,306 | 79.0% |
| Self-Employed (Incorporated) | 521 | 4.4% |
| Self-Employed (Not Incorporated) | 795 | 6.8% |
| Not-for-profit Organizations | 455 | 3.9% |
| Local Government Employees | 350 | 3.0% |
| State Government Employees | 236 | 2.0% |
| Federal Government Employees | 110 | 0.9% |
| Unpaid Family Workers | 0 | 0.0% |
| Total | 11,773 | 100.0% |
Employment Status by Age in Addison
According to the labor force statistics for Addison, out of the total population over 16 years of age (15,231), 80.9% or 12,322 individuals are in the labor force, with 3.3% or 407 of them unemployed. The age group with the highest labor force participation rate is 25 to 29 years, with 97.2% or 2,778 individuals in the labor force. Within the labor force, the 20 to 24 years age range has the highest percentage of unemployed individuals, with 6.8% or 89 of them being unemployed.
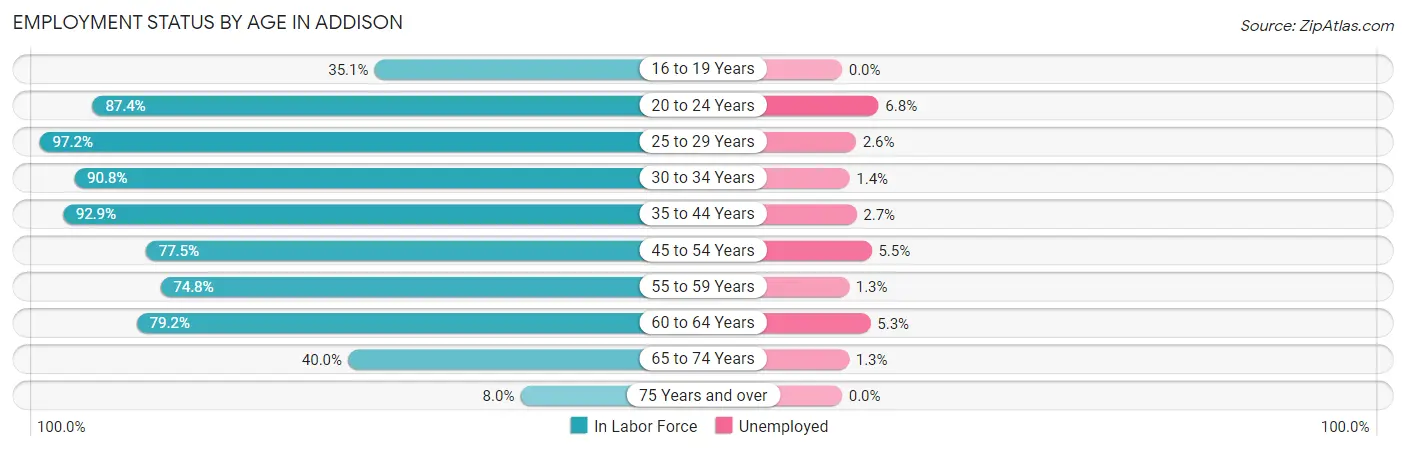
| Age Bracket | In Labor Force | Unemployed |
| 16 to 19 Years | 136 (35.1%) | 0 (0.0%) |
| 20 to 24 Years | 1,308 (87.4%) | 89 (6.8%) |
| 25 to 29 Years | 2,778 (97.2%) | 72 (2.6%) |
| 30 to 34 Years | 2,053 (90.8%) | 29 (1.4%) |
| 35 to 44 Years | 2,659 (92.9%) | 72 (2.7%) |
| 45 to 54 Years | 1,696 (77.5%) | 93 (5.5%) |
| 55 to 59 Years | 543 (74.8%) | 7 (1.3%) |
| 60 to 64 Years | 585 (79.2%) | 31 (5.3%) |
| 65 to 74 Years | 525 (40.0%) | 7 (1.3%) |
| 75 Years and over | 32 (8.0%) | 0 (0.0%) |
| Total | 12,322 (80.9%) | 407 (3.3%) |
Employment Status by Educational Attainment in Addison
According to labor force statistics for Addison, 88.7% of individuals (10,320) out of the total population between 25 and 64 years of age (11,635) are in the labor force, with 3.0% or 310 of them being unemployed. The group with the highest labor force participation rate are those with the educational attainment of bachelor's degree or higher, with 91.6% or 6,180 individuals in the labor force. Within the labor force, individuals with less than high school education have the highest percentage of unemployment, with 11.6% or 42 of them being unemployed.
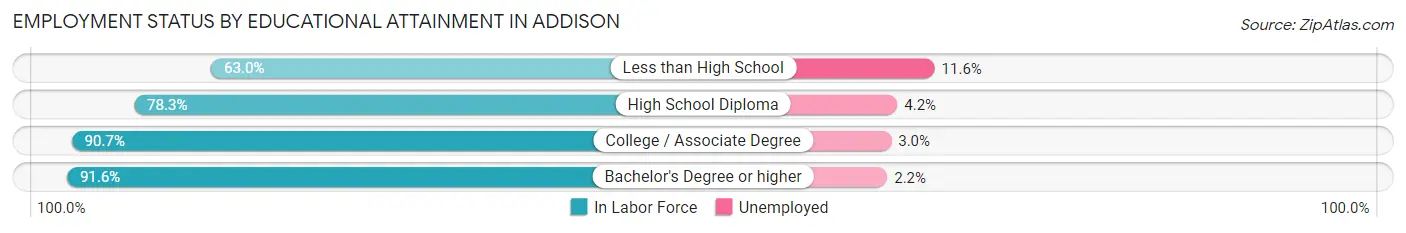
| Educational Attainment | In Labor Force | Unemployed |
| Less than High School | 362 (63.0%) | 67 (11.6%) |
| High School Diploma | 882 (78.3%) | 47 (4.2%) |
| College / Associate Degree | 2,890 (90.7%) | 96 (3.0%) |
| Bachelor's Degree or higher | 6,180 (91.6%) | 148 (2.2%) |
| Total | 10,320 (88.7%) | 349 (3.0%) |
Employment Occupations by Sex in Addison
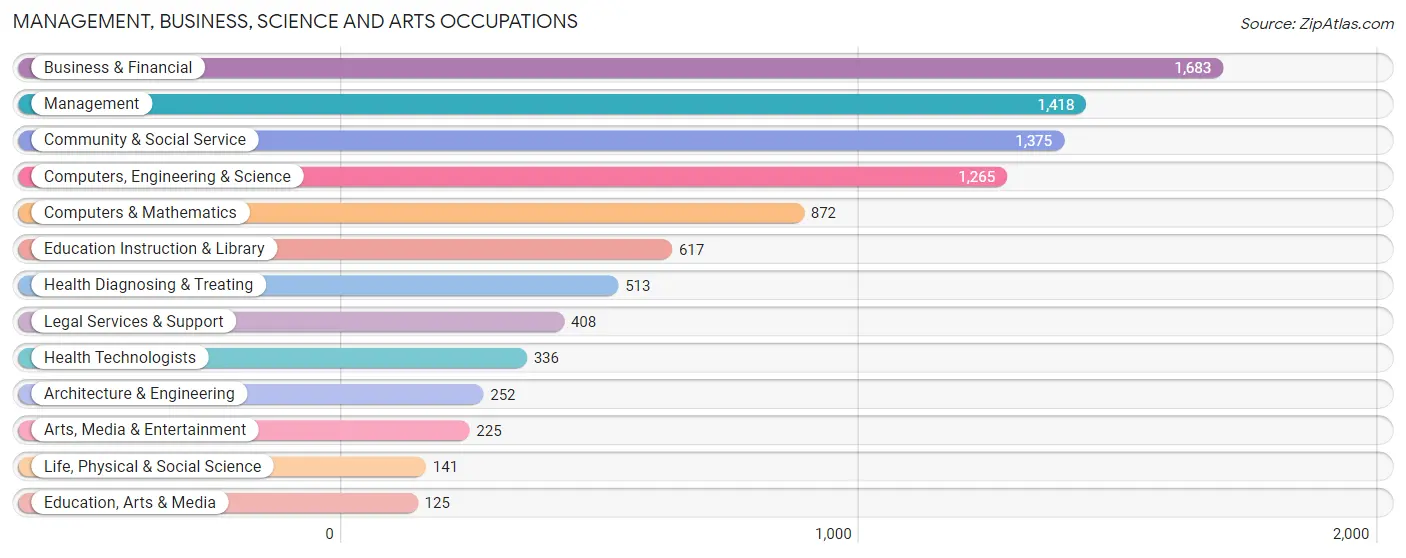
Management, Business, Science and Arts Occupations
The most common Management, Business, Science and Arts occupations in Addison are Business & Financial (1,683 | 14.2%), Management (1,418 | 11.9%), Community & Social Service (1,375 | 11.6%), Computers, Engineering & Science (1,265 | 10.6%), and Computers & Mathematics (872 | 7.3%).
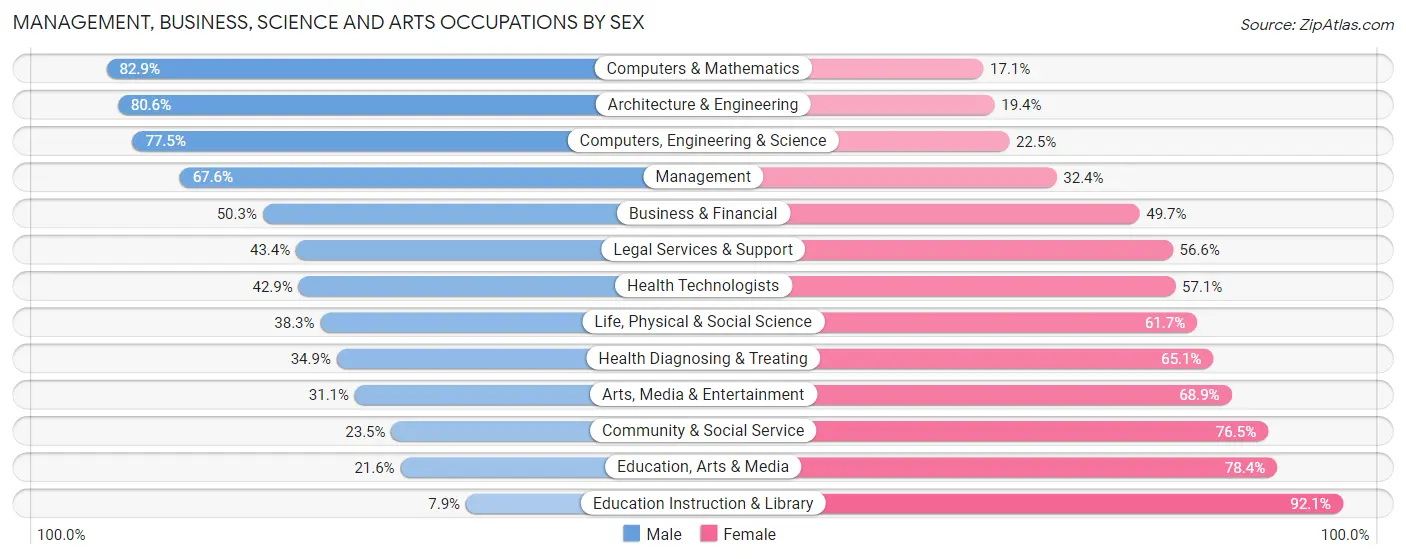
Management, Business, Science and Arts Occupations by Sex
Within the Management, Business, Science and Arts occupations in Addison, the most male-oriented occupations are Computers & Mathematics (82.9%), Architecture & Engineering (80.6%), and Computers, Engineering & Science (77.5%), while the most female-oriented occupations are Education Instruction & Library (92.1%), Education, Arts & Media (78.4%), and Community & Social Service (76.5%).
| Occupation | Male | Female |
| Management | 959 (67.6%) | 459 (32.4%) |
| Business & Financial | 847 (50.3%) | 836 (49.7%) |
| Computers, Engineering & Science | 980 (77.5%) | 285 (22.5%) |
| Computers & Mathematics | 723 (82.9%) | 149 (17.1%) |
| Architecture & Engineering | 203 (80.6%) | 49 (19.4%) |
| Life, Physical & Social Science | 54 (38.3%) | 87 (61.7%) |
| Community & Social Service | 323 (23.5%) | 1,052 (76.5%) |
| Education, Arts & Media | 27 (21.6%) | 98 (78.4%) |
| Legal Services & Support | 177 (43.4%) | 231 (56.6%) |
| Education Instruction & Library | 49 (7.9%) | 568 (92.1%) |
| Arts, Media & Entertainment | 70 (31.1%) | 155 (68.9%) |
| Health Diagnosing & Treating | 179 (34.9%) | 334 (65.1%) |
| Health Technologists | 144 (42.9%) | 192 (57.1%) |
| Total (Category) | 3,288 (52.6%) | 2,966 (47.4%) |
| Total (Overall) | 6,087 (51.2%) | 5,792 (48.8%) |
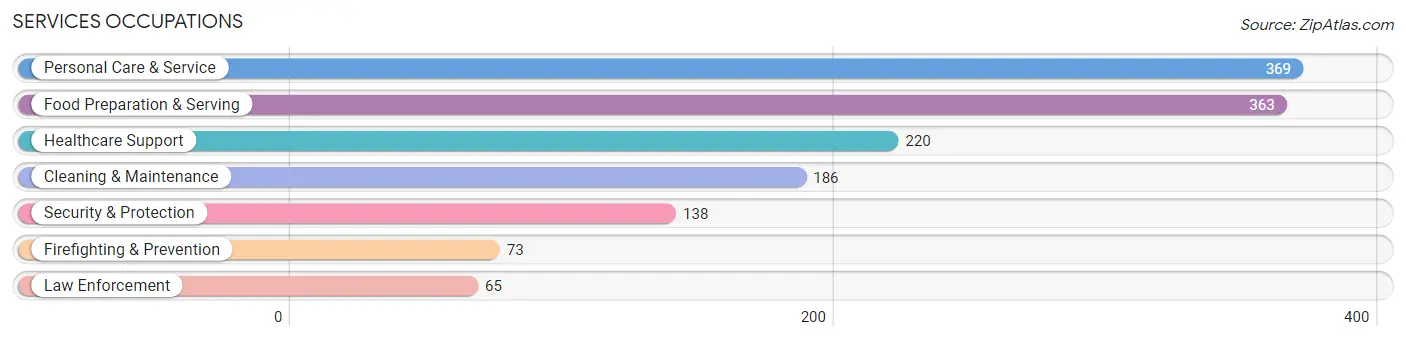
Services Occupations
The most common Services occupations in Addison are Personal Care & Service (369 | 3.1%), Food Preparation & Serving (363 | 3.1%), Healthcare Support (220 | 1.8%), Cleaning & Maintenance (186 | 1.6%), and Security & Protection (138 | 1.2%).
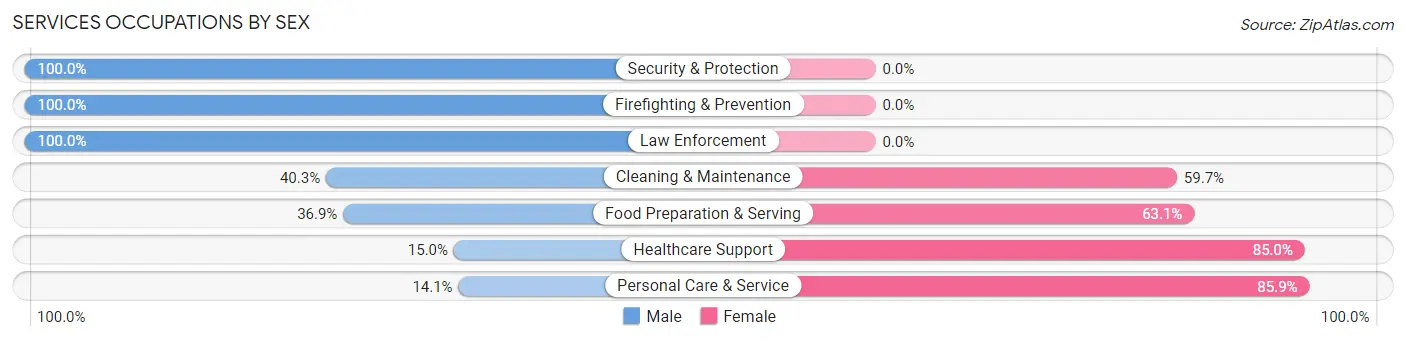
Services Occupations by Sex
Within the Services occupations in Addison, the most male-oriented occupations are Security & Protection (100.0%), Firefighting & Prevention (100.0%), and Law Enforcement (100.0%), while the most female-oriented occupations are Personal Care & Service (85.9%), Healthcare Support (85.0%), and Food Preparation & Serving (63.1%).
| Occupation | Male | Female |
| Healthcare Support | 33 (15.0%) | 187 (85.0%) |
| Security & Protection | 138 (100.0%) | 0 (0.0%) |
| Firefighting & Prevention | 73 (100.0%) | 0 (0.0%) |
| Law Enforcement | 65 (100.0%) | 0 (0.0%) |
| Food Preparation & Serving | 134 (36.9%) | 229 (63.1%) |
| Cleaning & Maintenance | 75 (40.3%) | 111 (59.7%) |
| Personal Care & Service | 52 (14.1%) | 317 (85.9%) |
| Total (Category) | 432 (33.9%) | 844 (66.1%) |
| Total (Overall) | 6,087 (51.2%) | 5,792 (48.8%) |
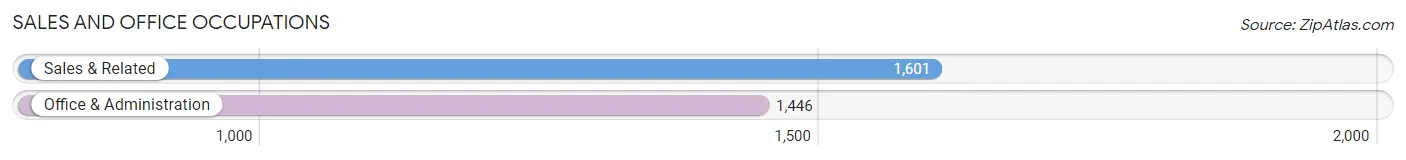
Sales and Office Occupations
The most common Sales and Office occupations in Addison are Sales & Related (1,601 | 13.5%), and Office & Administration (1,446 | 12.2%).
Sales and Office Occupations by Sex
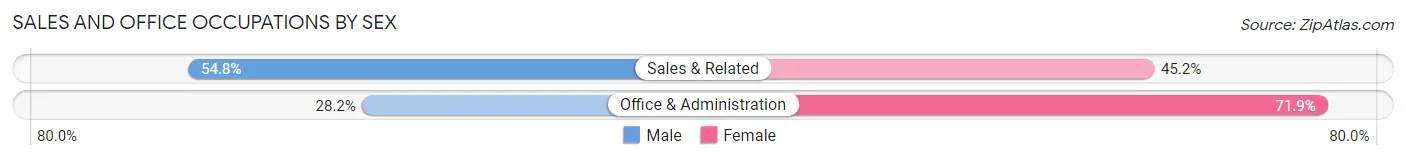
| Occupation | Male | Female |
| Sales & Related | 878 (54.8%) | 723 (45.2%) |
| Office & Administration | 407 (28.1%) | 1,039 (71.9%) |
| Total (Category) | 1,285 (42.2%) | 1,762 (57.8%) |
| Total (Overall) | 6,087 (51.2%) | 5,792 (48.8%) |
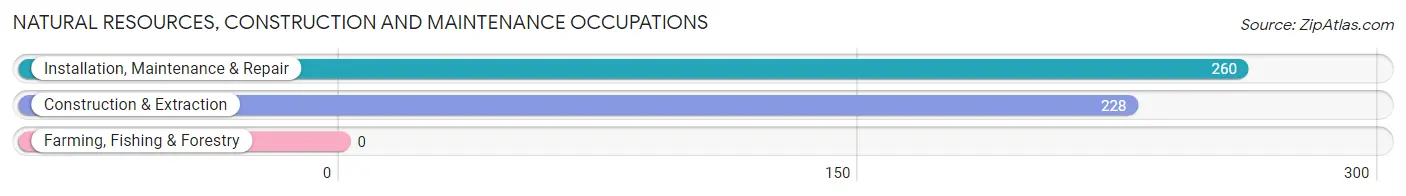
Natural Resources, Construction and Maintenance Occupations
The most common Natural Resources, Construction and Maintenance occupations in Addison are Installation, Maintenance & Repair (260 | 2.2%), and Construction & Extraction (228 | 1.9%).
Natural Resources, Construction and Maintenance Occupations by Sex
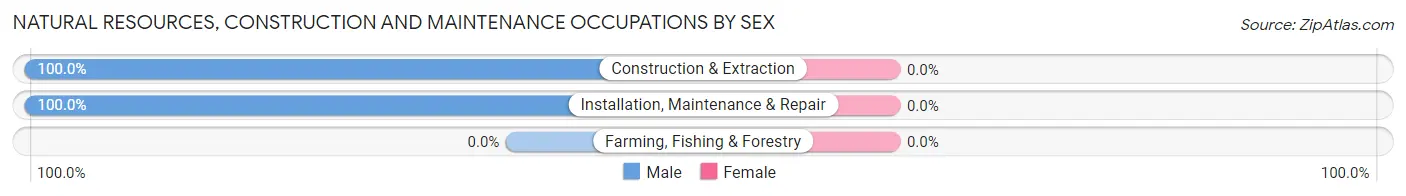
| Occupation | Male | Female |
| Farming, Fishing & Forestry | 0 (0.0%) | 0 (0.0%) |
| Construction & Extraction | 228 (100.0%) | 0 (0.0%) |
| Installation, Maintenance & Repair | 260 (100.0%) | 0 (0.0%) |
| Total (Category) | 488 (100.0%) | 0 (0.0%) |
| Total (Overall) | 6,087 (51.2%) | 5,792 (48.8%) |
Production, Transportation and Moving Occupations
The most common Production, Transportation and Moving occupations in Addison are Transportation (410 | 3.5%), Production (270 | 2.3%), and Material Moving (134 | 1.1%).
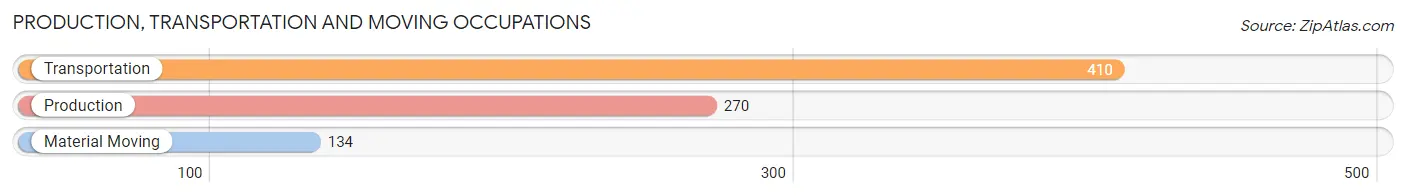
Production, Transportation and Moving Occupations by Sex
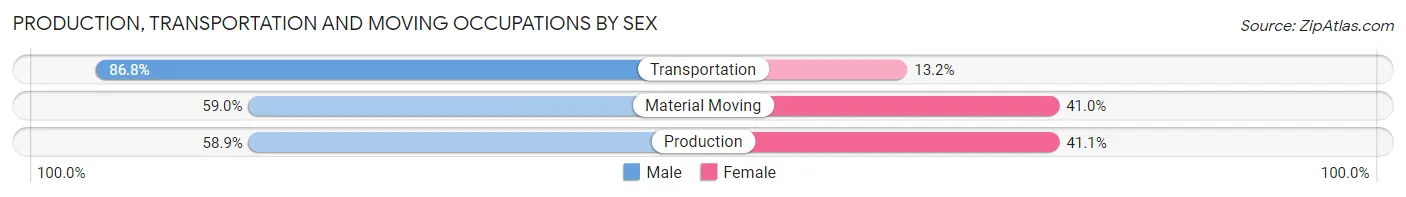
| Occupation | Male | Female |
| Production | 159 (58.9%) | 111 (41.1%) |
| Transportation | 356 (86.8%) | 54 (13.2%) |
| Material Moving | 79 (59.0%) | 55 (41.0%) |
| Total (Category) | 594 (73.0%) | 220 (27.0%) |
| Total (Overall) | 6,087 (51.2%) | 5,792 (48.8%) |
Employment Industries by Sex in Addison
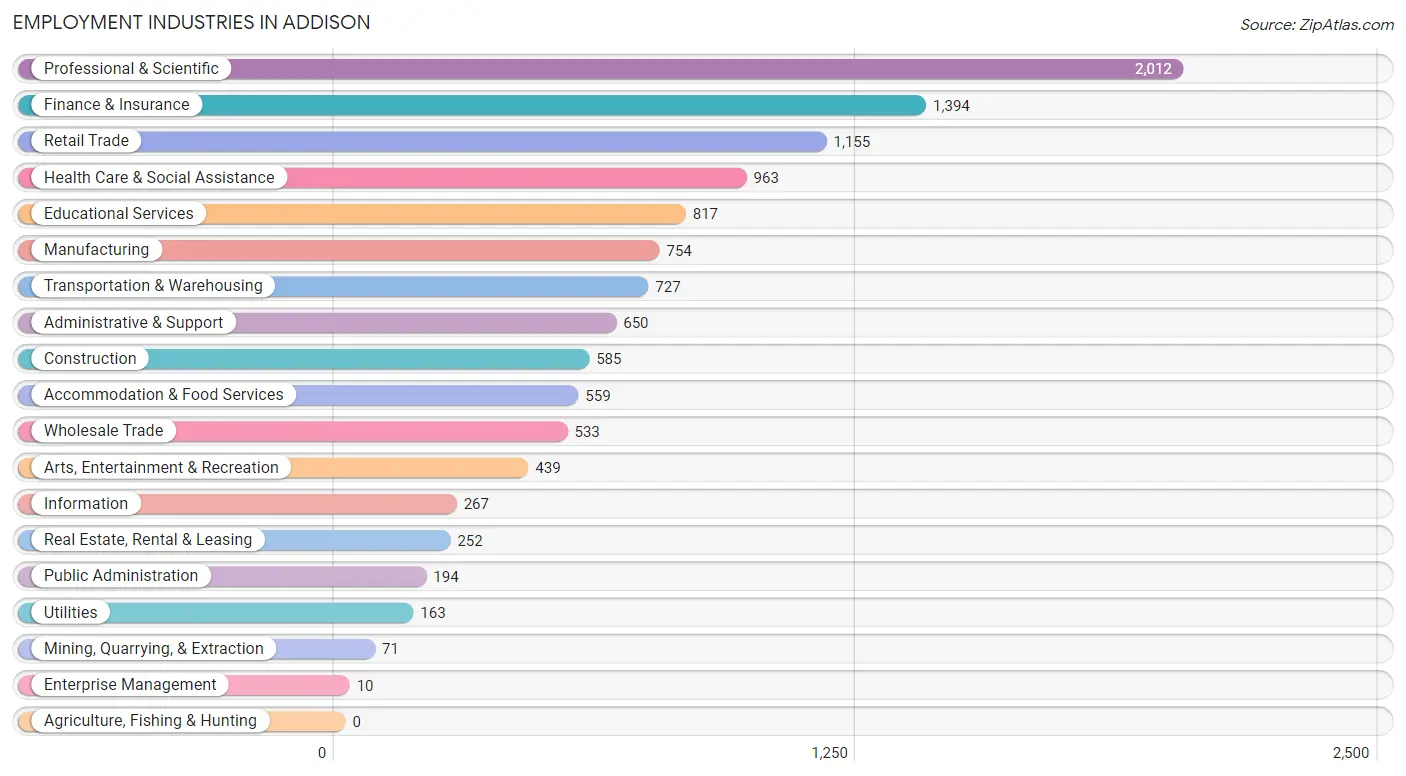
Employment Industries in Addison
The major employment industries in Addison include Professional & Scientific (2,012 | 16.9%), Finance & Insurance (1,394 | 11.7%), Retail Trade (1,155 | 9.7%), Health Care & Social Assistance (963 | 8.1%), and Educational Services (817 | 6.9%).
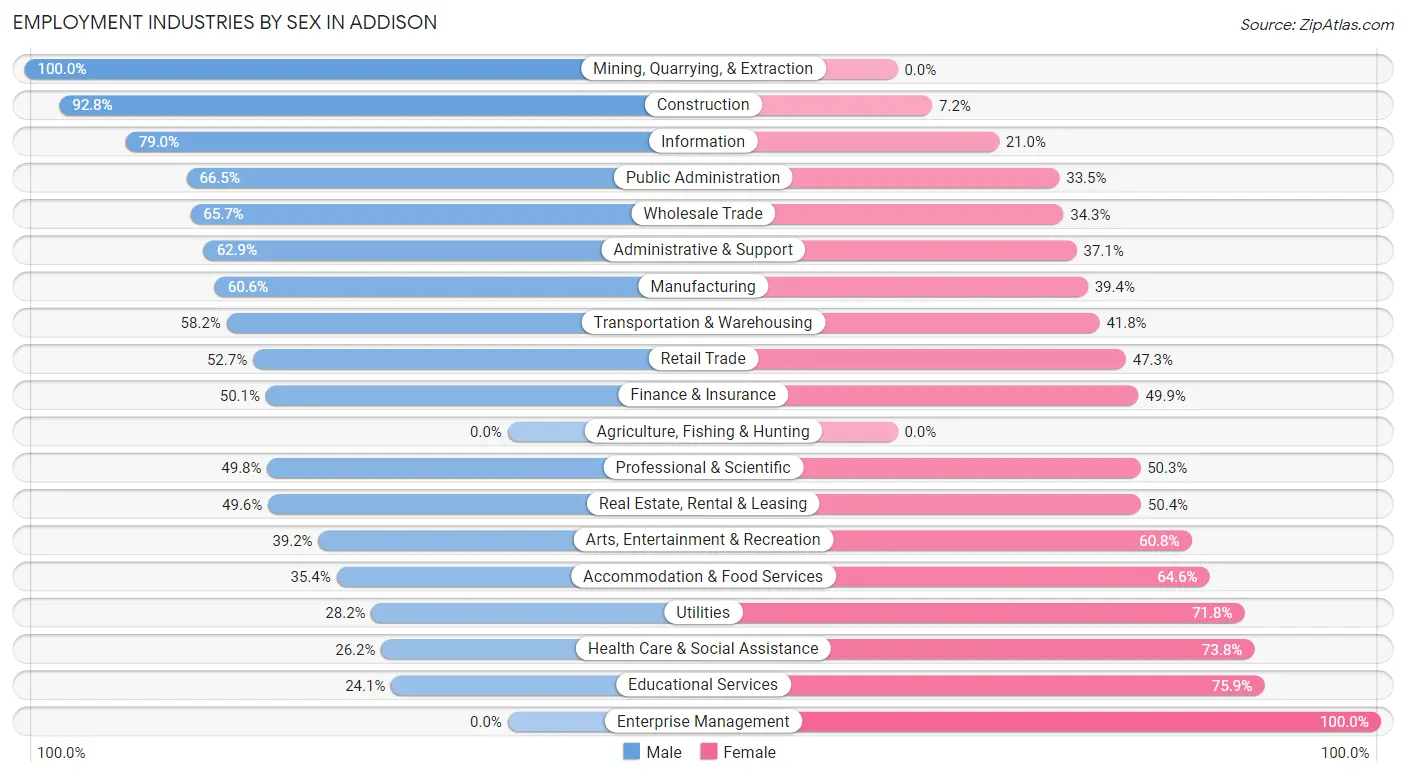
Employment Industries by Sex in Addison
The Addison industries that see more men than women are Mining, Quarrying, & Extraction (100.0%), Construction (92.8%), and Information (79.0%), whereas the industries that tend to have a higher number of women are Enterprise Management (100.0%), Educational Services (75.9%), and Health Care & Social Assistance (73.8%).
| Industry | Male | Female |
| Agriculture, Fishing & Hunting | 0 (0.0%) | 0 (0.0%) |
| Mining, Quarrying, & Extraction | 71 (100.0%) | 0 (0.0%) |
| Construction | 543 (92.8%) | 42 (7.2%) |
| Manufacturing | 457 (60.6%) | 297 (39.4%) |
| Wholesale Trade | 350 (65.7%) | 183 (34.3%) |
| Retail Trade | 609 (52.7%) | 546 (47.3%) |
| Transportation & Warehousing | 423 (58.2%) | 304 (41.8%) |
| Utilities | 46 (28.2%) | 117 (71.8%) |
| Information | 211 (79.0%) | 56 (21.0%) |
| Finance & Insurance | 698 (50.1%) | 696 (49.9%) |
| Real Estate, Rental & Leasing | 125 (49.6%) | 127 (50.4%) |
| Professional & Scientific | 1,001 (49.7%) | 1,011 (50.2%) |
| Enterprise Management | 0 (0.0%) | 10 (100.0%) |
| Administrative & Support | 409 (62.9%) | 241 (37.1%) |
| Educational Services | 197 (24.1%) | 620 (75.9%) |
| Health Care & Social Assistance | 252 (26.2%) | 711 (73.8%) |
| Arts, Entertainment & Recreation | 172 (39.2%) | 267 (60.8%) |
| Accommodation & Food Services | 198 (35.4%) | 361 (64.6%) |
| Public Administration | 129 (66.5%) | 65 (33.5%) |
| Total | 6,087 (51.2%) | 5,792 (48.8%) |
Education in Addison
School Enrollment in Addison
The most common levels of schooling among the 2,520 students in Addison are college / undergraduate (787 | 31.2%), middle school (434 | 17.2%), and graduate / professional (395 | 15.7%).

| School Level | # Students | % Students |
| Nursery / Preschool | 94 | 3.7% |
| Kindergarten | 213 | 8.5% |
| Elementary School | 240 | 9.5% |
| Middle School | 434 | 17.2% |
| High School | 357 | 14.2% |
| College / Undergraduate | 787 | 31.2% |
| Graduate / Professional | 395 | 15.7% |
| Total | 2,520 | 100.0% |
School Enrollment by Age by Funding Source in Addison
Out of a total of 2,520 students who are enrolled in schools in Addison, 517 (20.5%) attend a private institution, while the remaining 2,003 (79.5%) are enrolled in public schools. The age group of 25 to 34 year olds has the highest likelihood of being enrolled in private schools, with 223 (40.5% in the age bracket) enrolled. Conversely, the age group of 15 to 17 year olds has the lowest likelihood of being enrolled in a private school, with 218 (100.0% in the age bracket) attending a public institution.
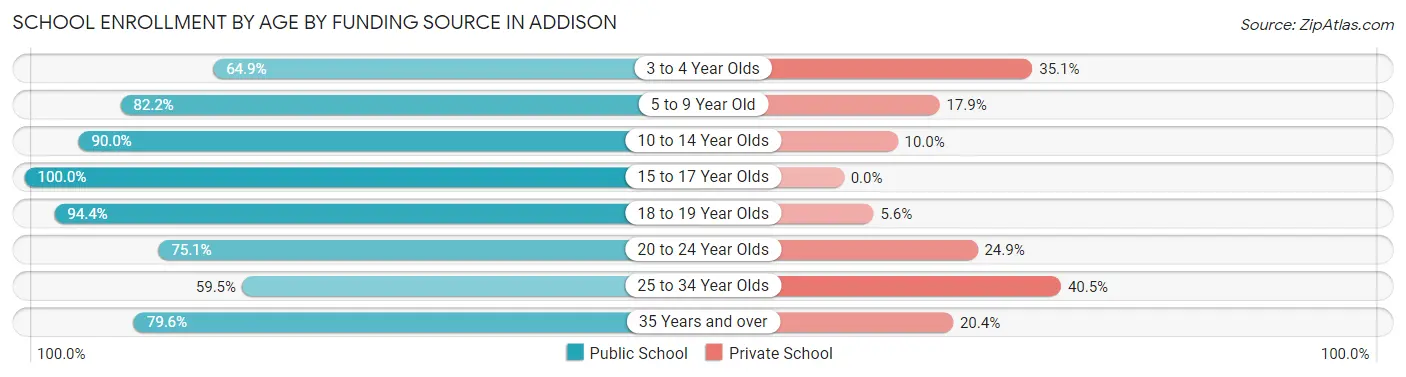
| Age Bracket | Public School | Private School |
| 3 to 4 Year Olds | 24 (64.9%) | 13 (35.1%) |
| 5 to 9 Year Old | 405 (82.2%) | 88 (17.8%) |
| 10 to 14 Year Olds | 448 (90.0%) | 50 (10.0%) |
| 15 to 17 Year Olds | 218 (100.0%) | 0 (0.0%) |
| 18 to 19 Year Olds | 119 (94.4%) | 7 (5.6%) |
| 20 to 24 Year Olds | 238 (75.1%) | 79 (24.9%) |
| 25 to 34 Year Olds | 328 (59.5%) | 223 (40.5%) |
| 35 Years and over | 223 (79.6%) | 57 (20.4%) |
| Total | 2,003 (79.5%) | 517 (20.5%) |
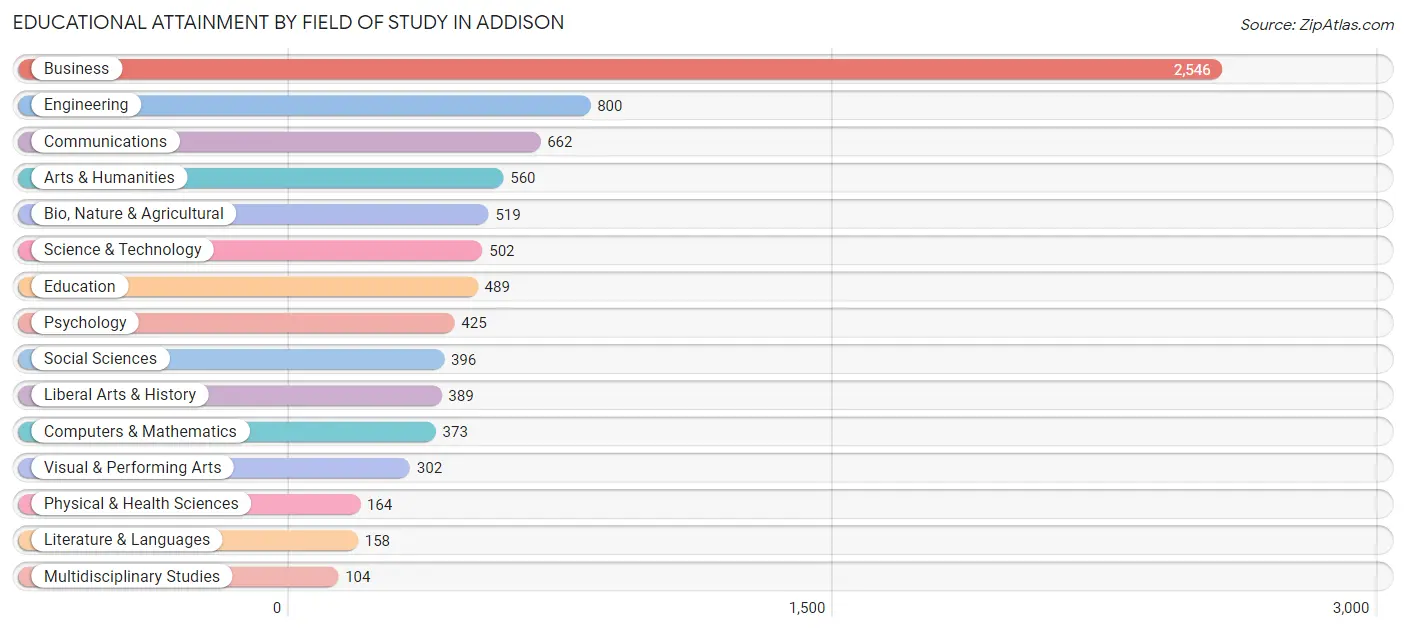
Educational Attainment by Field of Study in Addison
Business (2,546 | 30.3%), engineering (800 | 9.5%), communications (662 | 7.9%), arts & humanities (560 | 6.7%), and bio, nature & agricultural (519 | 6.2%) are the most common fields of study among 8,389 individuals in Addison who have obtained a bachelor's degree or higher.
| Field of Study | # Graduates | % Graduates |
| Computers & Mathematics | 373 | 4.4% |
| Bio, Nature & Agricultural | 519 | 6.2% |
| Physical & Health Sciences | 164 | 1.9% |
| Psychology | 425 | 5.1% |
| Social Sciences | 396 | 4.7% |
| Engineering | 800 | 9.5% |
| Multidisciplinary Studies | 104 | 1.2% |
| Science & Technology | 502 | 6.0% |
| Business | 2,546 | 30.3% |
| Education | 489 | 5.8% |
| Literature & Languages | 158 | 1.9% |
| Liberal Arts & History | 389 | 4.6% |
| Visual & Performing Arts | 302 | 3.6% |
| Communications | 662 | 7.9% |
| Arts & Humanities | 560 | 6.7% |
| Total | 8,389 | 100.0% |
Transportation & Commute in Addison
Vehicle Availability by Sex in Addison
The most prevalent vehicle ownership categories in Addison are males with 2 vehicles (2,841, accounting for 46.5%) and females with 2 vehicles (2,309, making up 50.2%).
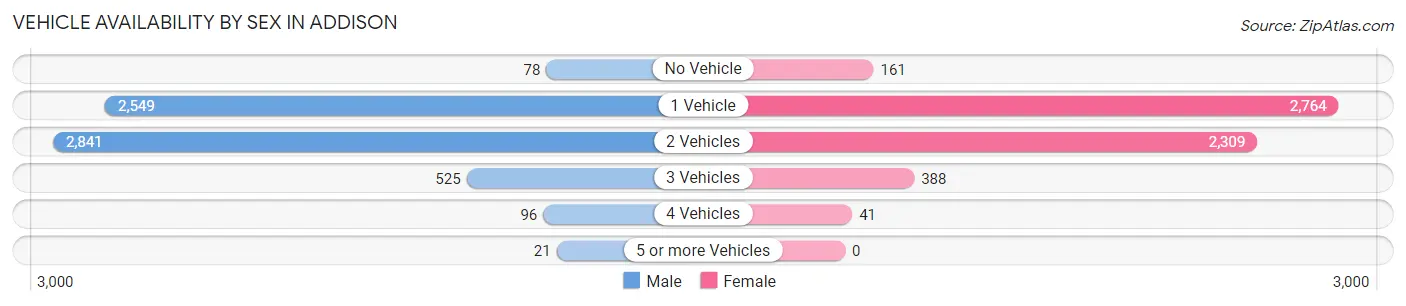
| Vehicles Available | Male | Female |
| No Vehicle | 78 (1.3%) | 161 (2.8%) |
| 1 Vehicle | 2,549 (41.7%) | 2,764 (48.8%) |
| 2 Vehicles | 2,841 (46.5%) | 2,309 (40.8%) |
| 3 Vehicles | 525 (8.6%) | 388 (6.9%) |
| 4 Vehicles | 96 (1.6%) | 41 (0.7%) |
| 5 or more Vehicles | 21 (0.3%) | 0 (0.0%) |
| Total | 6,110 (100.0%) | 5,663 (100.0%) |
Commute Time in Addison
The most frequently occuring commute durations in Addison are 30 to 34 minutes (1,890 commuters, 19.1%), 20 to 24 minutes (1,796 commuters, 18.1%), and 15 to 19 minutes (1,717 commuters, 17.4%).
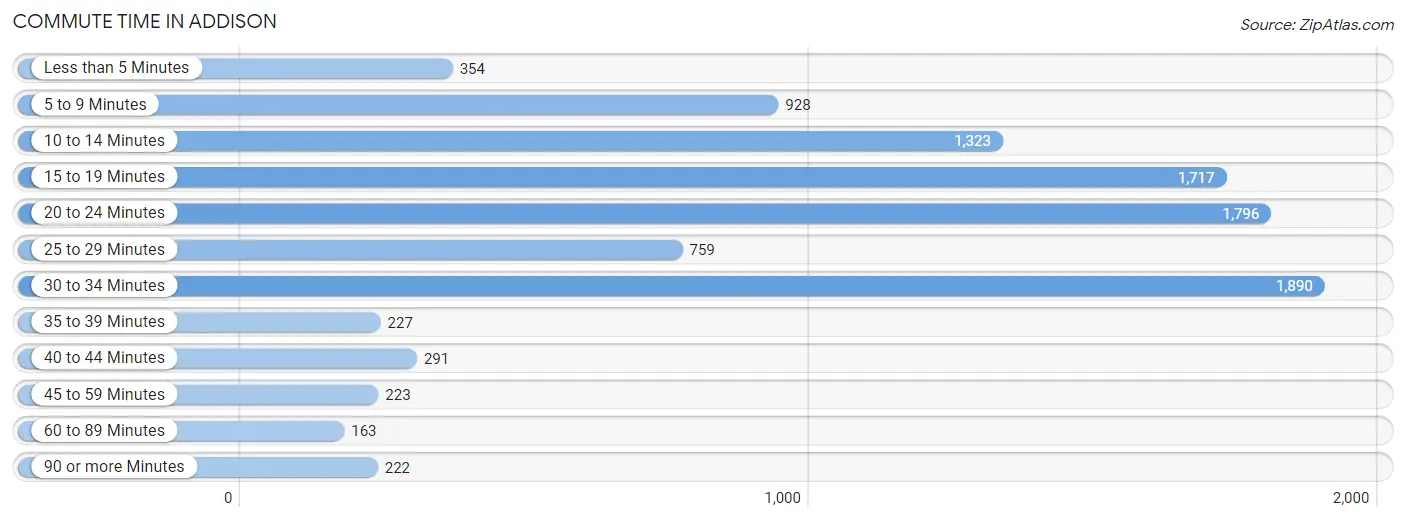
| Commute Time | # Commuters | % Commuters |
| Less than 5 Minutes | 354 | 3.6% |
| 5 to 9 Minutes | 928 | 9.4% |
| 10 to 14 Minutes | 1,323 | 13.4% |
| 15 to 19 Minutes | 1,717 | 17.4% |
| 20 to 24 Minutes | 1,796 | 18.1% |
| 25 to 29 Minutes | 759 | 7.7% |
| 30 to 34 Minutes | 1,890 | 19.1% |
| 35 to 39 Minutes | 227 | 2.3% |
| 40 to 44 Minutes | 291 | 2.9% |
| 45 to 59 Minutes | 223 | 2.2% |
| 60 to 89 Minutes | 163 | 1.7% |
| 90 or more Minutes | 222 | 2.2% |
Commute Time by Sex in Addison
The most common commute times in Addison are 30 to 34 minutes (998 commuters, 19.4%) for males and 20 to 24 minutes (894 commuters, 18.8%) for females.
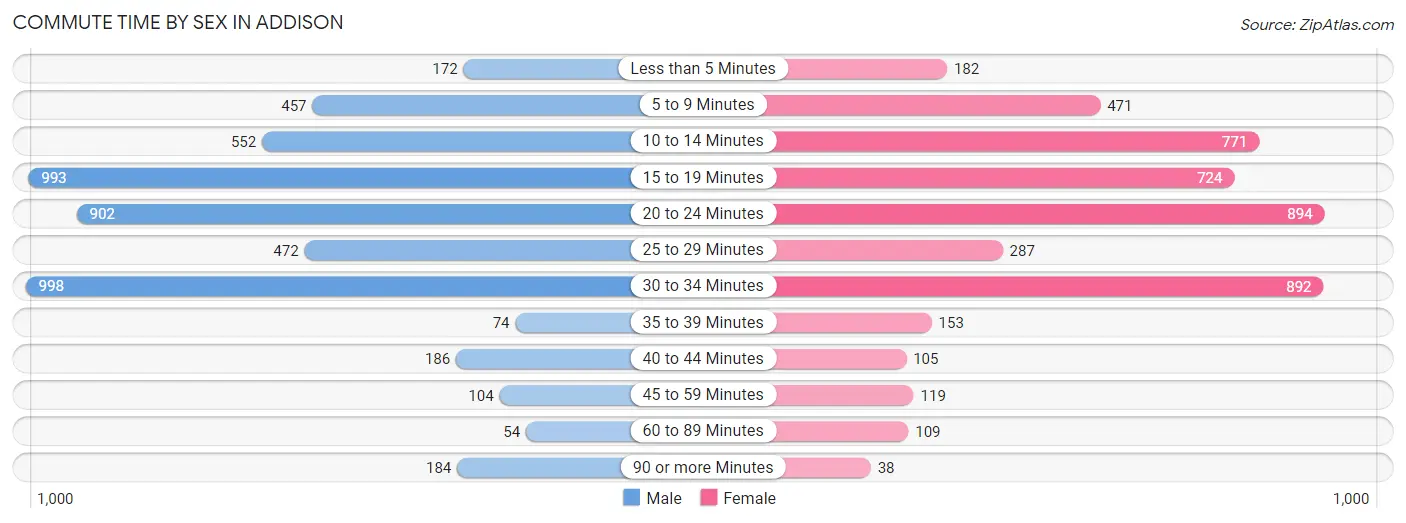
| Commute Time | Male | Female |
| Less than 5 Minutes | 172 (3.3%) | 182 (3.8%) |
| 5 to 9 Minutes | 457 (8.9%) | 471 (9.9%) |
| 10 to 14 Minutes | 552 (10.7%) | 771 (16.3%) |
| 15 to 19 Minutes | 993 (19.3%) | 724 (15.3%) |
| 20 to 24 Minutes | 902 (17.5%) | 894 (18.8%) |
| 25 to 29 Minutes | 472 (9.2%) | 287 (6.0%) |
| 30 to 34 Minutes | 998 (19.4%) | 892 (18.8%) |
| 35 to 39 Minutes | 74 (1.4%) | 153 (3.2%) |
| 40 to 44 Minutes | 186 (3.6%) | 105 (2.2%) |
| 45 to 59 Minutes | 104 (2.0%) | 119 (2.5%) |
| 60 to 89 Minutes | 54 (1.1%) | 109 (2.3%) |
| 90 or more Minutes | 184 (3.6%) | 38 (0.8%) |
Time of Departure to Work by Sex in Addison
The most frequent times of departure to work in Addison are 7:30 AM to 7:59 AM (734, 14.3%) for males and 8:00 AM to 8:29 AM (777, 16.4%) for females.
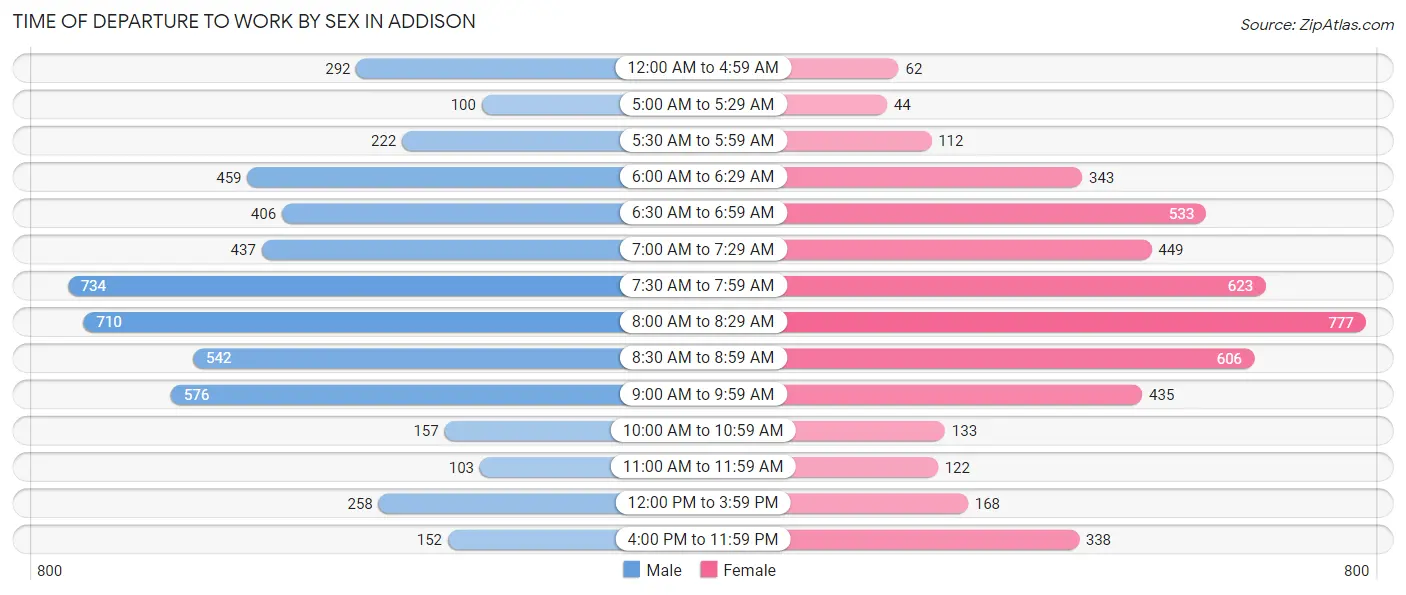
| Time of Departure | Male | Female |
| 12:00 AM to 4:59 AM | 292 (5.7%) | 62 (1.3%) |
| 5:00 AM to 5:29 AM | 100 (1.9%) | 44 (0.9%) |
| 5:30 AM to 5:59 AM | 222 (4.3%) | 112 (2.4%) |
| 6:00 AM to 6:29 AM | 459 (8.9%) | 343 (7.2%) |
| 6:30 AM to 6:59 AM | 406 (7.9%) | 533 (11.2%) |
| 7:00 AM to 7:29 AM | 437 (8.5%) | 449 (9.5%) |
| 7:30 AM to 7:59 AM | 734 (14.3%) | 623 (13.1%) |
| 8:00 AM to 8:29 AM | 710 (13.8%) | 777 (16.4%) |
| 8:30 AM to 8:59 AM | 542 (10.5%) | 606 (12.8%) |
| 9:00 AM to 9:59 AM | 576 (11.2%) | 435 (9.2%) |
| 10:00 AM to 10:59 AM | 157 (3.0%) | 133 (2.8%) |
| 11:00 AM to 11:59 AM | 103 (2.0%) | 122 (2.6%) |
| 12:00 PM to 3:59 PM | 258 (5.0%) | 168 (3.5%) |
| 4:00 PM to 11:59 PM | 152 (2.9%) | 338 (7.1%) |
| Total | 5,148 (100.0%) | 4,745 (100.0%) |
Housing Occupancy in Addison
Occupancy by Ownership in Addison
Of the total 9,561 dwellings in Addison, owner-occupied units account for 1,655 (17.3%), while renter-occupied units make up 7,906 (82.7%).
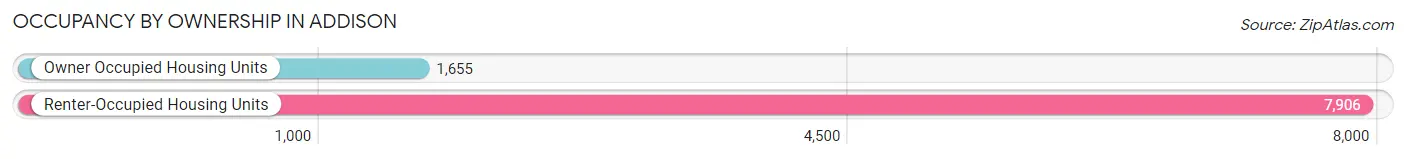
| Occupancy | # Housing Units | % Housing Units |
| Owner Occupied Housing Units | 1,655 | 17.3% |
| Renter-Occupied Housing Units | 7,906 | 82.7% |
| Total Occupied Housing Units | 9,561 | 100.0% |
Occupancy by Household Size in Addison
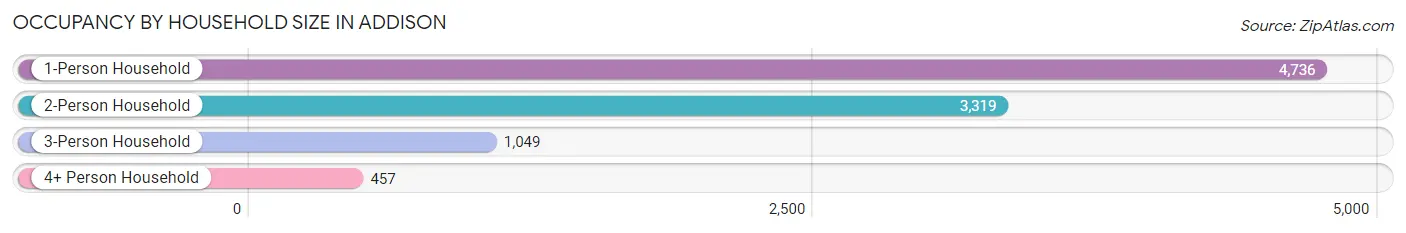
| Household Size | # Housing Units | % Housing Units |
| 1-Person Household | 4,736 | 49.5% |
| 2-Person Household | 3,319 | 34.7% |
| 3-Person Household | 1,049 | 11.0% |
| 4+ Person Household | 457 | 4.8% |
| Total Housing Units | 9,561 | 100.0% |
Occupancy by Ownership by Household Size in Addison
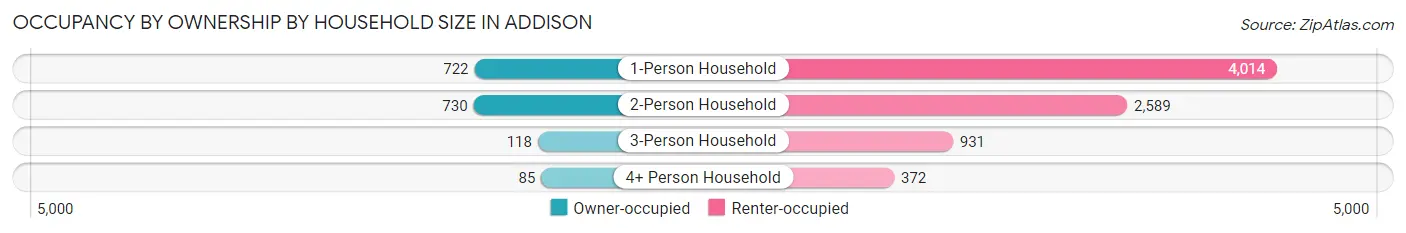
| Household Size | Owner-occupied | Renter-occupied |
| 1-Person Household | 722 (15.2%) | 4,014 (84.8%) |
| 2-Person Household | 730 (22.0%) | 2,589 (78.0%) |
| 3-Person Household | 118 (11.3%) | 931 (88.7%) |
| 4+ Person Household | 85 (18.6%) | 372 (81.4%) |
| Total Housing Units | 1,655 (17.3%) | 7,906 (82.7%) |
Occupancy by Educational Attainment in Addison
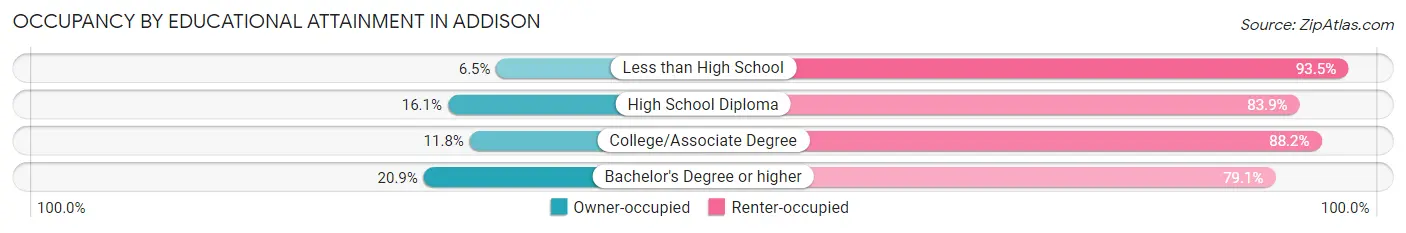
| Household Size | Owner-occupied | Renter-occupied |
| Less than High School | 21 (6.5%) | 304 (93.5%) |
| High School Diploma | 121 (16.1%) | 631 (83.9%) |
| College/Associate Degree | 334 (11.8%) | 2,506 (88.2%) |
| Bachelor's Degree or higher | 1,179 (20.9%) | 4,465 (79.1%) |
Occupancy by Age of Householder in Addison
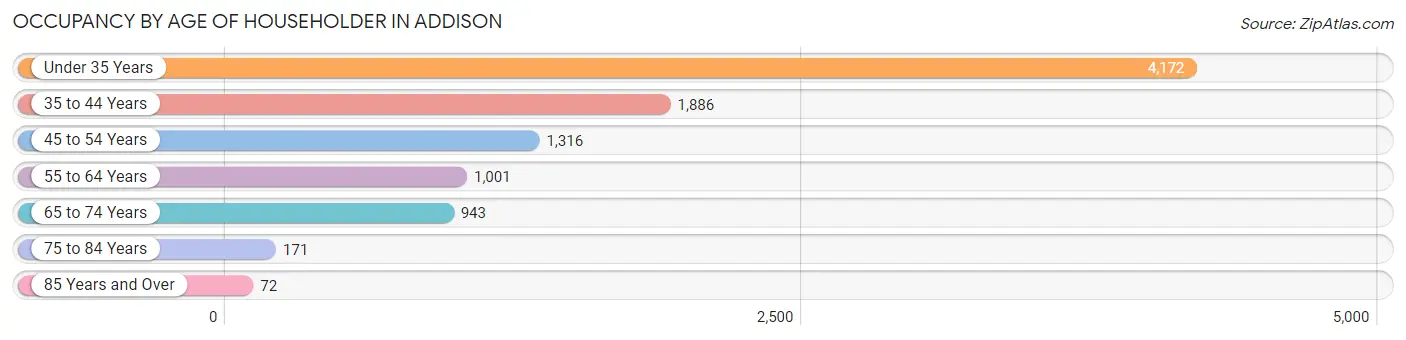
| Age Bracket | # Households | % Households |
| Under 35 Years | 4,172 | 43.6% |
| 35 to 44 Years | 1,886 | 19.7% |
| 45 to 54 Years | 1,316 | 13.8% |
| 55 to 64 Years | 1,001 | 10.5% |
| 65 to 74 Years | 943 | 9.9% |
| 75 to 84 Years | 171 | 1.8% |
| 85 Years and Over | 72 | 0.7% |
| Total | 9,561 | 100.0% |
Housing Finances in Addison
Median Income by Occupancy in Addison
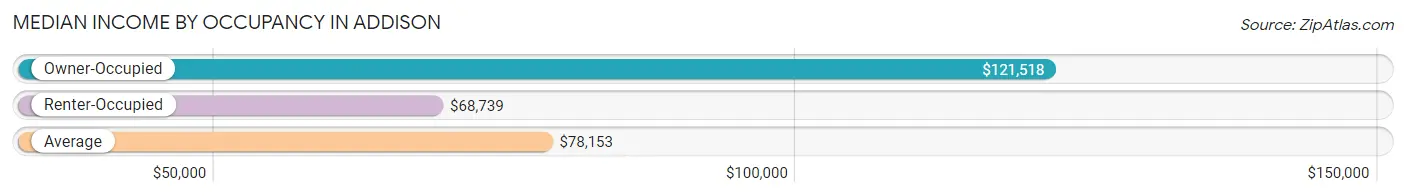
| Occupancy Type | # Households | Median Income |
| Owner-Occupied | 1,655 (17.3%) | $121,518 |
| Renter-Occupied | 7,906 (82.7%) | $68,739 |
| Average | 9,561 (100.0%) | $78,153 |
Occupancy by Householder Income Bracket in Addison
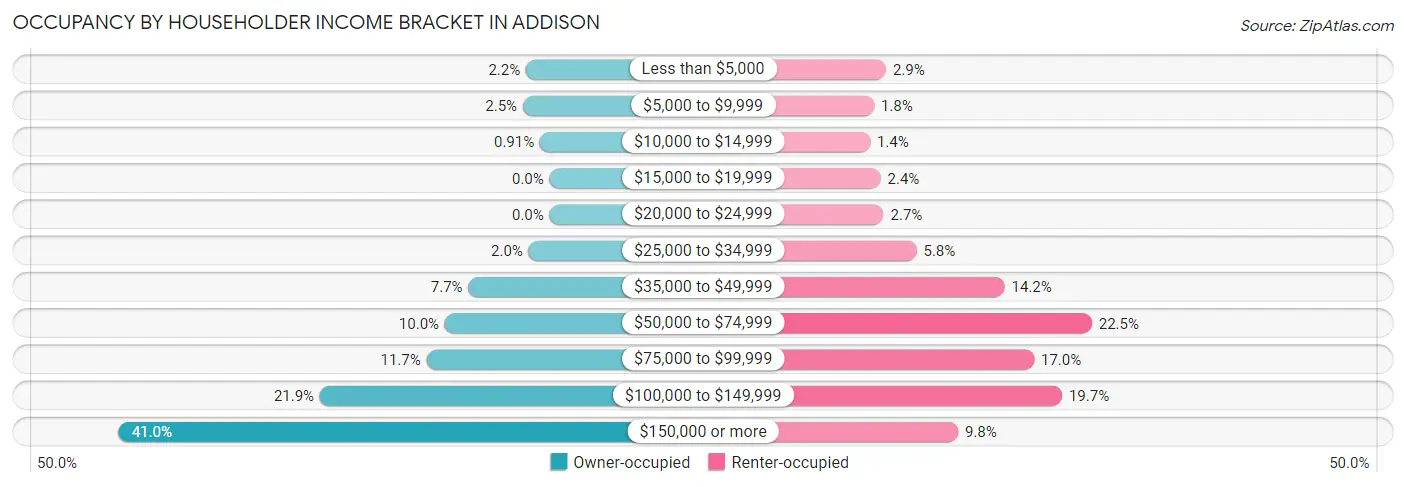
| Income Bracket | Owner-occupied | Renter-occupied |
| Less than $5,000 | 37 (2.2%) | 229 (2.9%) |
| $5,000 to $9,999 | 42 (2.5%) | 139 (1.8%) |
| $10,000 to $14,999 | 15 (0.9%) | 108 (1.4%) |
| $15,000 to $19,999 | 0 (0.0%) | 189 (2.4%) |
| $20,000 to $24,999 | 0 (0.0%) | 211 (2.7%) |
| $25,000 to $34,999 | 33 (2.0%) | 459 (5.8%) |
| $35,000 to $49,999 | 128 (7.7%) | 1,122 (14.2%) |
| $50,000 to $74,999 | 165 (10.0%) | 1,779 (22.5%) |
| $75,000 to $99,999 | 194 (11.7%) | 1,344 (17.0%) |
| $100,000 to $149,999 | 362 (21.9%) | 1,554 (19.7%) |
| $150,000 or more | 679 (41.0%) | 772 (9.8%) |
| Total | 1,655 (100.0%) | 7,906 (100.0%) |
Monthly Housing Cost Tiers in Addison
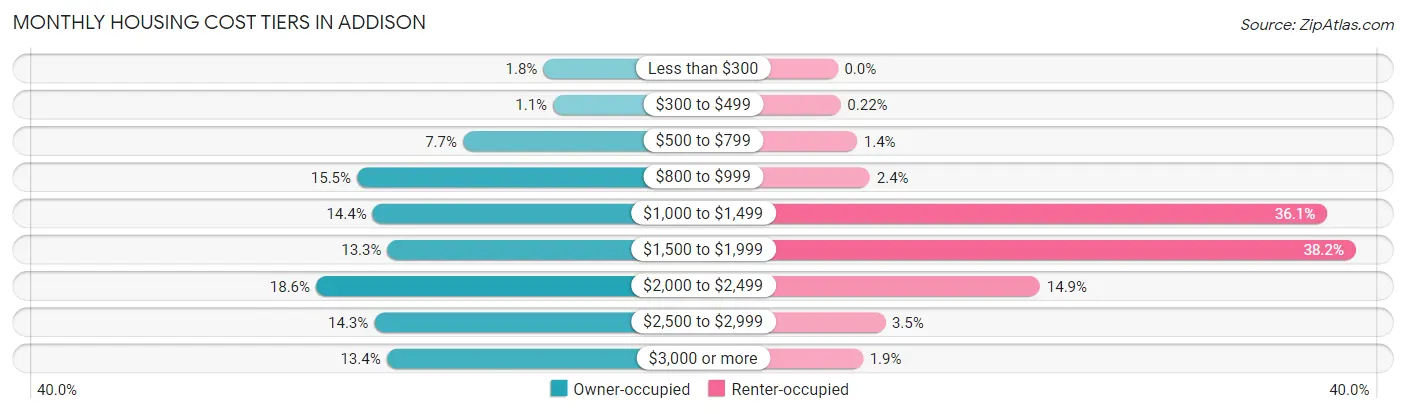
| Monthly Cost | Owner-occupied | Renter-occupied |
| Less than $300 | 30 (1.8%) | 0 (0.0%) |
| $300 to $499 | 18 (1.1%) | 17 (0.2%) |
| $500 to $799 | 128 (7.7%) | 113 (1.4%) |
| $800 to $999 | 257 (15.5%) | 189 (2.4%) |
| $1,000 to $1,499 | 238 (14.4%) | 2,851 (36.1%) |
| $1,500 to $1,999 | 220 (13.3%) | 3,018 (38.2%) |
| $2,000 to $2,499 | 307 (18.5%) | 1,179 (14.9%) |
| $2,500 to $2,999 | 236 (14.3%) | 277 (3.5%) |
| $3,000 or more | 221 (13.4%) | 147 (1.9%) |
| Total | 1,655 (100.0%) | 7,906 (100.0%) |
Physical Housing Characteristics in Addison
Housing Structures in Addison
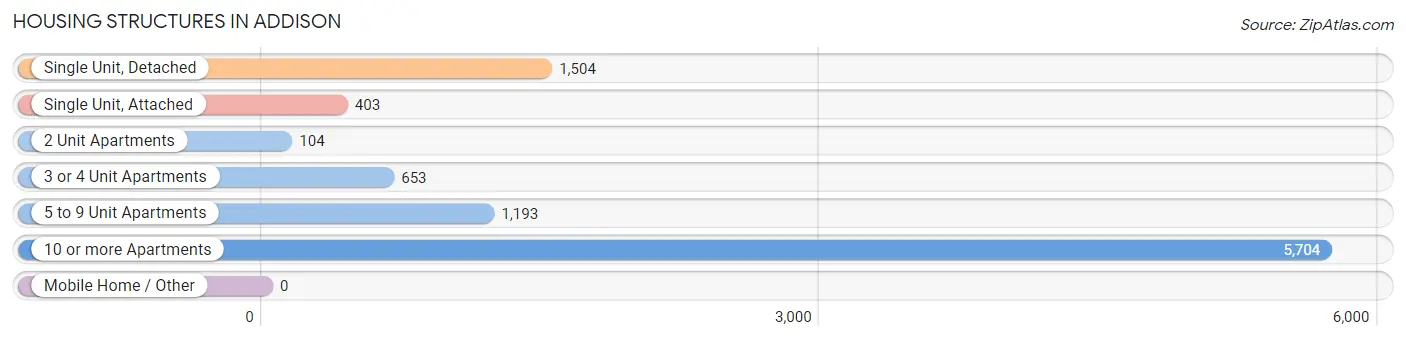
| Structure Type | # Housing Units | % Housing Units |
| Single Unit, Detached | 1,504 | 15.7% |
| Single Unit, Attached | 403 | 4.2% |
| 2 Unit Apartments | 104 | 1.1% |
| 3 or 4 Unit Apartments | 653 | 6.8% |
| 5 to 9 Unit Apartments | 1,193 | 12.5% |
| 10 or more Apartments | 5,704 | 59.7% |
| Mobile Home / Other | 0 | 0.0% |
| Total | 9,561 | 100.0% |
Housing Structures by Occupancy in Addison
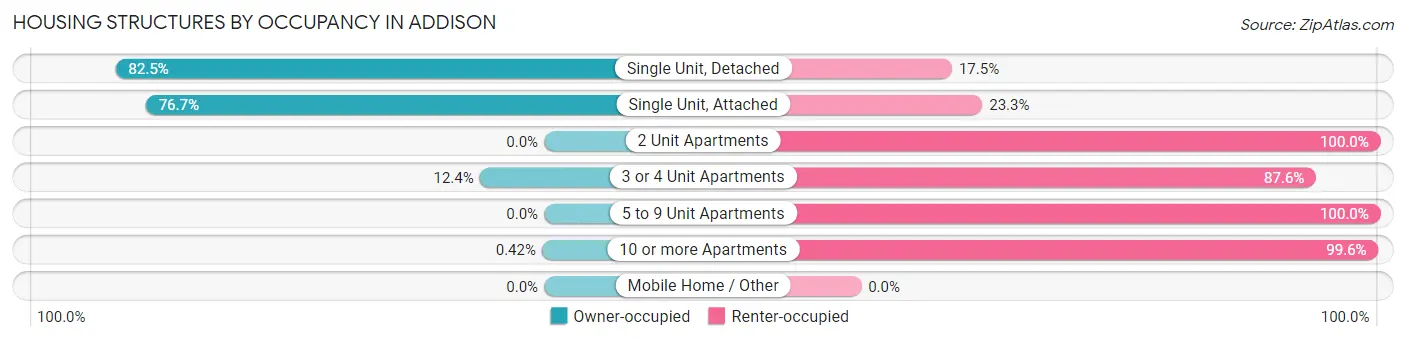
| Structure Type | Owner-occupied | Renter-occupied |
| Single Unit, Detached | 1,241 (82.5%) | 263 (17.5%) |
| Single Unit, Attached | 309 (76.7%) | 94 (23.3%) |
| 2 Unit Apartments | 0 (0.0%) | 104 (100.0%) |
| 3 or 4 Unit Apartments | 81 (12.4%) | 572 (87.6%) |
| 5 to 9 Unit Apartments | 0 (0.0%) | 1,193 (100.0%) |
| 10 or more Apartments | 24 (0.4%) | 5,680 (99.6%) |
| Mobile Home / Other | 0 (0.0%) | 0 (0.0%) |
| Total | 1,655 (17.3%) | 7,906 (82.7%) |
Housing Structures by Number of Rooms in Addison
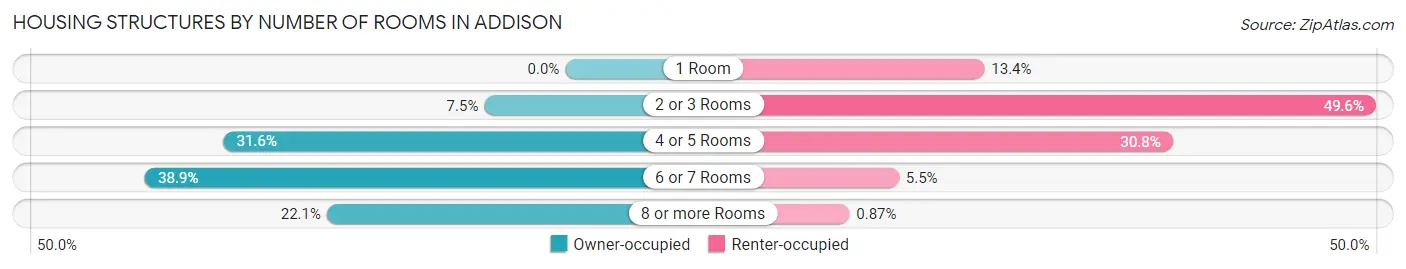
| Number of Rooms | Owner-occupied | Renter-occupied |
| 1 Room | 0 (0.0%) | 1,056 (13.4%) |
| 2 or 3 Rooms | 124 (7.5%) | 3,918 (49.6%) |
| 4 or 5 Rooms | 523 (31.6%) | 2,432 (30.8%) |
| 6 or 7 Rooms | 643 (38.9%) | 431 (5.4%) |
| 8 or more Rooms | 365 (22.1%) | 69 (0.9%) |
| Total | 1,655 (100.0%) | 7,906 (100.0%) |
Housing Structure by Heating Type in Addison
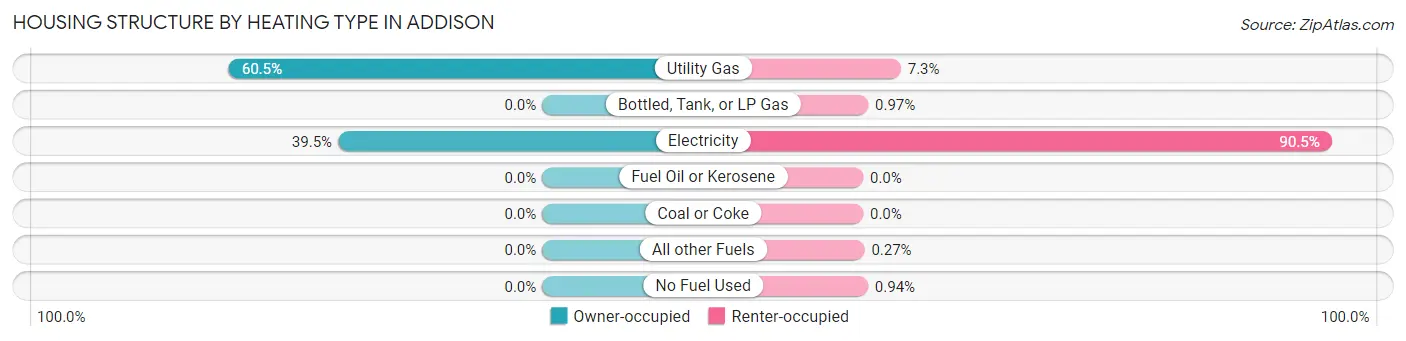
| Heating Type | Owner-occupied | Renter-occupied |
| Utility Gas | 1,002 (60.5%) | 576 (7.3%) |
| Bottled, Tank, or LP Gas | 0 (0.0%) | 77 (1.0%) |
| Electricity | 653 (39.5%) | 7,158 (90.5%) |
| Fuel Oil or Kerosene | 0 (0.0%) | 0 (0.0%) |
| Coal or Coke | 0 (0.0%) | 0 (0.0%) |
| All other Fuels | 0 (0.0%) | 21 (0.3%) |
| No Fuel Used | 0 (0.0%) | 74 (0.9%) |
| Total | 1,655 (100.0%) | 7,906 (100.0%) |
Household Vehicle Usage in Addison
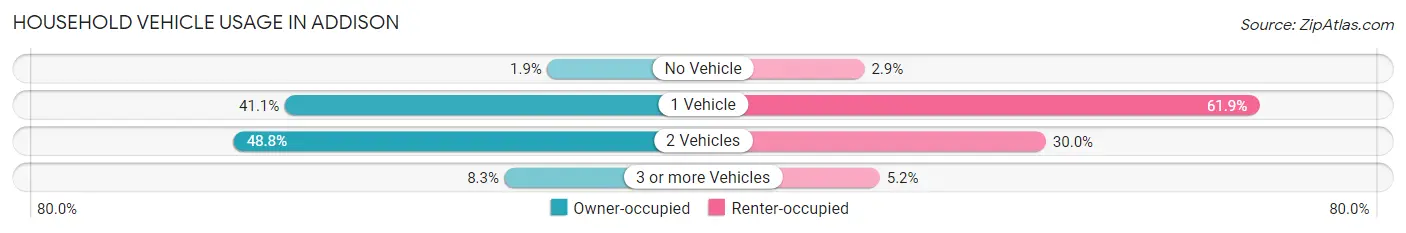
| Vehicles per Household | Owner-occupied | Renter-occupied |
| No Vehicle | 31 (1.9%) | 231 (2.9%) |
| 1 Vehicle | 680 (41.1%) | 4,890 (61.9%) |
| 2 Vehicles | 807 (48.8%) | 2,373 (30.0%) |
| 3 or more Vehicles | 137 (8.3%) | 412 (5.2%) |
| Total | 1,655 (100.0%) | 7,906 (100.0%) |
Real Estate & Mortgages in Addison
Real Estate and Mortgage Overview in Addison
| Characteristic | Without Mortgage | With Mortgage |
| Housing Units | 736 | 919 |
| Median Property Value | $433,900 | $430,700 |
| Median Household Income | $114,000 | $392 |
| Monthly Housing Costs | $967 | $202 |
| Real Estate Taxes | $6,229 | $8 |
Property Value by Mortgage Status in Addison
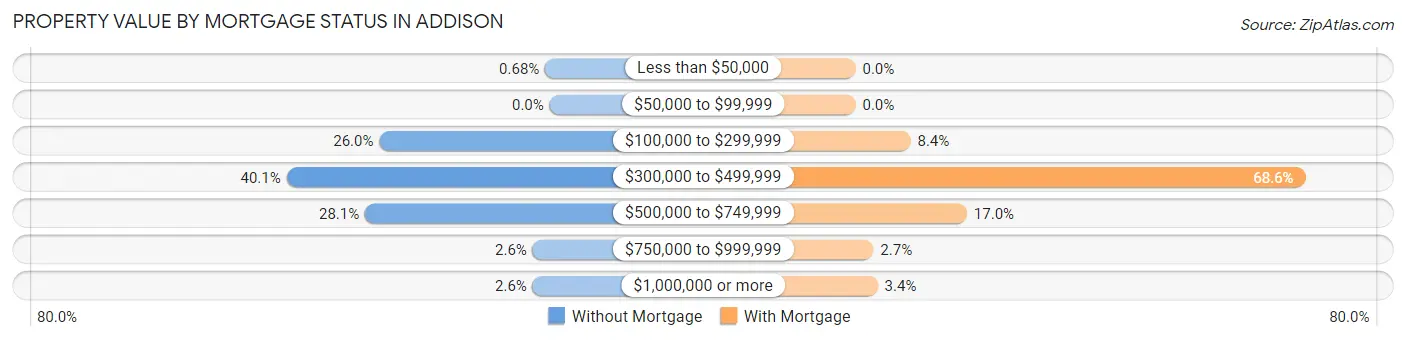
| Property Value | Without Mortgage | With Mortgage |
| Less than $50,000 | 5 (0.7%) | 0 (0.0%) |
| $50,000 to $99,999 | 0 (0.0%) | 0 (0.0%) |
| $100,000 to $299,999 | 191 (26.0%) | 77 (8.4%) |
| $300,000 to $499,999 | 295 (40.1%) | 630 (68.5%) |
| $500,000 to $749,999 | 207 (28.1%) | 156 (17.0%) |
| $750,000 to $999,999 | 19 (2.6%) | 25 (2.7%) |
| $1,000,000 or more | 19 (2.6%) | 31 (3.4%) |
| Total | 736 (100.0%) | 919 (100.0%) |
Household Income by Mortgage Status in Addison
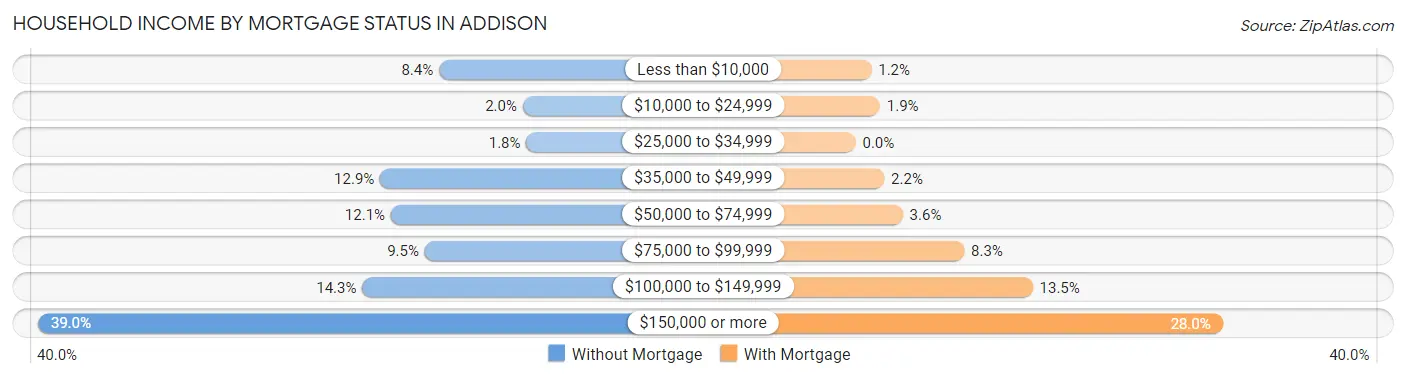
| Household Income | Without Mortgage | With Mortgage |
| Less than $10,000 | 62 (8.4%) | 11 (1.2%) |
| $10,000 to $24,999 | 15 (2.0%) | 17 (1.8%) |
| $25,000 to $34,999 | 13 (1.8%) | 0 (0.0%) |
| $35,000 to $49,999 | 95 (12.9%) | 20 (2.2%) |
| $50,000 to $74,999 | 89 (12.1%) | 33 (3.6%) |
| $75,000 to $99,999 | 70 (9.5%) | 76 (8.3%) |
| $100,000 to $149,999 | 105 (14.3%) | 124 (13.5%) |
| $150,000 or more | 287 (39.0%) | 257 (28.0%) |
| Total | 736 (100.0%) | 919 (100.0%) |
Property Value to Household Income Ratio in Addison
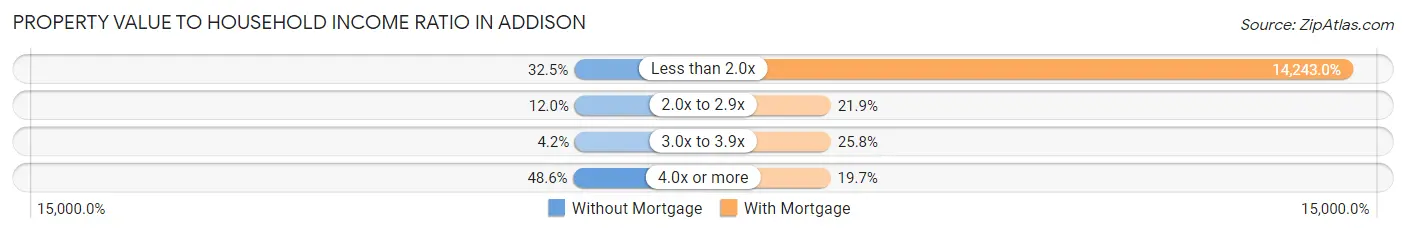
| Value-to-Income Ratio | Without Mortgage | With Mortgage |
| Less than 2.0x | 239 (32.5%) | 130,893 (14,243.0%) |
| 2.0x to 2.9x | 88 (12.0%) | 201 (21.9%) |
| 3.0x to 3.9x | 31 (4.2%) | 237 (25.8%) |
| 4.0x or more | 358 (48.6%) | 181 (19.7%) |
| Total | 736 (100.0%) | 919 (100.0%) |
Real Estate Taxes by Mortgage Status in Addison
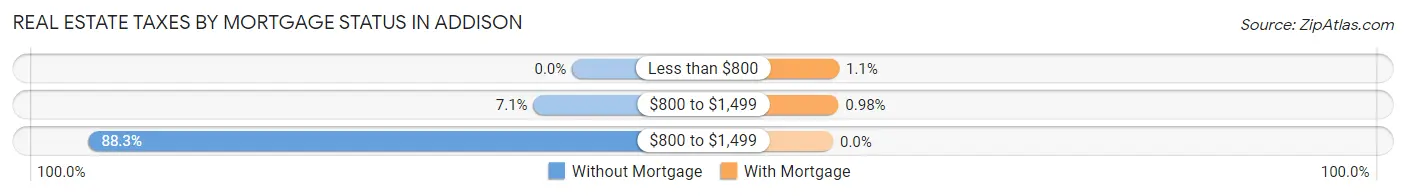
| Property Taxes | Without Mortgage | With Mortgage |
| Less than $800 | 0 (0.0%) | 10 (1.1%) |
| $800 to $1,499 | 52 (7.1%) | 9 (1.0%) |
| $800 to $1,499 | 650 (88.3%) | 0 (0.0%) |
| Total | 736 (100.0%) | 919 (100.0%) |
Health & Disability in Addison
Health Insurance Coverage by Age in Addison
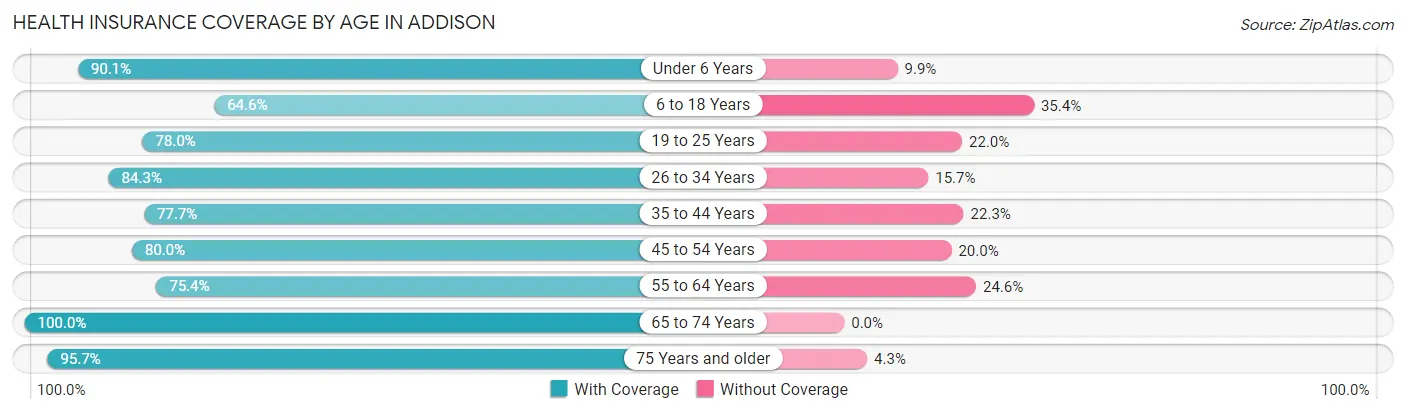
| Age Bracket | With Coverage | Without Coverage |
| Under 6 Years | 788 (90.1%) | 87 (9.9%) |
| 6 to 18 Years | 784 (64.6%) | 429 (35.4%) |
| 19 to 25 Years | 1,591 (78.0%) | 448 (22.0%) |
| 26 to 34 Years | 3,914 (84.3%) | 727 (15.7%) |
| 35 to 44 Years | 2,225 (77.7%) | 637 (22.3%) |
| 45 to 54 Years | 1,745 (80.0%) | 436 (20.0%) |
| 55 to 64 Years | 1,105 (75.4%) | 360 (24.6%) |
| 65 to 74 Years | 1,312 (100.0%) | 0 (0.0%) |
| 75 Years and older | 382 (95.7%) | 17 (4.3%) |
| Total | 13,846 (81.5%) | 3,141 (18.5%) |
Health Insurance Coverage by Citizenship Status in Addison
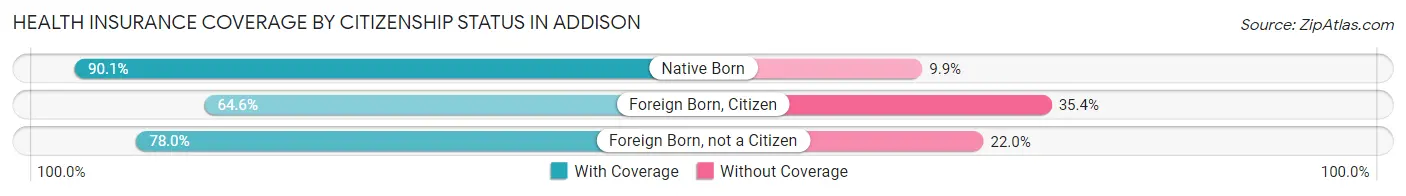
| Citizenship Status | With Coverage | Without Coverage |
| Native Born | 788 (90.1%) | 87 (9.9%) |
| Foreign Born, Citizen | 784 (64.6%) | 429 (35.4%) |
| Foreign Born, not a Citizen | 1,591 (78.0%) | 448 (22.0%) |
Health Insurance Coverage by Household Income in Addison
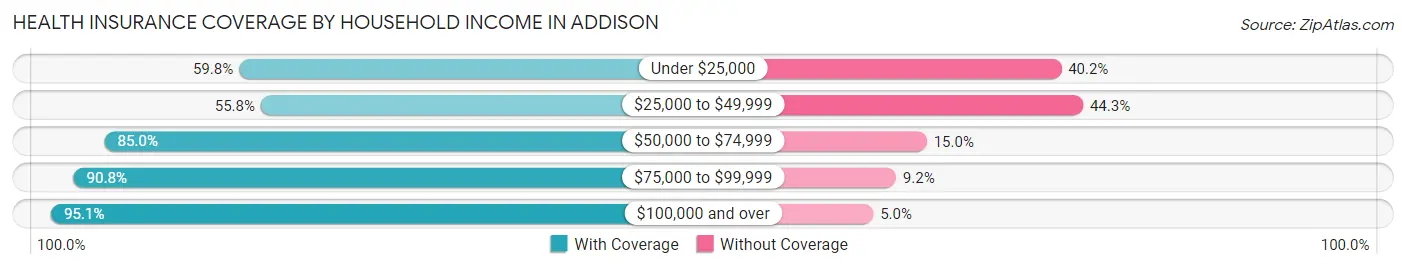
| Household Income | With Coverage | Without Coverage |
| Under $25,000 | 940 (59.8%) | 631 (40.2%) |
| $25,000 to $49,999 | 1,904 (55.7%) | 1,511 (44.3%) |
| $50,000 to $74,999 | 2,650 (85.0%) | 467 (15.0%) |
| $75,000 to $99,999 | 1,973 (90.8%) | 200 (9.2%) |
| $100,000 and over | 6,379 (95.1%) | 332 (5.0%) |
Public vs Private Health Insurance Coverage by Age in Addison
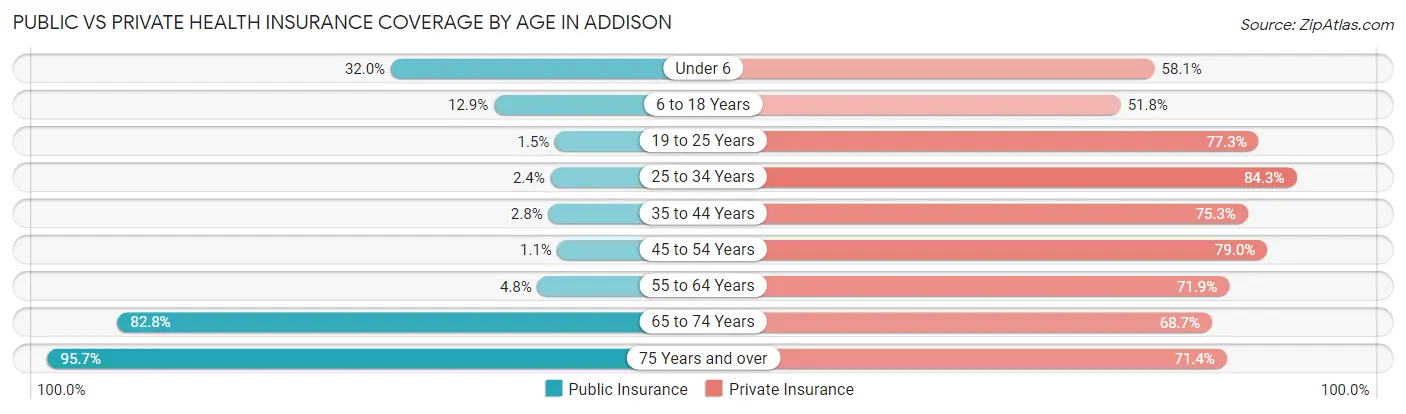
| Age Bracket | Public Insurance | Private Insurance |
| Under 6 | 280 (32.0%) | 508 (58.1%) |
| 6 to 18 Years | 156 (12.9%) | 628 (51.8%) |
| 19 to 25 Years | 31 (1.5%) | 1,577 (77.3%) |
| 25 to 34 Years | 110 (2.4%) | 3,914 (84.3%) |
| 35 to 44 Years | 79 (2.8%) | 2,156 (75.3%) |
| 45 to 54 Years | 23 (1.1%) | 1,722 (78.9%) |
| 55 to 64 Years | 70 (4.8%) | 1,053 (71.9%) |
| 65 to 74 Years | 1,086 (82.8%) | 901 (68.7%) |
| 75 Years and over | 382 (95.7%) | 285 (71.4%) |
| Total | 2,217 (13.1%) | 12,744 (75.0%) |
Disability Status by Sex by Age in Addison
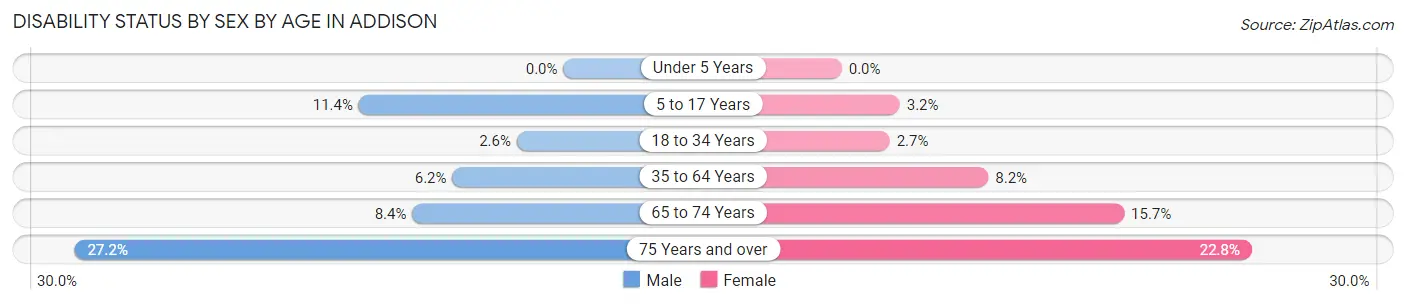
| Age Bracket | Male | Female |
| Under 5 Years | 0 (0.0%) | 0 (0.0%) |
| 5 to 17 Years | 68 (11.4%) | 20 (3.2%) |
| 18 to 34 Years | 91 (2.6%) | 88 (2.7%) |
| 35 to 64 Years | 203 (6.2%) | 263 (8.2%) |
| 65 to 74 Years | 44 (8.4%) | 124 (15.7%) |
| 75 Years and over | 49 (27.2%) | 50 (22.8%) |
Disability Class by Sex by Age in Addison
Disability Class: Hearing Difficulty
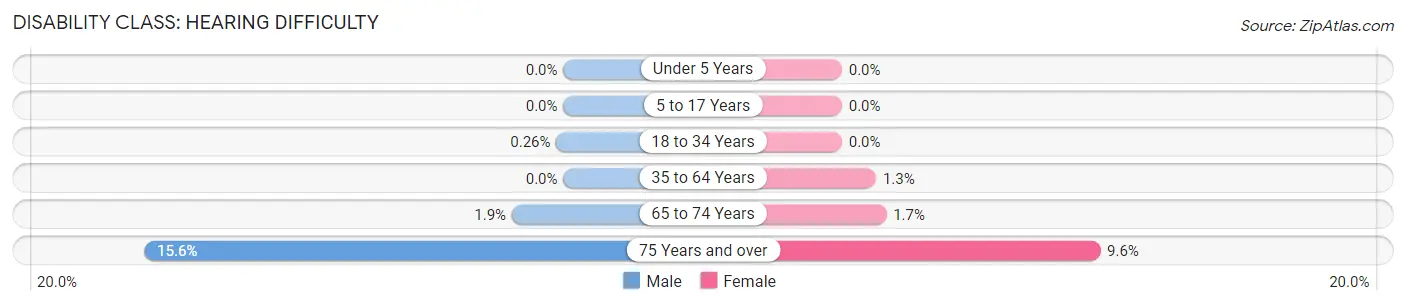
| Age Bracket | Male | Female |
| Under 5 Years | 0 (0.0%) | 0 (0.0%) |
| 5 to 17 Years | 0 (0.0%) | 0 (0.0%) |
| 18 to 34 Years | 9 (0.3%) | 0 (0.0%) |
| 35 to 64 Years | 0 (0.0%) | 41 (1.3%) |
| 65 to 74 Years | 10 (1.9%) | 13 (1.7%) |
| 75 Years and over | 28 (15.6%) | 21 (9.6%) |
Disability Class: Vision Difficulty
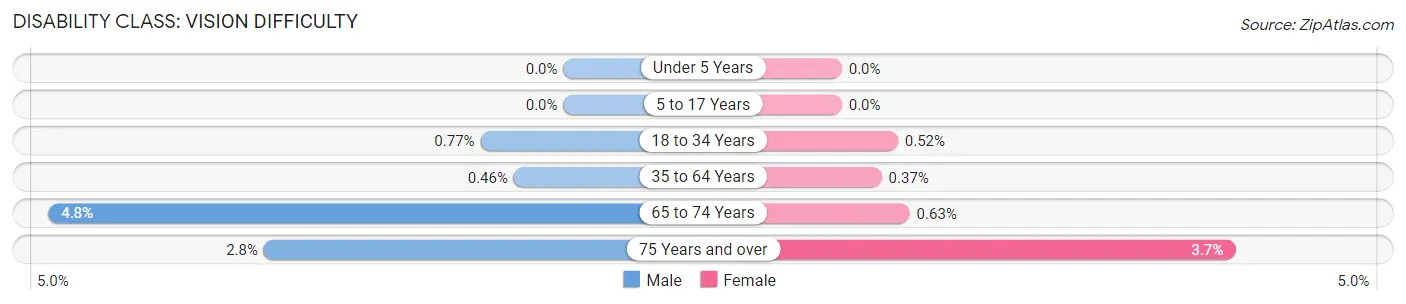
| Age Bracket | Male | Female |
| Under 5 Years | 0 (0.0%) | 0 (0.0%) |
| 5 to 17 Years | 0 (0.0%) | 0 (0.0%) |
| 18 to 34 Years | 27 (0.8%) | 17 (0.5%) |
| 35 to 64 Years | 15 (0.5%) | 12 (0.4%) |
| 65 to 74 Years | 25 (4.8%) | 5 (0.6%) |
| 75 Years and over | 5 (2.8%) | 8 (3.6%) |
Disability Class: Cognitive Difficulty
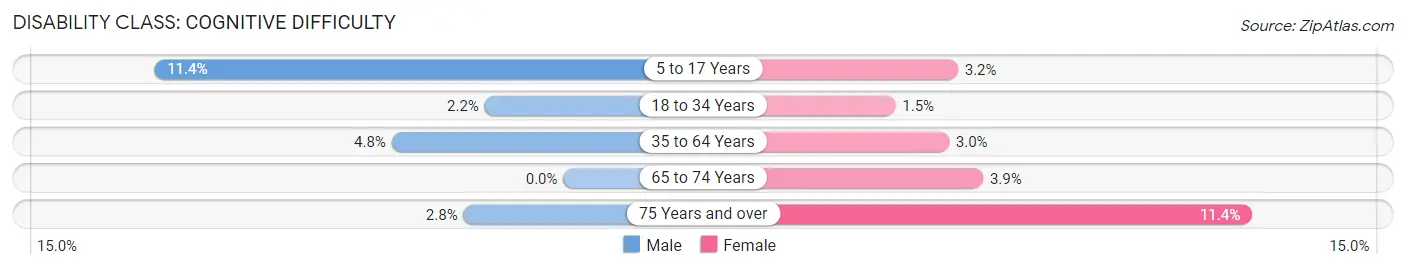
| Age Bracket | Male | Female |
| 5 to 17 Years | 68 (11.4%) | 20 (3.2%) |
| 18 to 34 Years | 77 (2.2%) | 49 (1.5%) |
| 35 to 64 Years | 157 (4.8%) | 96 (3.0%) |
| 65 to 74 Years | 0 (0.0%) | 31 (3.9%) |
| 75 Years and over | 5 (2.8%) | 25 (11.4%) |
Disability Class: Ambulatory Difficulty
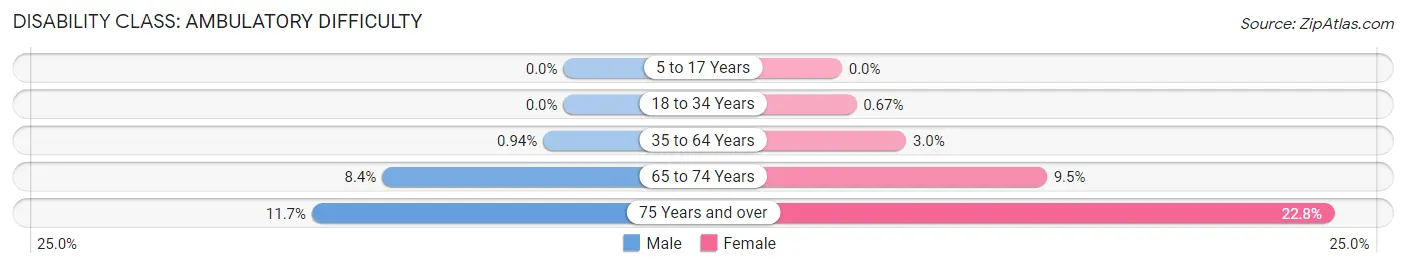
| Age Bracket | Male | Female |
| 5 to 17 Years | 0 (0.0%) | 0 (0.0%) |
| 18 to 34 Years | 0 (0.0%) | 22 (0.7%) |
| 35 to 64 Years | 31 (0.9%) | 96 (3.0%) |
| 65 to 74 Years | 44 (8.4%) | 75 (9.5%) |
| 75 Years and over | 21 (11.7%) | 50 (22.8%) |
Disability Class: Self-Care Difficulty
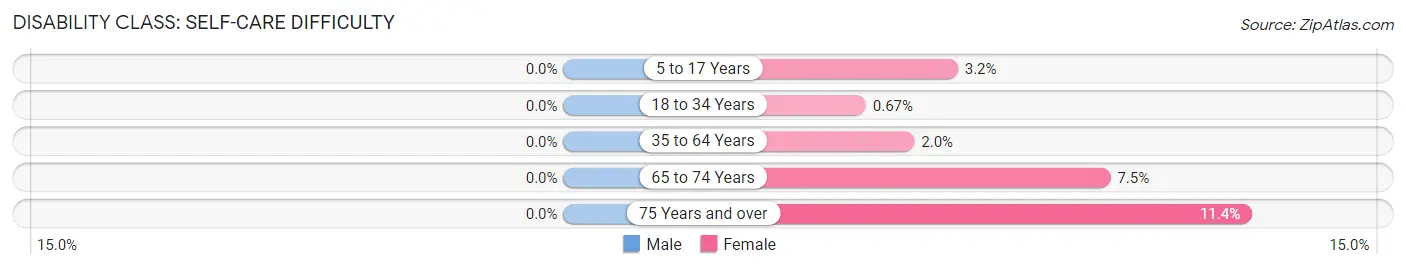
| Age Bracket | Male | Female |
| 5 to 17 Years | 0 (0.0%) | 20 (3.2%) |
| 18 to 34 Years | 0 (0.0%) | 22 (0.7%) |
| 35 to 64 Years | 0 (0.0%) | 65 (2.0%) |
| 65 to 74 Years | 0 (0.0%) | 59 (7.5%) |
| 75 Years and over | 0 (0.0%) | 25 (11.4%) |
Technology Access in Addison
Computing Device Access in Addison
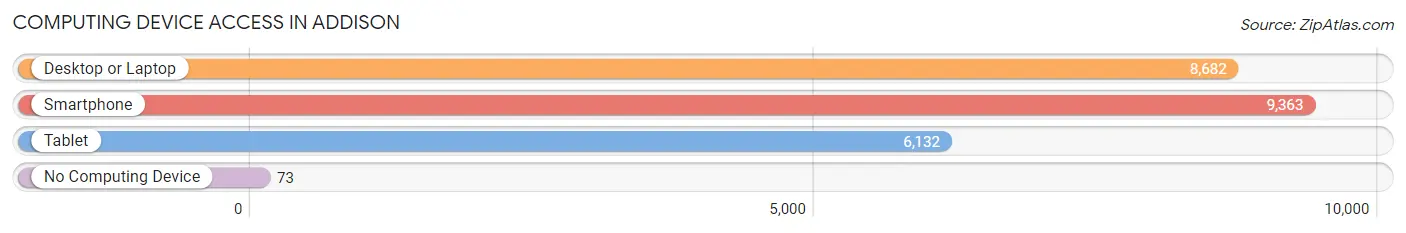
| Device Type | # Households | % Households |
| Desktop or Laptop | 8,682 | 90.8% |
| Smartphone | 9,363 | 97.9% |
| Tablet | 6,132 | 64.1% |
| No Computing Device | 73 | 0.8% |
| Total | 9,561 | 100.0% |
Internet Access in Addison
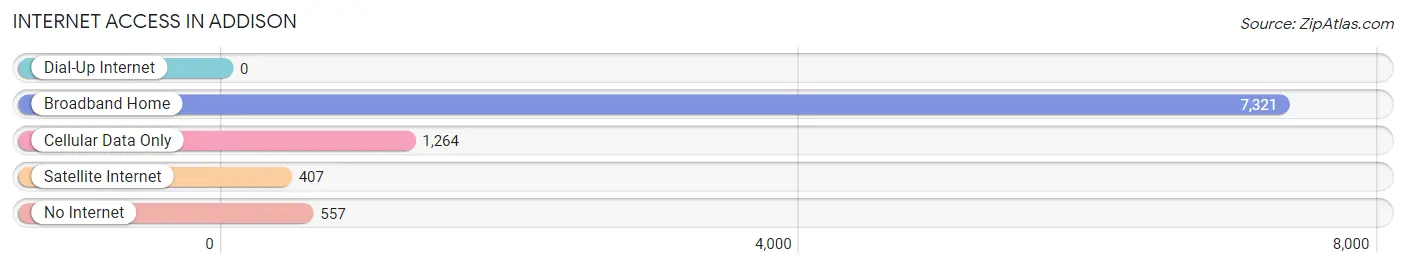
| Internet Type | # Households | % Households |
| Dial-Up Internet | 0 | 0.0% |
| Broadband Home | 7,321 | 76.6% |
| Cellular Data Only | 1,264 | 13.2% |
| Satellite Internet | 407 | 4.3% |
| No Internet | 557 | 5.8% |
| Total | 9,561 | 100.0% |
Addison Summary
Addison, Texas is a small town located in Dallas County, Texas. It is situated in the northern part of the Dallas-Fort Worth metropolitan area and is part of the larger Dallas-Fort Worth-Arlington metropolitan statistical area. The town has a population of 15,807 as of the 2010 census.
History
Addison was founded in 1846 by a group of settlers from Kentucky and Tennessee. The town was named after Addison Robertson, a prominent local landowner. The town was incorporated in 1953 and has since grown to become a vibrant and diverse community.
Geography
Addison is located at 32°57'25" North, 96°50'17" West (32.957, -96.838). It is situated in the northern part of the Dallas-Fort Worth metropolitan area and is part of the larger Dallas-Fort Worth-Arlington metropolitan statistical area. The town has a total area of 4.9 square miles, all of which is land.
Economy
Addison is home to a variety of businesses and industries. The town is home to several corporate headquarters, including Mary Kay Cosmetics, Dr Pepper Snapple Group, and Frito-Lay. The town is also home to a number of restaurants, bars, and entertainment venues.
Demographics
As of the 2010 census, Addison had a population of 15,807. The racial makeup of the town was 73.3% White, 8.2% African American, 0.3% Native American, 8.2% Asian, 0.1% Pacific Islander, and 8.9% from other races. Hispanic or Latino of any race were 24.2% of the population.
The median income for a household in Addison was $50,945, and the median income for a family was $60,945. The per capita income for the town was $30,945. About 8.2% of families and 10.3% of the population were below the poverty line, including 14.2% of those under age 18 and 6.2% of those age 65 or over.
Addison is a diverse and vibrant community with a strong economy and a variety of businesses and industries. The town is home to a number of corporate headquarters and is a popular destination for dining, entertainment, and shopping. The town has a population of 15,807 and a median income of $50,945. Addison is a great place to live, work, and play.
Common Questions
What is Per Capita Income in Addison?
Per Capita income in Addison is $56,083.
What is the Median Family Income in Addison?
Median Family Income in Addison is $87,515.
What is the Median Household income in Addison?
Median Household Income in Addison is $78,153.
What is Income or Wage Gap in Addison?
Income or Wage Gap in Addison is 20.6%.
Women in Addison earn 79.4 cents for every dollar earned by a man.
What is Inequality or Gini Index in Addison?
Inequality or Gini Index in Addison is 0.42.
What is the Total Population of Addison?
Total Population of Addison is 17,026.
What is the Total Male Population of Addison?
Total Male Population of Addison is 8,544.
What is the Total Female Population of Addison?
Total Female Population of Addison is 8,482.
What is the Ratio of Males per 100 Females in Addison?
There are 100.73 Males per 100 Females in Addison.
What is the Ratio of Females per 100 Males in Addison?
There are 99.27 Females per 100 Males in Addison.
What is the Median Population Age in Addison?
Median Population Age in Addison is 34.0 Years.
What is the Average Family Size in Addison
Average Family Size in Addison is 2.6 People.
What is the Average Household Size in Addison
Average Household Size in Addison is 1.8 People.
How Large is the Labor Force in Addison?
There are 12,322 People in the Labor Forcein in Addison.
What is the Percentage of People in the Labor Force in Addison?
80.9% of People are in the Labor Force in Addison.
What is the Unemployment Rate in Addison?
Unemployment Rate in Addison is 3.3%.