Sonora, TX Map & Demographics
Sonora Map
Sonora Overview
$20,955
PER CAPITA INCOME
$55,104
AVG FAMILY INCOME
$53,400
AVG HOUSEHOLD INCOME
63.9%
WAGE / INCOME GAP [ % ]
36.1¢/ $1
WAGE / INCOME GAP [ $ ]
0.42
INEQUALITY / GINI INDEX
2,852
TOTAL POPULATION
1,362
MALE POPULATION
1,490
FEMALE POPULATION
91.41
MALES / 100 FEMALES
109.40
FEMALES / 100 MALES
29.4
MEDIAN AGE
3.7
AVG FAMILY SIZE
3.2
AVG HOUSEHOLD SIZE
1,174
LABOR FORCE [ PEOPLE ]
62.6%
PERCENT IN LABOR FORCE
4.8%
UNEMPLOYMENT RATE
Sonora Zip Codes
Sonora Area Codes
Income in Sonora
Income Overview in Sonora
Per Capita Income in Sonora is $20,955, while median incomes of families and households are $55,104 and $53,400 respectively.
| Characteristic | Number | Measure |
| Per Capita Income | 2,852 | $20,955 |
| Median Family Income | 698 | $55,104 |
| Mean Family Income | 698 | $68,948 |
| Median Household Income | 890 | $53,400 |
| Mean Household Income | 890 | $64,873 |
| Income Deficit | 698 | $0 |
| Wage / Income Gap (%) | 2,852 | 63.94% |
| Wage / Income Gap ($) | 2,852 | 36.06¢ per $1 |
| Gini / Inequality Index | 2,852 | 0.42 |
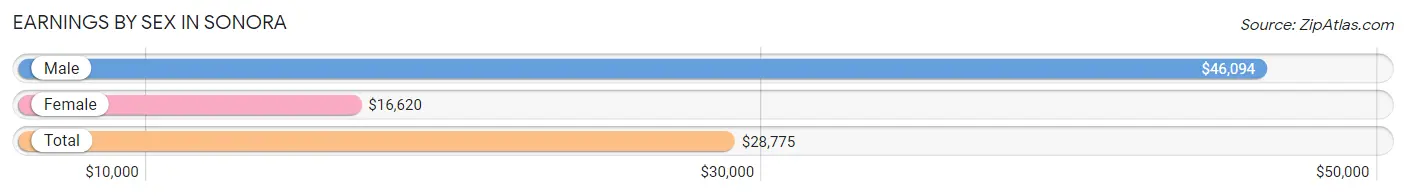
Earnings by Sex in Sonora
Average Earnings in Sonora are $28,775, $46,094 for men and $16,620 for women, a difference of 63.9%.
| Sex | Number | Average Earnings |
| Male | 526 (43.0%) | $46,094 |
| Female | 698 (57.0%) | $16,620 |
| Total | 1,224 (100.0%) | $28,775 |
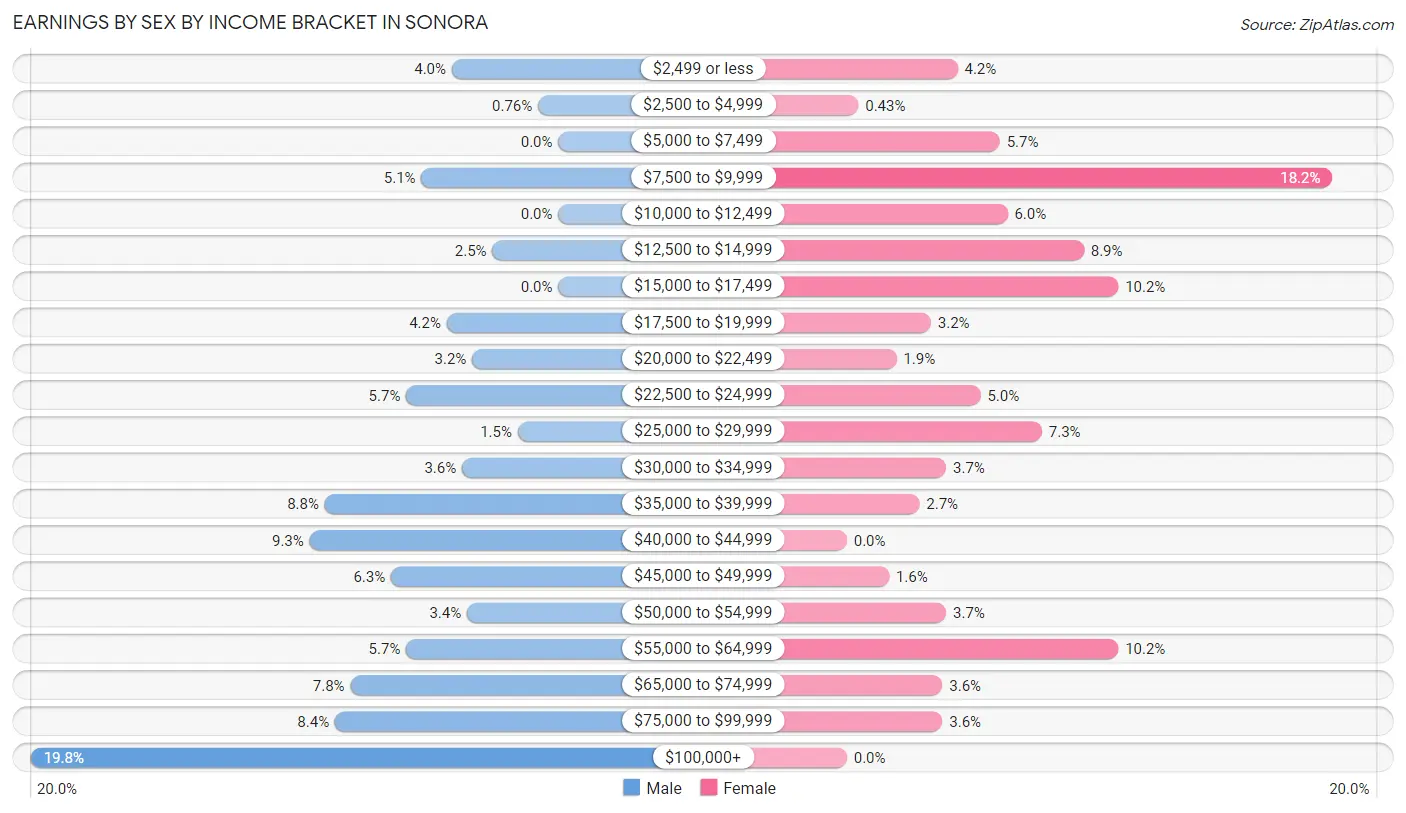
Earnings by Sex by Income Bracket in Sonora
The most common earnings brackets in Sonora are $100,000+ for men (104 | 19.8%) and $7,500 to $9,999 for women (127 | 18.2%).
| Income | Male | Female |
| $2,499 or less | 21 (4.0%) | 29 (4.2%) |
| $2,500 to $4,999 | 4 (0.8%) | 3 (0.4%) |
| $5,000 to $7,499 | 0 (0.0%) | 40 (5.7%) |
| $7,500 to $9,999 | 27 (5.1%) | 127 (18.2%) |
| $10,000 to $12,499 | 0 (0.0%) | 42 (6.0%) |
| $12,500 to $14,999 | 13 (2.5%) | 62 (8.9%) |
| $15,000 to $17,499 | 0 (0.0%) | 71 (10.2%) |
| $17,500 to $19,999 | 22 (4.2%) | 22 (3.2%) |
| $20,000 to $22,499 | 17 (3.2%) | 13 (1.9%) |
| $22,500 to $24,999 | 30 (5.7%) | 35 (5.0%) |
| $25,000 to $29,999 | 8 (1.5%) | 51 (7.3%) |
| $30,000 to $34,999 | 19 (3.6%) | 26 (3.7%) |
| $35,000 to $39,999 | 46 (8.7%) | 19 (2.7%) |
| $40,000 to $44,999 | 49 (9.3%) | 0 (0.0%) |
| $45,000 to $49,999 | 33 (6.3%) | 11 (1.6%) |
| $50,000 to $54,999 | 18 (3.4%) | 26 (3.7%) |
| $55,000 to $64,999 | 30 (5.7%) | 71 (10.2%) |
| $65,000 to $74,999 | 41 (7.8%) | 25 (3.6%) |
| $75,000 to $99,999 | 44 (8.4%) | 25 (3.6%) |
| $100,000+ | 104 (19.8%) | 0 (0.0%) |
| Total | 526 (100.0%) | 698 (100.0%) |
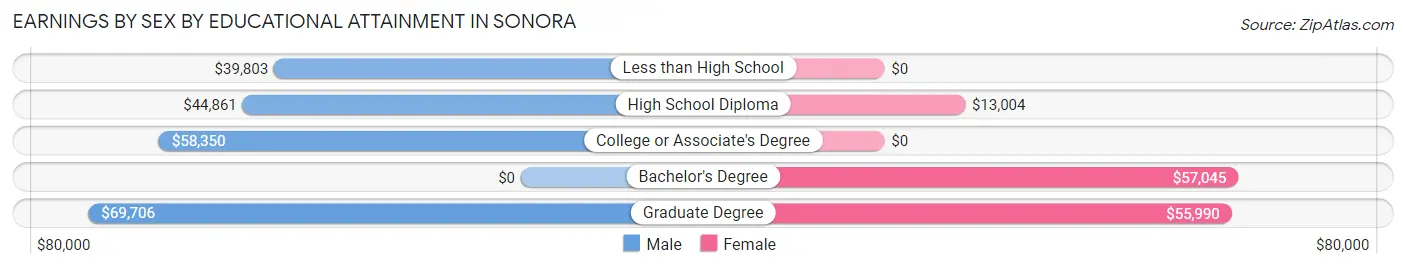
Earnings by Sex by Educational Attainment in Sonora
Average earnings in Sonora are $49,191 for men and $17,113 for women, a difference of 65.2%. Men with an educational attainment of graduate degree enjoy the highest average annual earnings of $69,706, while those with less than high school education earn the least with $39,803. Women with an educational attainment of bachelor's degree earn the most with the average annual earnings of $57,045, while those with high school diploma education have the smallest earnings of $13,004.
| Educational Attainment | Male Income | Female Income |
| Less than High School | $39,803 | $0 |
| High School Diploma | $44,861 | $13,004 |
| College or Associate's Degree | $58,350 | $0 |
| Bachelor's Degree | - | - |
| Graduate Degree | $69,706 | $55,990 |
| Total | $49,191 | $17,113 |
Family Income in Sonora
Family Income Brackets in Sonora
According to the Sonora family income data, there are 161 families falling into the $50,000 to $74,999 income range, which is the most common income bracket and makes up 23.1% of all families. Conversely, the $10,000 to $14,999 income bracket is the least frequent group with only 5 families (0.7%) belonging to this category.
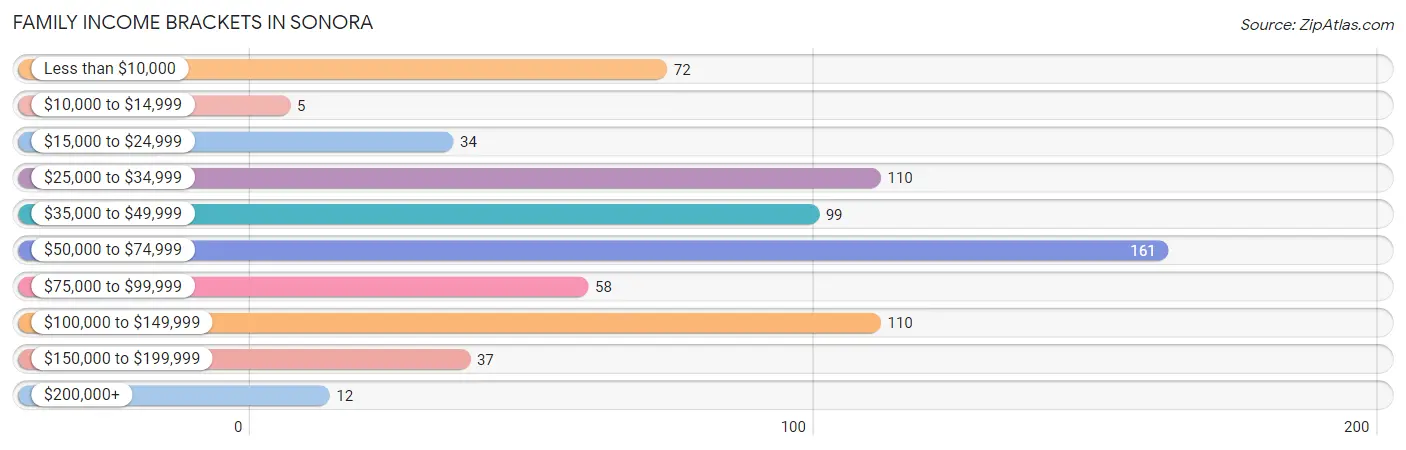
| Income Bracket | # Families | % Families |
| Less than $10,000 | 72 | 10.3% |
| $10,000 to $14,999 | 5 | 0.7% |
| $15,000 to $24,999 | 34 | 4.9% |
| $25,000 to $34,999 | 110 | 15.8% |
| $35,000 to $49,999 | 99 | 14.2% |
| $50,000 to $74,999 | 161 | 23.1% |
| $75,000 to $99,999 | 58 | 8.3% |
| $100,000 to $149,999 | 110 | 15.8% |
| $150,000 to $199,999 | 37 | 5.3% |
| $200,000+ | 12 | 1.7% |
Family Income by Famaliy Size in Sonora
4-person families (198 | 28.4%) account for the highest median family income in Sonora with $68,598 per family, while 3-person families (126 | 18.0%) have the highest median income of $18,993 per family member.
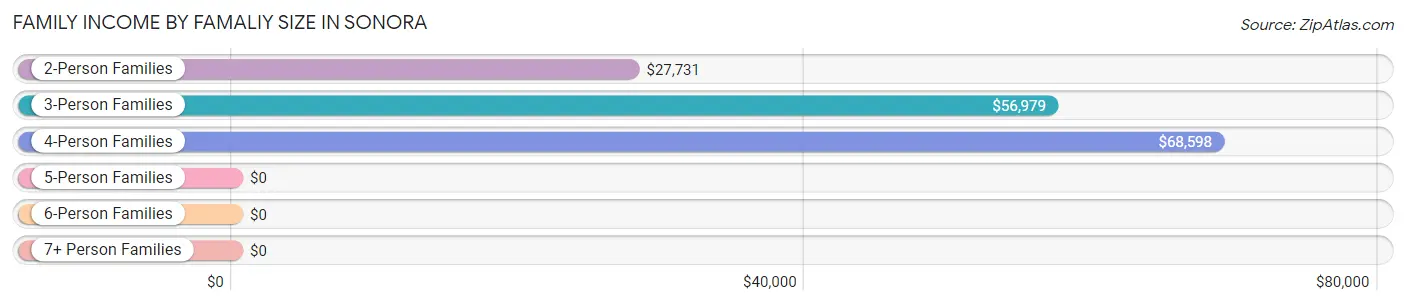
| Income Bracket | # Families | Median Income |
| 2-Person Families | 229 (32.8%) | $27,731 |
| 3-Person Families | 126 (18.0%) | $56,979 |
| 4-Person Families | 198 (28.4%) | $68,598 |
| 5-Person Families | 145 (20.8%) | $0 |
| 6-Person Families | 0 (0.0%) | $0 |
| 7+ Person Families | 0 (0.0%) | $0 |
| Total | 698 (100.0%) | $55,104 |
Family Income by Number of Earners in Sonora
The median family income in Sonora is $55,104, with families comprising 3+ earners (40) having the highest median family income of $140,900, while families with no earners (64) have the lowest median family income of $22,813, accounting for 5.7% and 9.2% of families, respectively.
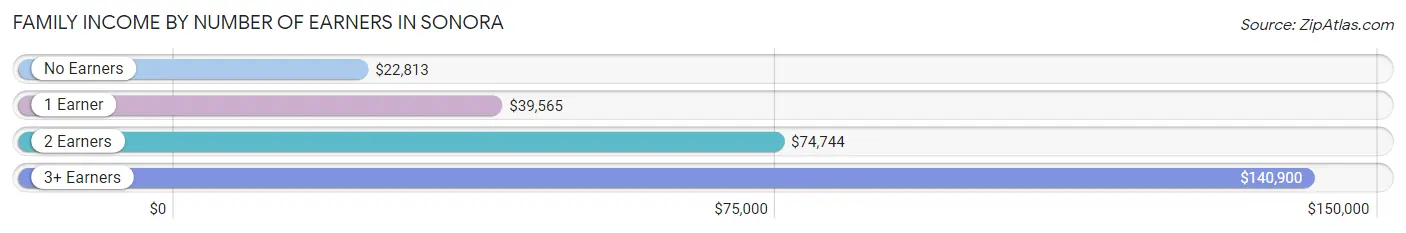
| Number of Earners | # Families | Median Income |
| No Earners | 64 (9.2%) | $22,813 |
| 1 Earner | 342 (49.0%) | $39,565 |
| 2 Earners | 252 (36.1%) | $74,744 |
| 3+ Earners | 40 (5.7%) | $140,900 |
| Total | 698 (100.0%) | $55,104 |
Household Income in Sonora
Household Income Brackets in Sonora
With 170 households falling in the category, the $50,000 to $74,999 income range is the most frequent in Sonora, accounting for 19.1% of all households. In contrast, only 12 households (1.3%) fall into the $200,000+ income bracket, making it the least populous group.
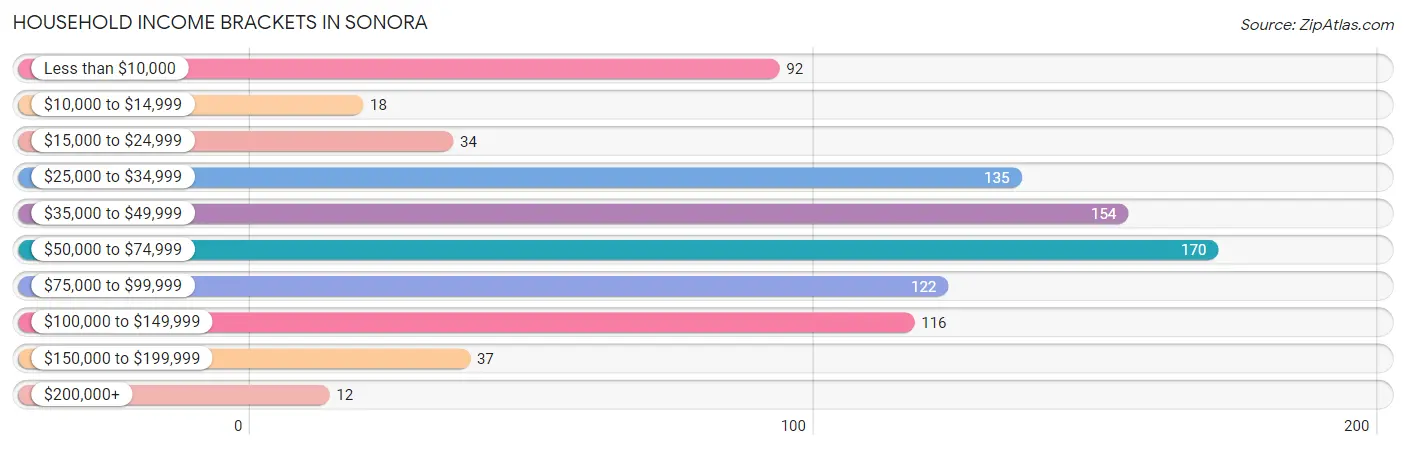
| Income Bracket | # Households | % Households |
| Less than $10,000 | 92 | 10.3% |
| $10,000 to $14,999 | 18 | 2.0% |
| $15,000 to $24,999 | 34 | 3.8% |
| $25,000 to $34,999 | 135 | 15.2% |
| $35,000 to $49,999 | 154 | 17.3% |
| $50,000 to $74,999 | 170 | 19.1% |
| $75,000 to $99,999 | 122 | 13.7% |
| $100,000 to $149,999 | 116 | 13.0% |
| $150,000 to $199,999 | 37 | 4.2% |
| $200,000+ | 12 | 1.3% |
Household Income by Householder Age in Sonora
The median household income in Sonora is $53,400, with the highest median household income of $57,727 found in the 65+ years age bracket for the primary householder. A total of 220 households (24.7%) fall into this category. Meanwhile, the 15 to 24 years age bracket for the primary householder has the lowest median household income of $0, with 26 households (2.9%) in this group.
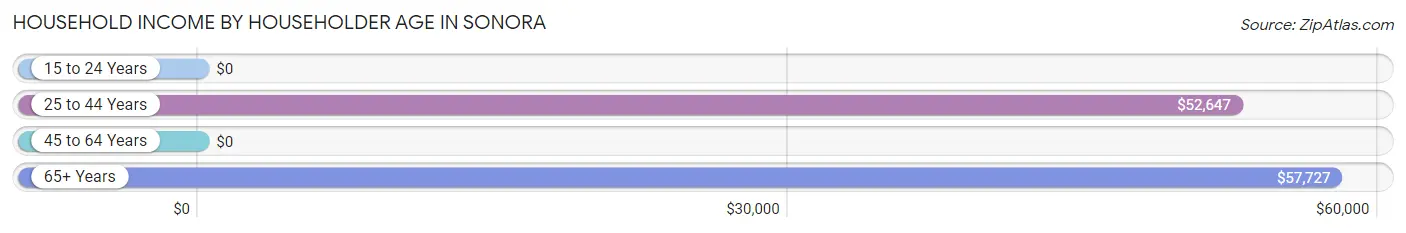
| Income Bracket | # Households | Median Income |
| 15 to 24 Years | 26 (2.9%) | $0 |
| 25 to 44 Years | 392 (44.0%) | $52,647 |
| 45 to 64 Years | 252 (28.3%) | $0 |
| 65+ Years | 220 (24.7%) | $57,727 |
| Total | 890 (100.0%) | $53,400 |
Poverty in Sonora
Income Below Poverty by Sex and Age in Sonora
With 16.9% poverty level for males and 21.6% for females among the residents of Sonora, under 5 year old males and 5 year old females are the most vulnerable to poverty, with 49 males (49.5%) and 22 females (100.0%) in their respective age groups living below the poverty level.
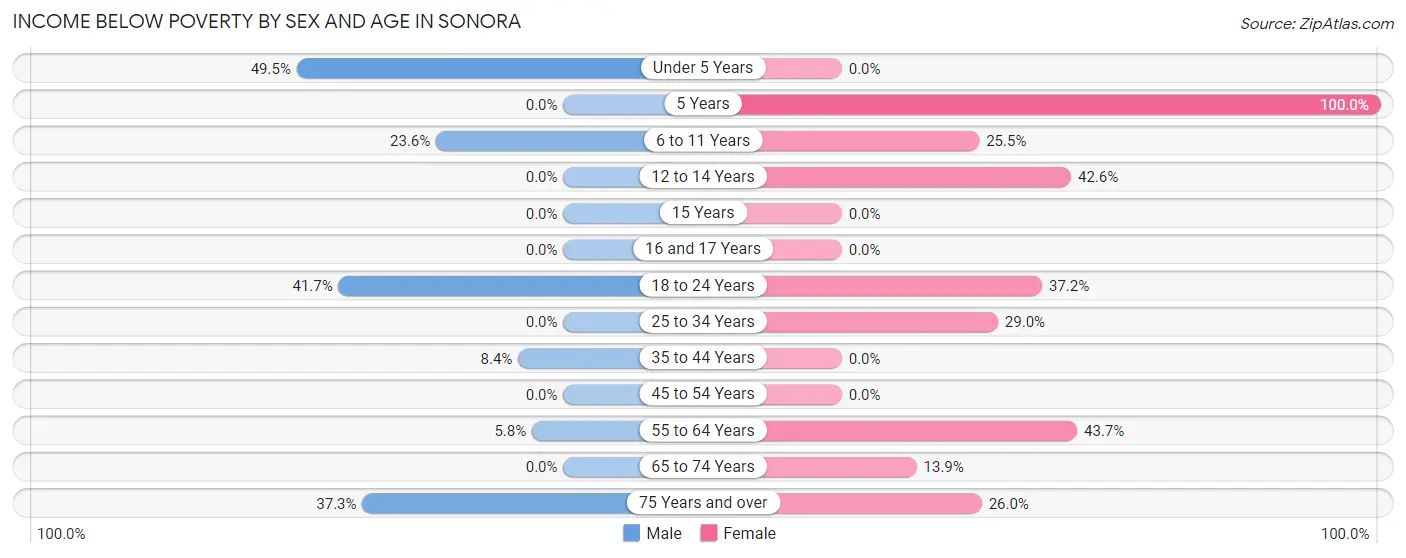
| Age Bracket | Male | Female |
| Under 5 Years | 49 (49.5%) | 0 (0.0%) |
| 5 Years | 0 (0.0%) | 22 (100.0%) |
| 6 to 11 Years | 77 (23.6%) | 62 (25.5%) |
| 12 to 14 Years | 0 (0.0%) | 40 (42.5%) |
| 15 Years | 0 (0.0%) | 0 (0.0%) |
| 16 and 17 Years | 0 (0.0%) | 0 (0.0%) |
| 18 to 24 Years | 58 (41.7%) | 42 (37.2%) |
| 25 to 34 Years | 0 (0.0%) | 82 (29.0%) |
| 35 to 44 Years | 13 (8.4%) | 0 (0.0%) |
| 45 to 54 Years | 0 (0.0%) | 0 (0.0%) |
| 55 to 64 Years | 5 (5.8%) | 38 (43.7%) |
| 65 to 74 Years | 0 (0.0%) | 15 (13.9%) |
| 75 Years and over | 25 (37.3%) | 20 (26.0%) |
| Total | 227 (16.9%) | 321 (21.6%) |
Income Above Poverty by Sex and Age in Sonora
According to the poverty statistics in Sonora, males aged 5 years and females aged under 5 years are the age groups that are most secure financially, with 100.0% of males and 100.0% of females in these age groups living above the poverty line.
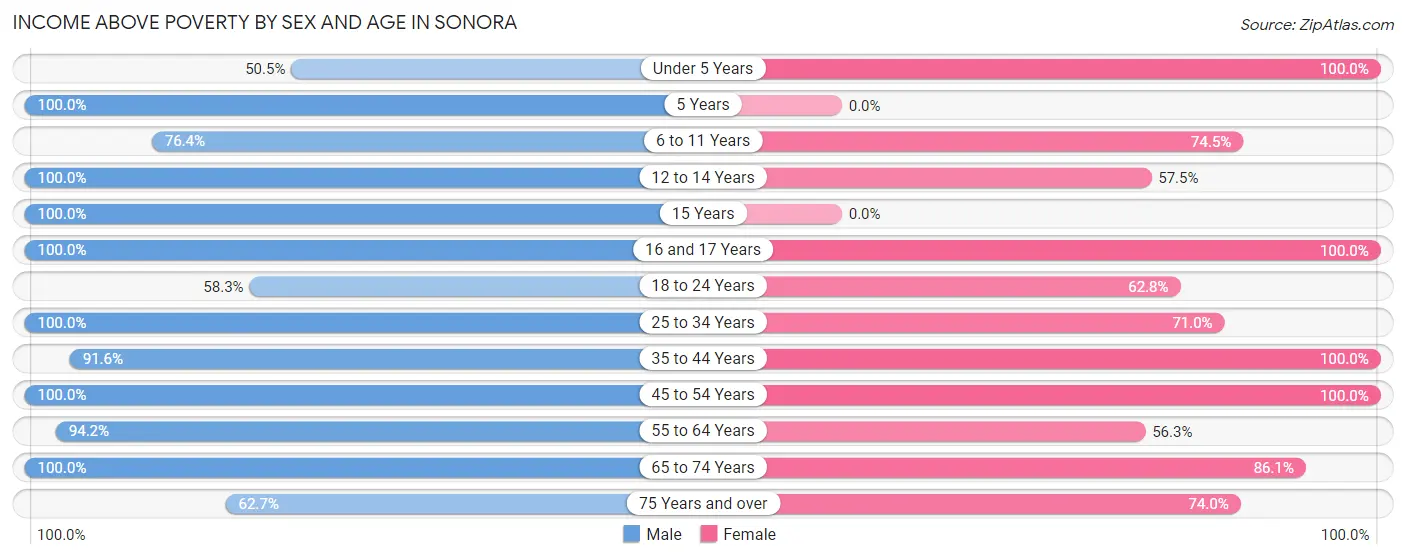
| Age Bracket | Male | Female |
| Under 5 Years | 50 (50.5%) | 78 (100.0%) |
| 5 Years | 41 (100.0%) | 0 (0.0%) |
| 6 to 11 Years | 249 (76.4%) | 181 (74.5%) |
| 12 to 14 Years | 57 (100.0%) | 54 (57.5%) |
| 15 Years | 16 (100.0%) | 0 (0.0%) |
| 16 and 17 Years | 18 (100.0%) | 16 (100.0%) |
| 18 to 24 Years | 81 (58.3%) | 71 (62.8%) |
| 25 to 34 Years | 137 (100.0%) | 201 (71.0%) |
| 35 to 44 Years | 142 (91.6%) | 293 (100.0%) |
| 45 to 54 Years | 100 (100.0%) | 75 (100.0%) |
| 55 to 64 Years | 81 (94.2%) | 49 (56.3%) |
| 65 to 74 Years | 103 (100.0%) | 93 (86.1%) |
| 75 Years and over | 42 (62.7%) | 57 (74.0%) |
| Total | 1,117 (83.1%) | 1,168 (78.4%) |
Income Below Poverty Among Married-Couple Families in Sonora
The poverty statistics for married-couple families in Sonora show that 1.1% or 5 of the total 445 families live below the poverty line. Families with no children have the highest poverty rate of 2.9%, comprising of 5 families. On the other hand, families with 1 or 2 children have the lowest poverty rate of 0.0%, which includes 0 families.
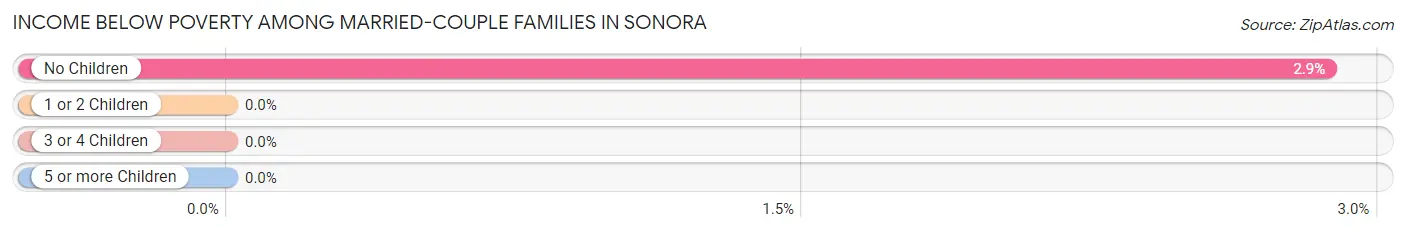
| Children | Above Poverty | Below Poverty |
| No Children | 169 (97.1%) | 5 (2.9%) |
| 1 or 2 Children | 227 (100.0%) | 0 (0.0%) |
| 3 or 4 Children | 44 (100.0%) | 0 (0.0%) |
| 5 or more Children | 0 (0.0%) | 0 (0.0%) |
| Total | 440 (98.9%) | 5 (1.1%) |
Income Below Poverty Among Single-Parent Households in Sonora
According to the poverty data in Sonora, 51.6% or 33 single-father households and 59.3% or 112 single-mother households are living below the poverty line. Among single-father households, those with no children have the highest poverty rate, with 33 households (100.0%) experiencing poverty. Likewise, among single-mother households, those with 3 or 4 children have the highest poverty rate, with 82 households (100.0%) falling below the poverty line.
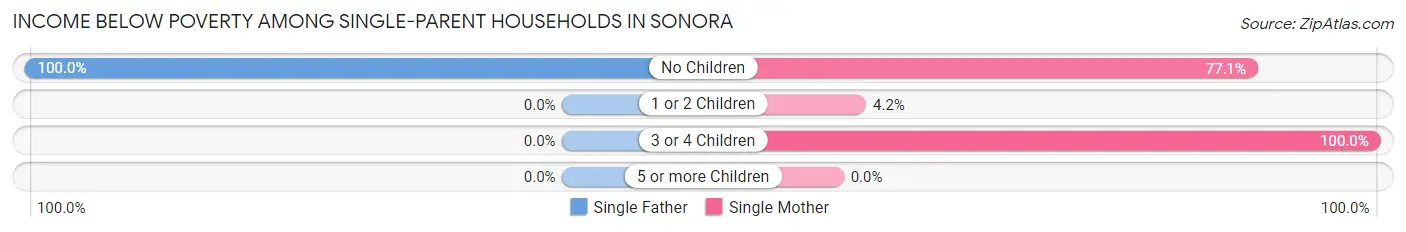
| Children | Single Father | Single Mother |
| No Children | 33 (100.0%) | 27 (77.1%) |
| 1 or 2 Children | 0 (0.0%) | 3 (4.2%) |
| 3 or 4 Children | 0 (0.0%) | 82 (100.0%) |
| 5 or more Children | 0 (0.0%) | 0 (0.0%) |
| Total | 33 (51.6%) | 112 (59.3%) |
Income Below Poverty Among Married-Couple vs Single-Parent Households in Sonora
The poverty data for Sonora shows that 5 of the married-couple family households (1.1%) and 145 of the single-parent households (57.3%) are living below the poverty level. Within the married-couple family households, those with no children have the highest poverty rate, with 5 households (2.9%) falling below the poverty line. Among the single-parent households, those with 3 or 4 children have the highest poverty rate, with 82 household (100.0%) living below poverty.
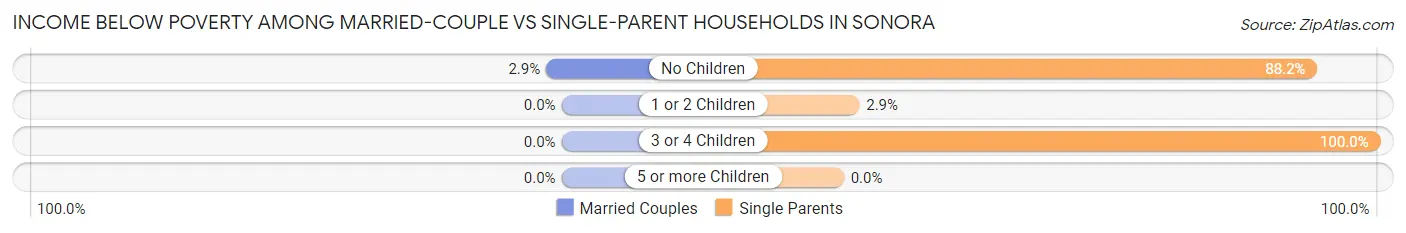
| Children | Married-Couple Families | Single-Parent Households |
| No Children | 5 (2.9%) | 60 (88.2%) |
| 1 or 2 Children | 0 (0.0%) | 3 (2.9%) |
| 3 or 4 Children | 0 (0.0%) | 82 (100.0%) |
| 5 or more Children | 0 (0.0%) | 0 (0.0%) |
| Total | 5 (1.1%) | 145 (57.3%) |
Race in Sonora
The most populous races in Sonora are Hispanic or Latino (2,230 | 78.2%), Some other Race (1,402 | 49.2%), and White / Caucasian (1,376 | 48.2%).
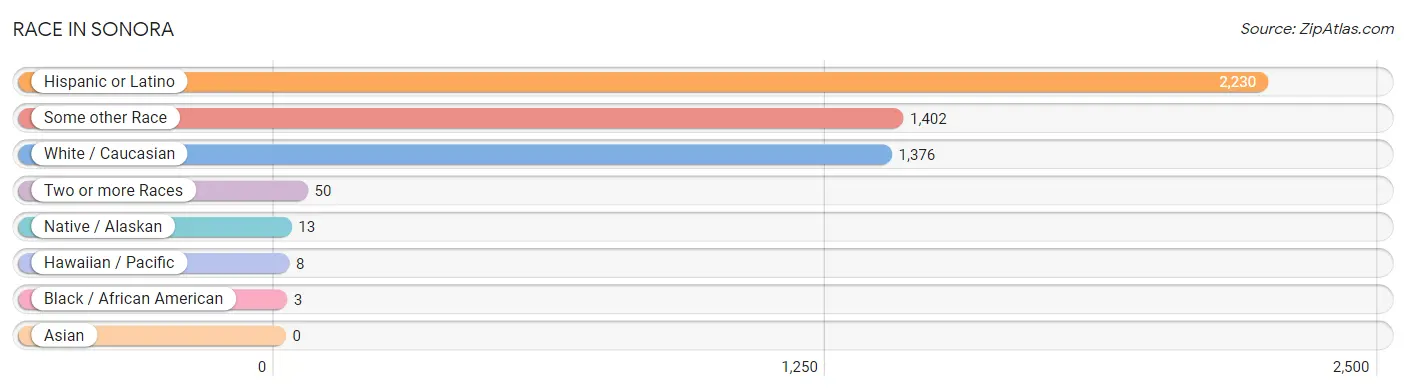
| Race | # Population | % Population |
| Asian | 0 | 0.0% |
| Black / African American | 3 | 0.1% |
| Hawaiian / Pacific | 8 | 0.3% |
| Hispanic or Latino | 2,230 | 78.2% |
| Native / Alaskan | 13 | 0.5% |
| White / Caucasian | 1,376 | 48.2% |
| Two or more Races | 50 | 1.8% |
| Some other Race | 1,402 | 49.2% |
| Total | 2,852 | 100.0% |
Ancestry in Sonora
The most populous ancestries reported in Sonora are Mexican (2,032 | 71.3%), Cuban (178 | 6.2%), Italian (105 | 3.7%), Irish (69 | 2.4%), and American (60 | 2.1%), together accounting for 85.7% of all Sonora residents.
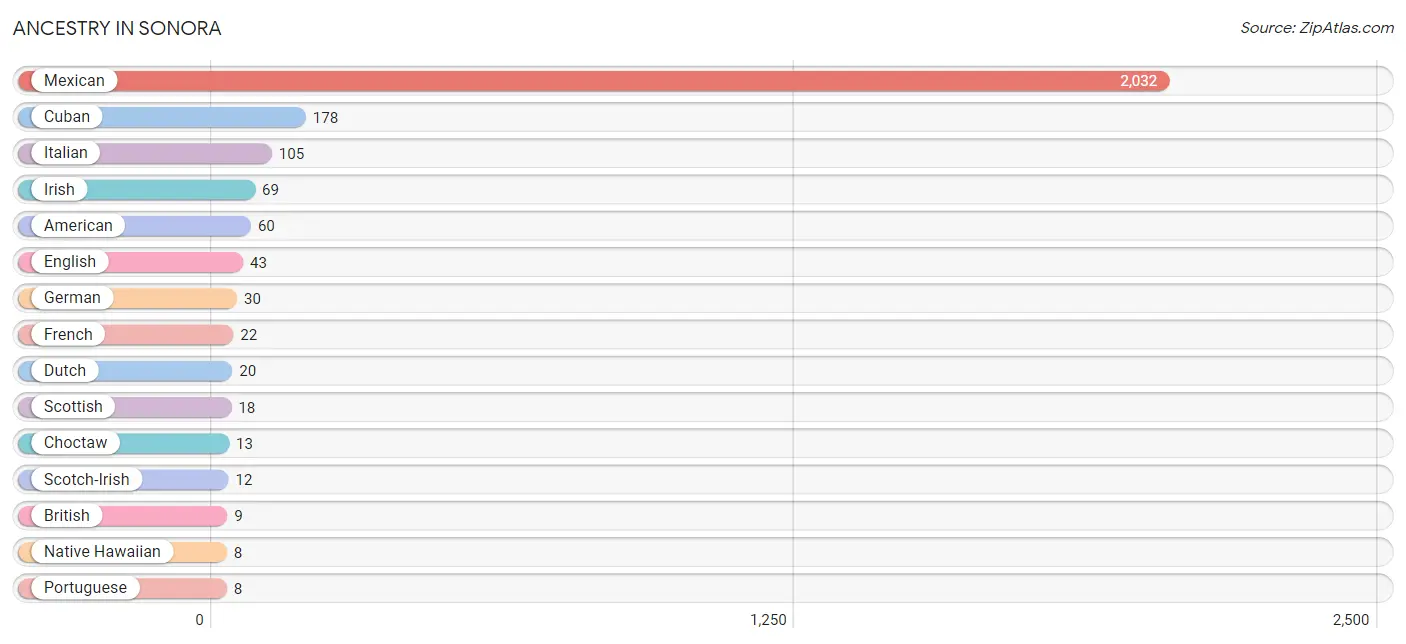
| Ancestry | # Population | % Population |
| African | 2 | 0.1% |
| American | 60 | 2.1% |
| British | 9 | 0.3% |
| Choctaw | 13 | 0.5% |
| Cuban | 178 | 6.2% |
| Dutch | 20 | 0.7% |
| English | 43 | 1.5% |
| French | 22 | 0.8% |
| French Canadian | 6 | 0.2% |
| German | 30 | 1.1% |
| Irish | 69 | 2.4% |
| Italian | 105 | 3.7% |
| Mexican | 2,032 | 71.3% |
| Native Hawaiian | 8 | 0.3% |
| Portuguese | 8 | 0.3% |
| Scotch-Irish | 12 | 0.4% |
| Scottish | 18 | 0.6% |
| Subsaharan African | 2 | 0.1% |
| Swedish | 8 | 0.3% | View All 19 Rows |
Immigrants in Sonora
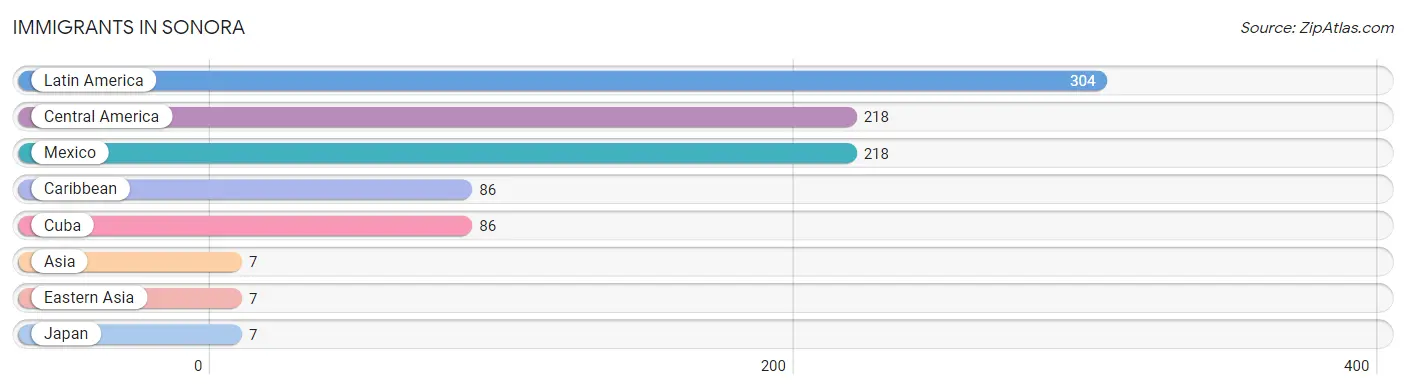
The most numerous immigrant groups reported in Sonora came from Latin America (304 | 10.7%), Central America (218 | 7.6%), Mexico (218 | 7.6%), Caribbean (86 | 3.0%), and Cuba (86 | 3.0%), together accounting for 32.0% of all Sonora residents.
| Immigration Origin | # Population | % Population |
| Asia | 7 | 0.3% |
| Caribbean | 86 | 3.0% |
| Central America | 218 | 7.6% |
| Cuba | 86 | 3.0% |
| Eastern Asia | 7 | 0.3% |
| Japan | 7 | 0.3% |
| Latin America | 304 | 10.7% |
| Mexico | 218 | 7.6% | View All 8 Rows |
Sex and Age in Sonora
Sex and Age in Sonora
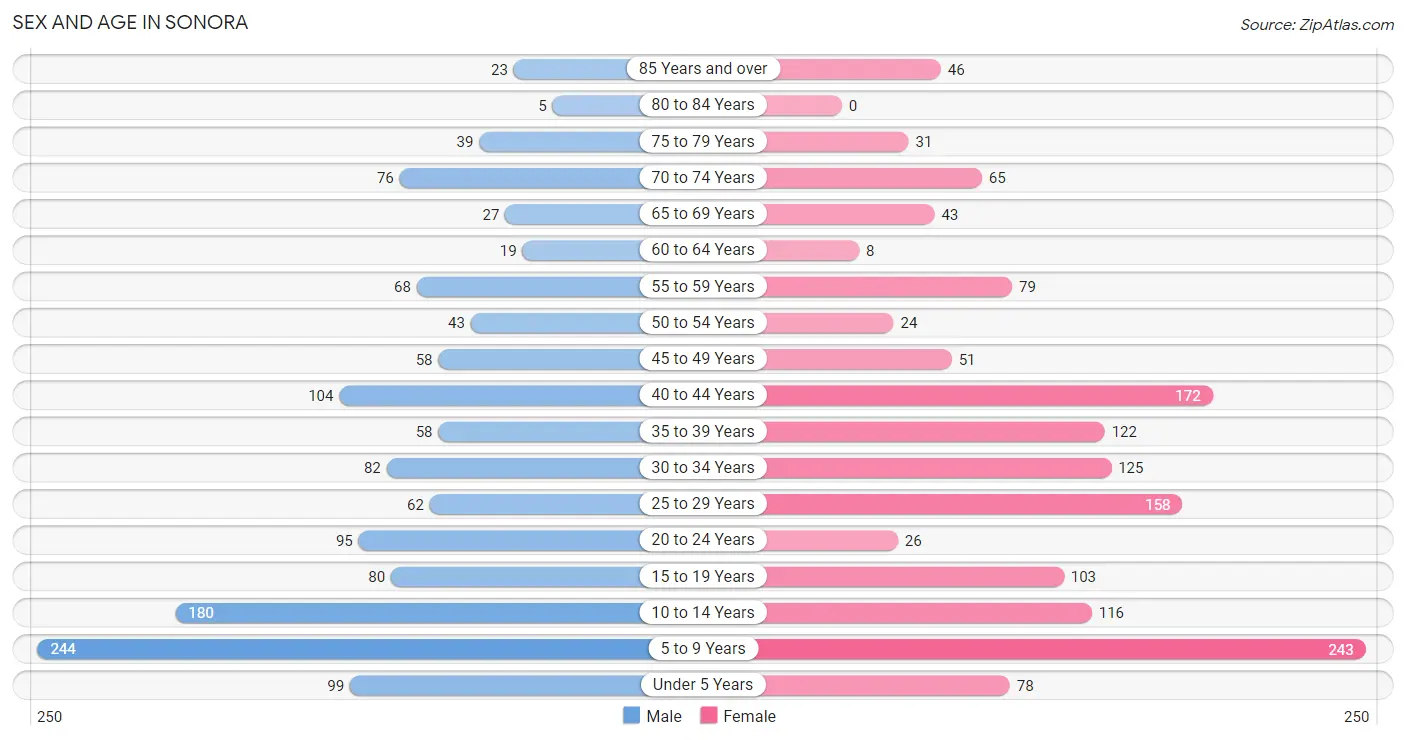
The most populous age groups in Sonora are 5 to 9 Years (244 | 17.9%) for men and 5 to 9 Years (243 | 16.3%) for women.
| Age Bracket | Male | Female |
| Under 5 Years | 99 (7.3%) | 78 (5.2%) |
| 5 to 9 Years | 244 (17.9%) | 243 (16.3%) |
| 10 to 14 Years | 180 (13.2%) | 116 (7.8%) |
| 15 to 19 Years | 80 (5.9%) | 103 (6.9%) |
| 20 to 24 Years | 95 (7.0%) | 26 (1.7%) |
| 25 to 29 Years | 62 (4.5%) | 158 (10.6%) |
| 30 to 34 Years | 82 (6.0%) | 125 (8.4%) |
| 35 to 39 Years | 58 (4.3%) | 122 (8.2%) |
| 40 to 44 Years | 104 (7.6%) | 172 (11.5%) |
| 45 to 49 Years | 58 (4.3%) | 51 (3.4%) |
| 50 to 54 Years | 43 (3.2%) | 24 (1.6%) |
| 55 to 59 Years | 68 (5.0%) | 79 (5.3%) |
| 60 to 64 Years | 19 (1.4%) | 8 (0.5%) |
| 65 to 69 Years | 27 (2.0%) | 43 (2.9%) |
| 70 to 74 Years | 76 (5.6%) | 65 (4.4%) |
| 75 to 79 Years | 39 (2.9%) | 31 (2.1%) |
| 80 to 84 Years | 5 (0.4%) | 0 (0.0%) |
| 85 Years and over | 23 (1.7%) | 46 (3.1%) |
| Total | 1,362 (100.0%) | 1,490 (100.0%) |
Families and Households in Sonora
Median Family Size in Sonora
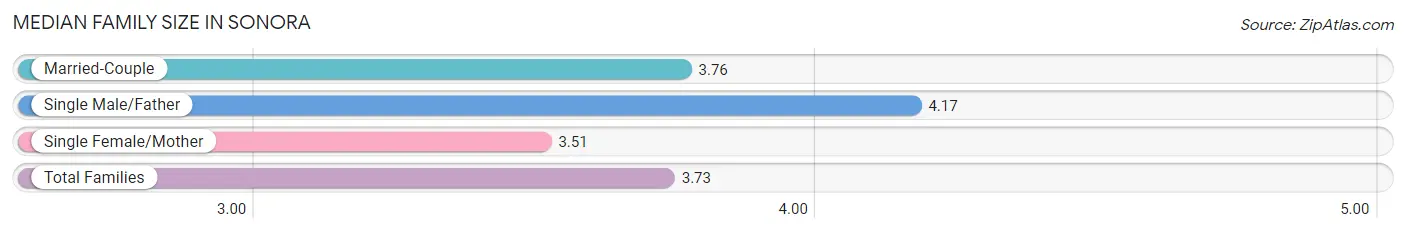
The median family size in Sonora is 3.73 persons per family, with single male/father families (64 | 9.2%) accounting for the largest median family size of 4.17 persons per family. On the other hand, single female/mother families (189 | 27.1%) represent the smallest median family size with 3.51 persons per family.
| Family Type | # Families | Family Size |
| Married-Couple | 445 (63.7%) | 3.76 |
| Single Male/Father | 64 (9.2%) | 4.17 |
| Single Female/Mother | 189 (27.1%) | 3.51 |
| Total Families | 698 (100.0%) | 3.73 |
Median Household Size in Sonora
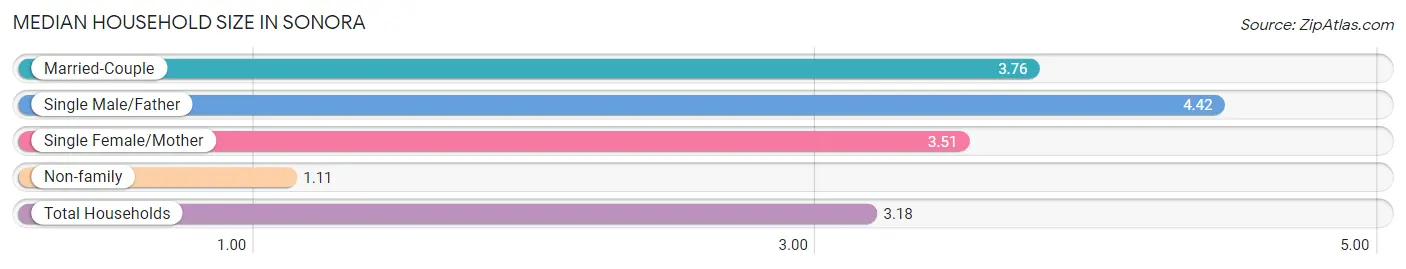
The median household size in Sonora is 3.18 persons per household, with single male/father households (64 | 7.2%) accounting for the largest median household size of 4.42 persons per household. non-family households (192 | 21.6%) represent the smallest median household size with 1.11 persons per household.
| Household Type | # Households | Household Size |
| Married-Couple | 445 (50.0%) | 3.76 |
| Single Male/Father | 64 (7.2%) | 4.42 |
| Single Female/Mother | 189 (21.2%) | 3.51 |
| Non-family | 192 (21.6%) | 1.11 |
| Total Households | 890 (100.0%) | 3.18 |
Household Size by Marriage Status in Sonora
Out of a total of 890 households in Sonora, 698 (78.4%) are family households, while 192 (21.6%) are nonfamily households. The most numerous type of family households are 2-person households, comprising 216, and the most common type of nonfamily households are 1-person households, comprising 181.
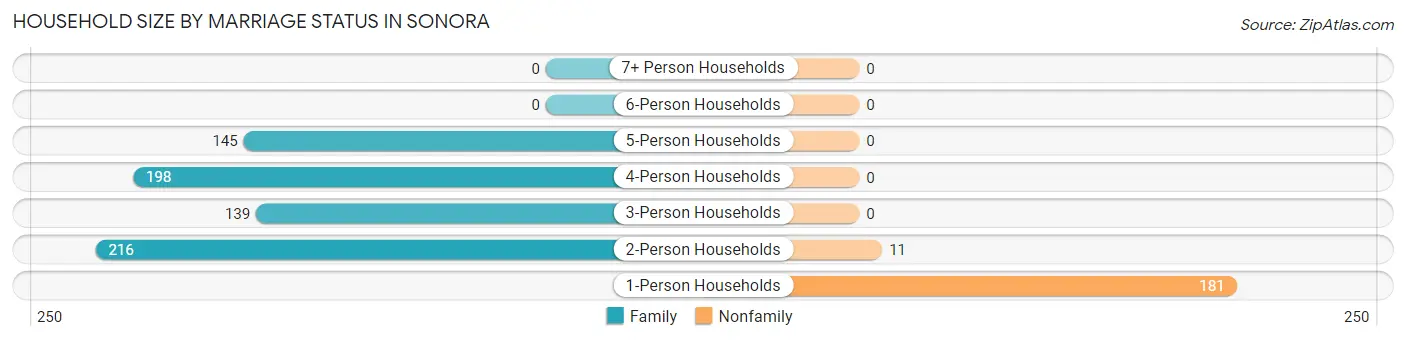
| Household Size | Family Households | Nonfamily Households |
| 1-Person Households | - | 181 (20.3%) |
| 2-Person Households | 216 (24.3%) | 11 (1.2%) |
| 3-Person Households | 139 (15.6%) | 0 (0.0%) |
| 4-Person Households | 198 (22.3%) | 0 (0.0%) |
| 5-Person Households | 145 (16.3%) | 0 (0.0%) |
| 6-Person Households | 0 (0.0%) | 0 (0.0%) |
| 7+ Person Households | 0 (0.0%) | 0 (0.0%) |
| Total | 698 (78.4%) | 192 (21.6%) |
Female Fertility in Sonora
Fertility by Age in Sonora
Average fertility rate in Sonora is 87.0 births per 1,000 women. Women in the age bracket of 35 to 50 years have the highest fertility rate with 149.0 births per 1,000 women. Women in the age bracket of 35 to 50 years acount for 78.8% of all women with births.
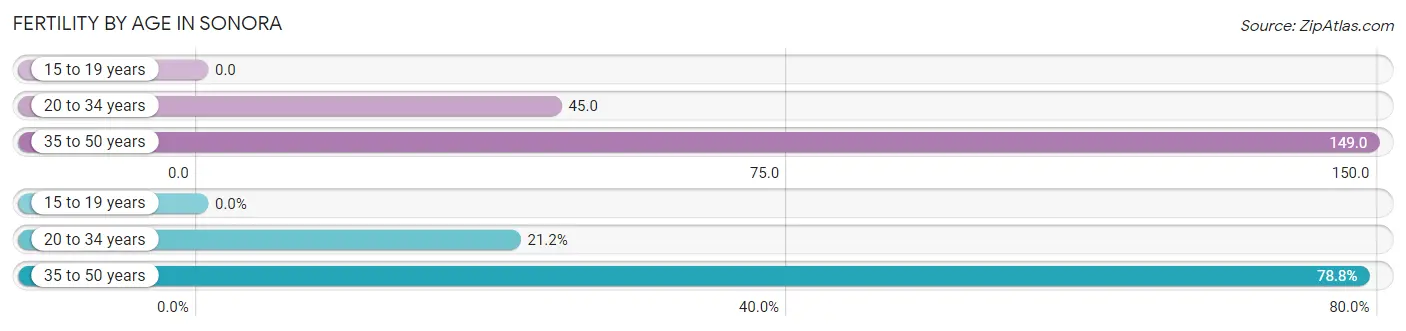
| Age Bracket | Women with Births | Births / 1,000 Women |
| 15 to 19 years | 0 (0.0%) | 0.0 |
| 20 to 34 years | 14 (21.2%) | 45.0 |
| 35 to 50 years | 52 (78.8%) | 149.0 |
| Total | 66 (100.0%) | 87.0 |
Fertility by Age by Marriage Status in Sonora
95.5% of women with births (66) in Sonora are married. The highest percentage of unmarried women with births falls into 20 to 34 years age bracket with 21.4% of them unmarried at the time of birth, while the lowest percentage of unmarried women with births belong to 35 to 50 years age bracket with 0.0% of them unmarried.
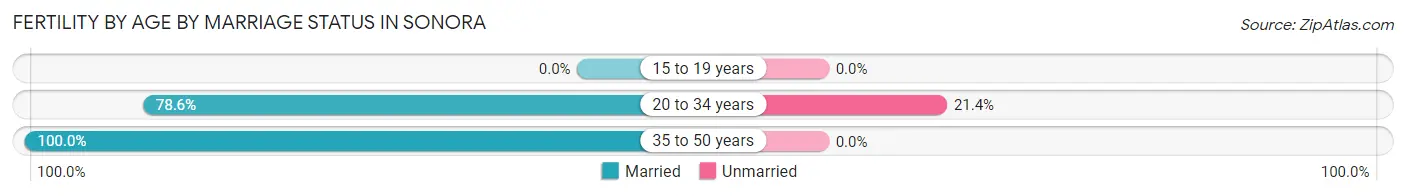
| Age Bracket | Married | Unmarried |
| 15 to 19 years | 0 (0.0%) | 0 (0.0%) |
| 20 to 34 years | 11 (78.6%) | 3 (21.4%) |
| 35 to 50 years | 52 (100.0%) | 0 (0.0%) |
| Total | 63 (95.5%) | 3 (4.5%) |
Fertility by Education in Sonora
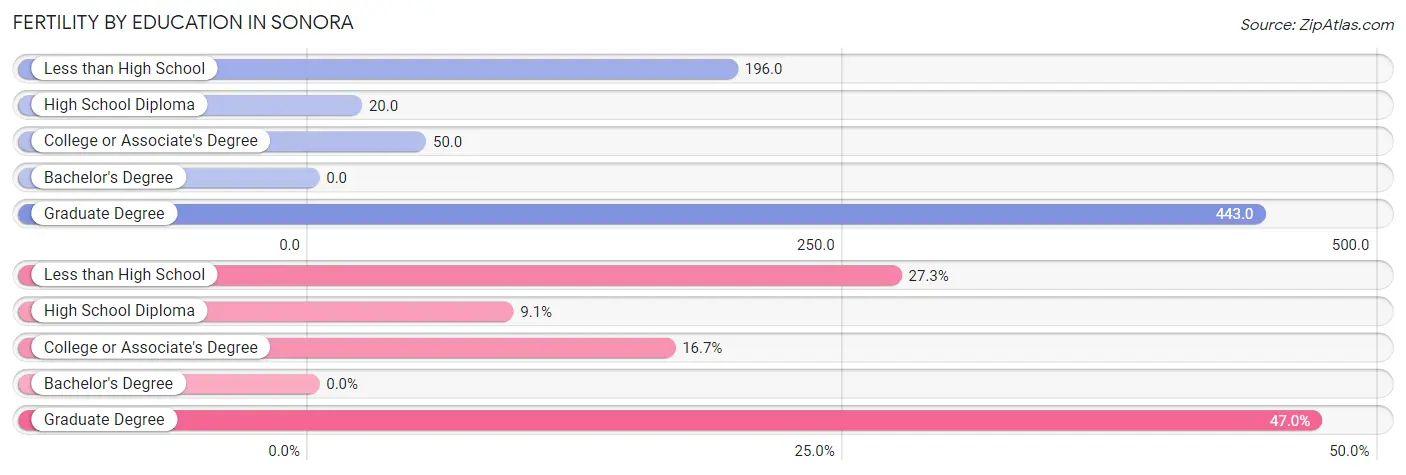
| Educational Attainment | Women with Births | Births / 1,000 Women |
| Less than High School | 18 (27.3%) | 196.0 |
| High School Diploma | 6 (9.1%) | 20.0 |
| College or Associate's Degree | 11 (16.7%) | 50.0 |
| Bachelor's Degree | 0 (0.0%) | 0.0 |
| Graduate Degree | 31 (47.0%) | 443.0 |
| Total | 66 (100.0%) | 87.0 |
Fertility by Education by Marriage Status in Sonora
4.5% of women with births in Sonora are unmarried. Women with the educational attainment of less than high school are most likely to be married with 100.0% of them married at childbirth, while women with the educational attainment of high school diploma are least likely to be married with 50.0% of them unmarried at childbirth.
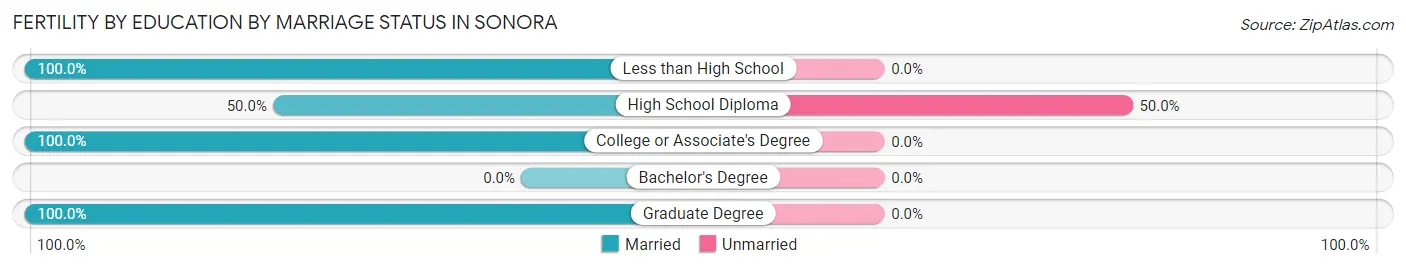
| Educational Attainment | Married | Unmarried |
| Less than High School | 18 (100.0%) | 0 (0.0%) |
| High School Diploma | 3 (50.0%) | 3 (50.0%) |
| College or Associate's Degree | 11 (100.0%) | 0 (0.0%) |
| Bachelor's Degree | 0 (0.0%) | 0 (0.0%) |
| Graduate Degree | 31 (100.0%) | 0 (0.0%) |
| Total | 63 (95.5%) | 3 (4.5%) |
Employment Characteristics in Sonora
Employment by Class of Employer in Sonora
Among the 1,109 employed individuals in Sonora, private company employees (693 | 62.5%), self-employed (not incorporated) (112 | 10.1%), and local government employees (110 | 9.9%) make up the most common classes of employment.
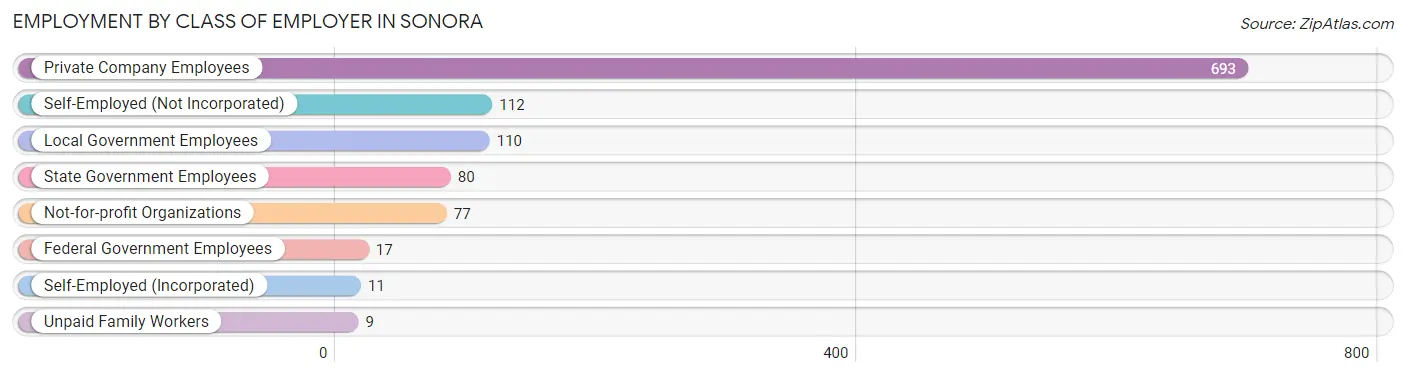
| Employer Class | # Employees | % Employees |
| Private Company Employees | 693 | 62.5% |
| Self-Employed (Incorporated) | 11 | 1.0% |
| Self-Employed (Not Incorporated) | 112 | 10.1% |
| Not-for-profit Organizations | 77 | 6.9% |
| Local Government Employees | 110 | 9.9% |
| State Government Employees | 80 | 7.2% |
| Federal Government Employees | 17 | 1.5% |
| Unpaid Family Workers | 9 | 0.8% |
| Total | 1,109 | 100.0% |
Employment Status by Age in Sonora
According to the labor force statistics for Sonora, out of the total population over 16 years of age (1,876), 62.6% or 1,174 individuals are in the labor force, with 4.8% or 56 of them unemployed. The age group with the highest labor force participation rate is 45 to 54 years, with 97.2% or 171 individuals in the labor force. Within the labor force, the 60 to 64 years age range has the highest percentage of unemployed individuals, with 41.2% or 7 of them being unemployed.
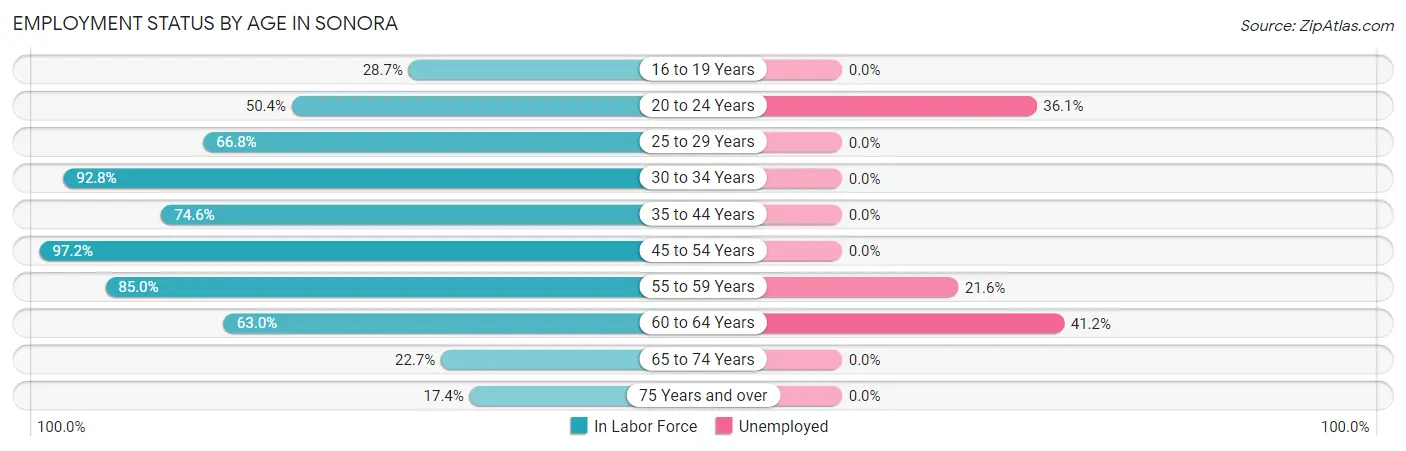
| Age Bracket | In Labor Force | Unemployed |
| 16 to 19 Years | 48 (28.7%) | 0 (0.0%) |
| 20 to 24 Years | 61 (50.4%) | 22 (36.1%) |
| 25 to 29 Years | 147 (66.8%) | 0 (0.0%) |
| 30 to 34 Years | 192 (92.8%) | 0 (0.0%) |
| 35 to 44 Years | 340 (74.6%) | 0 (0.0%) |
| 45 to 54 Years | 171 (97.2%) | 0 (0.0%) |
| 55 to 59 Years | 125 (85.0%) | 27 (21.6%) |
| 60 to 64 Years | 17 (63.0%) | 7 (41.2%) |
| 65 to 74 Years | 48 (22.7%) | 0 (0.0%) |
| 75 Years and over | 25 (17.4%) | 0 (0.0%) |
| Total | 1,174 (62.6%) | 56 (4.8%) |
Employment Status by Educational Attainment in Sonora
According to labor force statistics for Sonora, 80.5% of individuals (993) out of the total population between 25 and 64 years of age (1,233) are in the labor force, with 3.4% or 34 of them being unemployed. The group with the highest labor force participation rate are those with the educational attainment of high school diploma, with 84.4% or 411 individuals in the labor force. Within the labor force, individuals with high school diploma education have the highest percentage of unemployment, with 7.3% or 30 of them being unemployed.
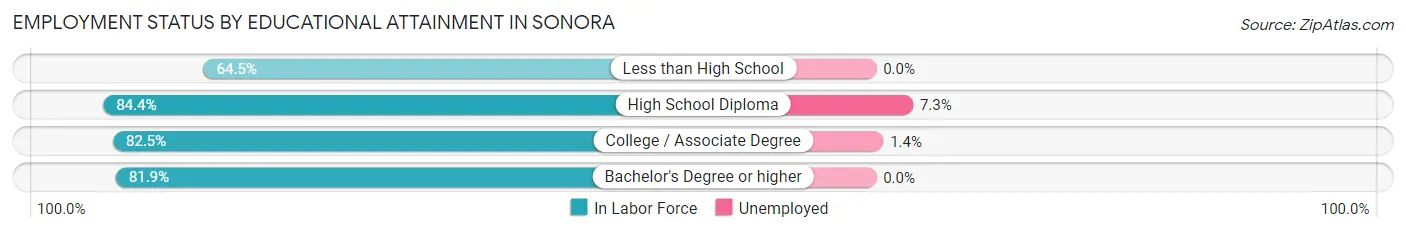
| Educational Attainment | In Labor Force | Unemployed |
| Less than High School | 118 (64.5%) | 0 (0.0%) |
| High School Diploma | 411 (84.4%) | 36 (7.3%) |
| College / Associate Degree | 296 (82.5%) | 5 (1.4%) |
| Bachelor's Degree or higher | 167 (81.9%) | 0 (0.0%) |
| Total | 993 (80.5%) | 42 (3.4%) |
Employment Occupations by Sex in Sonora
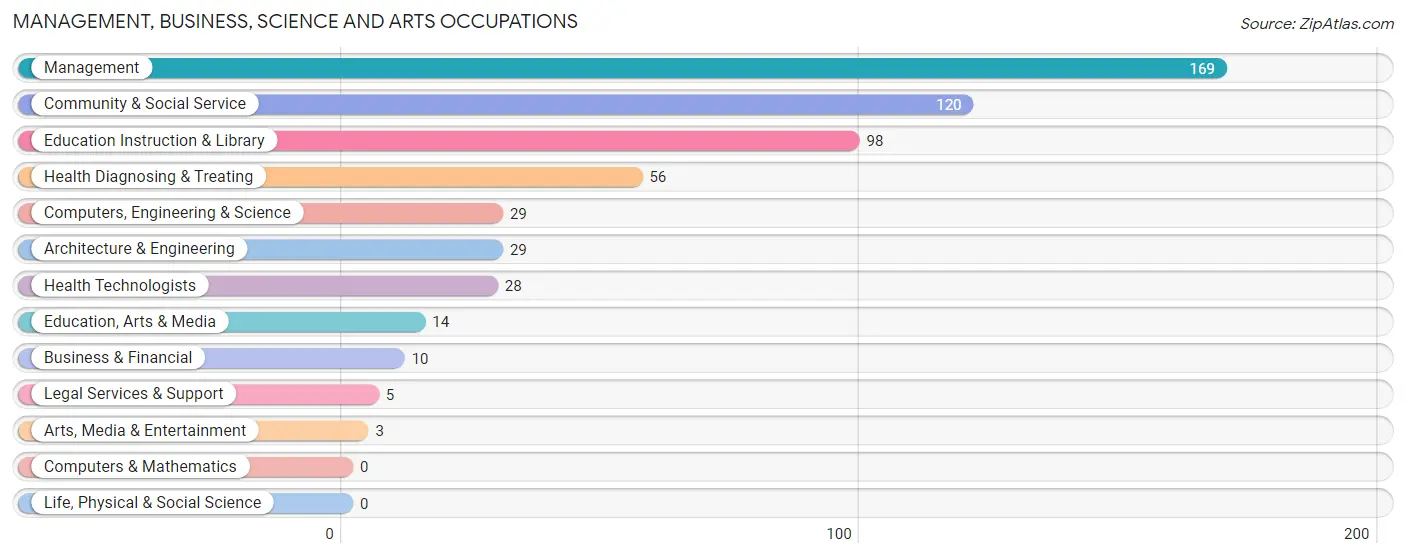
Management, Business, Science and Arts Occupations
The most common Management, Business, Science and Arts occupations in Sonora are Management (169 | 15.1%), Community & Social Service (120 | 10.7%), Education Instruction & Library (98 | 8.8%), Health Diagnosing & Treating (56 | 5.0%), and Computers, Engineering & Science (29 | 2.6%).
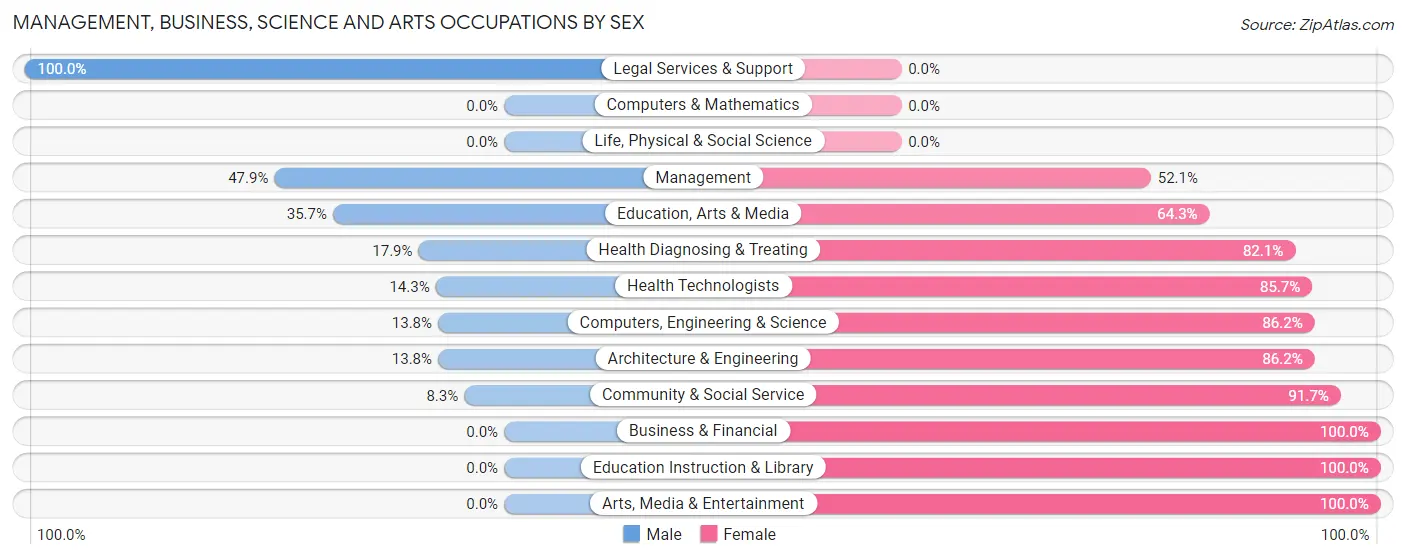
Management, Business, Science and Arts Occupations by Sex
Within the Management, Business, Science and Arts occupations in Sonora, the most male-oriented occupations are Legal Services & Support (100.0%), Management (47.9%), and Education, Arts & Media (35.7%), while the most female-oriented occupations are Business & Financial (100.0%), Education Instruction & Library (100.0%), and Arts, Media & Entertainment (100.0%).
| Occupation | Male | Female |
| Management | 81 (47.9%) | 88 (52.1%) |
| Business & Financial | 0 (0.0%) | 10 (100.0%) |
| Computers, Engineering & Science | 4 (13.8%) | 25 (86.2%) |
| Computers & Mathematics | 0 (0.0%) | 0 (0.0%) |
| Architecture & Engineering | 4 (13.8%) | 25 (86.2%) |
| Life, Physical & Social Science | 0 (0.0%) | 0 (0.0%) |
| Community & Social Service | 10 (8.3%) | 110 (91.7%) |
| Education, Arts & Media | 5 (35.7%) | 9 (64.3%) |
| Legal Services & Support | 5 (100.0%) | 0 (0.0%) |
| Education Instruction & Library | 0 (0.0%) | 98 (100.0%) |
| Arts, Media & Entertainment | 0 (0.0%) | 3 (100.0%) |
| Health Diagnosing & Treating | 10 (17.9%) | 46 (82.1%) |
| Health Technologists | 4 (14.3%) | 24 (85.7%) |
| Total (Category) | 105 (27.3%) | 279 (72.7%) |
| Total (Overall) | 466 (41.7%) | 652 (58.3%) |
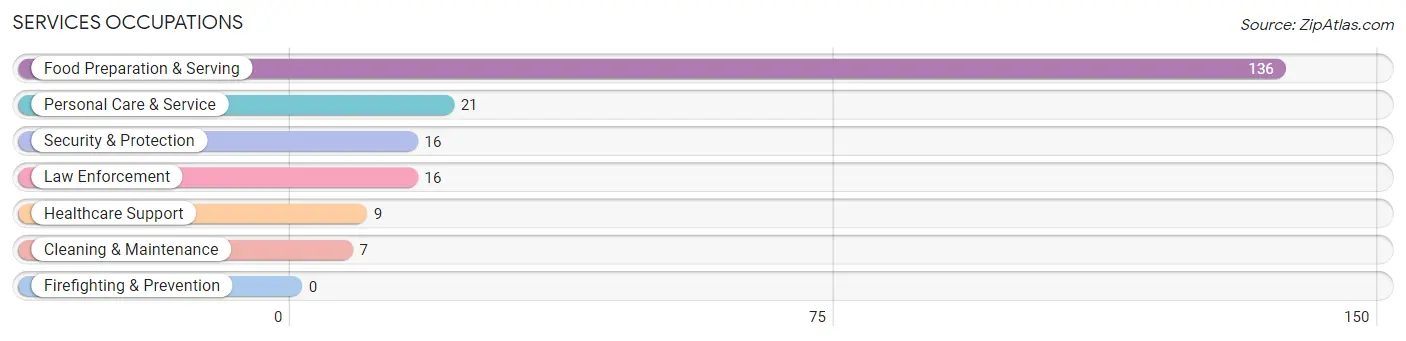
Services Occupations
The most common Services occupations in Sonora are Food Preparation & Serving (136 | 12.2%), Personal Care & Service (21 | 1.9%), Security & Protection (16 | 1.4%), Law Enforcement (16 | 1.4%), and Healthcare Support (9 | 0.8%).
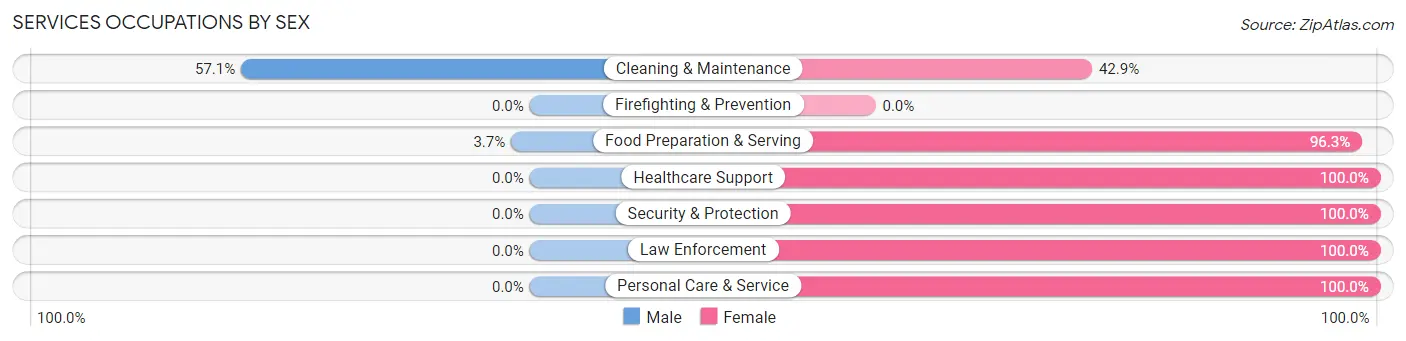
Services Occupations by Sex
Within the Services occupations in Sonora, the most male-oriented occupations are Cleaning & Maintenance (57.1%), and Food Preparation & Serving (3.7%), while the most female-oriented occupations are Healthcare Support (100.0%), Security & Protection (100.0%), and Law Enforcement (100.0%).
| Occupation | Male | Female |
| Healthcare Support | 0 (0.0%) | 9 (100.0%) |
| Security & Protection | 0 (0.0%) | 16 (100.0%) |
| Firefighting & Prevention | 0 (0.0%) | 0 (0.0%) |
| Law Enforcement | 0 (0.0%) | 16 (100.0%) |
| Food Preparation & Serving | 5 (3.7%) | 131 (96.3%) |
| Cleaning & Maintenance | 4 (57.1%) | 3 (42.9%) |
| Personal Care & Service | 0 (0.0%) | 21 (100.0%) |
| Total (Category) | 9 (4.8%) | 180 (95.2%) |
| Total (Overall) | 466 (41.7%) | 652 (58.3%) |
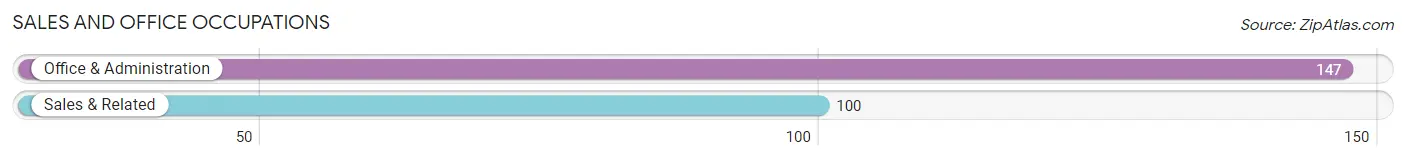
Sales and Office Occupations
The most common Sales and Office occupations in Sonora are Office & Administration (147 | 13.2%), and Sales & Related (100 | 8.9%).
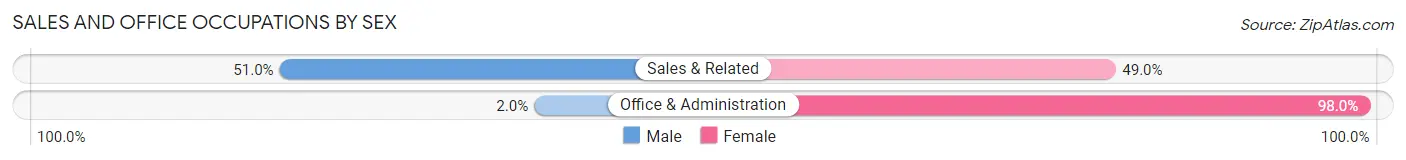
Sales and Office Occupations by Sex
| Occupation | Male | Female |
| Sales & Related | 51 (51.0%) | 49 (49.0%) |
| Office & Administration | 3 (2.0%) | 144 (98.0%) |
| Total (Category) | 54 (21.9%) | 193 (78.1%) |
| Total (Overall) | 466 (41.7%) | 652 (58.3%) |
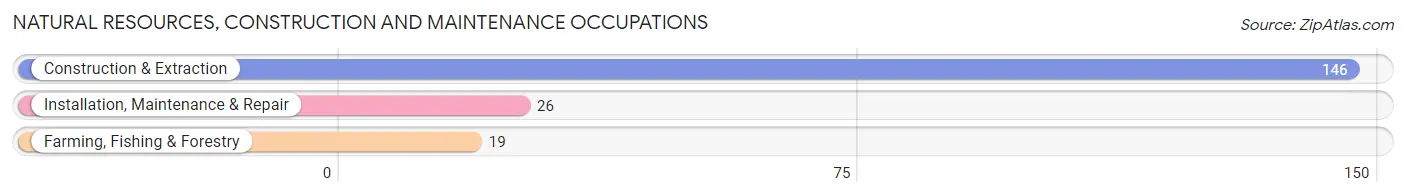
Natural Resources, Construction and Maintenance Occupations
The most common Natural Resources, Construction and Maintenance occupations in Sonora are Construction & Extraction (146 | 13.1%), Installation, Maintenance & Repair (26 | 2.3%), and Farming, Fishing & Forestry (19 | 1.7%).
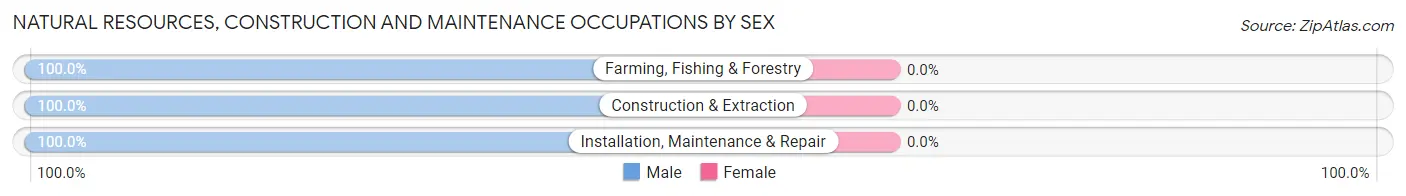
Natural Resources, Construction and Maintenance Occupations by Sex
| Occupation | Male | Female |
| Farming, Fishing & Forestry | 19 (100.0%) | 0 (0.0%) |
| Construction & Extraction | 146 (100.0%) | 0 (0.0%) |
| Installation, Maintenance & Repair | 26 (100.0%) | 0 (0.0%) |
| Total (Category) | 191 (100.0%) | 0 (0.0%) |
| Total (Overall) | 466 (41.7%) | 652 (58.3%) |
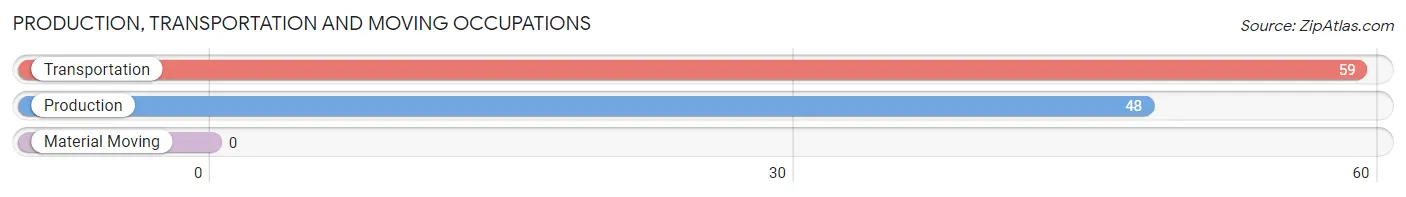
Production, Transportation and Moving Occupations
The most common Production, Transportation and Moving occupations in Sonora are Transportation (59 | 5.3%), and Production (48 | 4.3%).
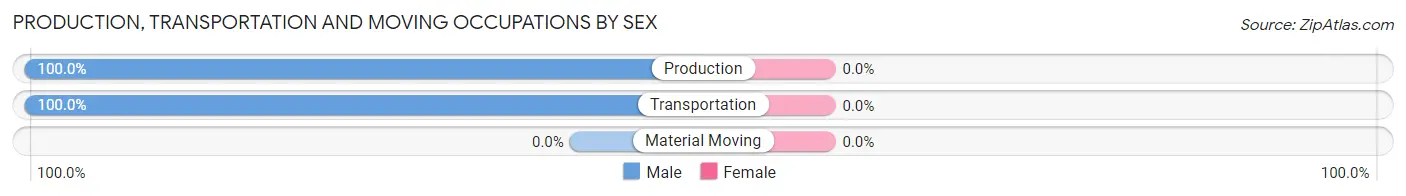
Production, Transportation and Moving Occupations by Sex
| Occupation | Male | Female |
| Production | 48 (100.0%) | 0 (0.0%) |
| Transportation | 59 (100.0%) | 0 (0.0%) |
| Material Moving | 0 (0.0%) | 0 (0.0%) |
| Total (Category) | 107 (100.0%) | 0 (0.0%) |
| Total (Overall) | 466 (41.7%) | 652 (58.3%) |
Employment Industries by Sex in Sonora
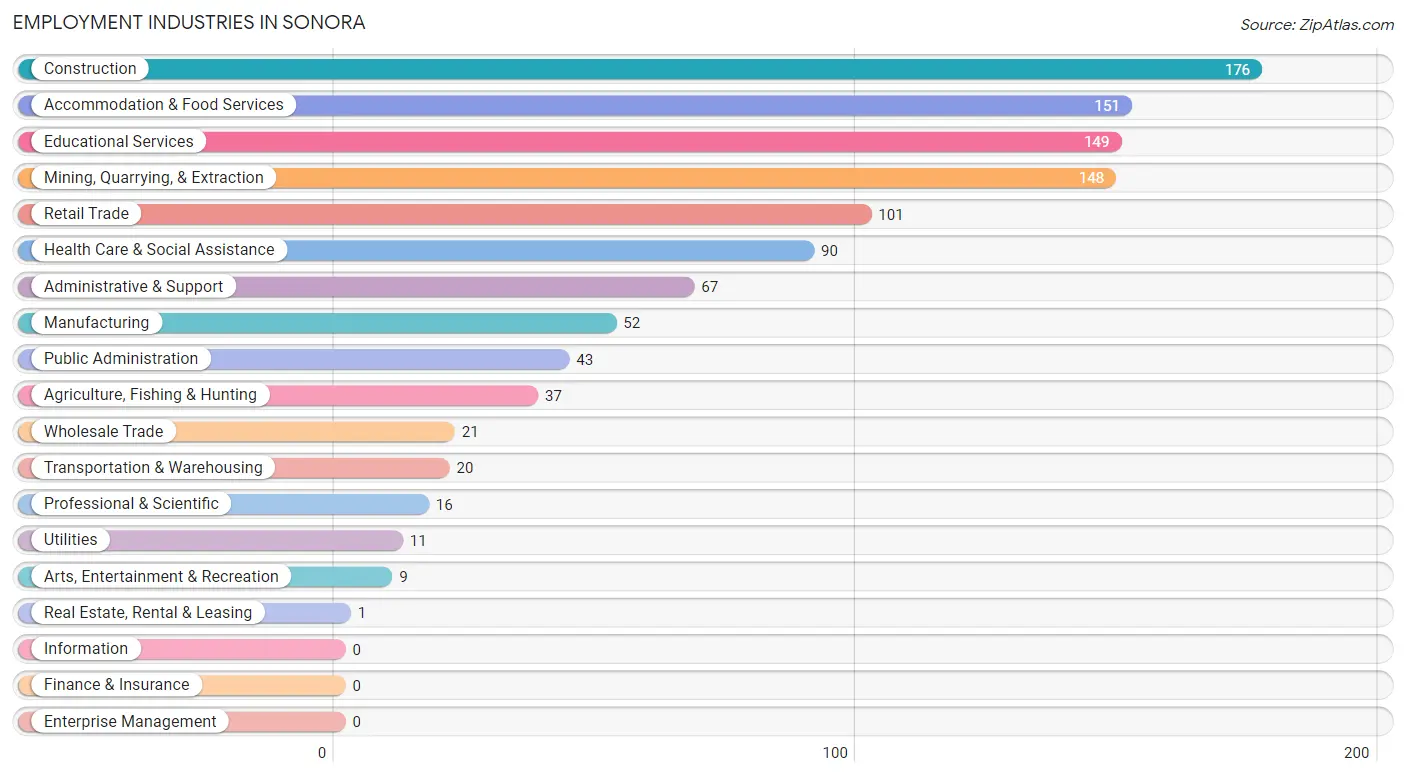
Employment Industries in Sonora
The major employment industries in Sonora include Construction (176 | 15.7%), Accommodation & Food Services (151 | 13.5%), Educational Services (149 | 13.3%), Mining, Quarrying, & Extraction (148 | 13.2%), and Retail Trade (101 | 9.0%).
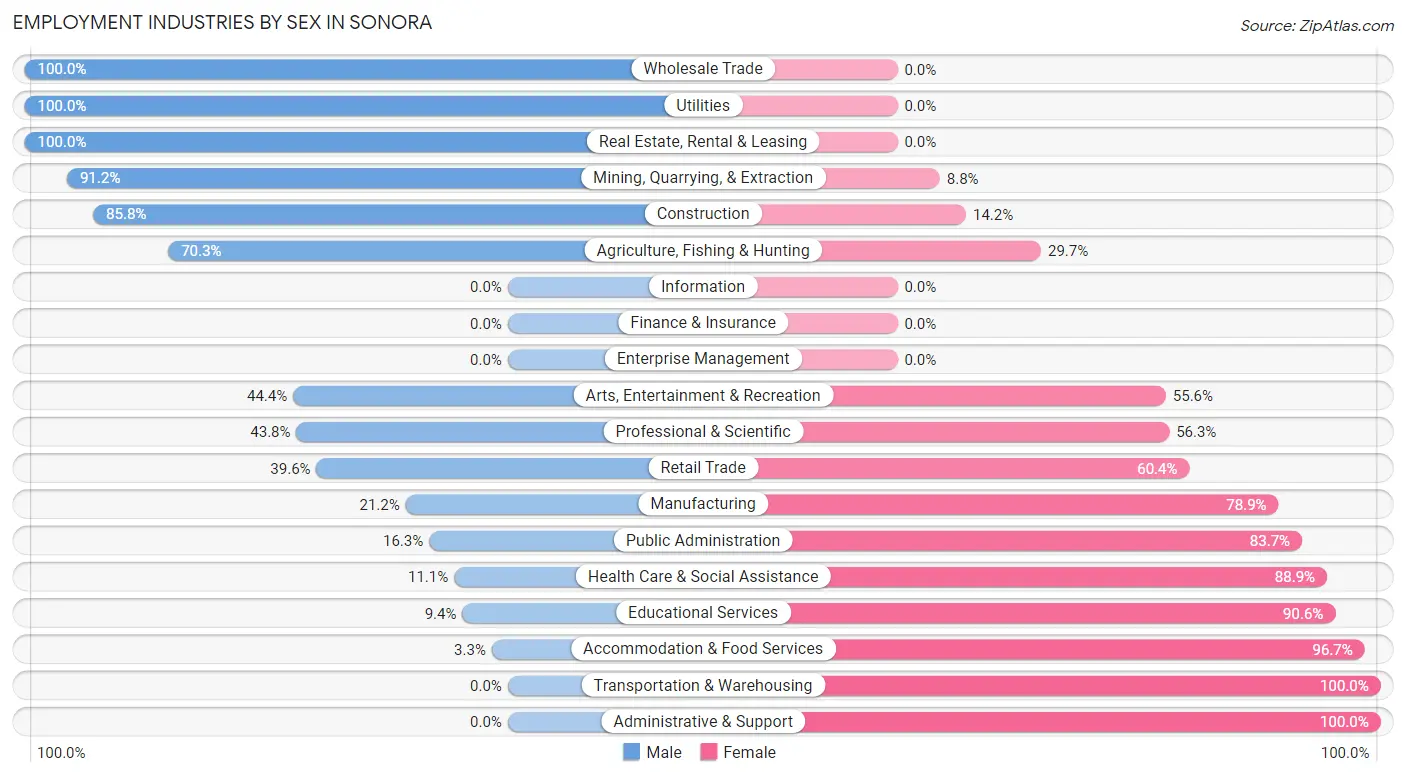
Employment Industries by Sex in Sonora
The Sonora industries that see more men than women are Wholesale Trade (100.0%), Utilities (100.0%), and Real Estate, Rental & Leasing (100.0%), whereas the industries that tend to have a higher number of women are Transportation & Warehousing (100.0%), Administrative & Support (100.0%), and Accommodation & Food Services (96.7%).
| Industry | Male | Female |
| Agriculture, Fishing & Hunting | 26 (70.3%) | 11 (29.7%) |
| Mining, Quarrying, & Extraction | 135 (91.2%) | 13 (8.8%) |
| Construction | 151 (85.8%) | 25 (14.2%) |
| Manufacturing | 11 (21.1%) | 41 (78.8%) |
| Wholesale Trade | 21 (100.0%) | 0 (0.0%) |
| Retail Trade | 40 (39.6%) | 61 (60.4%) |
| Transportation & Warehousing | 0 (0.0%) | 20 (100.0%) |
| Utilities | 11 (100.0%) | 0 (0.0%) |
| Information | 0 (0.0%) | 0 (0.0%) |
| Finance & Insurance | 0 (0.0%) | 0 (0.0%) |
| Real Estate, Rental & Leasing | 1 (100.0%) | 0 (0.0%) |
| Professional & Scientific | 7 (43.8%) | 9 (56.2%) |
| Enterprise Management | 0 (0.0%) | 0 (0.0%) |
| Administrative & Support | 0 (0.0%) | 67 (100.0%) |
| Educational Services | 14 (9.4%) | 135 (90.6%) |
| Health Care & Social Assistance | 10 (11.1%) | 80 (88.9%) |
| Arts, Entertainment & Recreation | 4 (44.4%) | 5 (55.6%) |
| Accommodation & Food Services | 5 (3.3%) | 146 (96.7%) |
| Public Administration | 7 (16.3%) | 36 (83.7%) |
| Total | 466 (41.7%) | 652 (58.3%) |
Education in Sonora
School Enrollment in Sonora
The most common levels of schooling among the 1,089 students in Sonora are elementary school (363 | 33.3%), middle school (253 | 23.2%), and high school (163 | 15.0%).
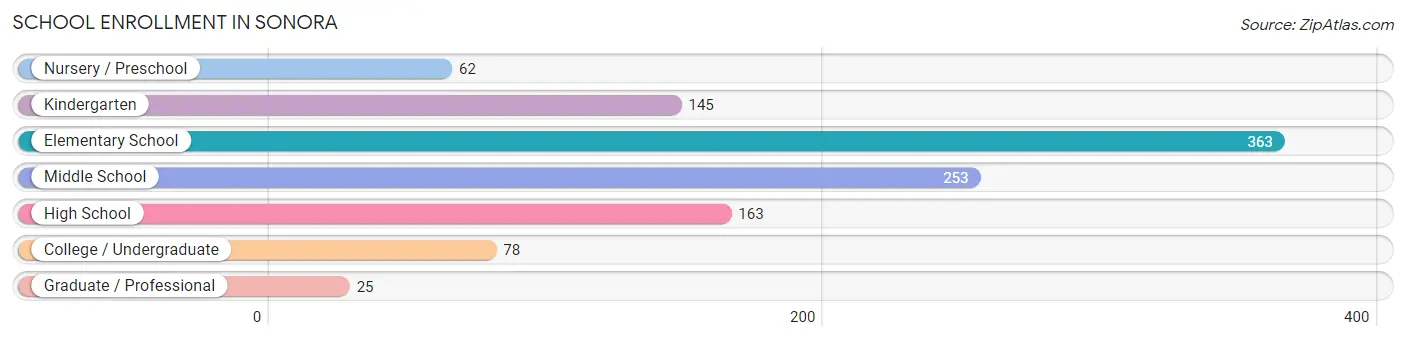
| School Level | # Students | % Students |
| Nursery / Preschool | 62 | 5.7% |
| Kindergarten | 145 | 13.3% |
| Elementary School | 363 | 33.3% |
| Middle School | 253 | 23.2% |
| High School | 163 | 15.0% |
| College / Undergraduate | 78 | 7.2% |
| Graduate / Professional | 25 | 2.3% |
| Total | 1,089 | 100.0% |
School Enrollment by Age by Funding Source in Sonora
Out of a total of 1,089 students who are enrolled in schools in Sonora, 2 (0.2%) attend a private institution, while the remaining 1,087 (99.8%) are enrolled in public schools. The age group of 3 to 4 year olds has the highest likelihood of being enrolled in private schools, with 2 (3.2% in the age bracket) enrolled. Conversely, the age group of 5 to 9 year old has the lowest likelihood of being enrolled in a private school, with 449 (100.0% in the age bracket) attending a public institution.
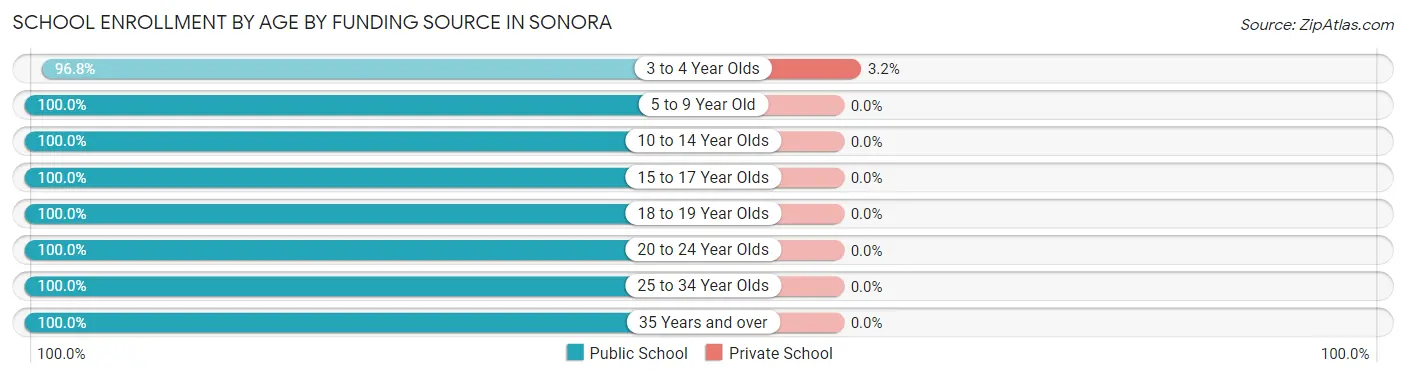
| Age Bracket | Public School | Private School |
| 3 to 4 Year Olds | 60 (96.8%) | 2 (3.2%) |
| 5 to 9 Year Old | 449 (100.0%) | 0 (0.0%) |
| 10 to 14 Year Olds | 296 (100.0%) | 0 (0.0%) |
| 15 to 17 Year Olds | 50 (100.0%) | 0 (0.0%) |
| 18 to 19 Year Olds | 133 (100.0%) | 0 (0.0%) |
| 20 to 24 Year Olds | 15 (100.0%) | 0 (0.0%) |
| 25 to 34 Year Olds | 41 (100.0%) | 0 (0.0%) |
| 35 Years and over | 43 (100.0%) | 0 (0.0%) |
| Total | 1,087 (99.8%) | 2 (0.2%) |
Educational Attainment by Field of Study in Sonora
Education (108 | 37.0%), bio, nature & agricultural (34 | 11.6%), business (31 | 10.6%), physical & health sciences (26 | 8.9%), and engineering (21 | 7.2%) are the most common fields of study among 292 individuals in Sonora who have obtained a bachelor's degree or higher.
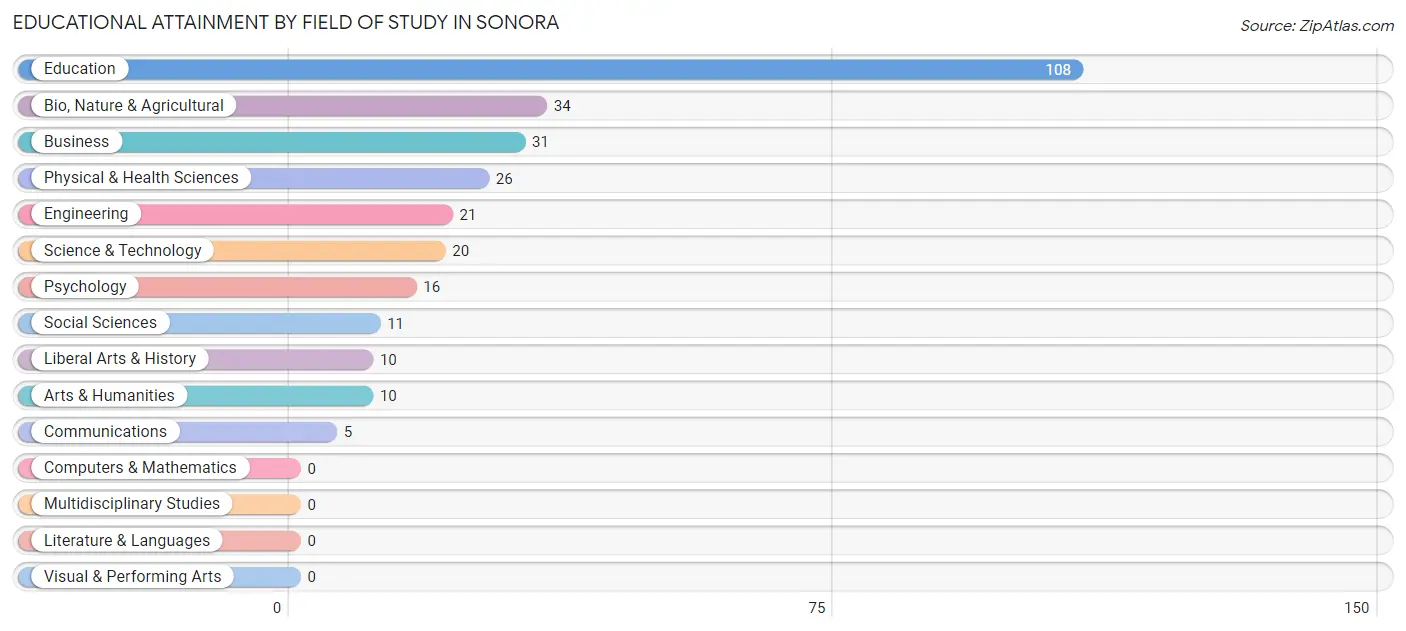
| Field of Study | # Graduates | % Graduates |
| Computers & Mathematics | 0 | 0.0% |
| Bio, Nature & Agricultural | 34 | 11.6% |
| Physical & Health Sciences | 26 | 8.9% |
| Psychology | 16 | 5.5% |
| Social Sciences | 11 | 3.8% |
| Engineering | 21 | 7.2% |
| Multidisciplinary Studies | 0 | 0.0% |
| Science & Technology | 20 | 6.9% |
| Business | 31 | 10.6% |
| Education | 108 | 37.0% |
| Literature & Languages | 0 | 0.0% |
| Liberal Arts & History | 10 | 3.4% |
| Visual & Performing Arts | 0 | 0.0% |
| Communications | 5 | 1.7% |
| Arts & Humanities | 10 | 3.4% |
| Total | 292 | 100.0% |
Transportation & Commute in Sonora
Vehicle Availability by Sex in Sonora
The most prevalent vehicle ownership categories in Sonora are males with 2 vehicles (246, accounting for 52.8%) and females with 2 vehicles (309, making up 38.3%).
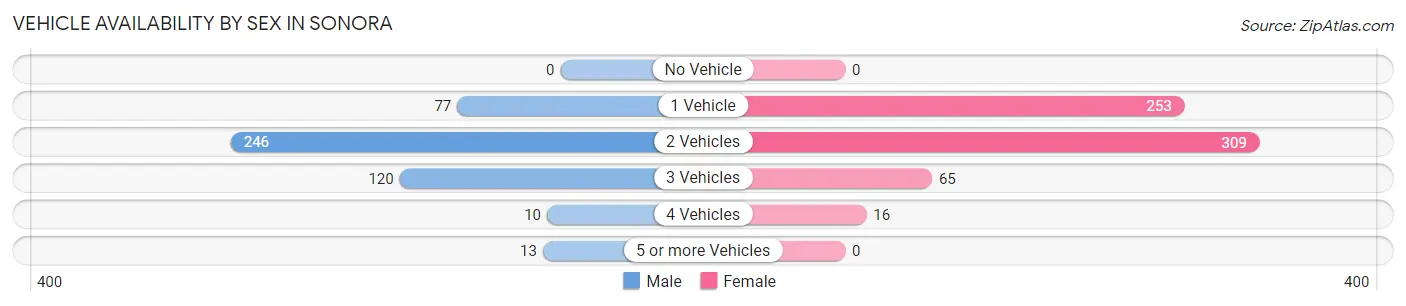
| Vehicles Available | Male | Female |
| No Vehicle | 0 (0.0%) | 0 (0.0%) |
| 1 Vehicle | 77 (16.5%) | 253 (39.4%) |
| 2 Vehicles | 246 (52.8%) | 309 (48.1%) |
| 3 Vehicles | 120 (25.8%) | 65 (10.1%) |
| 4 Vehicles | 10 (2.1%) | 16 (2.5%) |
| 5 or more Vehicles | 13 (2.8%) | 0 (0.0%) |
| Total | 466 (100.0%) | 643 (100.0%) |
Commute Time in Sonora
The most frequently occuring commute durations in Sonora are 5 to 9 minutes (404 commuters, 37.8%), less than 5 minutes (208 commuters, 19.5%), and 60 to 89 minutes (143 commuters, 13.4%).
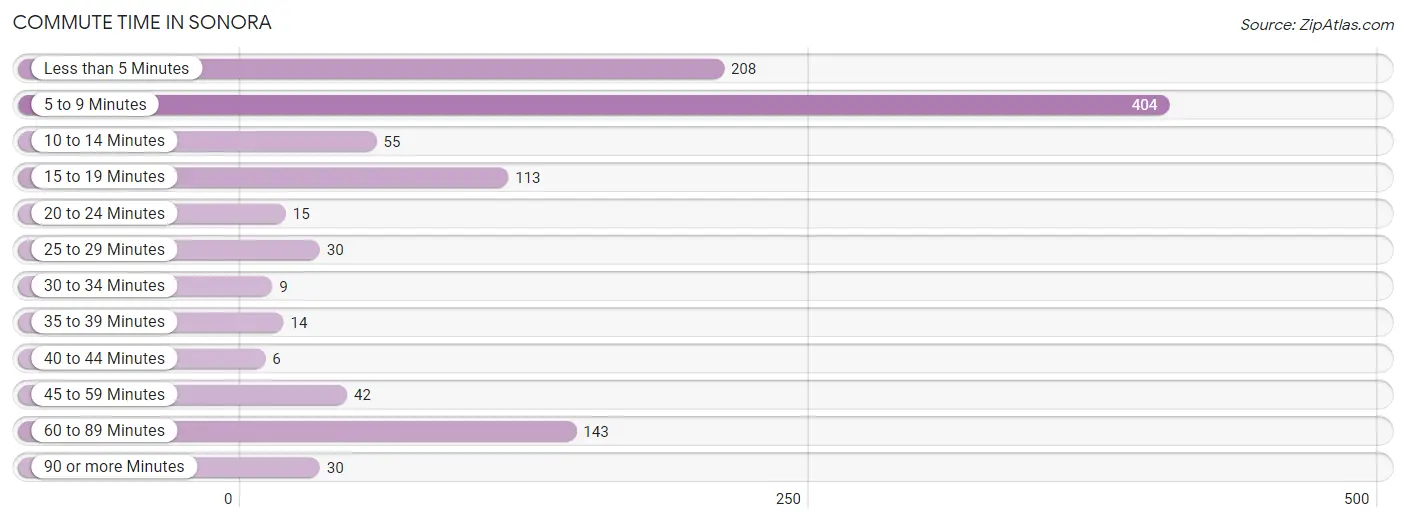
| Commute Time | # Commuters | % Commuters |
| Less than 5 Minutes | 208 | 19.5% |
| 5 to 9 Minutes | 404 | 37.8% |
| 10 to 14 Minutes | 55 | 5.1% |
| 15 to 19 Minutes | 113 | 10.6% |
| 20 to 24 Minutes | 15 | 1.4% |
| 25 to 29 Minutes | 30 | 2.8% |
| 30 to 34 Minutes | 9 | 0.8% |
| 35 to 39 Minutes | 14 | 1.3% |
| 40 to 44 Minutes | 6 | 0.6% |
| 45 to 59 Minutes | 42 | 3.9% |
| 60 to 89 Minutes | 143 | 13.4% |
| 90 or more Minutes | 30 | 2.8% |
Commute Time by Sex in Sonora
The most common commute times in Sonora are 5 to 9 minutes (117 commuters, 25.6%) for males and 5 to 9 minutes (287 commuters, 47.0%) for females.
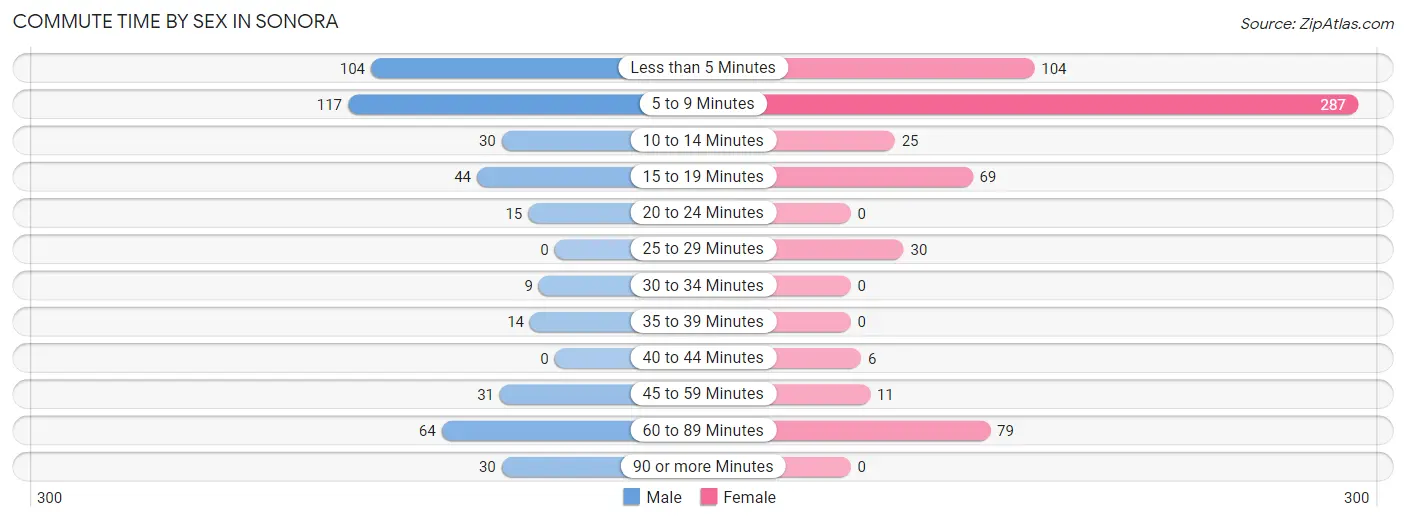
| Commute Time | Male | Female |
| Less than 5 Minutes | 104 (22.7%) | 104 (17.0%) |
| 5 to 9 Minutes | 117 (25.6%) | 287 (47.0%) |
| 10 to 14 Minutes | 30 (6.6%) | 25 (4.1%) |
| 15 to 19 Minutes | 44 (9.6%) | 69 (11.3%) |
| 20 to 24 Minutes | 15 (3.3%) | 0 (0.0%) |
| 25 to 29 Minutes | 0 (0.0%) | 30 (4.9%) |
| 30 to 34 Minutes | 9 (2.0%) | 0 (0.0%) |
| 35 to 39 Minutes | 14 (3.1%) | 0 (0.0%) |
| 40 to 44 Minutes | 0 (0.0%) | 6 (1.0%) |
| 45 to 59 Minutes | 31 (6.8%) | 11 (1.8%) |
| 60 to 89 Minutes | 64 (14.0%) | 79 (12.9%) |
| 90 or more Minutes | 30 (6.6%) | 0 (0.0%) |
Time of Departure to Work by Sex in Sonora
The most frequent times of departure to work in Sonora are 6:30 AM to 6:59 AM (91, 19.9%) for males and 7:00 AM to 7:29 AM (131, 21.4%) for females.
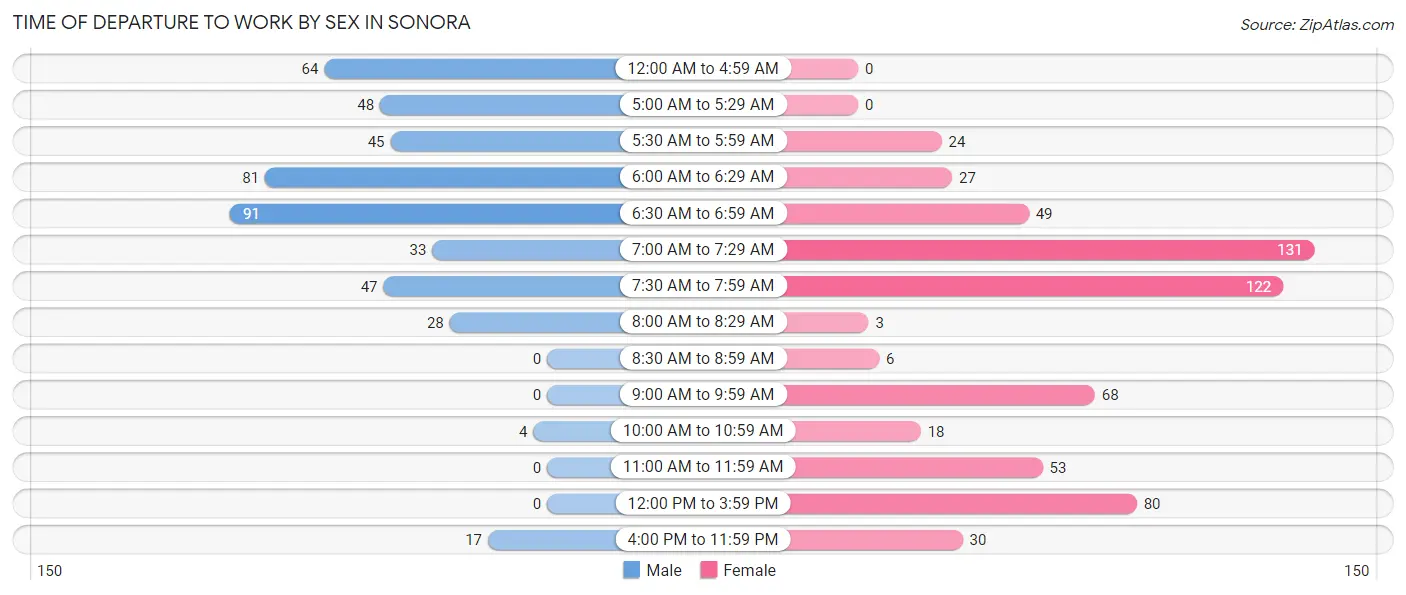
| Time of Departure | Male | Female |
| 12:00 AM to 4:59 AM | 64 (14.0%) | 0 (0.0%) |
| 5:00 AM to 5:29 AM | 48 (10.5%) | 0 (0.0%) |
| 5:30 AM to 5:59 AM | 45 (9.8%) | 24 (3.9%) |
| 6:00 AM to 6:29 AM | 81 (17.7%) | 27 (4.4%) |
| 6:30 AM to 6:59 AM | 91 (19.9%) | 49 (8.0%) |
| 7:00 AM to 7:29 AM | 33 (7.2%) | 131 (21.4%) |
| 7:30 AM to 7:59 AM | 47 (10.3%) | 122 (20.0%) |
| 8:00 AM to 8:29 AM | 28 (6.1%) | 3 (0.5%) |
| 8:30 AM to 8:59 AM | 0 (0.0%) | 6 (1.0%) |
| 9:00 AM to 9:59 AM | 0 (0.0%) | 68 (11.1%) |
| 10:00 AM to 10:59 AM | 4 (0.9%) | 18 (2.9%) |
| 11:00 AM to 11:59 AM | 0 (0.0%) | 53 (8.7%) |
| 12:00 PM to 3:59 PM | 0 (0.0%) | 80 (13.1%) |
| 4:00 PM to 11:59 PM | 17 (3.7%) | 30 (4.9%) |
| Total | 458 (100.0%) | 611 (100.0%) |
Housing Occupancy in Sonora
Occupancy by Ownership in Sonora
Of the total 890 dwellings in Sonora, owner-occupied units account for 535 (60.1%), while renter-occupied units make up 355 (39.9%).
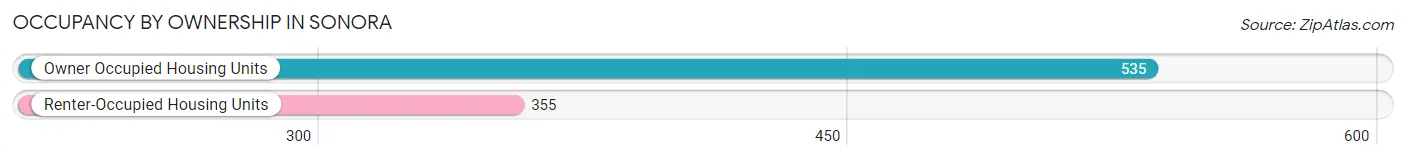
| Occupancy | # Housing Units | % Housing Units |
| Owner Occupied Housing Units | 535 | 60.1% |
| Renter-Occupied Housing Units | 355 | 39.9% |
| Total Occupied Housing Units | 890 | 100.0% |
Occupancy by Household Size in Sonora
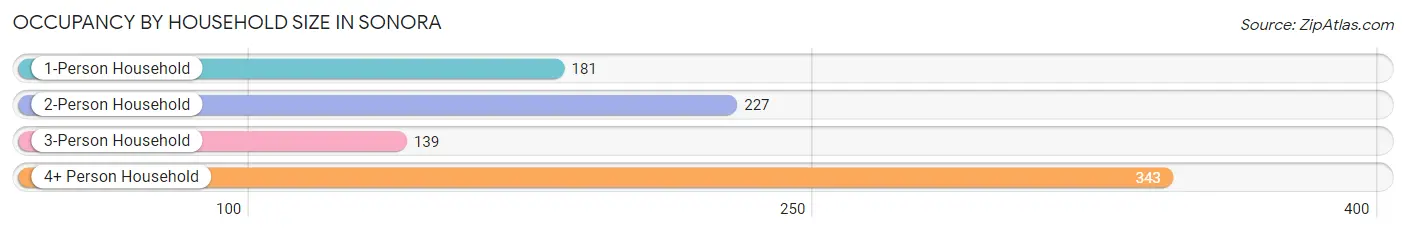
| Household Size | # Housing Units | % Housing Units |
| 1-Person Household | 181 | 20.3% |
| 2-Person Household | 227 | 25.5% |
| 3-Person Household | 139 | 15.6% |
| 4+ Person Household | 343 | 38.5% |
| Total Housing Units | 890 | 100.0% |
Occupancy by Ownership by Household Size in Sonora
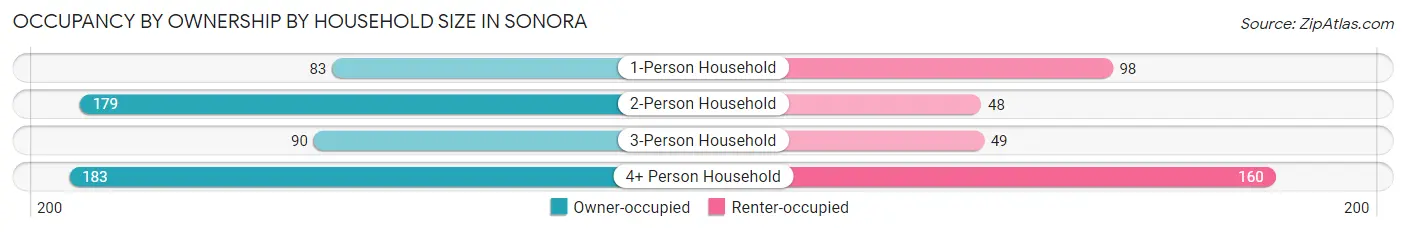
| Household Size | Owner-occupied | Renter-occupied |
| 1-Person Household | 83 (45.9%) | 98 (54.1%) |
| 2-Person Household | 179 (78.8%) | 48 (21.1%) |
| 3-Person Household | 90 (64.7%) | 49 (35.2%) |
| 4+ Person Household | 183 (53.3%) | 160 (46.7%) |
| Total Housing Units | 535 (60.1%) | 355 (39.9%) |
Occupancy by Educational Attainment in Sonora
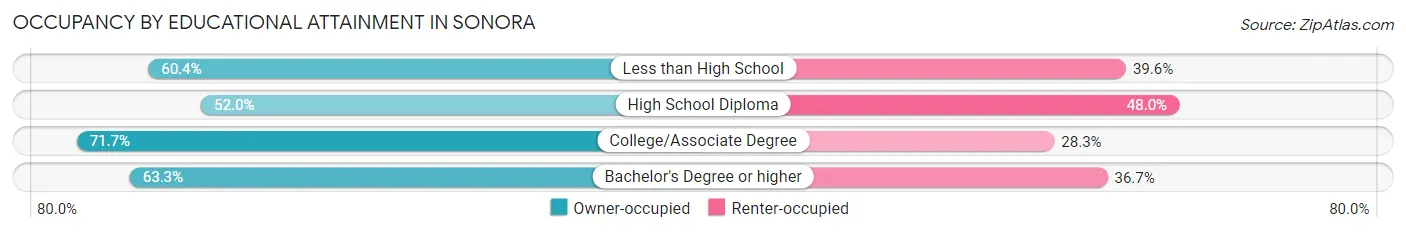
| Household Size | Owner-occupied | Renter-occupied |
| Less than High School | 96 (60.4%) | 63 (39.6%) |
| High School Diploma | 183 (52.0%) | 169 (48.0%) |
| College/Associate Degree | 137 (71.7%) | 54 (28.3%) |
| Bachelor's Degree or higher | 119 (63.3%) | 69 (36.7%) |
Occupancy by Age of Householder in Sonora
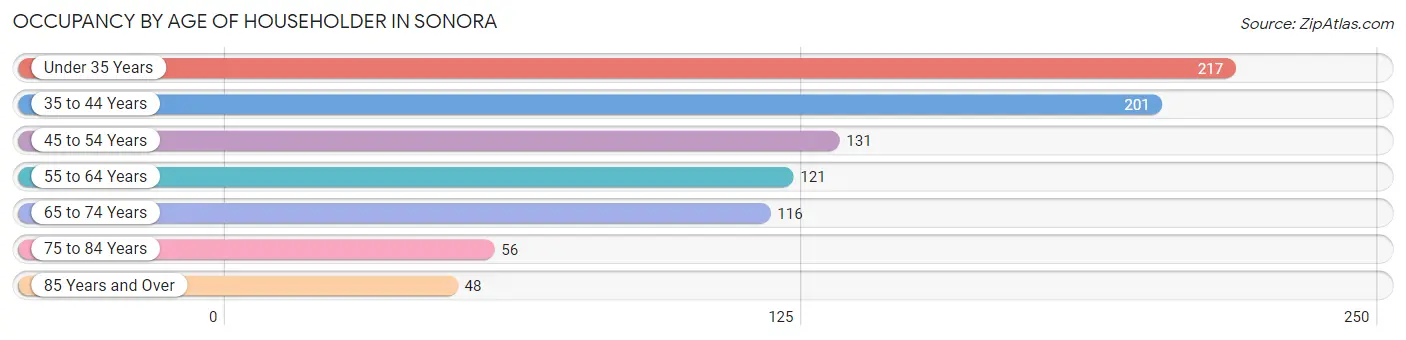
| Age Bracket | # Households | % Households |
| Under 35 Years | 217 | 24.4% |
| 35 to 44 Years | 201 | 22.6% |
| 45 to 54 Years | 131 | 14.7% |
| 55 to 64 Years | 121 | 13.6% |
| 65 to 74 Years | 116 | 13.0% |
| 75 to 84 Years | 56 | 6.3% |
| 85 Years and Over | 48 | 5.4% |
| Total | 890 | 100.0% |
Housing Finances in Sonora
Median Income by Occupancy in Sonora
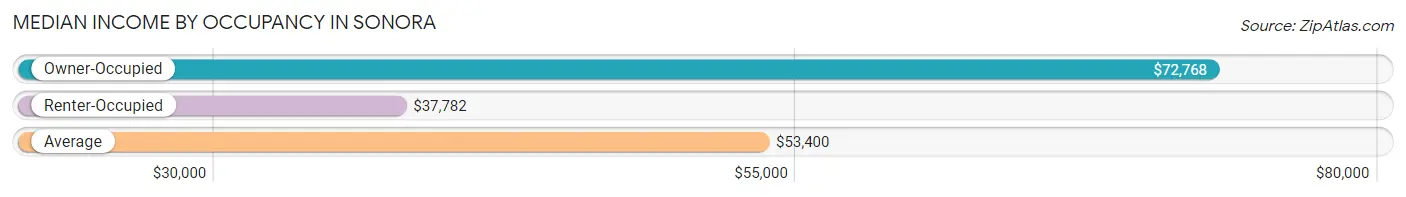
| Occupancy Type | # Households | Median Income |
| Owner-Occupied | 535 (60.1%) | $72,768 |
| Renter-Occupied | 355 (39.9%) | $37,782 |
| Average | 890 (100.0%) | $53,400 |
Occupancy by Householder Income Bracket in Sonora
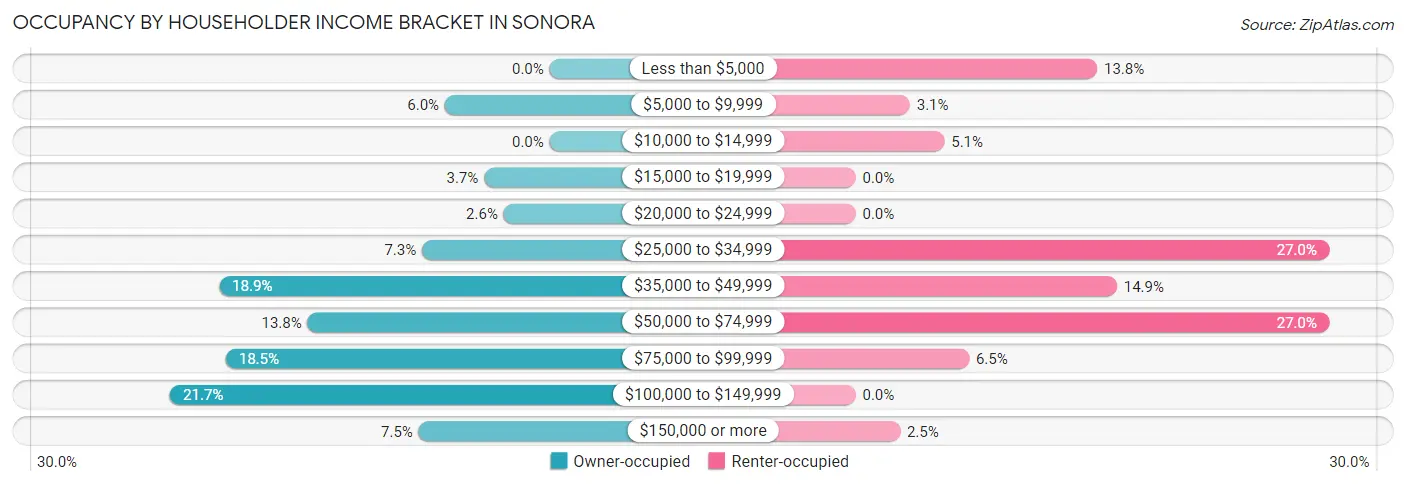
| Income Bracket | Owner-occupied | Renter-occupied |
| Less than $5,000 | 0 (0.0%) | 49 (13.8%) |
| $5,000 to $9,999 | 32 (6.0%) | 11 (3.1%) |
| $10,000 to $14,999 | 0 (0.0%) | 18 (5.1%) |
| $15,000 to $19,999 | 20 (3.7%) | 0 (0.0%) |
| $20,000 to $24,999 | 14 (2.6%) | 0 (0.0%) |
| $25,000 to $34,999 | 39 (7.3%) | 96 (27.0%) |
| $35,000 to $49,999 | 101 (18.9%) | 53 (14.9%) |
| $50,000 to $74,999 | 74 (13.8%) | 96 (27.0%) |
| $75,000 to $99,999 | 99 (18.5%) | 23 (6.5%) |
| $100,000 to $149,999 | 116 (21.7%) | 0 (0.0%) |
| $150,000 or more | 40 (7.5%) | 9 (2.5%) |
| Total | 535 (100.0%) | 355 (100.0%) |
Monthly Housing Cost Tiers in Sonora
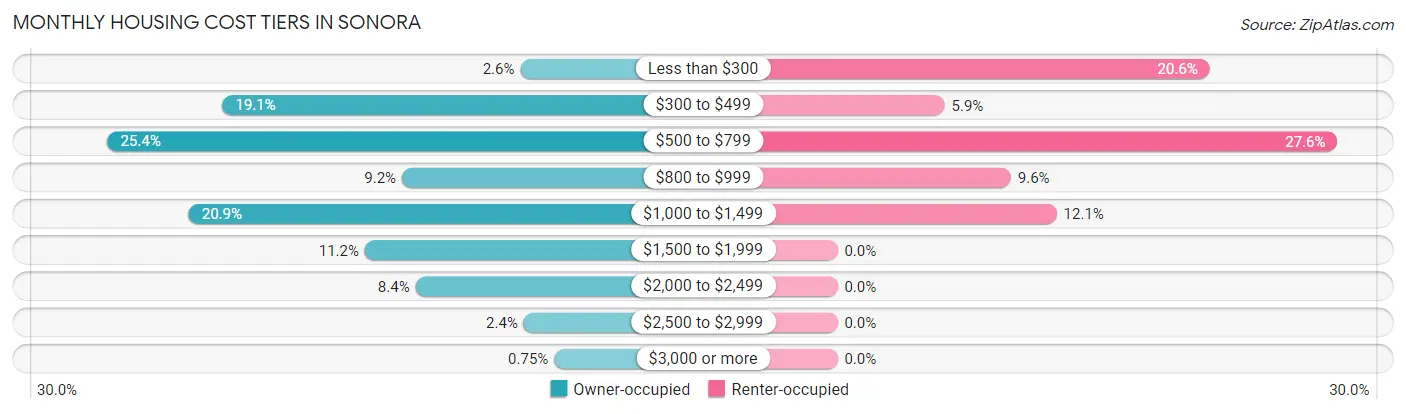
| Monthly Cost | Owner-occupied | Renter-occupied |
| Less than $300 | 14 (2.6%) | 73 (20.6%) |
| $300 to $499 | 102 (19.1%) | 21 (5.9%) |
| $500 to $799 | 136 (25.4%) | 98 (27.6%) |
| $800 to $999 | 49 (9.2%) | 34 (9.6%) |
| $1,000 to $1,499 | 112 (20.9%) | 43 (12.1%) |
| $1,500 to $1,999 | 60 (11.2%) | 0 (0.0%) |
| $2,000 to $2,499 | 45 (8.4%) | 0 (0.0%) |
| $2,500 to $2,999 | 13 (2.4%) | 0 (0.0%) |
| $3,000 or more | 4 (0.7%) | 0 (0.0%) |
| Total | 535 (100.0%) | 355 (100.0%) |
Physical Housing Characteristics in Sonora
Housing Structures in Sonora
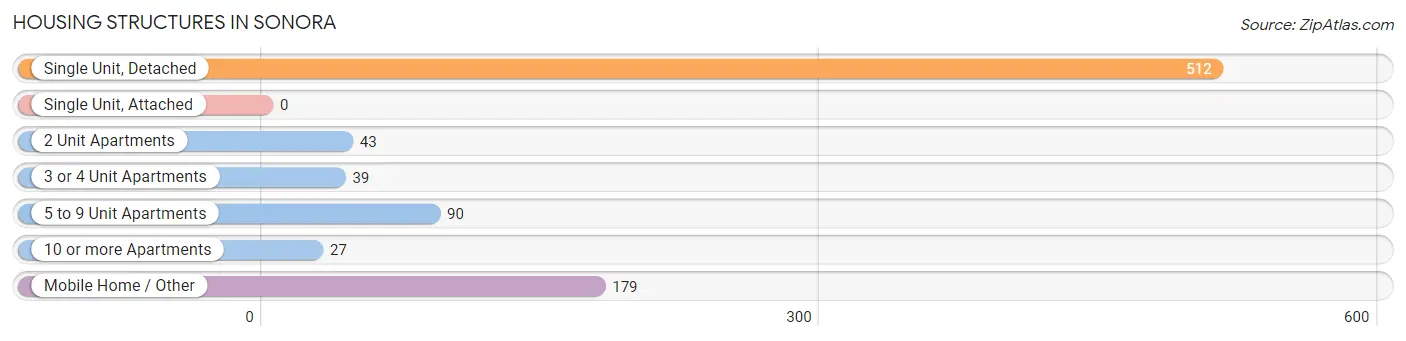
| Structure Type | # Housing Units | % Housing Units |
| Single Unit, Detached | 512 | 57.5% |
| Single Unit, Attached | 0 | 0.0% |
| 2 Unit Apartments | 43 | 4.8% |
| 3 or 4 Unit Apartments | 39 | 4.4% |
| 5 to 9 Unit Apartments | 90 | 10.1% |
| 10 or more Apartments | 27 | 3.0% |
| Mobile Home / Other | 179 | 20.1% |
| Total | 890 | 100.0% |
Housing Structures by Occupancy in Sonora
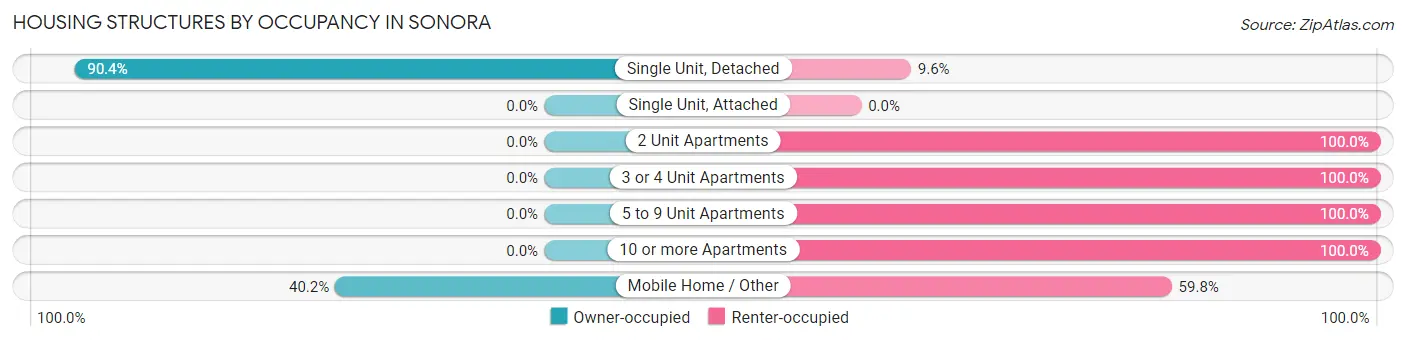
| Structure Type | Owner-occupied | Renter-occupied |
| Single Unit, Detached | 463 (90.4%) | 49 (9.6%) |
| Single Unit, Attached | 0 (0.0%) | 0 (0.0%) |
| 2 Unit Apartments | 0 (0.0%) | 43 (100.0%) |
| 3 or 4 Unit Apartments | 0 (0.0%) | 39 (100.0%) |
| 5 to 9 Unit Apartments | 0 (0.0%) | 90 (100.0%) |
| 10 or more Apartments | 0 (0.0%) | 27 (100.0%) |
| Mobile Home / Other | 72 (40.2%) | 107 (59.8%) |
| Total | 535 (60.1%) | 355 (39.9%) |
Housing Structures by Number of Rooms in Sonora
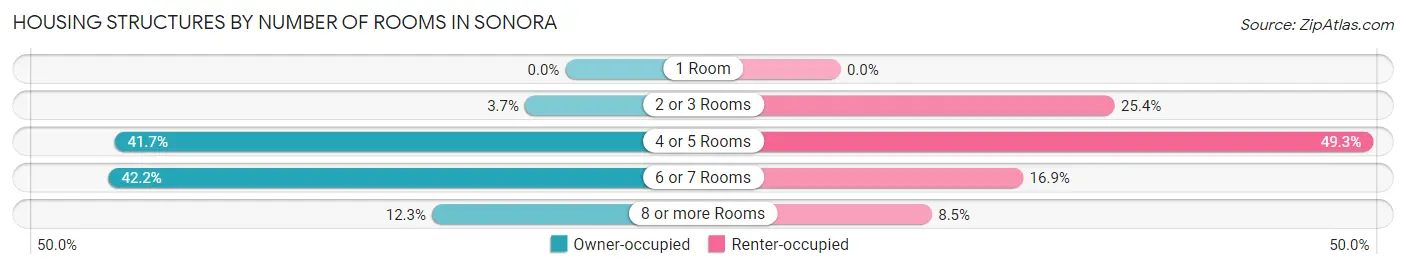
| Number of Rooms | Owner-occupied | Renter-occupied |
| 1 Room | 0 (0.0%) | 0 (0.0%) |
| 2 or 3 Rooms | 20 (3.7%) | 90 (25.4%) |
| 4 or 5 Rooms | 223 (41.7%) | 175 (49.3%) |
| 6 or 7 Rooms | 226 (42.2%) | 60 (16.9%) |
| 8 or more Rooms | 66 (12.3%) | 30 (8.5%) |
| Total | 535 (100.0%) | 355 (100.0%) |
Housing Structure by Heating Type in Sonora
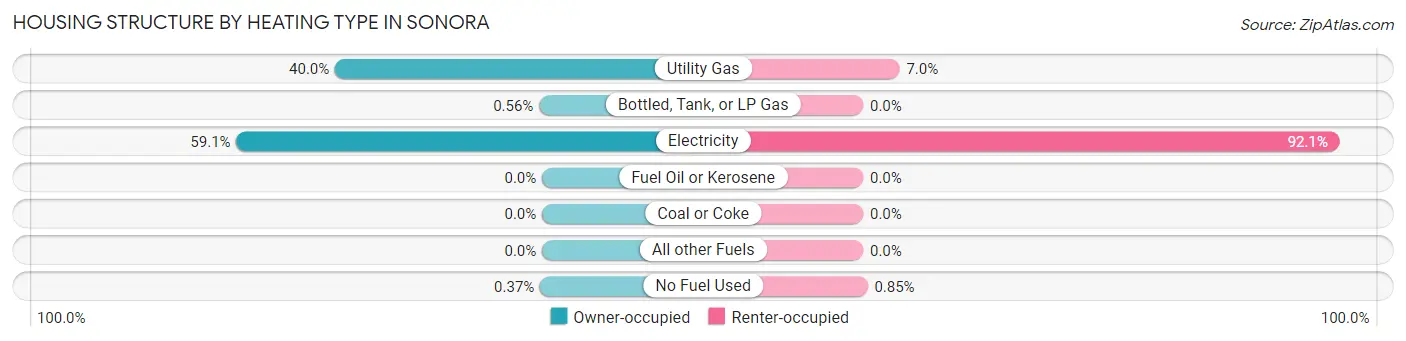
| Heating Type | Owner-occupied | Renter-occupied |
| Utility Gas | 214 (40.0%) | 25 (7.0%) |
| Bottled, Tank, or LP Gas | 3 (0.6%) | 0 (0.0%) |
| Electricity | 316 (59.1%) | 327 (92.1%) |
| Fuel Oil or Kerosene | 0 (0.0%) | 0 (0.0%) |
| Coal or Coke | 0 (0.0%) | 0 (0.0%) |
| All other Fuels | 0 (0.0%) | 0 (0.0%) |
| No Fuel Used | 2 (0.4%) | 3 (0.9%) |
| Total | 535 (100.0%) | 355 (100.0%) |
Household Vehicle Usage in Sonora
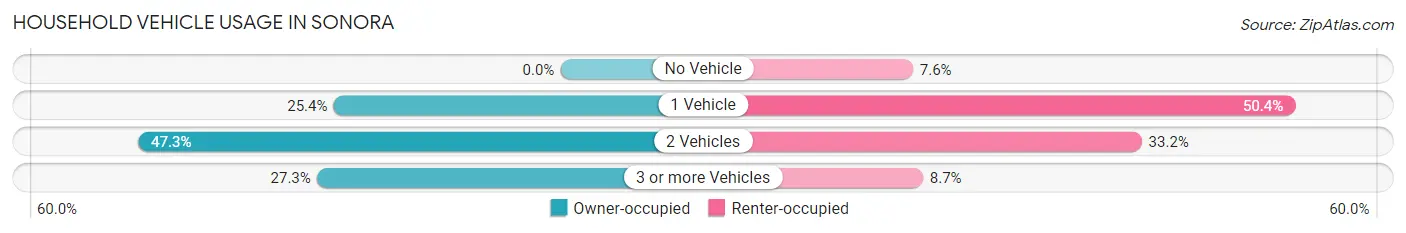
| Vehicles per Household | Owner-occupied | Renter-occupied |
| No Vehicle | 0 (0.0%) | 27 (7.6%) |
| 1 Vehicle | 136 (25.4%) | 179 (50.4%) |
| 2 Vehicles | 253 (47.3%) | 118 (33.2%) |
| 3 or more Vehicles | 146 (27.3%) | 31 (8.7%) |
| Total | 535 (100.0%) | 355 (100.0%) |
Real Estate & Mortgages in Sonora
Real Estate and Mortgage Overview in Sonora
| Characteristic | Without Mortgage | With Mortgage |
| Housing Units | 267 | 268 |
| Median Property Value | $92,600 | $152,600 |
| Median Household Income | $58,068 | $35 |
| Monthly Housing Costs | $534 | $4 |
| Real Estate Taxes | $1,391 | $0 |
Property Value by Mortgage Status in Sonora
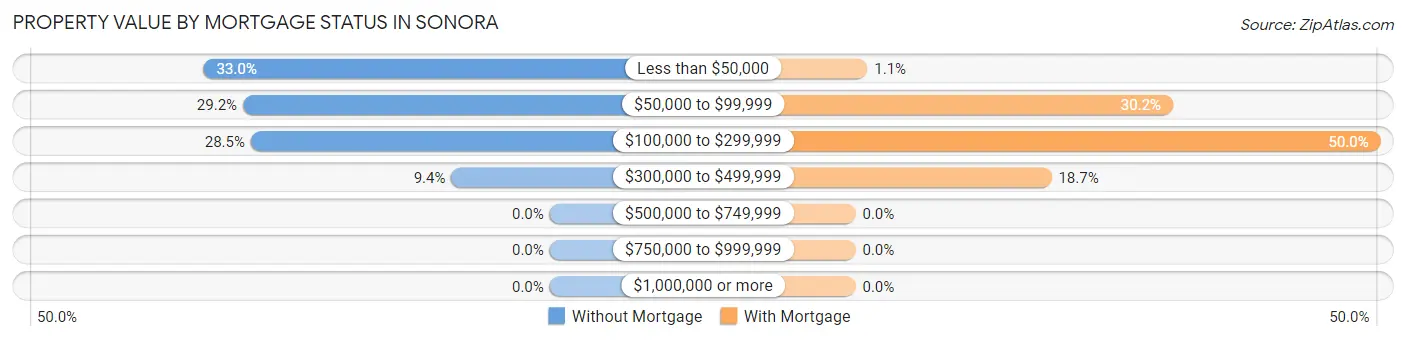
| Property Value | Without Mortgage | With Mortgage |
| Less than $50,000 | 88 (33.0%) | 3 (1.1%) |
| $50,000 to $99,999 | 78 (29.2%) | 81 (30.2%) |
| $100,000 to $299,999 | 76 (28.5%) | 134 (50.0%) |
| $300,000 to $499,999 | 25 (9.4%) | 50 (18.7%) |
| $500,000 to $749,999 | 0 (0.0%) | 0 (0.0%) |
| $750,000 to $999,999 | 0 (0.0%) | 0 (0.0%) |
| $1,000,000 or more | 0 (0.0%) | 0 (0.0%) |
| Total | 267 (100.0%) | 268 (100.0%) |
Household Income by Mortgage Status in Sonora
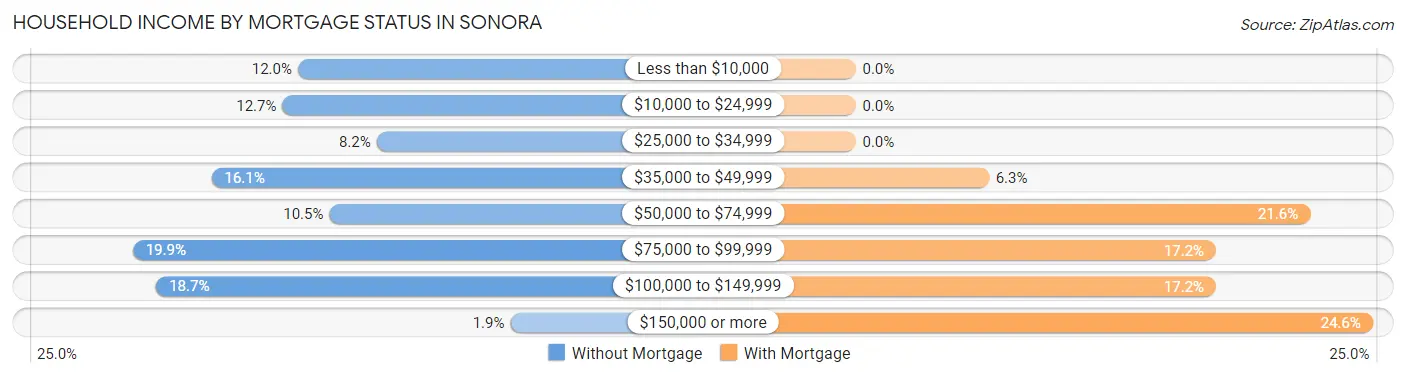
| Household Income | Without Mortgage | With Mortgage |
| Less than $10,000 | 32 (12.0%) | 0 (0.0%) |
| $10,000 to $24,999 | 34 (12.7%) | 0 (0.0%) |
| $25,000 to $34,999 | 22 (8.2%) | 0 (0.0%) |
| $35,000 to $49,999 | 43 (16.1%) | 17 (6.3%) |
| $50,000 to $74,999 | 28 (10.5%) | 58 (21.6%) |
| $75,000 to $99,999 | 53 (19.9%) | 46 (17.2%) |
| $100,000 to $149,999 | 50 (18.7%) | 46 (17.2%) |
| $150,000 or more | 5 (1.9%) | 66 (24.6%) |
| Total | 267 (100.0%) | 268 (100.0%) |
Property Value to Household Income Ratio in Sonora
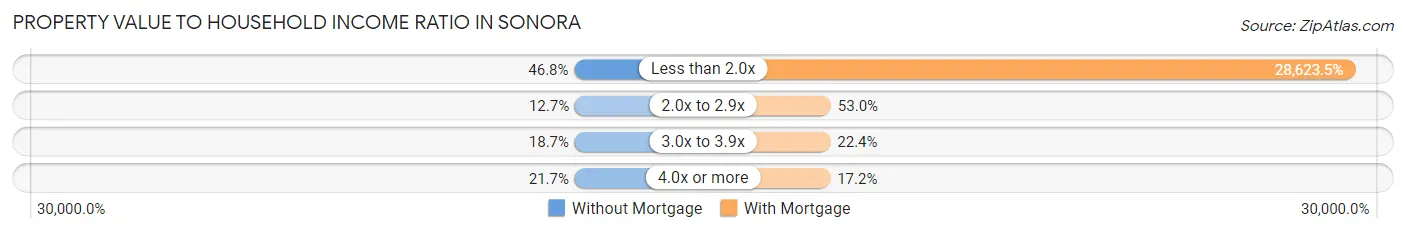
| Value-to-Income Ratio | Without Mortgage | With Mortgage |
| Less than 2.0x | 125 (46.8%) | 76,711 (28,623.5%) |
| 2.0x to 2.9x | 34 (12.7%) | 142 (53.0%) |
| 3.0x to 3.9x | 50 (18.7%) | 60 (22.4%) |
| 4.0x or more | 58 (21.7%) | 46 (17.2%) |
| Total | 267 (100.0%) | 268 (100.0%) |
Real Estate Taxes by Mortgage Status in Sonora
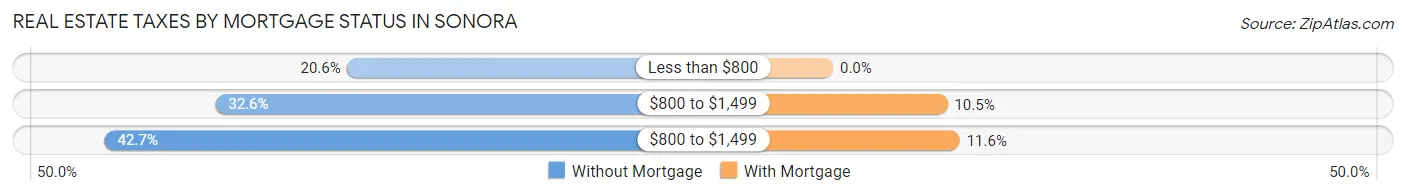
| Property Taxes | Without Mortgage | With Mortgage |
| Less than $800 | 55 (20.6%) | 0 (0.0%) |
| $800 to $1,499 | 87 (32.6%) | 28 (10.4%) |
| $800 to $1,499 | 114 (42.7%) | 31 (11.6%) |
| Total | 267 (100.0%) | 268 (100.0%) |
Health & Disability in Sonora
Health Insurance Coverage by Age in Sonora
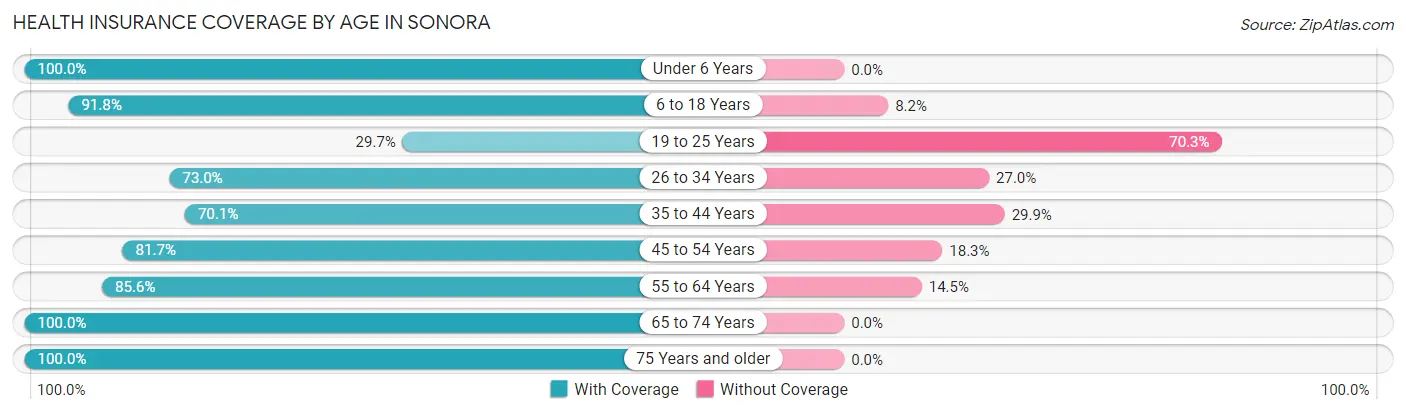
| Age Bracket | With Coverage | Without Coverage |
| Under 6 Years | 240 (100.0%) | 0 (0.0%) |
| 6 to 18 Years | 829 (91.8%) | 74 (8.2%) |
| 19 to 25 Years | 38 (29.7%) | 90 (70.3%) |
| 26 to 34 Years | 300 (73.0%) | 111 (27.0%) |
| 35 to 44 Years | 314 (70.1%) | 134 (29.9%) |
| 45 to 54 Years | 143 (81.7%) | 32 (18.3%) |
| 55 to 64 Years | 148 (85.6%) | 25 (14.4%) |
| 65 to 74 Years | 211 (100.0%) | 0 (0.0%) |
| 75 Years and older | 144 (100.0%) | 0 (0.0%) |
| Total | 2,367 (83.6%) | 466 (16.5%) |
Health Insurance Coverage by Citizenship Status in Sonora
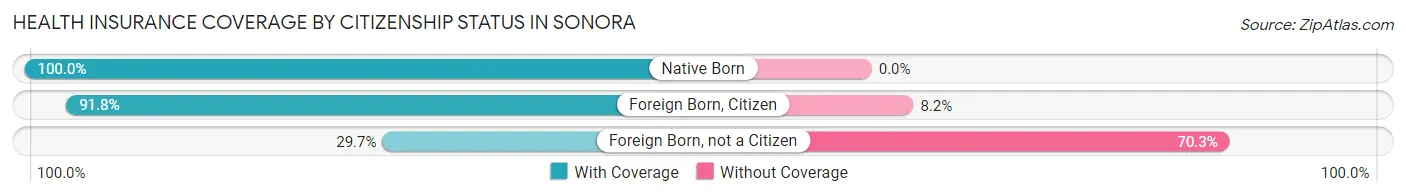
| Citizenship Status | With Coverage | Without Coverage |
| Native Born | 240 (100.0%) | 0 (0.0%) |
| Foreign Born, Citizen | 829 (91.8%) | 74 (8.2%) |
| Foreign Born, not a Citizen | 38 (29.7%) | 90 (70.3%) |
Health Insurance Coverage by Household Income in Sonora
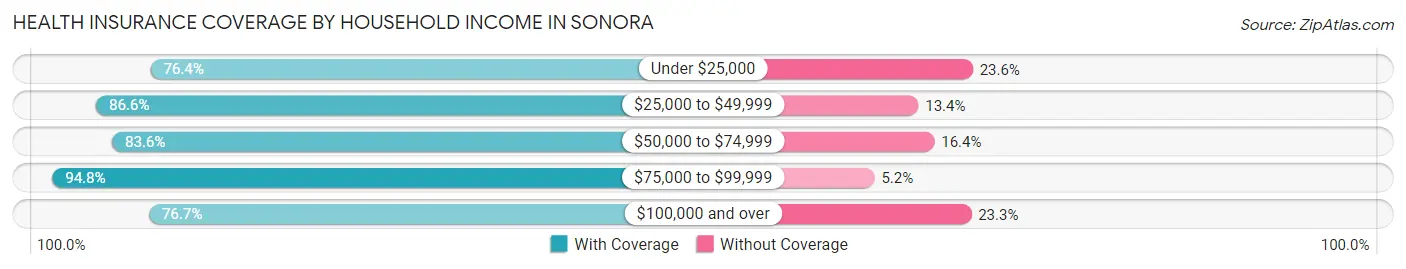
| Household Income | With Coverage | Without Coverage |
| Under $25,000 | 230 (76.4%) | 71 (23.6%) |
| $25,000 to $49,999 | 757 (86.6%) | 117 (13.4%) |
| $50,000 to $74,999 | 551 (83.6%) | 108 (16.4%) |
| $75,000 to $99,999 | 329 (94.8%) | 18 (5.2%) |
| $100,000 and over | 500 (76.7%) | 152 (23.3%) |
Public vs Private Health Insurance Coverage by Age in Sonora
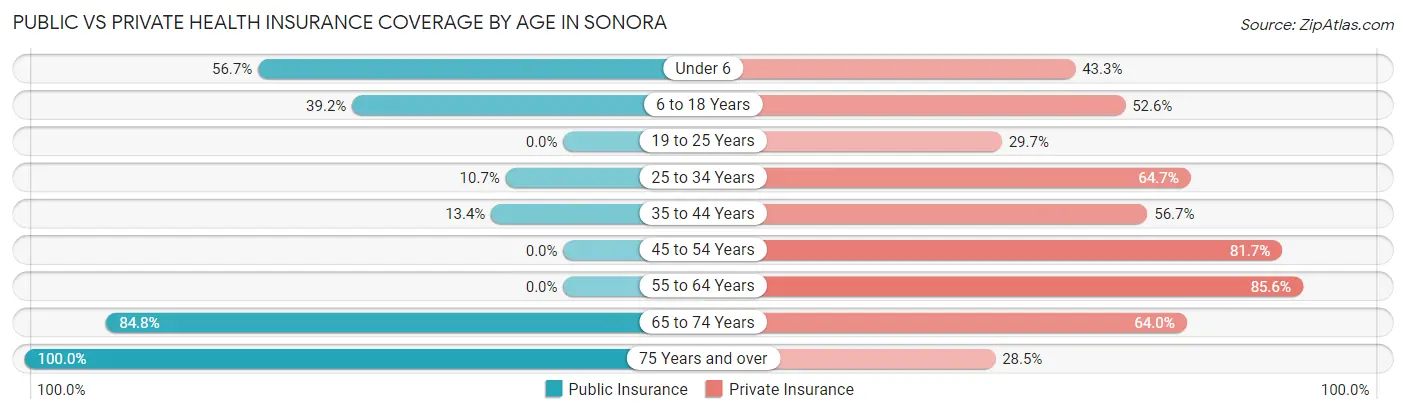
| Age Bracket | Public Insurance | Private Insurance |
| Under 6 | 136 (56.7%) | 104 (43.3%) |
| 6 to 18 Years | 354 (39.2%) | 475 (52.6%) |
| 19 to 25 Years | 0 (0.0%) | 38 (29.7%) |
| 25 to 34 Years | 44 (10.7%) | 266 (64.7%) |
| 35 to 44 Years | 60 (13.4%) | 254 (56.7%) |
| 45 to 54 Years | 0 (0.0%) | 143 (81.7%) |
| 55 to 64 Years | 0 (0.0%) | 148 (85.6%) |
| 65 to 74 Years | 179 (84.8%) | 135 (64.0%) |
| 75 Years and over | 144 (100.0%) | 41 (28.5%) |
| Total | 917 (32.4%) | 1,604 (56.6%) |
Disability Status by Sex by Age in Sonora
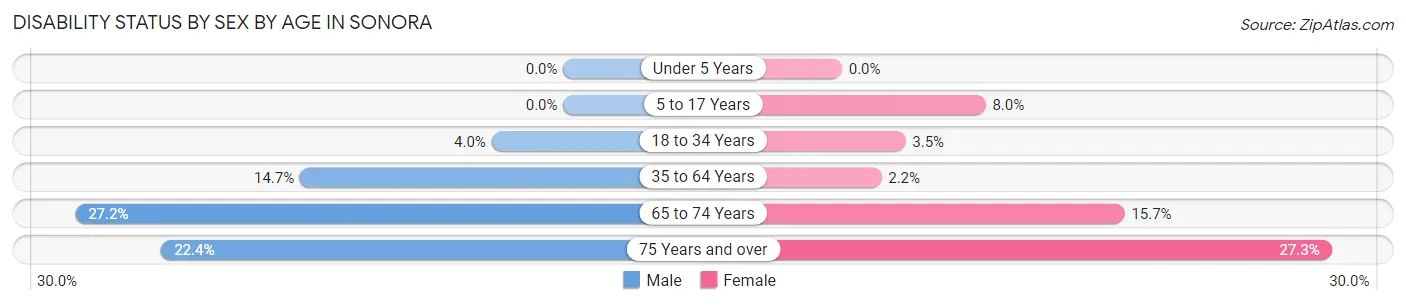
| Age Bracket | Male | Female |
| Under 5 Years | 0 (0.0%) | 0 (0.0%) |
| 5 to 17 Years | 0 (0.0%) | 30 (8.0%) |
| 18 to 34 Years | 11 (4.0%) | 14 (3.5%) |
| 35 to 64 Years | 50 (14.7%) | 10 (2.2%) |
| 65 to 74 Years | 28 (27.2%) | 17 (15.7%) |
| 75 Years and over | 15 (22.4%) | 21 (27.3%) |
Disability Class by Sex by Age in Sonora
Disability Class: Hearing Difficulty
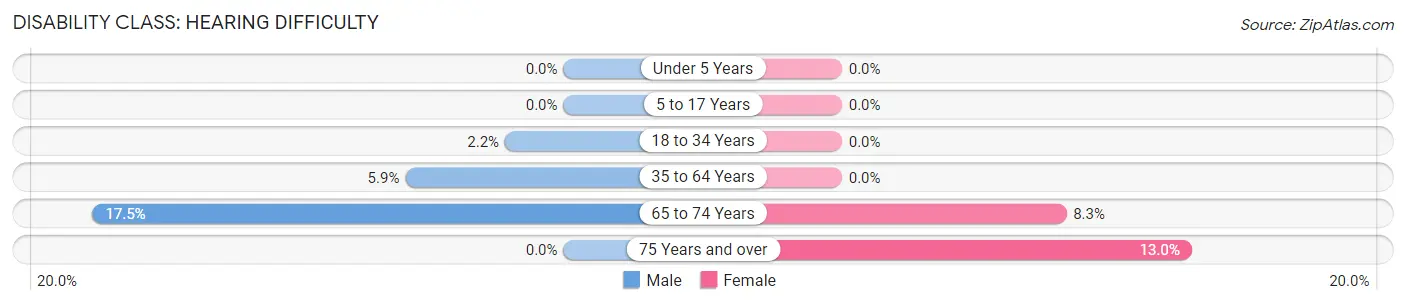
| Age Bracket | Male | Female |
| Under 5 Years | 0 (0.0%) | 0 (0.0%) |
| 5 to 17 Years | 0 (0.0%) | 0 (0.0%) |
| 18 to 34 Years | 6 (2.2%) | 0 (0.0%) |
| 35 to 64 Years | 20 (5.9%) | 0 (0.0%) |
| 65 to 74 Years | 18 (17.5%) | 9 (8.3%) |
| 75 Years and over | 0 (0.0%) | 10 (13.0%) |
Disability Class: Vision Difficulty
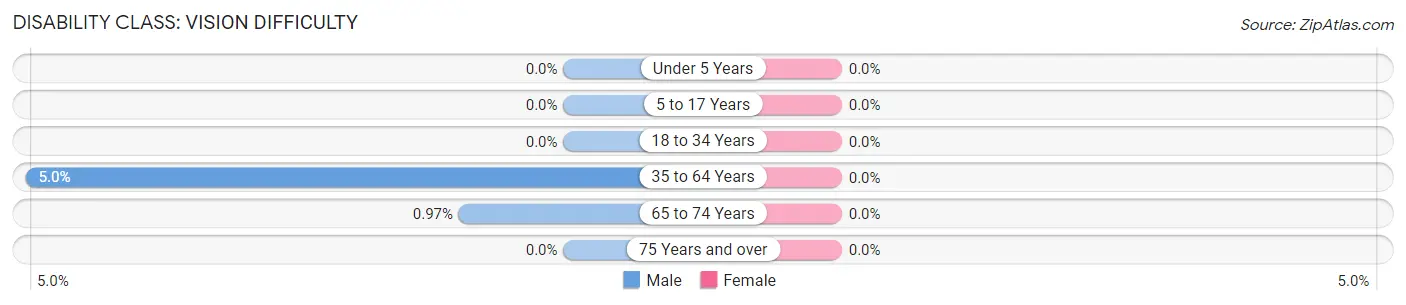
| Age Bracket | Male | Female |
| Under 5 Years | 0 (0.0%) | 0 (0.0%) |
| 5 to 17 Years | 0 (0.0%) | 0 (0.0%) |
| 18 to 34 Years | 0 (0.0%) | 0 (0.0%) |
| 35 to 64 Years | 17 (5.0%) | 0 (0.0%) |
| 65 to 74 Years | 1 (1.0%) | 0 (0.0%) |
| 75 Years and over | 0 (0.0%) | 0 (0.0%) |
Disability Class: Cognitive Difficulty
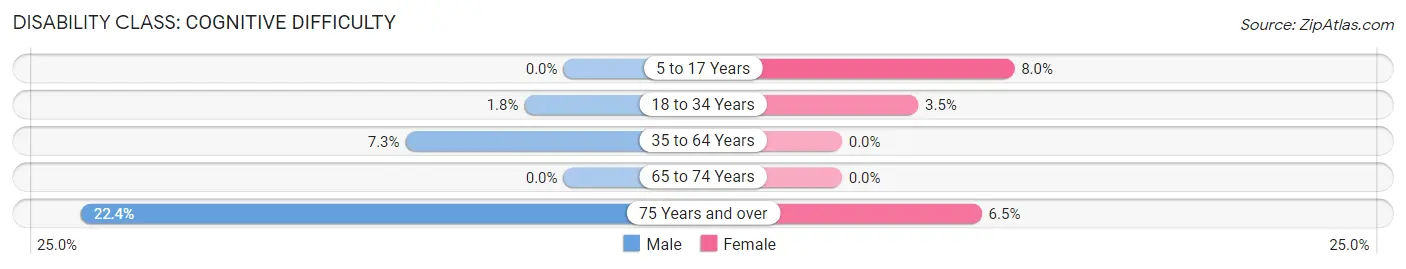
| Age Bracket | Male | Female |
| 5 to 17 Years | 0 (0.0%) | 30 (8.0%) |
| 18 to 34 Years | 5 (1.8%) | 14 (3.5%) |
| 35 to 64 Years | 25 (7.3%) | 0 (0.0%) |
| 65 to 74 Years | 0 (0.0%) | 0 (0.0%) |
| 75 Years and over | 15 (22.4%) | 5 (6.5%) |
Disability Class: Ambulatory Difficulty
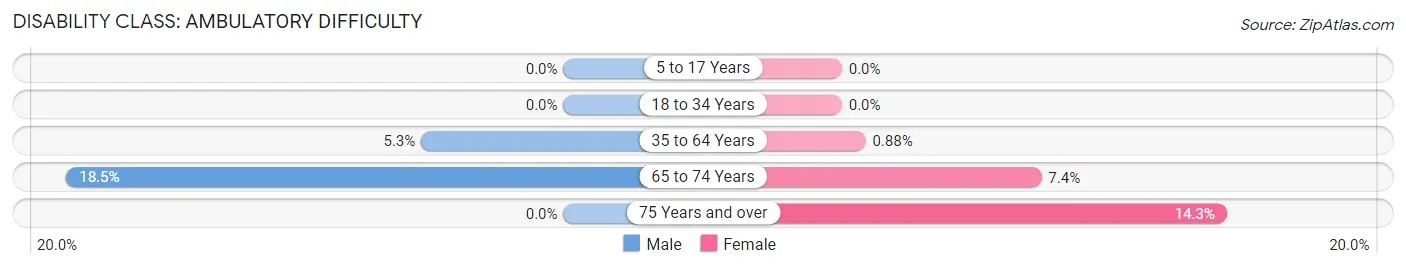
| Age Bracket | Male | Female |
| 5 to 17 Years | 0 (0.0%) | 0 (0.0%) |
| 18 to 34 Years | 0 (0.0%) | 0 (0.0%) |
| 35 to 64 Years | 18 (5.3%) | 4 (0.9%) |
| 65 to 74 Years | 19 (18.4%) | 8 (7.4%) |
| 75 Years and over | 0 (0.0%) | 11 (14.3%) |
Disability Class: Self-Care Difficulty
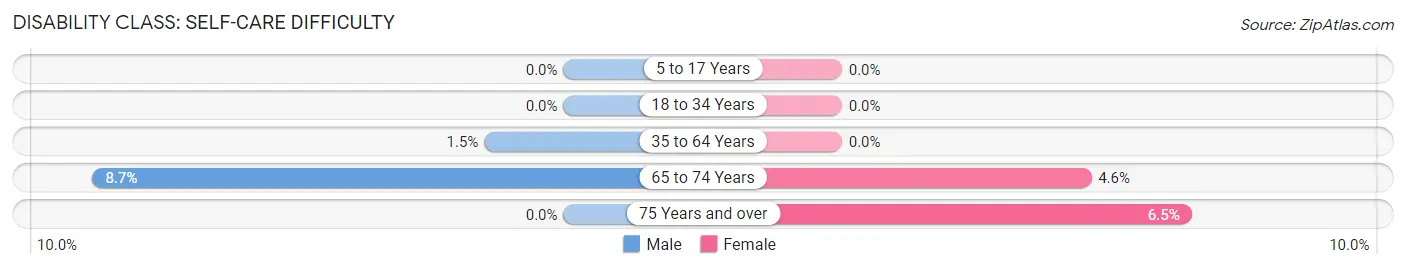
| Age Bracket | Male | Female |
| 5 to 17 Years | 0 (0.0%) | 0 (0.0%) |
| 18 to 34 Years | 0 (0.0%) | 0 (0.0%) |
| 35 to 64 Years | 5 (1.5%) | 0 (0.0%) |
| 65 to 74 Years | 9 (8.7%) | 5 (4.6%) |
| 75 Years and over | 0 (0.0%) | 5 (6.5%) |
Technology Access in Sonora
Computing Device Access in Sonora
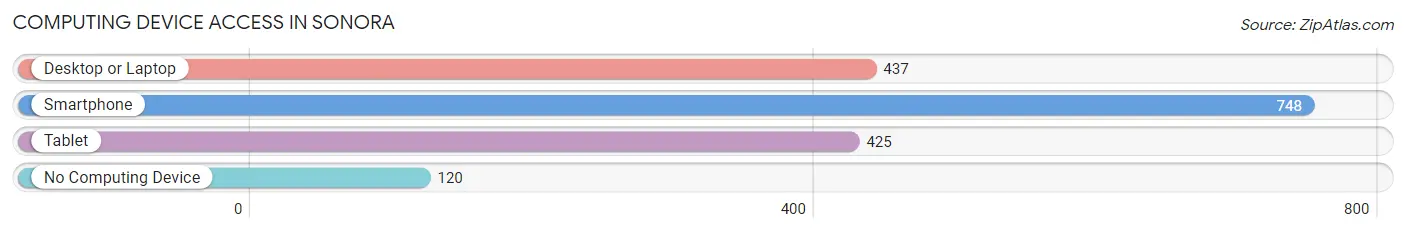
| Device Type | # Households | % Households |
| Desktop or Laptop | 437 | 49.1% |
| Smartphone | 748 | 84.0% |
| Tablet | 425 | 47.7% |
| No Computing Device | 120 | 13.5% |
| Total | 890 | 100.0% |
Internet Access in Sonora
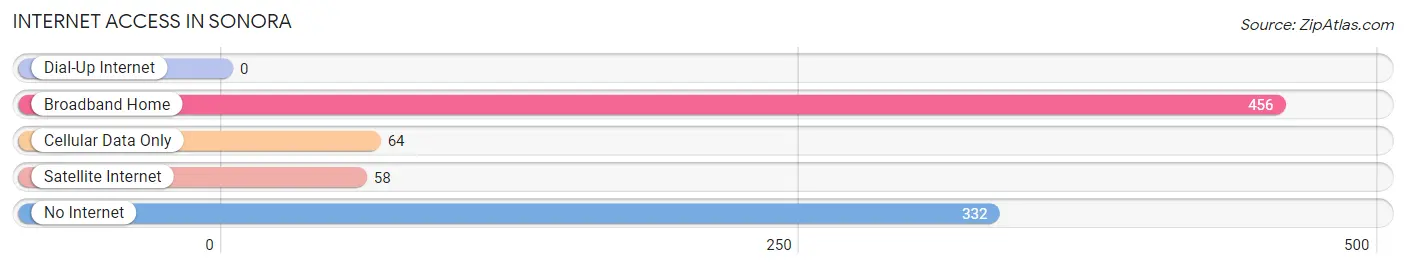
| Internet Type | # Households | % Households |
| Dial-Up Internet | 0 | 0.0% |
| Broadband Home | 456 | 51.2% |
| Cellular Data Only | 64 | 7.2% |
| Satellite Internet | 58 | 6.5% |
| No Internet | 332 | 37.3% |
| Total | 890 | 100.0% |
Sonora Summary
Sonora, Texas is a small town located in Sutton County, Texas, United States. It is situated in the western part of the state, about 90 miles south of San Angelo and about 90 miles north of Del Rio. The population of Sonora was 3,020 at the 2010 census.
History
The area around Sonora was first settled in the late 1800s by ranchers and farmers. The town was founded in 1882 and named after the nearby Sonora River. The town was incorporated in 1884 and the first post office was established in 1885.
The town grew slowly but steadily, and by the early 1900s, it had become a thriving community. The town was home to several businesses, including a bank, a hotel, a newspaper, and a variety of stores.
In the early 1900s, the town was also home to a large number of Mexican immigrants, who had come to the area to work in the local mines and ranches. This influx of immigrants helped to shape the culture of the town, and it remains a predominantly Hispanic community today.
Geography
Sonora is located in western Sutton County, Texas, at the intersection of U.S. Route 277 and State Highway 163. It is situated about 90 miles south of San Angelo and about 90 miles north of Del Rio.
The town is situated in a semi-arid region of the state, with an average annual rainfall of about 18 inches. The terrain is mostly flat, with some rolling hills in the surrounding area. The town is located in the Edwards Plateau, which is known for its limestone formations and caves.
Economy
The economy of Sonora is largely based on agriculture and ranching. The town is home to several large ranches, and the surrounding area is known for its cattle and sheep production.
The town is also home to several businesses, including a bank, a hotel, a newspaper, and a variety of stores. The town is also home to a number of manufacturing companies, including a furniture factory and a metal fabrication plant.
Demographics
As of the 2010 census, the population of Sonora was 3,020. The racial makeup of the town was 79.3% White, 0.3% African American, 0.2% Native American, 0.2% Asian, 0.1% Pacific Islander, 18.7% from other races, and 1.4% from two or more races. Hispanic or Latino of any race were 81.2% of the population.
The median income for a household in the town was $25,938, and the median income for a family was $30,938. The per capita income for the town was $14,938. About 22.2% of families and 25.2% of the population were below the poverty line, including 33.3% of those under age 18 and 16.7% of those age 65 or over.
Conclusion
Sonora, Texas is a small town located in western Sutton County, Texas. It is situated about 90 miles south of San Angelo and about 90 miles north of Del Rio. The town was founded in 1882 and has a population of 3,020 as of the 2010 census. The economy of Sonora is largely based on agriculture and ranching, and the town is home to several businesses, including a bank, a hotel, a newspaper, and a variety of stores. The town is also home to a large number of Mexican immigrants, who have helped to shape the culture of the town. The median income for a household in the town was $25,938, and the median income for a family was $30,938. About 22.2% of families and 25.2% of the population were below the poverty line.
Common Questions
What is Per Capita Income in Sonora?
Per Capita income in Sonora is $20,955.
What is the Median Family Income in Sonora?
Median Family Income in Sonora is $55,104.
What is the Median Household income in Sonora?
Median Household Income in Sonora is $53,400.
What is Income or Wage Gap in Sonora?
Income or Wage Gap in Sonora is 63.9%.
Women in Sonora earn 36.1 cents for every dollar earned by a man.
What is Inequality or Gini Index in Sonora?
Inequality or Gini Index in Sonora is 0.42.
What is the Total Population of Sonora?
Total Population of Sonora is 2,852.
What is the Total Male Population of Sonora?
Total Male Population of Sonora is 1,362.
What is the Total Female Population of Sonora?
Total Female Population of Sonora is 1,490.
What is the Ratio of Males per 100 Females in Sonora?
There are 91.41 Males per 100 Females in Sonora.
What is the Ratio of Females per 100 Males in Sonora?
There are 109.40 Females per 100 Males in Sonora.
What is the Median Population Age in Sonora?
Median Population Age in Sonora is 29.4 Years.
What is the Average Family Size in Sonora
Average Family Size in Sonora is 3.7 People.
What is the Average Household Size in Sonora
Average Household Size in Sonora is 3.2 People.
How Large is the Labor Force in Sonora?
There are 1,174 People in the Labor Forcein in Sonora.
What is the Percentage of People in the Labor Force in Sonora?
62.6% of People are in the Labor Force in Sonora.
What is the Unemployment Rate in Sonora?
Unemployment Rate in Sonora is 4.8%.