Duncanville, TX Map & Demographics
Duncanville Map
Duncanville Overview
$29,349
PER CAPITA INCOME
$76,381
AVG FAMILY INCOME
$66,601
AVG HOUSEHOLD INCOME
9.2%
WAGE / INCOME GAP [ % ]
90.8¢/ $1
WAGE / INCOME GAP [ $ ]
$10,376
FAMILY INCOME DEFICIT
0.41
INEQUALITY / GINI INDEX
40,288
TOTAL POPULATION
19,275
MALE POPULATION
21,013
FEMALE POPULATION
91.73
MALES / 100 FEMALES
109.02
FEMALES / 100 MALES
36.9
MEDIAN AGE
3.5
AVG FAMILY SIZE
2.9
AVG HOUSEHOLD SIZE
19,353
LABOR FORCE [ PEOPLE ]
62.2%
PERCENT IN LABOR FORCE
7.6%
UNEMPLOYMENT RATE
Duncanville Area Codes
Income in Duncanville
Income Overview in Duncanville
Per Capita Income in Duncanville is $29,349, while median incomes of families and households are $76,381 and $66,601 respectively.
| Characteristic | Number | Measure |
| Per Capita Income | 40,288 | $29,349 |
| Median Family Income | 9,880 | $76,381 |
| Mean Family Income | 9,880 | $94,993 |
| Median Household Income | 13,700 | $66,601 |
| Mean Household Income | 13,700 | $83,574 |
| Income Deficit | 9,880 | $10,376 |
| Wage / Income Gap (%) | 40,288 | 9.18% |
| Wage / Income Gap ($) | 40,288 | 90.82¢ per $1 |
| Gini / Inequality Index | 40,288 | 0.41 |
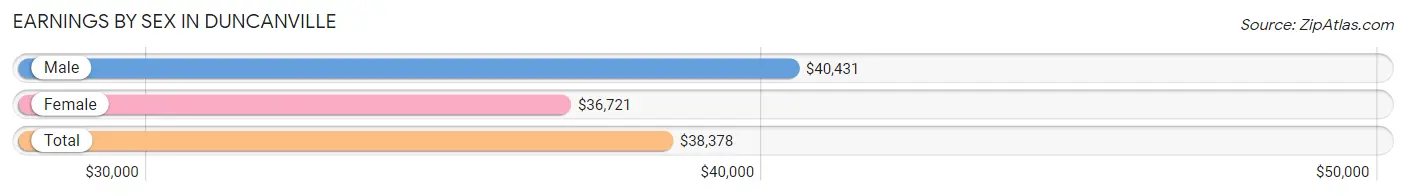
Earnings by Sex in Duncanville
Average Earnings in Duncanville are $38,378, $40,431 for men and $36,721 for women, a difference of 9.2%.
| Sex | Number | Average Earnings |
| Male | 10,293 (52.0%) | $40,431 |
| Female | 9,482 (47.9%) | $36,721 |
| Total | 19,775 (100.0%) | $38,378 |
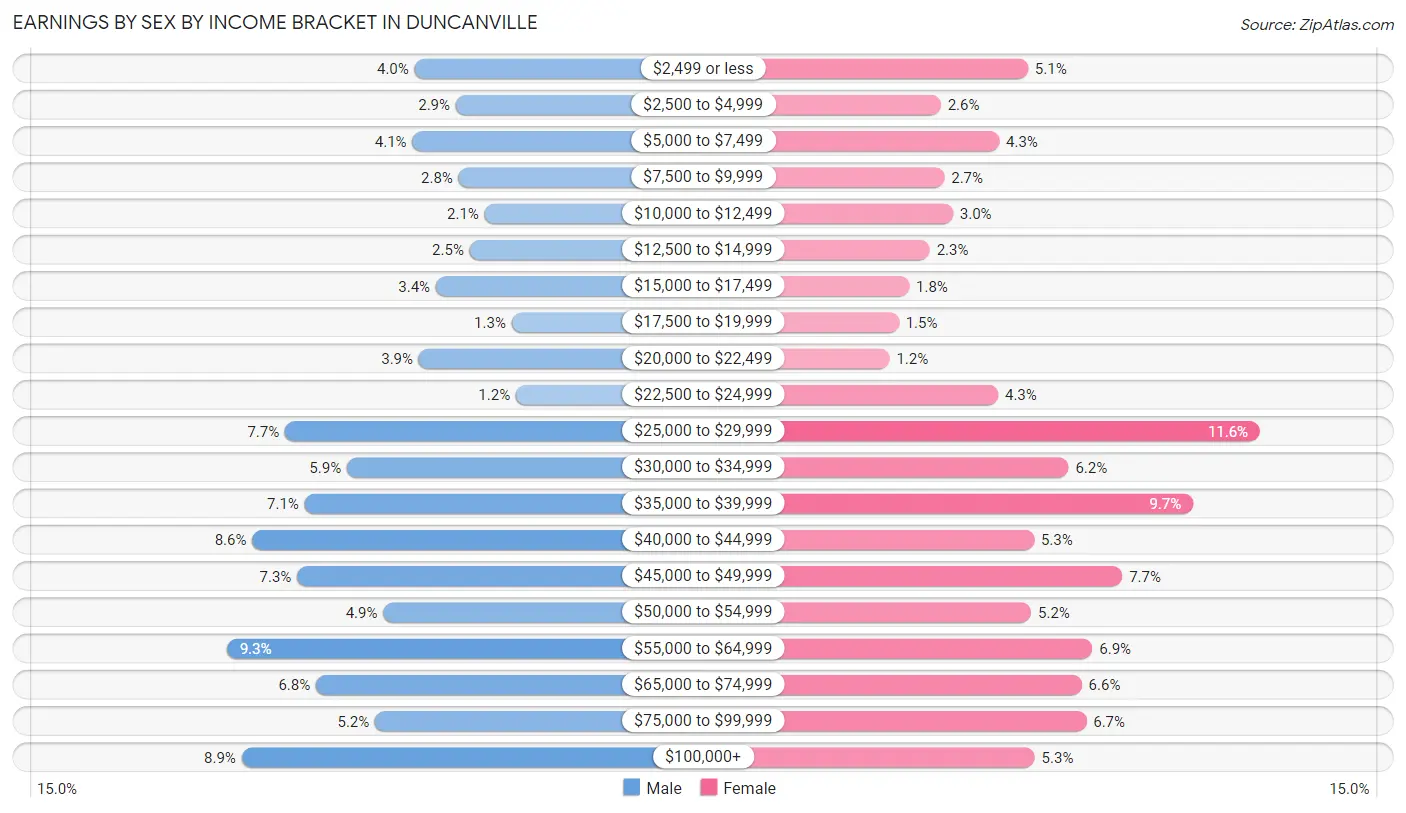
Earnings by Sex by Income Bracket in Duncanville
The most common earnings brackets in Duncanville are $55,000 to $64,999 for men (959 | 9.3%) and $25,000 to $29,999 for women (1,101 | 11.6%).
| Income | Male | Female |
| $2,499 or less | 416 (4.0%) | 483 (5.1%) |
| $2,500 to $4,999 | 296 (2.9%) | 250 (2.6%) |
| $5,000 to $7,499 | 422 (4.1%) | 406 (4.3%) |
| $7,500 to $9,999 | 288 (2.8%) | 260 (2.7%) |
| $10,000 to $12,499 | 213 (2.1%) | 283 (3.0%) |
| $12,500 to $14,999 | 256 (2.5%) | 221 (2.3%) |
| $15,000 to $17,499 | 354 (3.4%) | 166 (1.8%) |
| $17,500 to $19,999 | 135 (1.3%) | 138 (1.5%) |
| $20,000 to $22,499 | 403 (3.9%) | 114 (1.2%) |
| $22,500 to $24,999 | 122 (1.2%) | 403 (4.3%) |
| $25,000 to $29,999 | 791 (7.7%) | 1,101 (11.6%) |
| $30,000 to $34,999 | 611 (5.9%) | 591 (6.2%) |
| $35,000 to $39,999 | 734 (7.1%) | 923 (9.7%) |
| $40,000 to $44,999 | 885 (8.6%) | 499 (5.3%) |
| $45,000 to $49,999 | 755 (7.3%) | 734 (7.7%) |
| $50,000 to $54,999 | 506 (4.9%) | 491 (5.2%) |
| $55,000 to $64,999 | 959 (9.3%) | 654 (6.9%) |
| $65,000 to $74,999 | 701 (6.8%) | 626 (6.6%) |
| $75,000 to $99,999 | 530 (5.1%) | 638 (6.7%) |
| $100,000+ | 916 (8.9%) | 501 (5.3%) |
| Total | 10,293 (100.0%) | 9,482 (100.0%) |
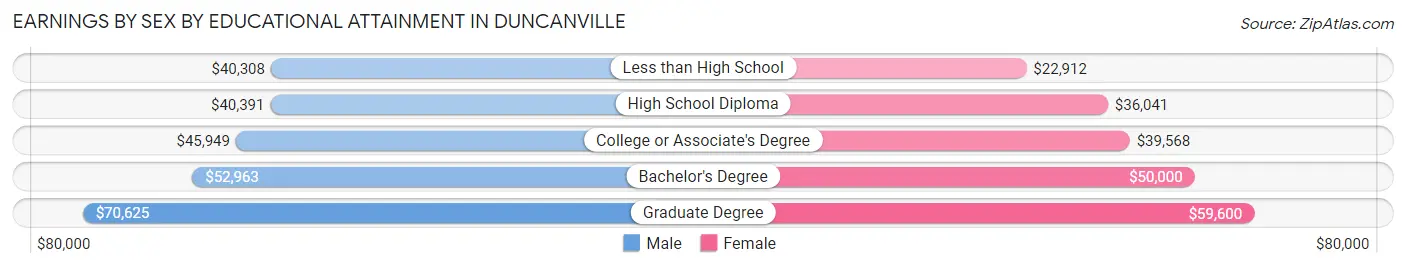
Earnings by Sex by Educational Attainment in Duncanville
Average earnings in Duncanville are $42,601 for men and $39,677 for women, a difference of 6.9%. Men with an educational attainment of graduate degree enjoy the highest average annual earnings of $70,625, while those with less than high school education earn the least with $40,308. Women with an educational attainment of graduate degree earn the most with the average annual earnings of $59,600, while those with less than high school education have the smallest earnings of $22,912.
| Educational Attainment | Male Income | Female Income |
| Less than High School | $40,308 | $22,912 |
| High School Diploma | $40,391 | $36,041 |
| College or Associate's Degree | $45,949 | $39,568 |
| Bachelor's Degree | $52,963 | $50,000 |
| Graduate Degree | $70,625 | $59,600 |
| Total | $42,601 | $39,677 |
Family Income in Duncanville
Family Income Brackets in Duncanville
According to the Duncanville family income data, there are 2,016 families falling into the $50,000 to $74,999 income range, which is the most common income bracket and makes up 20.4% of all families. Conversely, the $10,000 to $14,999 income bracket is the least frequent group with only 79 families (0.8%) belonging to this category.
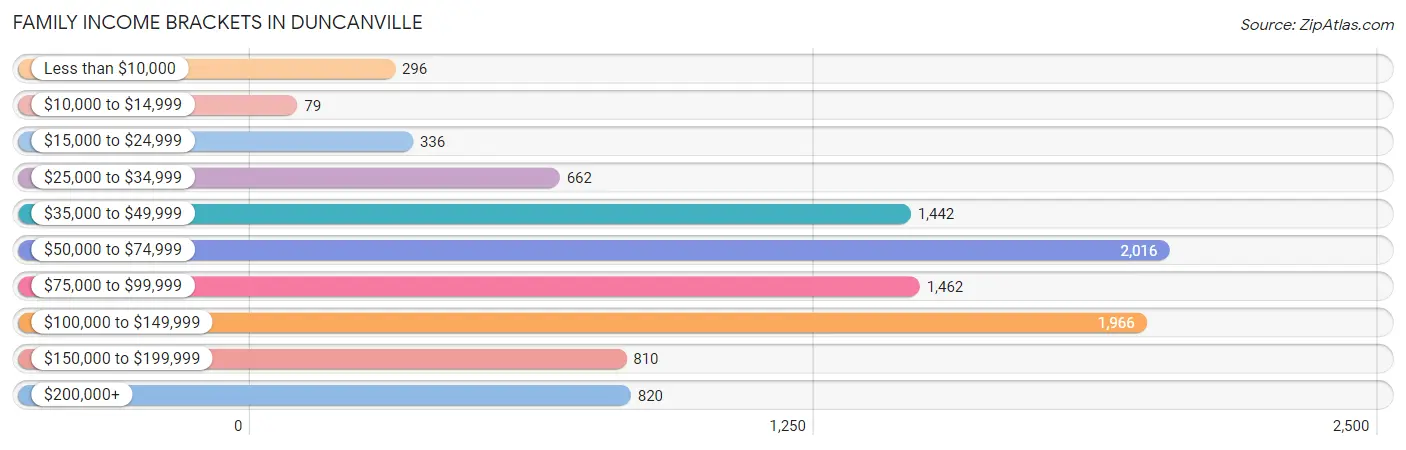
| Income Bracket | # Families | % Families |
| Less than $10,000 | 296 | 3.0% |
| $10,000 to $14,999 | 79 | 0.8% |
| $15,000 to $24,999 | 336 | 3.4% |
| $25,000 to $34,999 | 662 | 6.7% |
| $35,000 to $49,999 | 1,442 | 14.6% |
| $50,000 to $74,999 | 2,016 | 20.4% |
| $75,000 to $99,999 | 1,462 | 14.8% |
| $100,000 to $149,999 | 1,966 | 19.9% |
| $150,000 to $199,999 | 810 | 8.2% |
| $200,000+ | 820 | 8.3% |
Family Income by Famaliy Size in Duncanville
7+ person families (501 | 5.1%) account for the highest median family income in Duncanville with $107,734 per family, while 2-person families (3,861 | 39.1%) have the highest median income of $39,892 per family member.
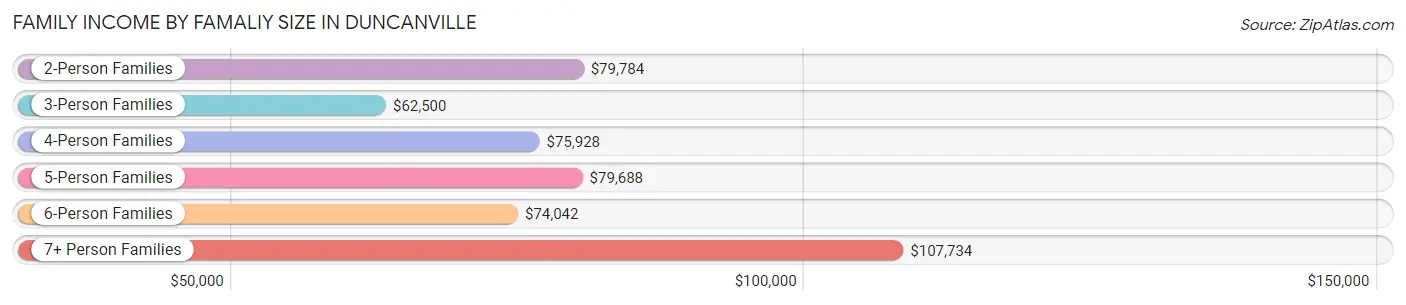
| Income Bracket | # Families | Median Income |
| 2-Person Families | 3,861 (39.1%) | $79,784 |
| 3-Person Families | 2,784 (28.2%) | $62,500 |
| 4-Person Families | 1,637 (16.6%) | $75,928 |
| 5-Person Families | 714 (7.2%) | $79,688 |
| 6-Person Families | 383 (3.9%) | $74,042 |
| 7+ Person Families | 501 (5.1%) | $107,734 |
| Total | 9,880 (100.0%) | $76,381 |
Family Income by Number of Earners in Duncanville
The median family income in Duncanville is $76,381, with families comprising 3+ earners (1,380) having the highest median family income of $112,375, while families with no earners (1,160) have the lowest median family income of $51,375, accounting for 14.0% and 11.7% of families, respectively.
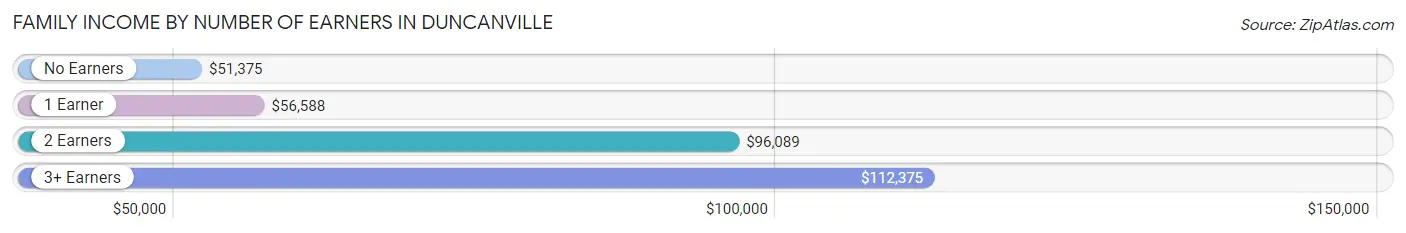
| Number of Earners | # Families | Median Income |
| No Earners | 1,160 (11.7%) | $51,375 |
| 1 Earner | 4,087 (41.4%) | $56,588 |
| 2 Earners | 3,253 (32.9%) | $96,089 |
| 3+ Earners | 1,380 (14.0%) | $112,375 |
| Total | 9,880 (100.0%) | $76,381 |
Household Income in Duncanville
Household Income Brackets in Duncanville
With 2,808 households falling in the category, the $50,000 to $74,999 income range is the most frequent in Duncanville, accounting for 20.5% of all households. In contrast, only 260 households (1.9%) fall into the $10,000 to $14,999 income bracket, making it the least populous group.
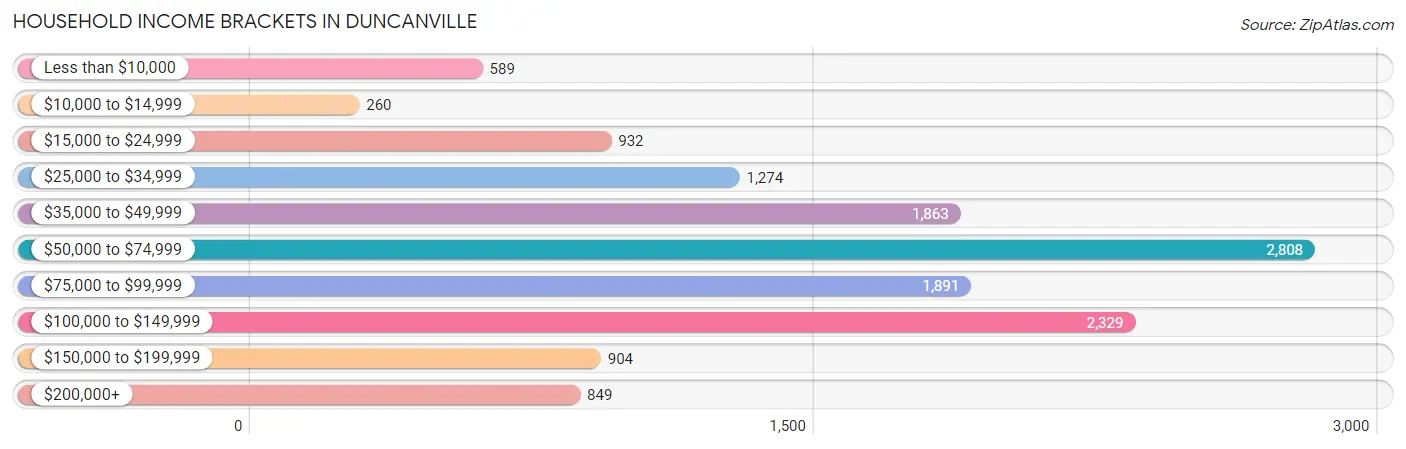
| Income Bracket | # Households | % Households |
| Less than $10,000 | 589 | 4.3% |
| $10,000 to $14,999 | 260 | 1.9% |
| $15,000 to $24,999 | 932 | 6.8% |
| $25,000 to $34,999 | 1,274 | 9.3% |
| $35,000 to $49,999 | 1,863 | 13.6% |
| $50,000 to $74,999 | 2,808 | 20.5% |
| $75,000 to $99,999 | 1,891 | 13.8% |
| $100,000 to $149,999 | 2,329 | 17.0% |
| $150,000 to $199,999 | 904 | 6.6% |
| $200,000+ | 849 | 6.2% |
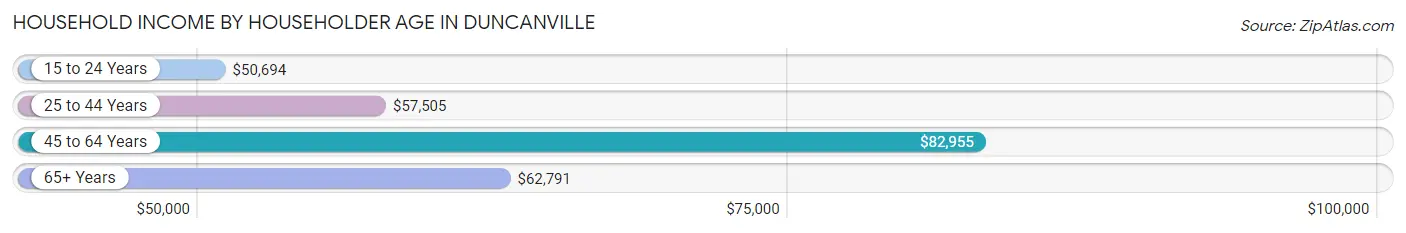
Household Income by Householder Age in Duncanville
The median household income in Duncanville is $66,601, with the highest median household income of $82,955 found in the 45 to 64 years age bracket for the primary householder. A total of 5,208 households (38.0%) fall into this category. Meanwhile, the 15 to 24 years age bracket for the primary householder has the lowest median household income of $50,694, with 150 households (1.1%) in this group.
| Income Bracket | # Households | Median Income |
| 15 to 24 Years | 150 (1.1%) | $50,694 |
| 25 to 44 Years | 4,603 (33.6%) | $57,505 |
| 45 to 64 Years | 5,208 (38.0%) | $82,955 |
| 65+ Years | 3,739 (27.3%) | $62,791 |
| Total | 13,700 (100.0%) | $66,601 |
Poverty in Duncanville
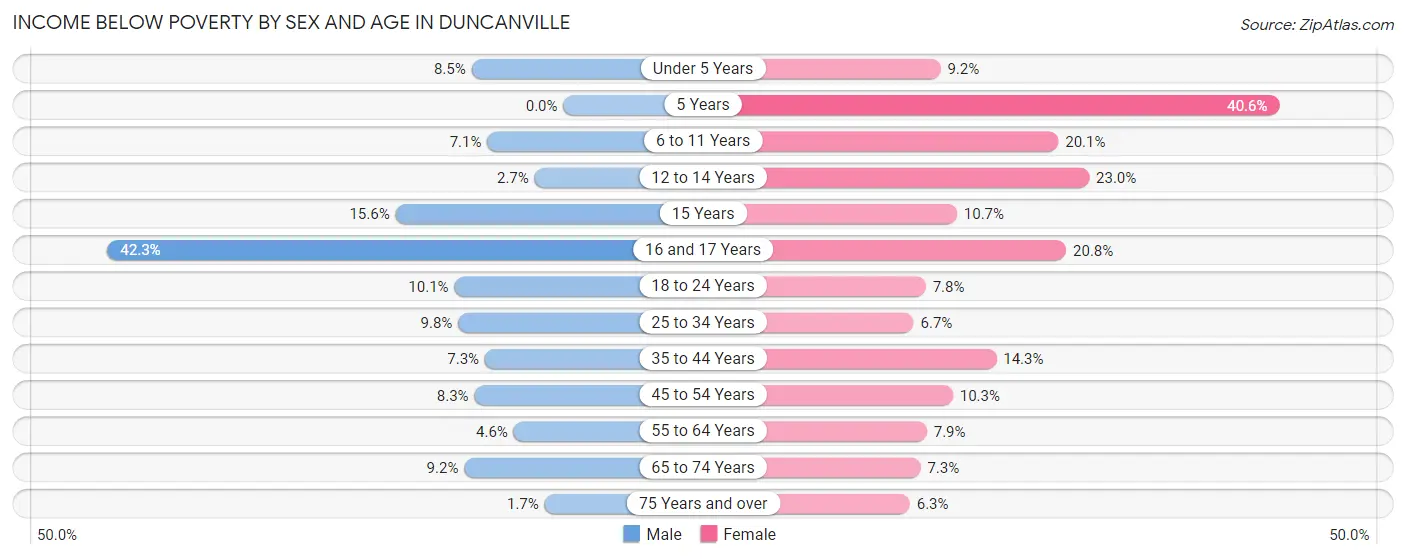
Income Below Poverty by Sex and Age in Duncanville
With 8.5% poverty level for males and 11.6% for females among the residents of Duncanville, 16 and 17 year old males and 5 year old females are the most vulnerable to poverty, with 286 males (42.3%) and 121 females (40.6%) in their respective age groups living below the poverty level.
| Age Bracket | Male | Female |
| Under 5 Years | 89 (8.5%) | 123 (9.2%) |
| 5 Years | 0 (0.0%) | 121 (40.6%) |
| 6 to 11 Years | 112 (7.1%) | 381 (20.1%) |
| 12 to 14 Years | 28 (2.7%) | 238 (23.0%) |
| 15 Years | 43 (15.6%) | 30 (10.7%) |
| 16 and 17 Years | 286 (42.3%) | 143 (20.8%) |
| 18 to 24 Years | 219 (10.1%) | 124 (7.8%) |
| 25 to 34 Years | 191 (9.8%) | 167 (6.7%) |
| 35 to 44 Years | 185 (7.3%) | 413 (14.3%) |
| 45 to 54 Years | 165 (8.3%) | 237 (10.3%) |
| 55 to 64 Years | 132 (4.6%) | 191 (7.9%) |
| 65 to 74 Years | 168 (9.2%) | 163 (7.3%) |
| 75 Years and over | 14 (1.7%) | 93 (6.3%) |
| Total | 1,632 (8.5%) | 2,424 (11.6%) |
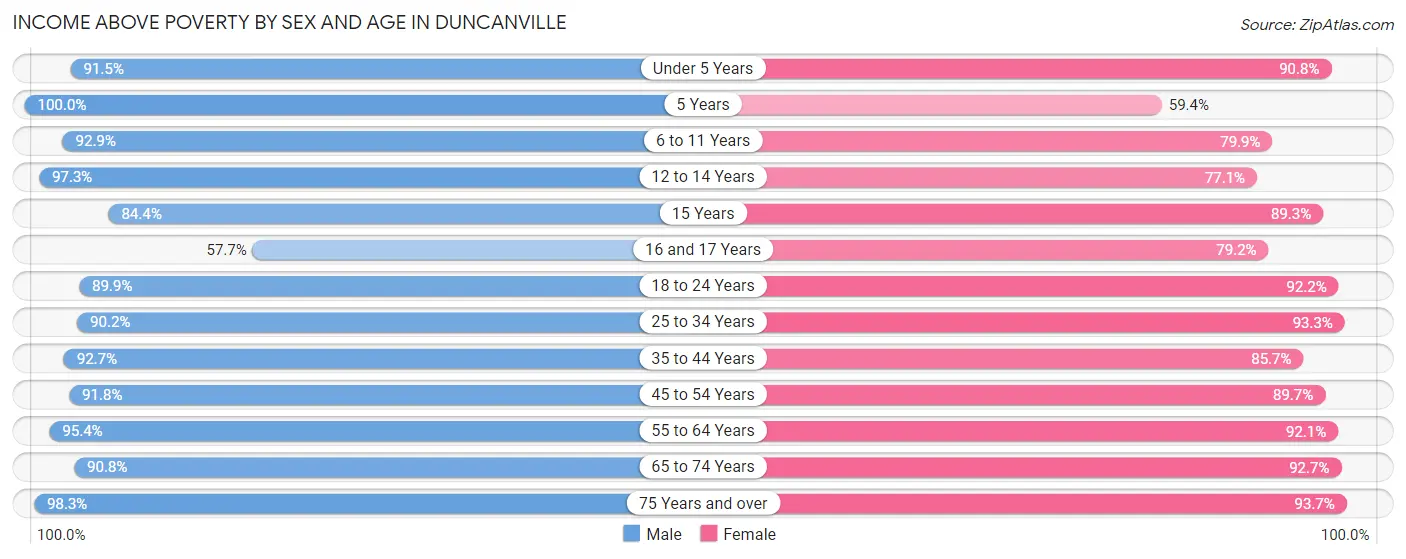
Income Above Poverty by Sex and Age in Duncanville
According to the poverty statistics in Duncanville, males aged 5 years and females aged 75 years and over are the age groups that are most secure financially, with 100.0% of males and 93.7% of females in these age groups living above the poverty line.
| Age Bracket | Male | Female |
| Under 5 Years | 955 (91.5%) | 1,220 (90.8%) |
| 5 Years | 347 (100.0%) | 177 (59.4%) |
| 6 to 11 Years | 1,475 (92.9%) | 1,515 (79.9%) |
| 12 to 14 Years | 1,019 (97.3%) | 799 (77.0%) |
| 15 Years | 233 (84.4%) | 251 (89.3%) |
| 16 and 17 Years | 390 (57.7%) | 544 (79.2%) |
| 18 to 24 Years | 1,947 (89.9%) | 1,468 (92.2%) |
| 25 to 34 Years | 1,766 (90.2%) | 2,339 (93.3%) |
| 35 to 44 Years | 2,356 (92.7%) | 2,467 (85.7%) |
| 45 to 54 Years | 1,836 (91.7%) | 2,064 (89.7%) |
| 55 to 64 Years | 2,730 (95.4%) | 2,229 (92.1%) |
| 65 to 74 Years | 1,658 (90.8%) | 2,070 (92.7%) |
| 75 Years and over | 792 (98.3%) | 1,382 (93.7%) |
| Total | 17,504 (91.5%) | 18,525 (88.4%) |
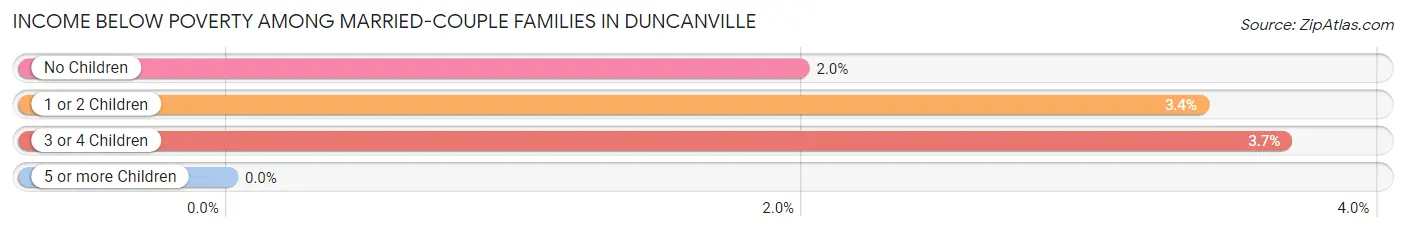
Income Below Poverty Among Married-Couple Families in Duncanville
The poverty statistics for married-couple families in Duncanville show that 2.5% or 163 of the total 6,431 families live below the poverty line. Families with 3 or 4 children have the highest poverty rate of 3.7%, comprising of 23 families. On the other hand, families with 5 or more children have the lowest poverty rate of 0.0%, which includes 0 families.
| Children | Above Poverty | Below Poverty |
| No Children | 3,695 (98.0%) | 75 (2.0%) |
| 1 or 2 Children | 1,858 (96.6%) | 65 (3.4%) |
| 3 or 4 Children | 603 (96.3%) | 23 (3.7%) |
| 5 or more Children | 112 (100.0%) | 0 (0.0%) |
| Total | 6,268 (97.5%) | 163 (2.5%) |
Income Below Poverty Among Single-Parent Households in Duncanville
According to the poverty data in Duncanville, 14.7% or 123 single-father households and 18.8% or 492 single-mother households are living below the poverty line. Among single-father households, those with 3 or 4 children have the highest poverty rate, with 46 households (49.5%) experiencing poverty. Likewise, among single-mother households, those with 3 or 4 children have the highest poverty rate, with 125 households (46.1%) falling below the poverty line.
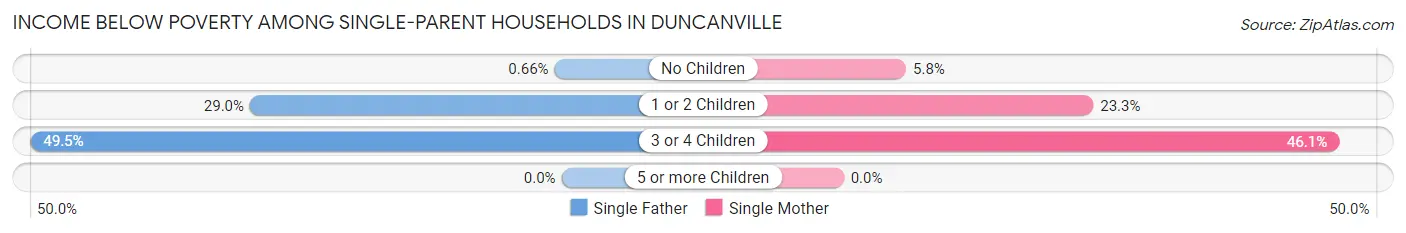
| Children | Single Father | Single Mother |
| No Children | 3 (0.7%) | 59 (5.8%) |
| 1 or 2 Children | 74 (29.0%) | 308 (23.3%) |
| 3 or 4 Children | 46 (49.5%) | 125 (46.1%) |
| 5 or more Children | 0 (0.0%) | 0 (0.0%) |
| Total | 123 (14.7%) | 492 (18.8%) |
Income Below Poverty Among Married-Couple vs Single-Parent Households in Duncanville
The poverty data for Duncanville shows that 163 of the married-couple family households (2.5%) and 615 of the single-parent households (17.8%) are living below the poverty level. Within the married-couple family households, those with 3 or 4 children have the highest poverty rate, with 23 households (3.7%) falling below the poverty line. Among the single-parent households, those with 3 or 4 children have the highest poverty rate, with 171 household (47.0%) living below poverty.
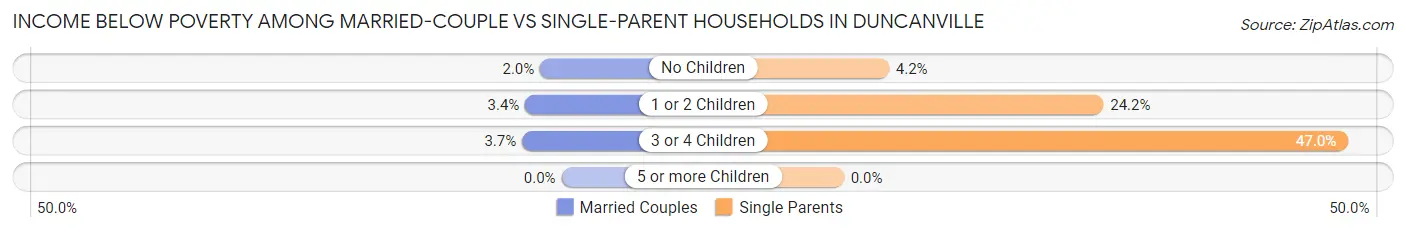
| Children | Married-Couple Families | Single-Parent Households |
| No Children | 75 (2.0%) | 62 (4.2%) |
| 1 or 2 Children | 65 (3.4%) | 382 (24.2%) |
| 3 or 4 Children | 23 (3.7%) | 171 (47.0%) |
| 5 or more Children | 0 (0.0%) | 0 (0.0%) |
| Total | 163 (2.5%) | 615 (17.8%) |
Race in Duncanville
The most populous races in Duncanville are Hispanic or Latino (16,947 | 42.1%), White / Caucasian (16,261 | 40.4%), and Black / African American (13,047 | 32.4%).
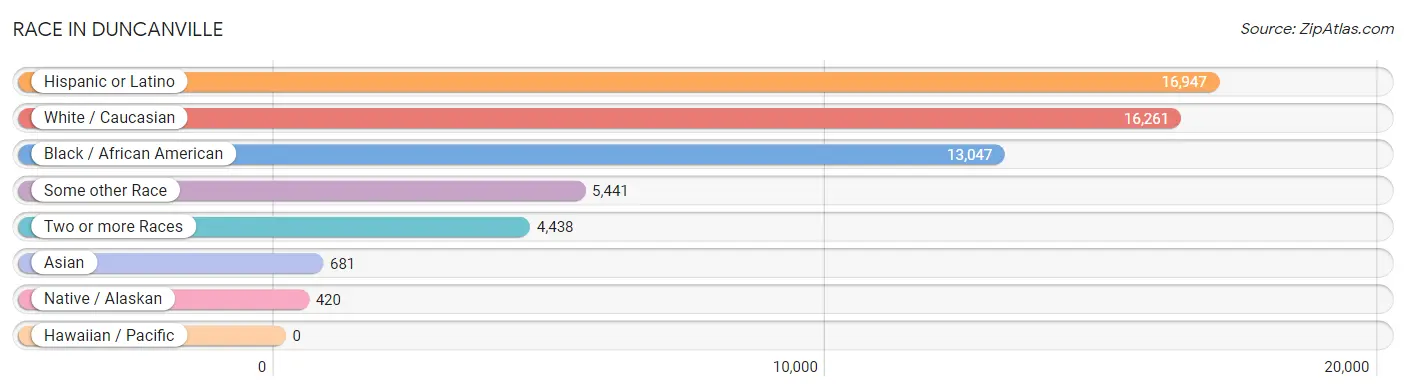
| Race | # Population | % Population |
| Asian | 681 | 1.7% |
| Black / African American | 13,047 | 32.4% |
| Hawaiian / Pacific | 0 | 0.0% |
| Hispanic or Latino | 16,947 | 42.1% |
| Native / Alaskan | 420 | 1.0% |
| White / Caucasian | 16,261 | 40.4% |
| Two or more Races | 4,438 | 11.0% |
| Some other Race | 5,441 | 13.5% |
| Total | 40,288 | 100.0% |
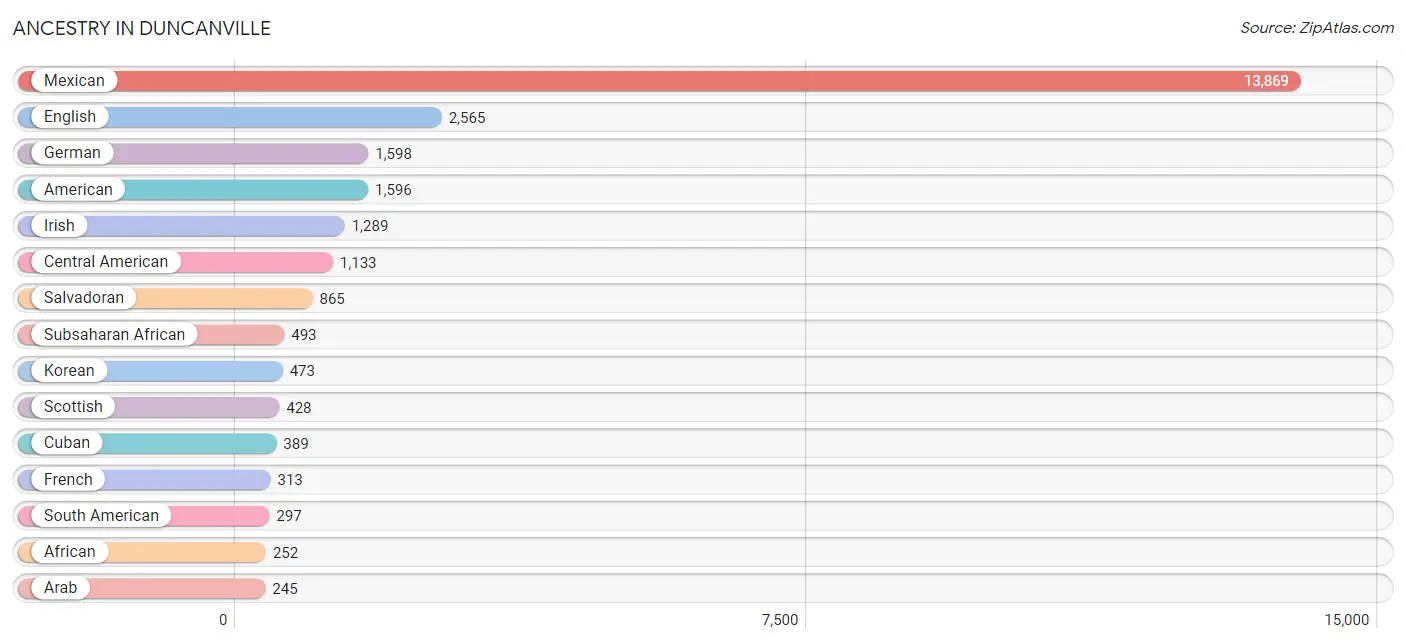
Ancestry in Duncanville
The most populous ancestries reported in Duncanville are Mexican (13,869 | 34.4%), English (2,565 | 6.4%), German (1,598 | 4.0%), American (1,596 | 4.0%), and Irish (1,289 | 3.2%), together accounting for 51.9% of all Duncanville residents.
| Ancestry | # Population | % Population |
| African | 252 | 0.6% |
| American | 1,596 | 4.0% |
| Apache | 7 | 0.0% |
| Arab | 245 | 0.6% |
| Argentinean | 124 | 0.3% |
| Austrian | 9 | 0.0% |
| Basque | 30 | 0.1% |
| Bhutanese | 134 | 0.3% |
| British | 214 | 0.5% |
| Burmese | 59 | 0.2% |
| Canadian | 23 | 0.1% |
| Central American | 1,133 | 2.8% |
| Cherokee | 169 | 0.4% |
| Choctaw | 11 | 0.0% |
| Colombian | 167 | 0.4% |
| Costa Rican | 97 | 0.2% |
| Creek | 51 | 0.1% |
| Croatian | 14 | 0.0% |
| Cuban | 389 | 1.0% |
| Czech | 52 | 0.1% |
| Czechoslovakian | 170 | 0.4% |
| Danish | 32 | 0.1% |
| Dutch | 115 | 0.3% |
| Dutch West Indian | 8 | 0.0% |
| Eastern European | 13 | 0.0% |
| English | 2,565 | 6.4% |
| European | 227 | 0.6% |
| Finnish | 9 | 0.0% |
| French | 313 | 0.8% |
| French Canadian | 16 | 0.0% |
| German | 1,598 | 4.0% |
| Ghanaian | 111 | 0.3% |
| Greek | 73 | 0.2% |
| Guatemalan | 110 | 0.3% |
| Haitian | 46 | 0.1% |
| Honduran | 32 | 0.1% |
| Hungarian | 15 | 0.0% |
| Indian (Asian) | 44 | 0.1% |
| Irish | 1,289 | 3.2% |
| Italian | 171 | 0.4% |
| Jamaican | 48 | 0.1% |
| Jordanian | 141 | 0.4% |
| Korean | 473 | 1.2% |
| Lithuanian | 16 | 0.0% |
| Maltese | 23 | 0.1% |
| Mexican | 13,869 | 34.4% |
| Mexican American Indian | 203 | 0.5% |
| Native Hawaiian | 9 | 0.0% |
| Nicaraguan | 29 | 0.1% |
| Nigerian | 145 | 0.4% |
| Northern European | 35 | 0.1% |
| Norwegian | 63 | 0.2% |
| Peruvian | 6 | 0.0% |
| Polish | 194 | 0.5% |
| Portuguese | 6 | 0.0% |
| Pueblo | 7 | 0.0% |
| Puerto Rican | 21 | 0.1% |
| Romanian | 7 | 0.0% |
| Russian | 65 | 0.2% |
| Salvadoran | 865 | 2.1% |
| Samoan | 28 | 0.1% |
| Scandinavian | 47 | 0.1% |
| Scotch-Irish | 213 | 0.5% |
| Scottish | 428 | 1.1% |
| Serbian | 14 | 0.0% |
| South American | 297 | 0.7% |
| Spaniard | 85 | 0.2% |
| Spanish | 99 | 0.3% |
| Subsaharan African | 493 | 1.2% |
| Swedish | 110 | 0.3% |
| Swiss | 32 | 0.1% |
| Syrian | 9 | 0.0% |
| Thai | 162 | 0.4% |
| Vietnamese | 89 | 0.2% |
| Welsh | 99 | 0.3% | View All 75 Rows |
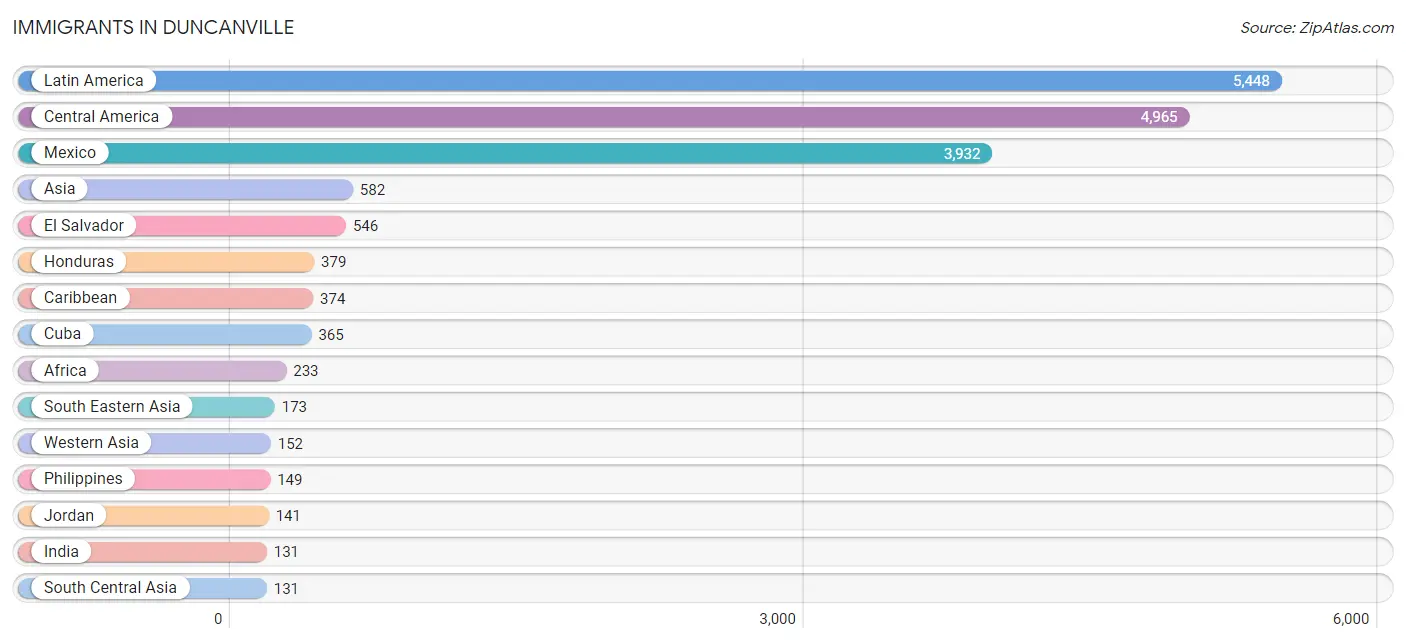
Immigrants in Duncanville
The most numerous immigrant groups reported in Duncanville came from Latin America (5,448 | 13.5%), Central America (4,965 | 12.3%), Mexico (3,932 | 9.8%), Asia (582 | 1.4%), and El Salvador (546 | 1.4%), together accounting for 38.4% of all Duncanville residents.
| Immigration Origin | # Population | % Population |
| Africa | 233 | 0.6% |
| Argentina | 59 | 0.2% |
| Asia | 582 | 1.4% |
| Cameroon | 37 | 0.1% |
| Canada | 42 | 0.1% |
| Caribbean | 374 | 0.9% |
| Central America | 4,965 | 12.3% |
| Colombia | 35 | 0.1% |
| Croatia | 14 | 0.0% |
| Cuba | 365 | 0.9% |
| Czechoslovakia | 12 | 0.0% |
| Eastern Africa | 12 | 0.0% |
| Eastern Asia | 81 | 0.2% |
| Eastern Europe | 33 | 0.1% |
| El Salvador | 546 | 1.4% |
| England | 6 | 0.0% |
| Europe | 106 | 0.3% |
| Ghana | 70 | 0.2% |
| Guatemala | 79 | 0.2% |
| Honduras | 379 | 0.9% |
| India | 131 | 0.3% |
| Ireland | 10 | 0.0% |
| Japan | 44 | 0.1% |
| Jordan | 141 | 0.4% |
| Korea | 37 | 0.1% |
| Latin America | 5,448 | 13.5% |
| Malaysia | 24 | 0.1% |
| Mexico | 3,932 | 9.8% |
| Middle Africa | 37 | 0.1% |
| Nicaragua | 29 | 0.1% |
| Nigeria | 35 | 0.1% |
| Northern Europe | 58 | 0.1% |
| Peru | 15 | 0.0% |
| Philippines | 149 | 0.4% |
| Romania | 7 | 0.0% |
| Scotland | 26 | 0.1% |
| South Africa | 67 | 0.2% |
| South America | 109 | 0.3% |
| South Central Asia | 131 | 0.3% |
| South Eastern Asia | 173 | 0.4% |
| Switzerland | 15 | 0.0% |
| Syria | 11 | 0.0% |
| Trinidad and Tobago | 9 | 0.0% |
| Western Africa | 105 | 0.3% |
| Western Asia | 152 | 0.4% |
| Western Europe | 15 | 0.0% |
| Zimbabwe | 12 | 0.0% | View All 47 Rows |
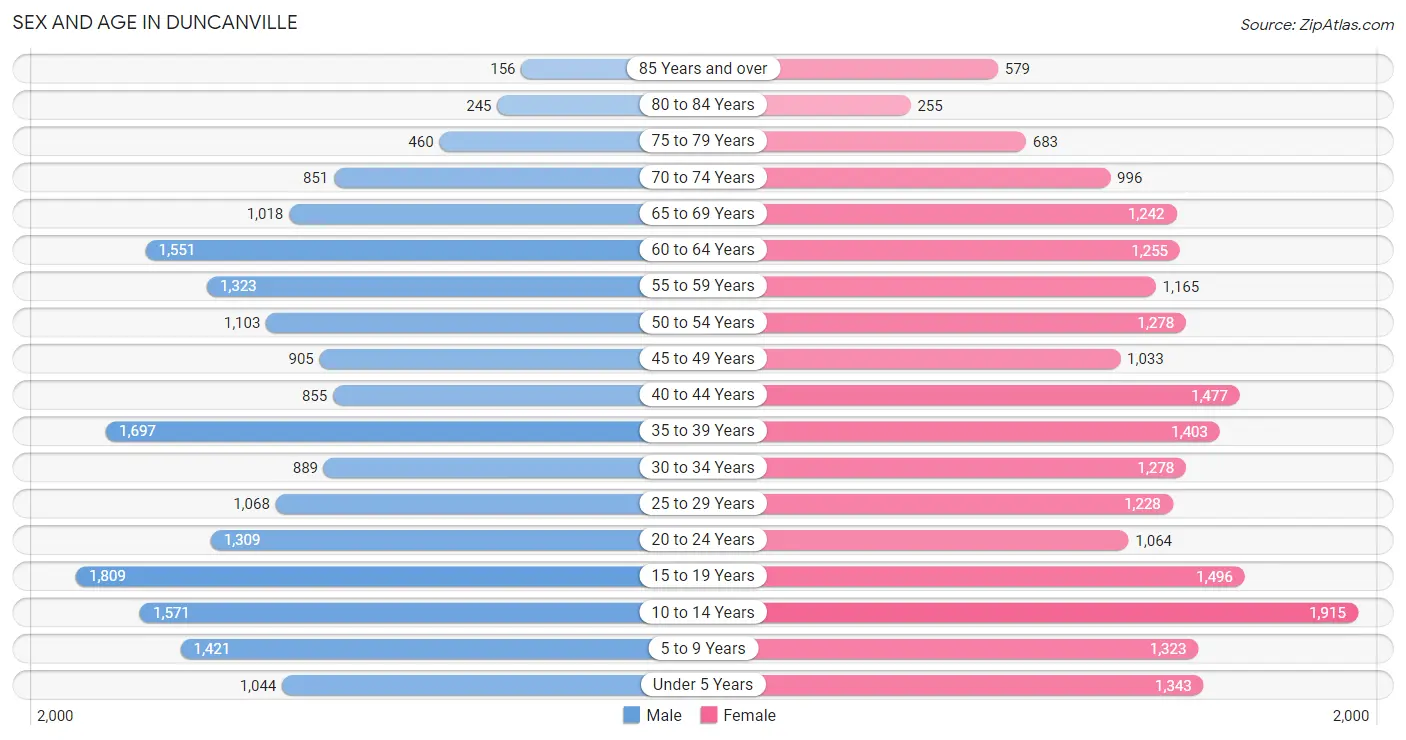
Sex and Age in Duncanville
Sex and Age in Duncanville
The most populous age groups in Duncanville are 15 to 19 Years (1,809 | 9.4%) for men and 10 to 14 Years (1,915 | 9.1%) for women.
| Age Bracket | Male | Female |
| Under 5 Years | 1,044 (5.4%) | 1,343 (6.4%) |
| 5 to 9 Years | 1,421 (7.4%) | 1,323 (6.3%) |
| 10 to 14 Years | 1,571 (8.2%) | 1,915 (9.1%) |
| 15 to 19 Years | 1,809 (9.4%) | 1,496 (7.1%) |
| 20 to 24 Years | 1,309 (6.8%) | 1,064 (5.1%) |
| 25 to 29 Years | 1,068 (5.5%) | 1,228 (5.8%) |
| 30 to 34 Years | 889 (4.6%) | 1,278 (6.1%) |
| 35 to 39 Years | 1,697 (8.8%) | 1,403 (6.7%) |
| 40 to 44 Years | 855 (4.4%) | 1,477 (7.0%) |
| 45 to 49 Years | 905 (4.7%) | 1,033 (4.9%) |
| 50 to 54 Years | 1,103 (5.7%) | 1,278 (6.1%) |
| 55 to 59 Years | 1,323 (6.9%) | 1,165 (5.5%) |
| 60 to 64 Years | 1,551 (8.1%) | 1,255 (6.0%) |
| 65 to 69 Years | 1,018 (5.3%) | 1,242 (5.9%) |
| 70 to 74 Years | 851 (4.4%) | 996 (4.7%) |
| 75 to 79 Years | 460 (2.4%) | 683 (3.3%) |
| 80 to 84 Years | 245 (1.3%) | 255 (1.2%) |
| 85 Years and over | 156 (0.8%) | 579 (2.8%) |
| Total | 19,275 (100.0%) | 21,013 (100.0%) |
Families and Households in Duncanville
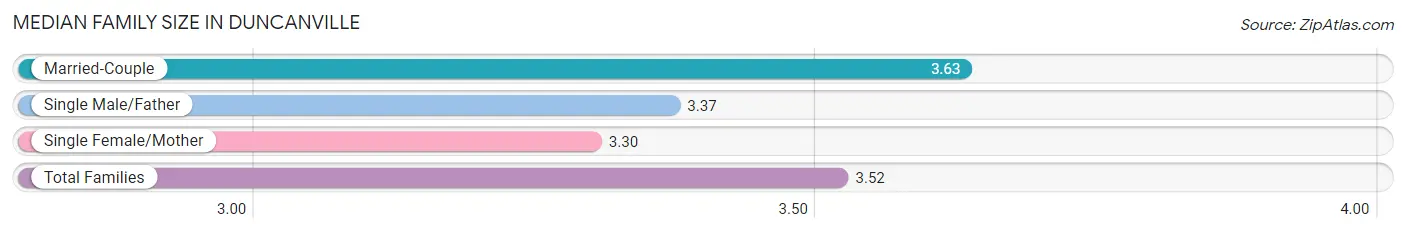
Median Family Size in Duncanville
The median family size in Duncanville is 3.52 persons per family, with married-couple families (6,431 | 65.1%) accounting for the largest median family size of 3.63 persons per family. On the other hand, single female/mother families (2,612 | 26.4%) represent the smallest median family size with 3.30 persons per family.
| Family Type | # Families | Family Size |
| Married-Couple | 6,431 (65.1%) | 3.63 |
| Single Male/Father | 837 (8.5%) | 3.37 |
| Single Female/Mother | 2,612 (26.4%) | 3.30 |
| Total Families | 9,880 (100.0%) | 3.52 |
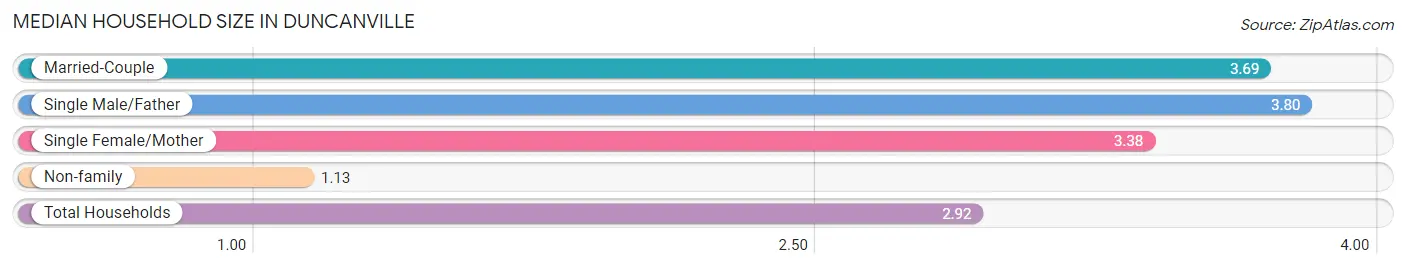
Median Household Size in Duncanville
The median household size in Duncanville is 2.92 persons per household, with single male/father households (837 | 6.1%) accounting for the largest median household size of 3.8 persons per household. non-family households (3,820 | 27.9%) represent the smallest median household size with 1.13 persons per household.
| Household Type | # Households | Household Size |
| Married-Couple | 6,431 (46.9%) | 3.69 |
| Single Male/Father | 837 (6.1%) | 3.80 |
| Single Female/Mother | 2,612 (19.1%) | 3.38 |
| Non-family | 3,820 (27.9%) | 1.13 |
| Total Households | 13,700 (100.0%) | 2.92 |
Household Size by Marriage Status in Duncanville
Out of a total of 13,700 households in Duncanville, 9,880 (72.1%) are family households, while 3,820 (27.9%) are nonfamily households. The most numerous type of family households are 2-person households, comprising 3,471, and the most common type of nonfamily households are 1-person households, comprising 3,417.
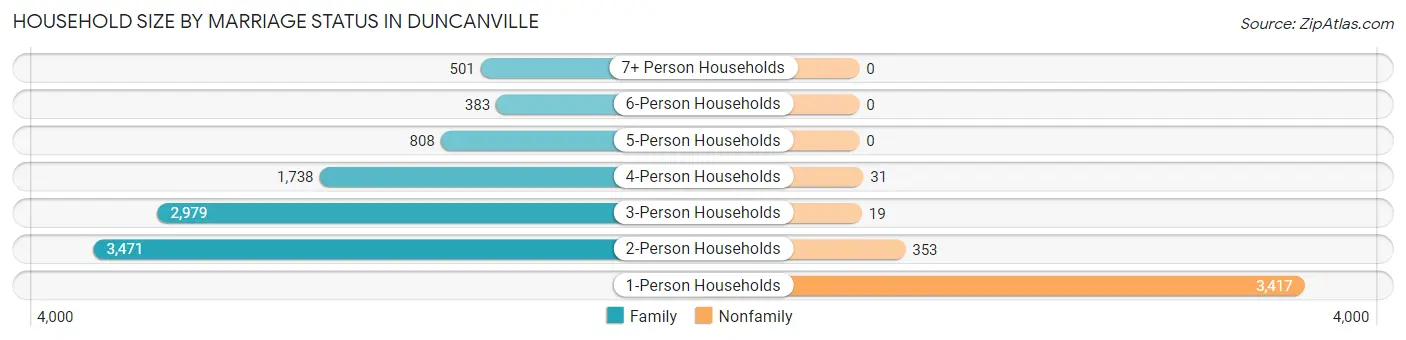
| Household Size | Family Households | Nonfamily Households |
| 1-Person Households | - | 3,417 (24.9%) |
| 2-Person Households | 3,471 (25.3%) | 353 (2.6%) |
| 3-Person Households | 2,979 (21.7%) | 19 (0.1%) |
| 4-Person Households | 1,738 (12.7%) | 31 (0.2%) |
| 5-Person Households | 808 (5.9%) | 0 (0.0%) |
| 6-Person Households | 383 (2.8%) | 0 (0.0%) |
| 7+ Person Households | 501 (3.7%) | 0 (0.0%) |
| Total | 9,880 (72.1%) | 3,820 (27.9%) |
Female Fertility in Duncanville
Fertility by Age in Duncanville
Average fertility rate in Duncanville is 56.0 births per 1,000 women. Women in the age bracket of 20 to 34 years have the highest fertility rate with 117.0 births per 1,000 women. Women in the age bracket of 20 to 34 years acount for 80.8% of all women with births.
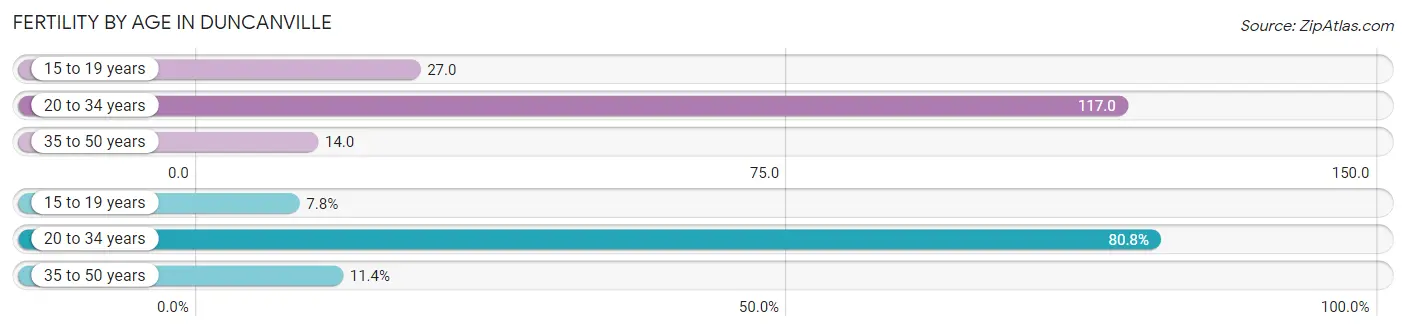
| Age Bracket | Women with Births | Births / 1,000 Women |
| 15 to 19 years | 40 (7.7%) | 27.0 |
| 20 to 34 years | 417 (80.8%) | 117.0 |
| 35 to 50 years | 59 (11.4%) | 14.0 |
| Total | 516 (100.0%) | 56.0 |
Fertility by Age by Marriage Status in Duncanville
54.3% of women with births (516) in Duncanville are married. The highest percentage of unmarried women with births falls into 15 to 19 years age bracket with 55.0% of them unmarried at the time of birth, while the lowest percentage of unmarried women with births belong to 20 to 34 years age bracket with 44.4% of them unmarried.
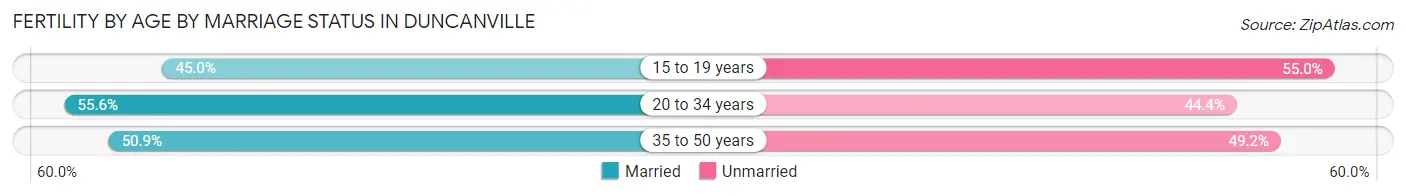
| Age Bracket | Married | Unmarried |
| 15 to 19 years | 18 (45.0%) | 22 (55.0%) |
| 20 to 34 years | 232 (55.6%) | 185 (44.4%) |
| 35 to 50 years | 30 (50.8%) | 29 (49.1%) |
| Total | 280 (54.3%) | 236 (45.7%) |
Fertility by Education in Duncanville
Average fertility rate in Duncanville is 56.0 births per 1,000 women. Women with the education attainment of college or associate's degree have the highest fertility rate of 68.0 births per 1,000 women, while women with the education attainment of bachelor's degree have the lowest fertility at 20.0 births per 1,000 women. Women with the education attainment of college or associate's degree represent 33.7% of all women with births.
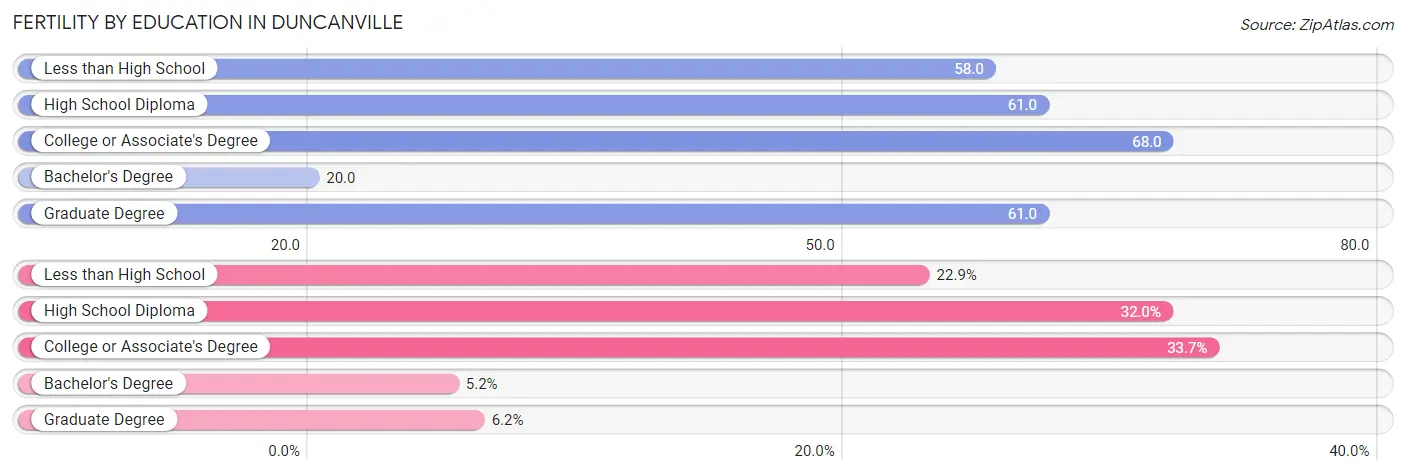
| Educational Attainment | Women with Births | Births / 1,000 Women |
| Less than High School | 118 (22.9%) | 58.0 |
| High School Diploma | 165 (32.0%) | 61.0 |
| College or Associate's Degree | 174 (33.7%) | 68.0 |
| Bachelor's Degree | 27 (5.2%) | 20.0 |
| Graduate Degree | 32 (6.2%) | 61.0 |
| Total | 516 (100.0%) | 56.0 |
Fertility by Education by Marriage Status in Duncanville
45.7% of women with births in Duncanville are unmarried. Women with the educational attainment of bachelor's degree are most likely to be married with 100.0% of them married at childbirth, while women with the educational attainment of college or associate's degree are least likely to be married with 97.1% of them unmarried at childbirth.
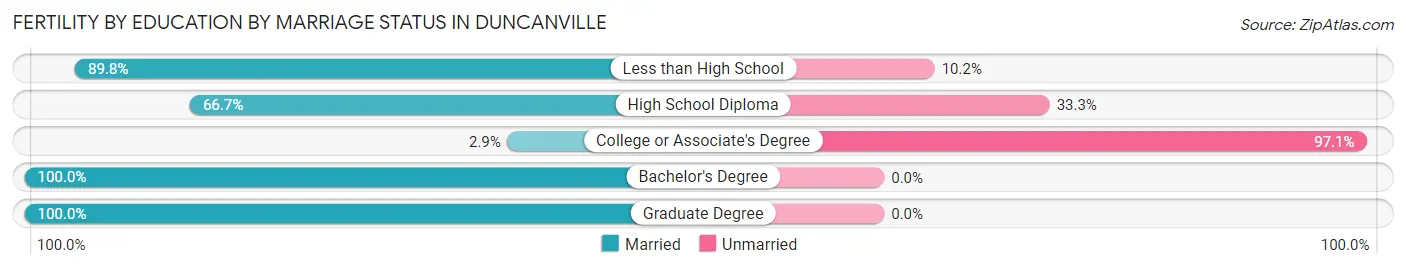
| Educational Attainment | Married | Unmarried |
| Less than High School | 106 (89.8%) | 12 (10.2%) |
| High School Diploma | 110 (66.7%) | 55 (33.3%) |
| College or Associate's Degree | 5 (2.9%) | 169 (97.1%) |
| Bachelor's Degree | 27 (100.0%) | 0 (0.0%) |
| Graduate Degree | 32 (100.0%) | 0 (0.0%) |
| Total | 280 (54.3%) | 236 (45.7%) |
Employment Characteristics in Duncanville
Employment by Class of Employer in Duncanville
Among the 17,309 employed individuals in Duncanville, private company employees (11,893 | 68.7%), self-employed (not incorporated) (1,439 | 8.3%), and local government employees (1,393 | 8.1%) make up the most common classes of employment.
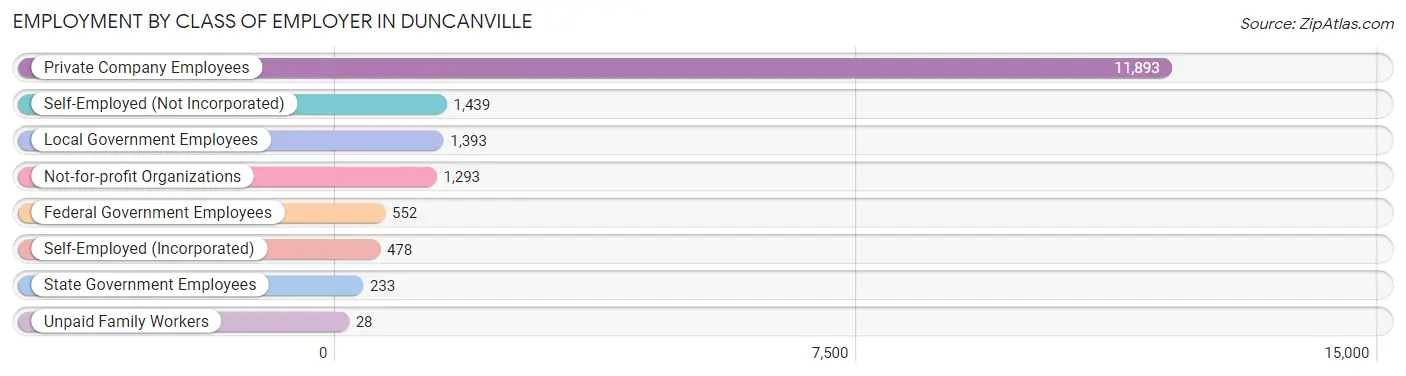
| Employer Class | # Employees | % Employees |
| Private Company Employees | 11,893 | 68.7% |
| Self-Employed (Incorporated) | 478 | 2.8% |
| Self-Employed (Not Incorporated) | 1,439 | 8.3% |
| Not-for-profit Organizations | 1,293 | 7.5% |
| Local Government Employees | 1,393 | 8.1% |
| State Government Employees | 233 | 1.3% |
| Federal Government Employees | 552 | 3.2% |
| Unpaid Family Workers | 28 | 0.2% |
| Total | 17,309 | 100.0% |
Employment Status by Age in Duncanville
According to the labor force statistics for Duncanville, out of the total population over 16 years of age (31,114), 62.2% or 19,353 individuals are in the labor force, with 7.6% or 1,471 of them unemployed. The age group with the highest labor force participation rate is 30 to 34 years, with 88.0% or 1,907 individuals in the labor force. Within the labor force, the 25 to 29 years age range has the highest percentage of unemployed individuals, with 17.1% or 288 of them being unemployed.
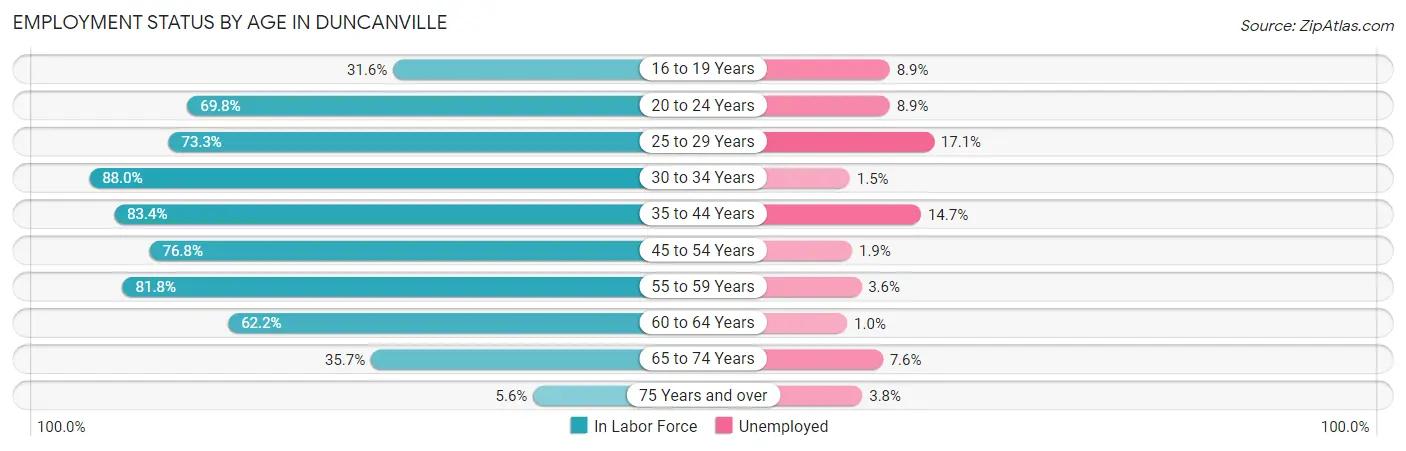
| Age Bracket | In Labor Force | Unemployed |
| 16 to 19 Years | 868 (31.6%) | 77 (8.9%) |
| 20 to 24 Years | 1,656 (69.8%) | 147 (8.9%) |
| 25 to 29 Years | 1,683 (73.3%) | 288 (17.1%) |
| 30 to 34 Years | 1,907 (88.0%) | 29 (1.5%) |
| 35 to 44 Years | 4,530 (83.4%) | 666 (14.7%) |
| 45 to 54 Years | 3,317 (76.8%) | 63 (1.9%) |
| 55 to 59 Years | 2,035 (81.8%) | 73 (3.6%) |
| 60 to 64 Years | 1,745 (62.2%) | 17 (1.0%) |
| 65 to 74 Years | 1,466 (35.7%) | 111 (7.6%) |
| 75 Years and over | 133 (5.6%) | 5 (3.8%) |
| Total | 19,353 (62.2%) | 1,471 (7.6%) |
Employment Status by Educational Attainment in Duncanville
According to labor force statistics for Duncanville, 78.0% of individuals (15,216) out of the total population between 25 and 64 years of age (19,508) are in the labor force, with 7.5% or 1,141 of them being unemployed. The group with the highest labor force participation rate are those with the educational attainment of bachelor's degree or higher, with 84.0% or 3,497 individuals in the labor force. Within the labor force, individuals with high school diploma education have the highest percentage of unemployment, with 13.6% or 611 of them being unemployed.
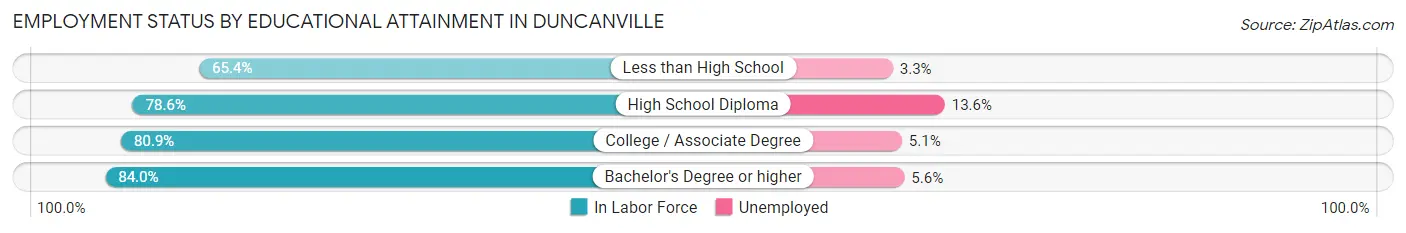
| Educational Attainment | In Labor Force | Unemployed |
| Less than High School | 2,350 (65.4%) | 119 (3.3%) |
| High School Diploma | 4,496 (78.6%) | 778 (13.6%) |
| College / Associate Degree | 4,880 (80.9%) | 308 (5.1%) |
| Bachelor's Degree or higher | 3,497 (84.0%) | 233 (5.6%) |
| Total | 15,216 (78.0%) | 1,463 (7.5%) |
Employment Occupations by Sex in Duncanville
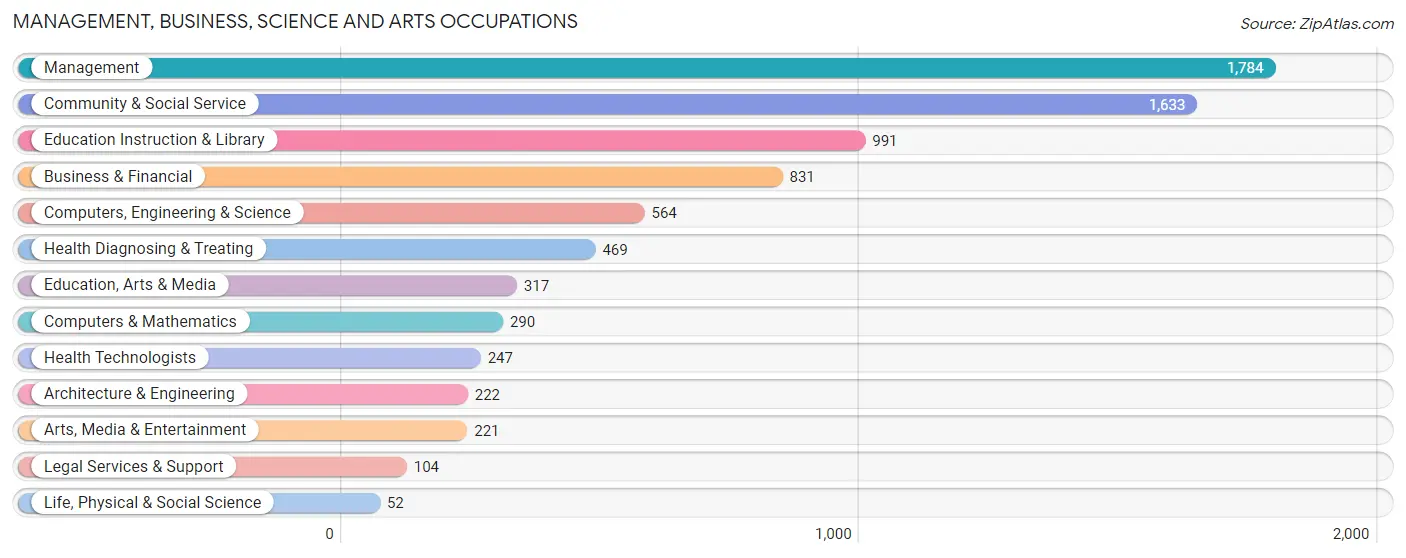
Management, Business, Science and Arts Occupations
The most common Management, Business, Science and Arts occupations in Duncanville are Management (1,784 | 10.0%), Community & Social Service (1,633 | 9.1%), Education Instruction & Library (991 | 5.6%), Business & Financial (831 | 4.6%), and Computers, Engineering & Science (564 | 3.2%).
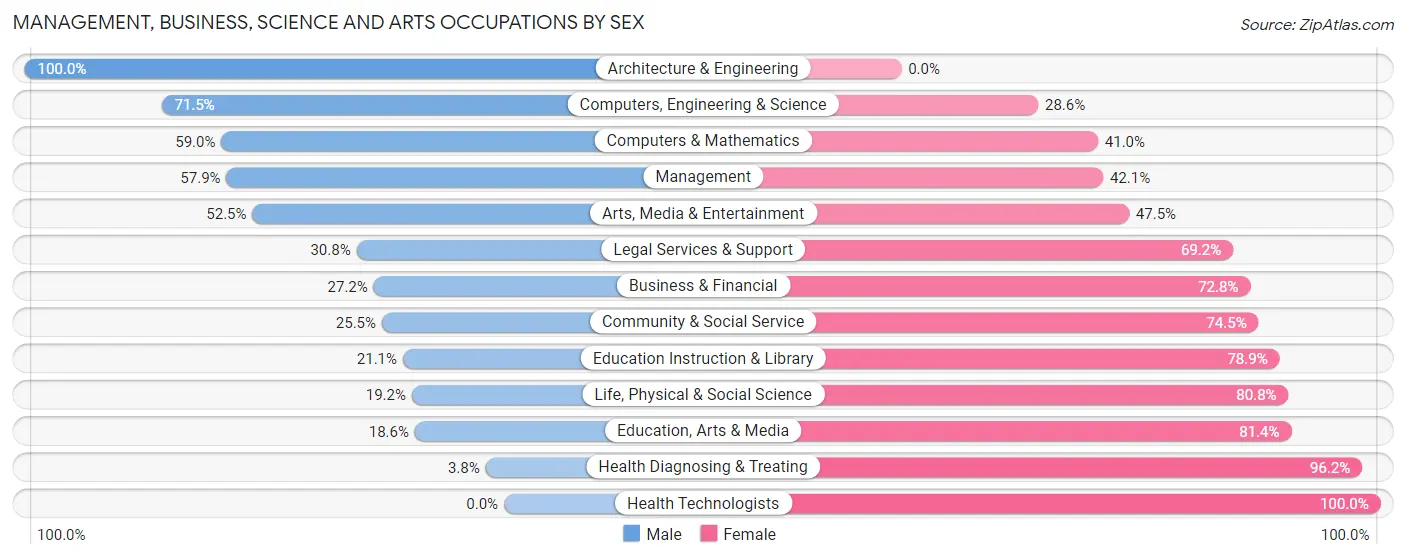
Management, Business, Science and Arts Occupations by Sex
Within the Management, Business, Science and Arts occupations in Duncanville, the most male-oriented occupations are Architecture & Engineering (100.0%), Computers, Engineering & Science (71.5%), and Computers & Mathematics (59.0%), while the most female-oriented occupations are Health Technologists (100.0%), Health Diagnosing & Treating (96.2%), and Education, Arts & Media (81.4%).
| Occupation | Male | Female |
| Management | 1,033 (57.9%) | 751 (42.1%) |
| Business & Financial | 226 (27.2%) | 605 (72.8%) |
| Computers, Engineering & Science | 403 (71.5%) | 161 (28.5%) |
| Computers & Mathematics | 171 (59.0%) | 119 (41.0%) |
| Architecture & Engineering | 222 (100.0%) | 0 (0.0%) |
| Life, Physical & Social Science | 10 (19.2%) | 42 (80.8%) |
| Community & Social Service | 416 (25.5%) | 1,217 (74.5%) |
| Education, Arts & Media | 59 (18.6%) | 258 (81.4%) |
| Legal Services & Support | 32 (30.8%) | 72 (69.2%) |
| Education Instruction & Library | 209 (21.1%) | 782 (78.9%) |
| Arts, Media & Entertainment | 116 (52.5%) | 105 (47.5%) |
| Health Diagnosing & Treating | 18 (3.8%) | 451 (96.2%) |
| Health Technologists | 0 (0.0%) | 247 (100.0%) |
| Total (Category) | 2,096 (39.7%) | 3,185 (60.3%) |
| Total (Overall) | 9,398 (52.6%) | 8,470 (47.4%) |
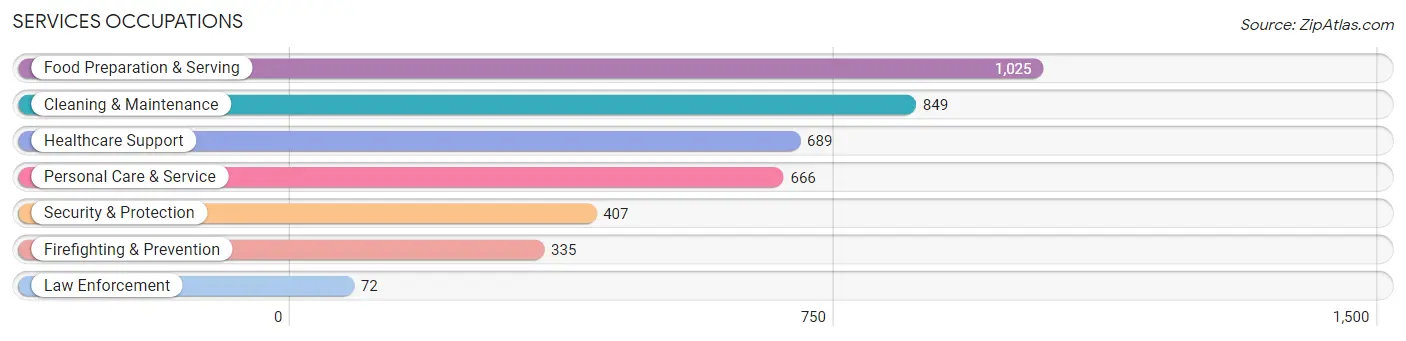
Services Occupations
The most common Services occupations in Duncanville are Food Preparation & Serving (1,025 | 5.7%), Cleaning & Maintenance (849 | 4.8%), Healthcare Support (689 | 3.9%), Personal Care & Service (666 | 3.7%), and Security & Protection (407 | 2.3%).
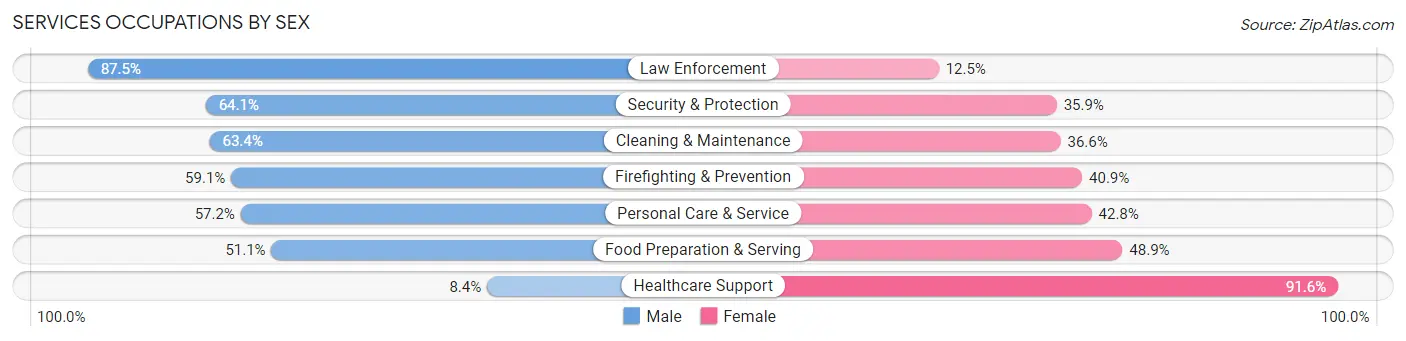
Services Occupations by Sex
Within the Services occupations in Duncanville, the most male-oriented occupations are Law Enforcement (87.5%), Security & Protection (64.1%), and Cleaning & Maintenance (63.4%), while the most female-oriented occupations are Healthcare Support (91.6%), Food Preparation & Serving (48.9%), and Personal Care & Service (42.8%).
| Occupation | Male | Female |
| Healthcare Support | 58 (8.4%) | 631 (91.6%) |
| Security & Protection | 261 (64.1%) | 146 (35.9%) |
| Firefighting & Prevention | 198 (59.1%) | 137 (40.9%) |
| Law Enforcement | 63 (87.5%) | 9 (12.5%) |
| Food Preparation & Serving | 524 (51.1%) | 501 (48.9%) |
| Cleaning & Maintenance | 538 (63.4%) | 311 (36.6%) |
| Personal Care & Service | 381 (57.2%) | 285 (42.8%) |
| Total (Category) | 1,762 (48.5%) | 1,874 (51.5%) |
| Total (Overall) | 9,398 (52.6%) | 8,470 (47.4%) |
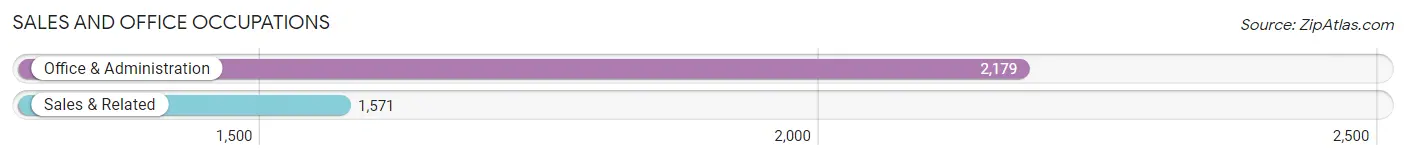
Sales and Office Occupations
The most common Sales and Office occupations in Duncanville are Office & Administration (2,179 | 12.2%), and Sales & Related (1,571 | 8.8%).
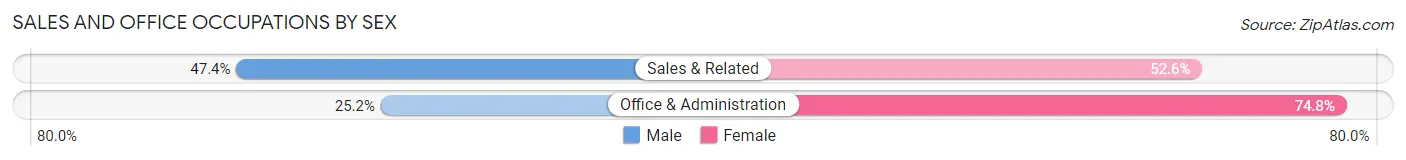
Sales and Office Occupations by Sex
| Occupation | Male | Female |
| Sales & Related | 745 (47.4%) | 826 (52.6%) |
| Office & Administration | 549 (25.2%) | 1,630 (74.8%) |
| Total (Category) | 1,294 (34.5%) | 2,456 (65.5%) |
| Total (Overall) | 9,398 (52.6%) | 8,470 (47.4%) |
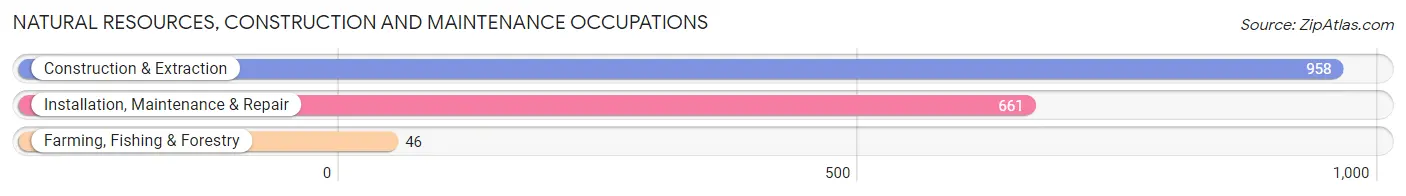
Natural Resources, Construction and Maintenance Occupations
The most common Natural Resources, Construction and Maintenance occupations in Duncanville are Construction & Extraction (958 | 5.4%), Installation, Maintenance & Repair (661 | 3.7%), and Farming, Fishing & Forestry (46 | 0.3%).
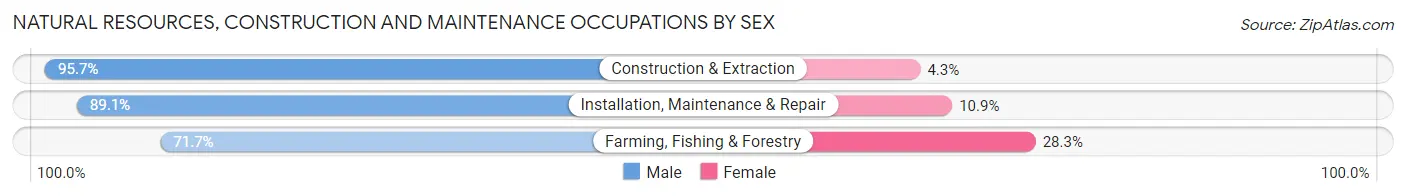
Natural Resources, Construction and Maintenance Occupations by Sex
| Occupation | Male | Female |
| Farming, Fishing & Forestry | 33 (71.7%) | 13 (28.3%) |
| Construction & Extraction | 917 (95.7%) | 41 (4.3%) |
| Installation, Maintenance & Repair | 589 (89.1%) | 72 (10.9%) |
| Total (Category) | 1,539 (92.4%) | 126 (7.6%) |
| Total (Overall) | 9,398 (52.6%) | 8,470 (47.4%) |
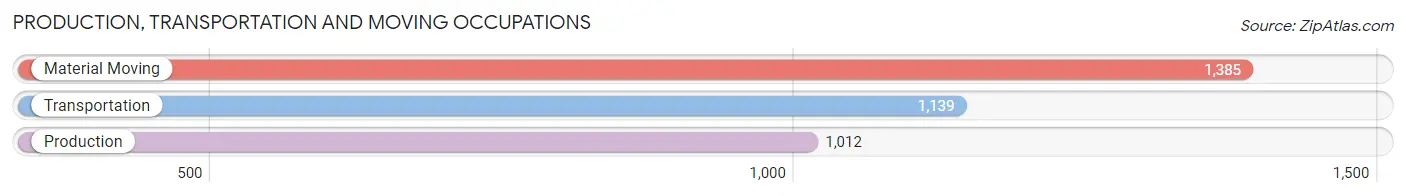
Production, Transportation and Moving Occupations
The most common Production, Transportation and Moving occupations in Duncanville are Material Moving (1,385 | 7.7%), Transportation (1,139 | 6.4%), and Production (1,012 | 5.7%).
Production, Transportation and Moving Occupations by Sex
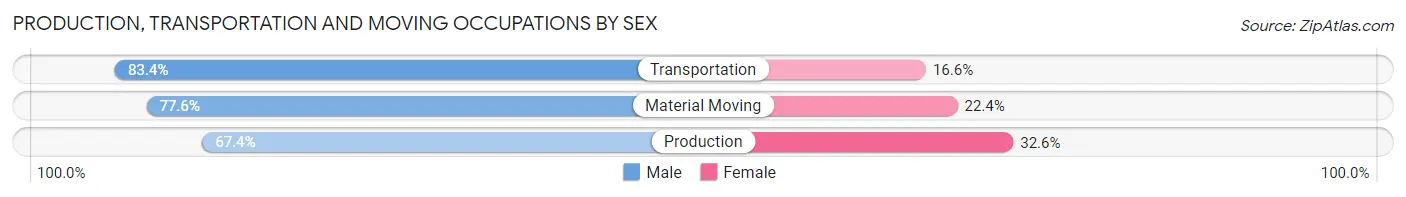
| Occupation | Male | Female |
| Production | 682 (67.4%) | 330 (32.6%) |
| Transportation | 950 (83.4%) | 189 (16.6%) |
| Material Moving | 1,075 (77.6%) | 310 (22.4%) |
| Total (Category) | 2,707 (76.6%) | 829 (23.4%) |
| Total (Overall) | 9,398 (52.6%) | 8,470 (47.4%) |
Employment Industries by Sex in Duncanville
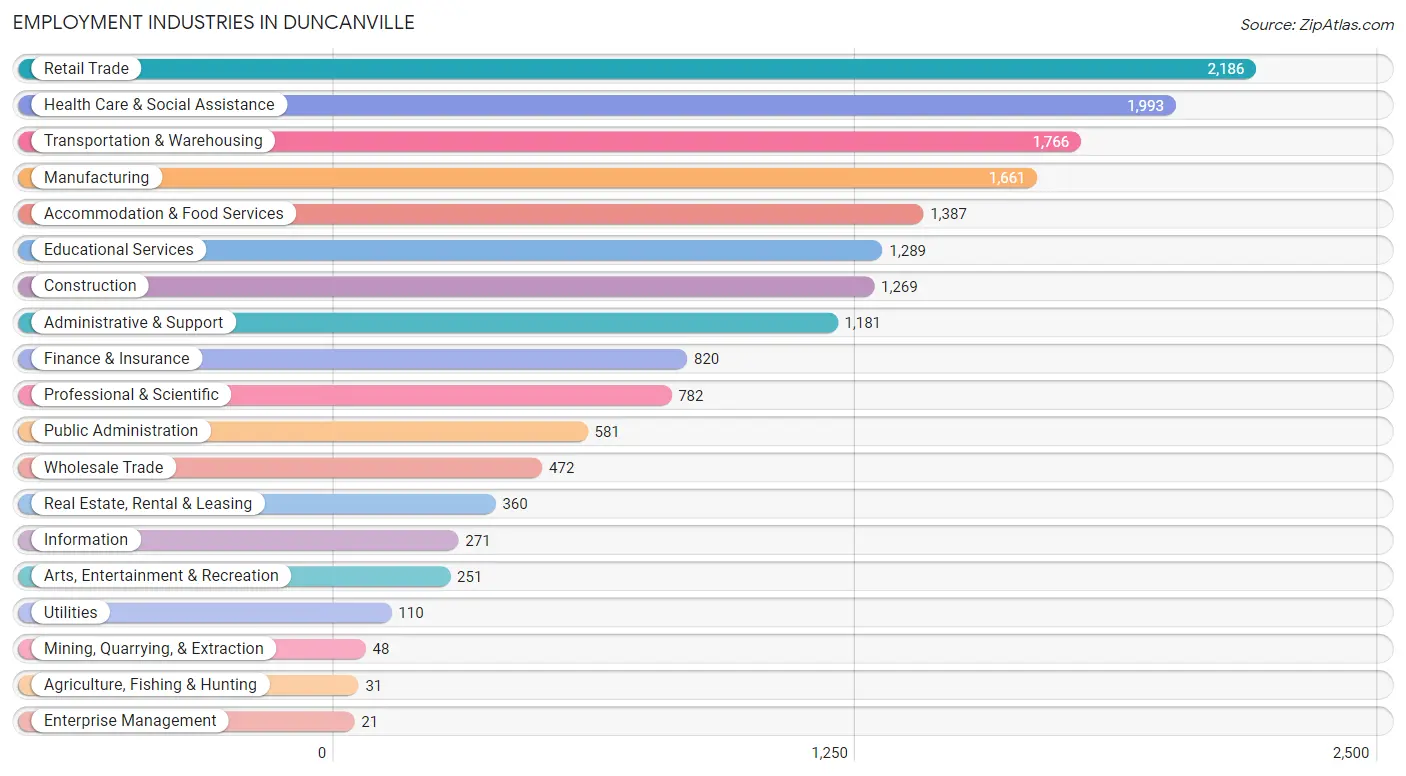
Employment Industries in Duncanville
The major employment industries in Duncanville include Retail Trade (2,186 | 12.2%), Health Care & Social Assistance (1,993 | 11.2%), Transportation & Warehousing (1,766 | 9.9%), Manufacturing (1,661 | 9.3%), and Accommodation & Food Services (1,387 | 7.8%).
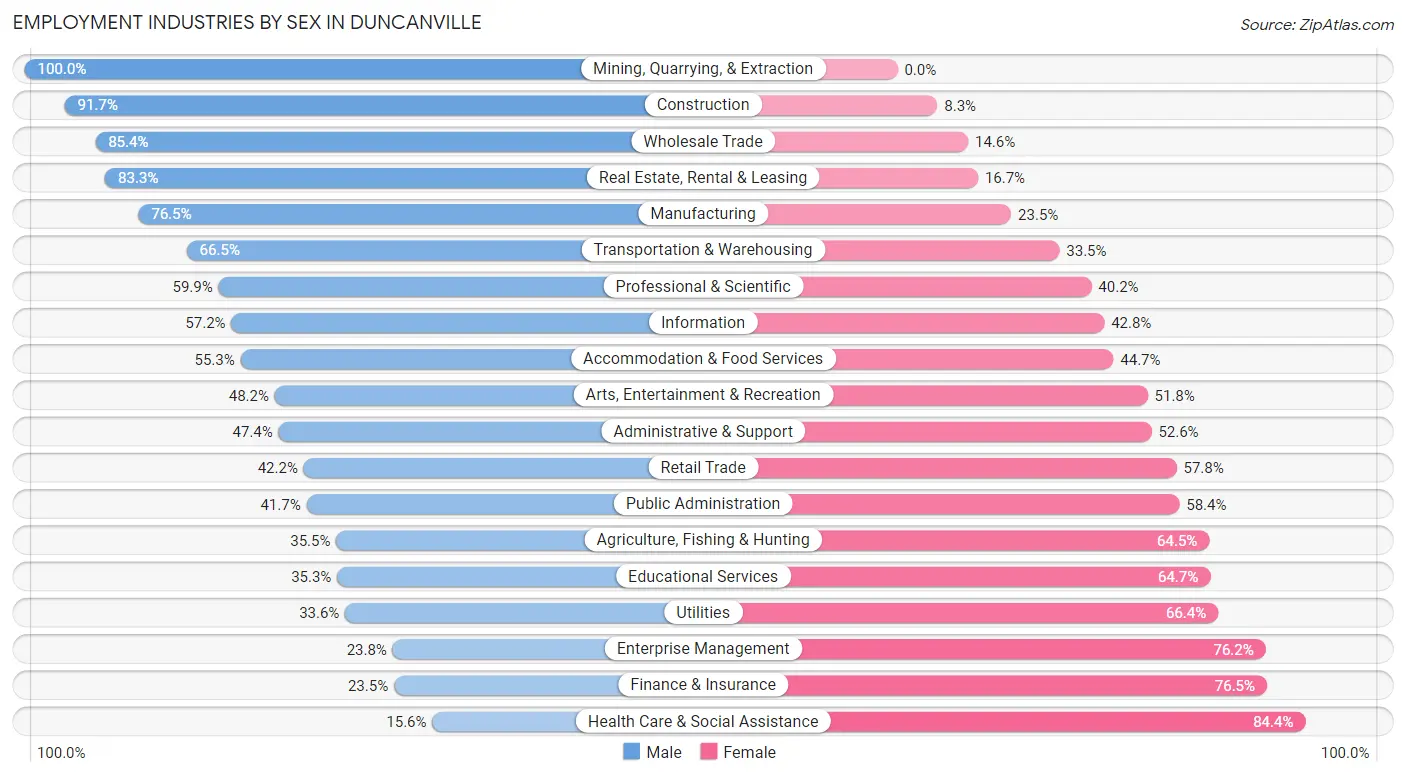
Employment Industries by Sex in Duncanville
The Duncanville industries that see more men than women are Mining, Quarrying, & Extraction (100.0%), Construction (91.7%), and Wholesale Trade (85.4%), whereas the industries that tend to have a higher number of women are Health Care & Social Assistance (84.4%), Finance & Insurance (76.5%), and Enterprise Management (76.2%).
| Industry | Male | Female |
| Agriculture, Fishing & Hunting | 11 (35.5%) | 20 (64.5%) |
| Mining, Quarrying, & Extraction | 48 (100.0%) | 0 (0.0%) |
| Construction | 1,164 (91.7%) | 105 (8.3%) |
| Manufacturing | 1,270 (76.5%) | 391 (23.5%) |
| Wholesale Trade | 403 (85.4%) | 69 (14.6%) |
| Retail Trade | 923 (42.2%) | 1,263 (57.8%) |
| Transportation & Warehousing | 1,174 (66.5%) | 592 (33.5%) |
| Utilities | 37 (33.6%) | 73 (66.4%) |
| Information | 155 (57.2%) | 116 (42.8%) |
| Finance & Insurance | 193 (23.5%) | 627 (76.5%) |
| Real Estate, Rental & Leasing | 300 (83.3%) | 60 (16.7%) |
| Professional & Scientific | 468 (59.9%) | 314 (40.2%) |
| Enterprise Management | 5 (23.8%) | 16 (76.2%) |
| Administrative & Support | 560 (47.4%) | 621 (52.6%) |
| Educational Services | 455 (35.3%) | 834 (64.7%) |
| Health Care & Social Assistance | 311 (15.6%) | 1,682 (84.4%) |
| Arts, Entertainment & Recreation | 121 (48.2%) | 130 (51.8%) |
| Accommodation & Food Services | 767 (55.3%) | 620 (44.7%) |
| Public Administration | 242 (41.6%) | 339 (58.4%) |
| Total | 9,398 (52.6%) | 8,470 (47.4%) |
Education in Duncanville
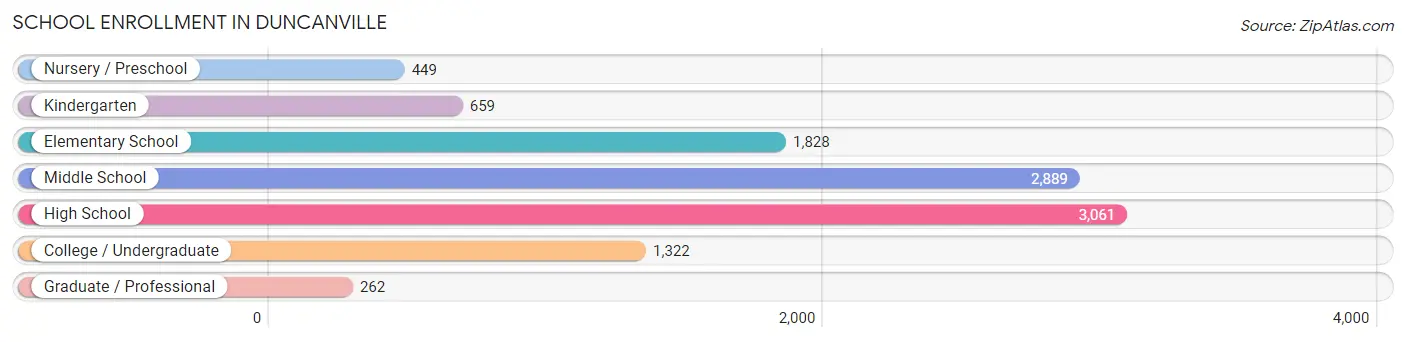
School Enrollment in Duncanville
The most common levels of schooling among the 10,470 students in Duncanville are high school (3,061 | 29.2%), middle school (2,889 | 27.6%), and elementary school (1,828 | 17.5%).
| School Level | # Students | % Students |
| Nursery / Preschool | 449 | 4.3% |
| Kindergarten | 659 | 6.3% |
| Elementary School | 1,828 | 17.5% |
| Middle School | 2,889 | 27.6% |
| High School | 3,061 | 29.2% |
| College / Undergraduate | 1,322 | 12.6% |
| Graduate / Professional | 262 | 2.5% |
| Total | 10,470 | 100.0% |
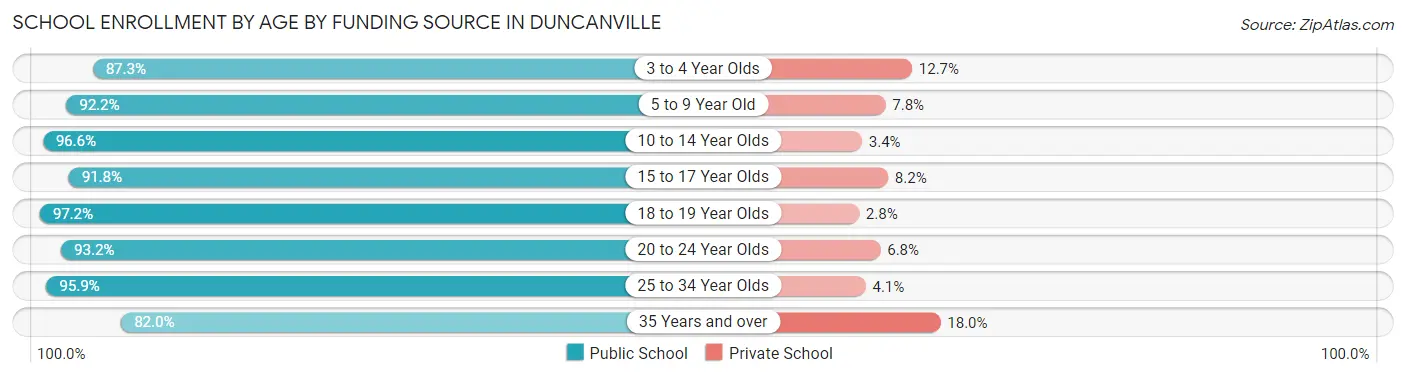
School Enrollment by Age by Funding Source in Duncanville
Out of a total of 10,470 students who are enrolled in schools in Duncanville, 670 (6.4%) attend a private institution, while the remaining 9,800 (93.6%) are enrolled in public schools. The age group of 35 years and over has the highest likelihood of being enrolled in private schools, with 85 (18.0% in the age bracket) enrolled. Conversely, the age group of 18 to 19 year olds has the lowest likelihood of being enrolled in a private school, with 754 (97.2% in the age bracket) attending a public institution.
| Age Bracket | Public School | Private School |
| 3 to 4 Year Olds | 213 (87.3%) | 31 (12.7%) |
| 5 to 9 Year Old | 2,373 (92.2%) | 200 (7.8%) |
| 10 to 14 Year Olds | 3,368 (96.6%) | 118 (3.4%) |
| 15 to 17 Year Olds | 1,681 (91.8%) | 151 (8.2%) |
| 18 to 19 Year Olds | 754 (97.2%) | 22 (2.8%) |
| 20 to 24 Year Olds | 669 (93.2%) | 49 (6.8%) |
| 25 to 34 Year Olds | 354 (95.9%) | 15 (4.1%) |
| 35 Years and over | 387 (82.0%) | 85 (18.0%) |
| Total | 9,800 (93.6%) | 670 (6.4%) |
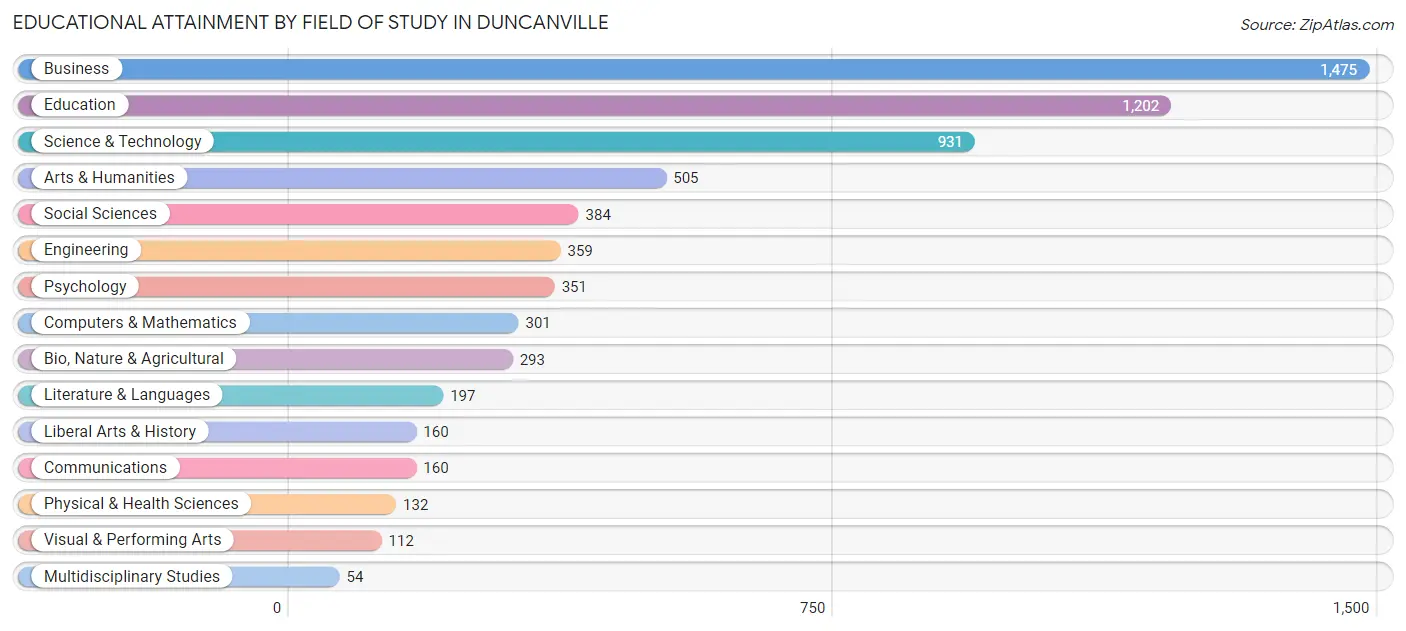
Educational Attainment by Field of Study in Duncanville
Business (1,475 | 22.3%), education (1,202 | 18.2%), science & technology (931 | 14.1%), arts & humanities (505 | 7.6%), and social sciences (384 | 5.8%) are the most common fields of study among 6,616 individuals in Duncanville who have obtained a bachelor's degree or higher.
| Field of Study | # Graduates | % Graduates |
| Computers & Mathematics | 301 | 4.5% |
| Bio, Nature & Agricultural | 293 | 4.4% |
| Physical & Health Sciences | 132 | 2.0% |
| Psychology | 351 | 5.3% |
| Social Sciences | 384 | 5.8% |
| Engineering | 359 | 5.4% |
| Multidisciplinary Studies | 54 | 0.8% |
| Science & Technology | 931 | 14.1% |
| Business | 1,475 | 22.3% |
| Education | 1,202 | 18.2% |
| Literature & Languages | 197 | 3.0% |
| Liberal Arts & History | 160 | 2.4% |
| Visual & Performing Arts | 112 | 1.7% |
| Communications | 160 | 2.4% |
| Arts & Humanities | 505 | 7.6% |
| Total | 6,616 | 100.0% |
Transportation & Commute in Duncanville
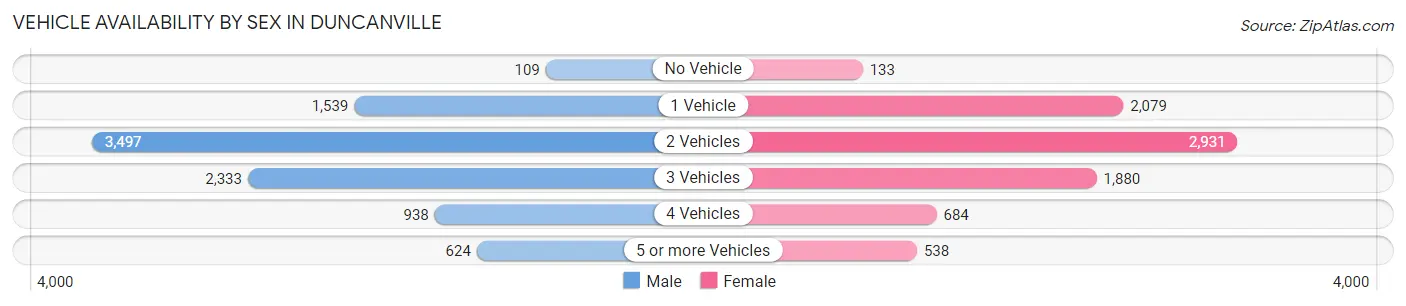
Vehicle Availability by Sex in Duncanville
The most prevalent vehicle ownership categories in Duncanville are males with 2 vehicles (3,497, accounting for 38.7%) and females with 2 vehicles (2,931, making up 42.4%).
| Vehicles Available | Male | Female |
| No Vehicle | 109 (1.2%) | 133 (1.6%) |
| 1 Vehicle | 1,539 (17.0%) | 2,079 (25.2%) |
| 2 Vehicles | 3,497 (38.7%) | 2,931 (35.5%) |
| 3 Vehicles | 2,333 (25.8%) | 1,880 (22.8%) |
| 4 Vehicles | 938 (10.4%) | 684 (8.3%) |
| 5 or more Vehicles | 624 (6.9%) | 538 (6.5%) |
| Total | 9,040 (100.0%) | 8,245 (100.0%) |
Commute Time in Duncanville
The most frequently occuring commute durations in Duncanville are 30 to 34 minutes (3,064 commuters, 19.8%), 15 to 19 minutes (2,786 commuters, 18.0%), and 20 to 24 minutes (2,224 commuters, 14.3%).
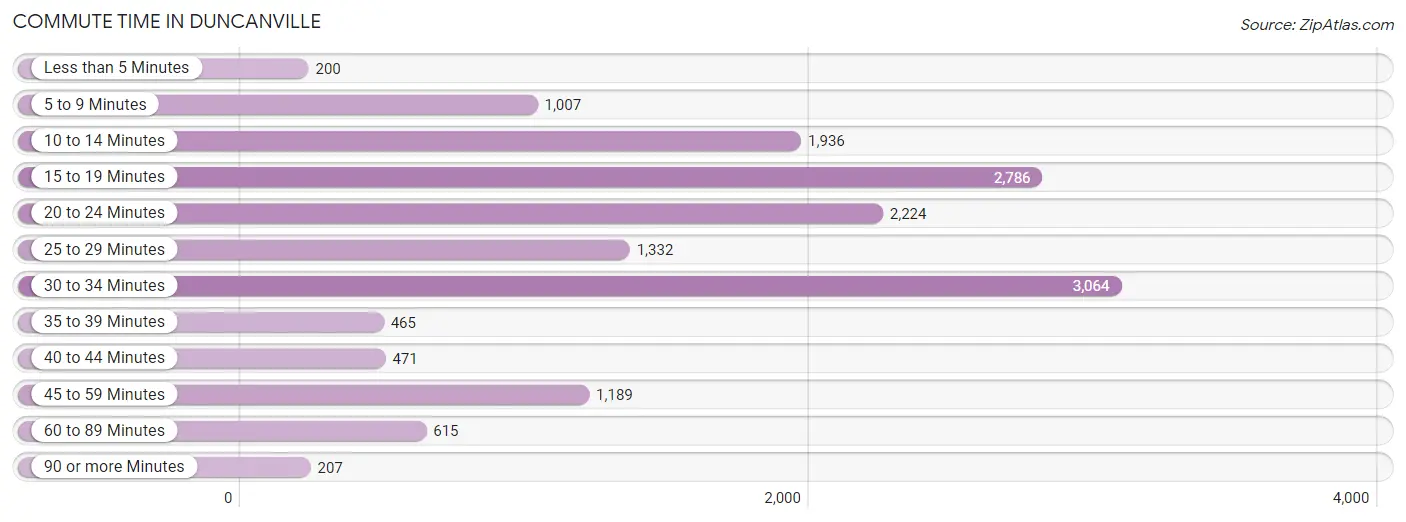
| Commute Time | # Commuters | % Commuters |
| Less than 5 Minutes | 200 | 1.3% |
| 5 to 9 Minutes | 1,007 | 6.5% |
| 10 to 14 Minutes | 1,936 | 12.5% |
| 15 to 19 Minutes | 2,786 | 18.0% |
| 20 to 24 Minutes | 2,224 | 14.3% |
| 25 to 29 Minutes | 1,332 | 8.6% |
| 30 to 34 Minutes | 3,064 | 19.8% |
| 35 to 39 Minutes | 465 | 3.0% |
| 40 to 44 Minutes | 471 | 3.0% |
| 45 to 59 Minutes | 1,189 | 7.7% |
| 60 to 89 Minutes | 615 | 4.0% |
| 90 or more Minutes | 207 | 1.3% |
Commute Time by Sex in Duncanville
The most common commute times in Duncanville are 30 to 34 minutes (1,746 commuters, 21.3%) for males and 30 to 34 minutes (1,318 commuters, 18.1%) for females.
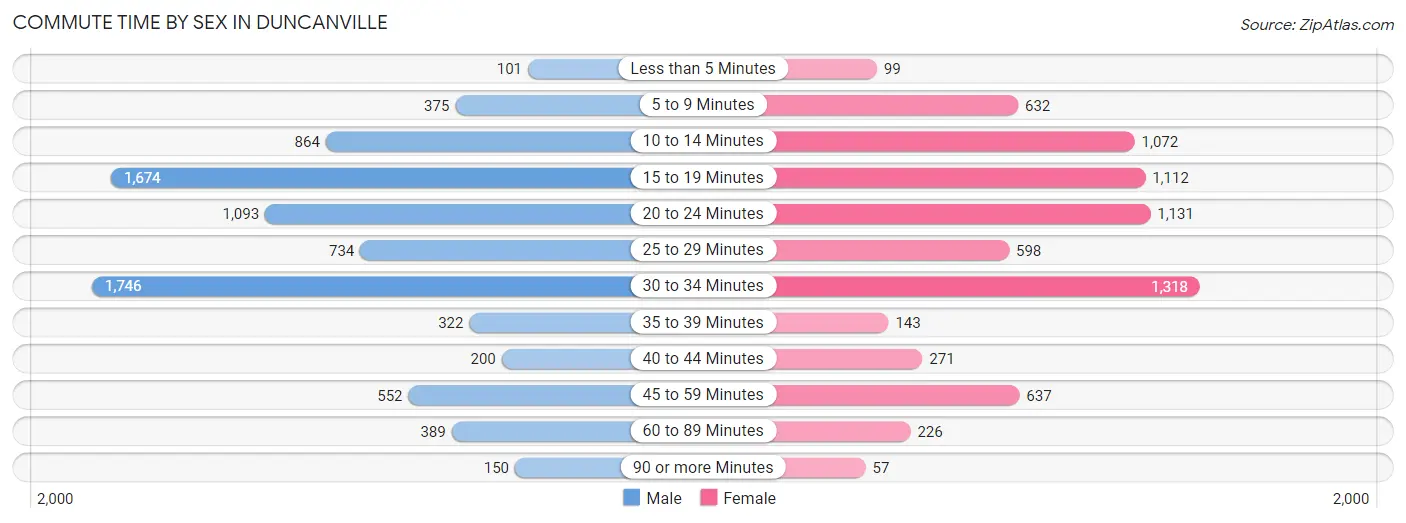
| Commute Time | Male | Female |
| Less than 5 Minutes | 101 (1.2%) | 99 (1.4%) |
| 5 to 9 Minutes | 375 (4.6%) | 632 (8.7%) |
| 10 to 14 Minutes | 864 (10.5%) | 1,072 (14.7%) |
| 15 to 19 Minutes | 1,674 (20.4%) | 1,112 (15.2%) |
| 20 to 24 Minutes | 1,093 (13.3%) | 1,131 (15.5%) |
| 25 to 29 Minutes | 734 (8.9%) | 598 (8.2%) |
| 30 to 34 Minutes | 1,746 (21.3%) | 1,318 (18.1%) |
| 35 to 39 Minutes | 322 (3.9%) | 143 (2.0%) |
| 40 to 44 Minutes | 200 (2.4%) | 271 (3.7%) |
| 45 to 59 Minutes | 552 (6.7%) | 637 (8.7%) |
| 60 to 89 Minutes | 389 (4.7%) | 226 (3.1%) |
| 90 or more Minutes | 150 (1.8%) | 57 (0.8%) |
Time of Departure to Work by Sex in Duncanville
The most frequent times of departure to work in Duncanville are 7:00 AM to 7:29 AM (1,298, 15.8%) for males and 7:00 AM to 7:29 AM (1,079, 14.8%) for females.
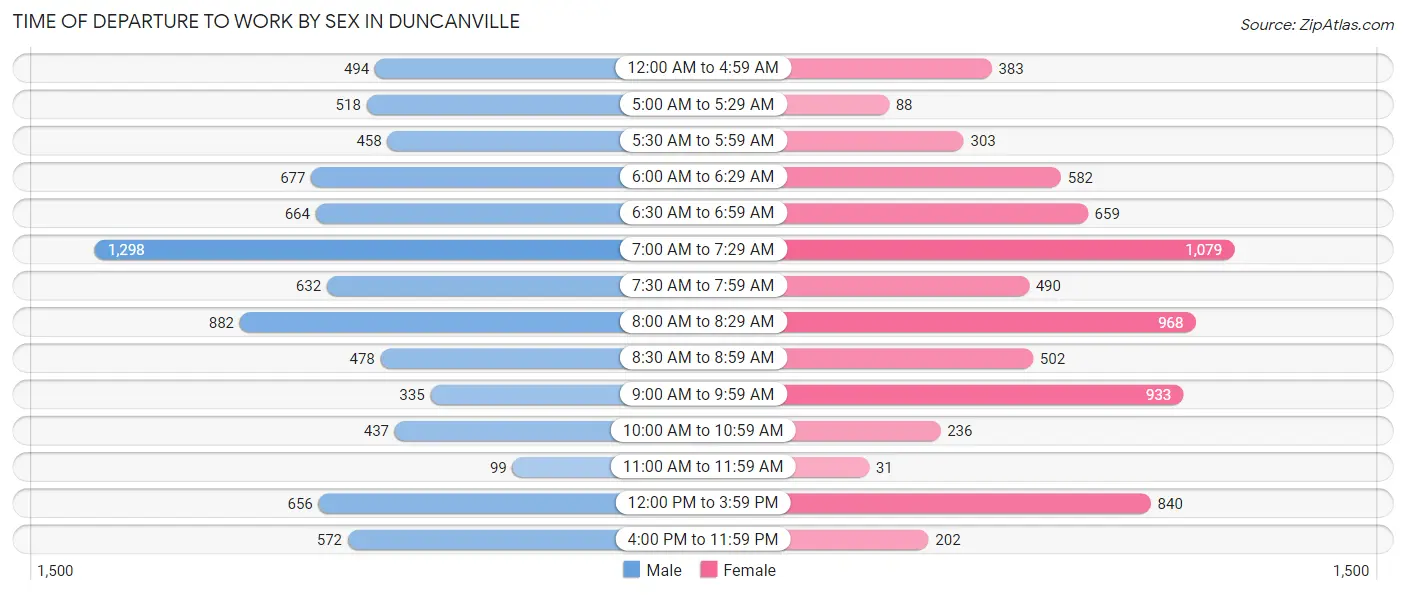
| Time of Departure | Male | Female |
| 12:00 AM to 4:59 AM | 494 (6.0%) | 383 (5.2%) |
| 5:00 AM to 5:29 AM | 518 (6.3%) | 88 (1.2%) |
| 5:30 AM to 5:59 AM | 458 (5.6%) | 303 (4.2%) |
| 6:00 AM to 6:29 AM | 677 (8.3%) | 582 (8.0%) |
| 6:30 AM to 6:59 AM | 664 (8.1%) | 659 (9.0%) |
| 7:00 AM to 7:29 AM | 1,298 (15.8%) | 1,079 (14.8%) |
| 7:30 AM to 7:59 AM | 632 (7.7%) | 490 (6.7%) |
| 8:00 AM to 8:29 AM | 882 (10.8%) | 968 (13.3%) |
| 8:30 AM to 8:59 AM | 478 (5.8%) | 502 (6.9%) |
| 9:00 AM to 9:59 AM | 335 (4.1%) | 933 (12.8%) |
| 10:00 AM to 10:59 AM | 437 (5.3%) | 236 (3.2%) |
| 11:00 AM to 11:59 AM | 99 (1.2%) | 31 (0.4%) |
| 12:00 PM to 3:59 PM | 656 (8.0%) | 840 (11.5%) |
| 4:00 PM to 11:59 PM | 572 (7.0%) | 202 (2.8%) |
| Total | 8,200 (100.0%) | 7,296 (100.0%) |
Housing Occupancy in Duncanville
Occupancy by Ownership in Duncanville
Of the total 13,700 dwellings in Duncanville, owner-occupied units account for 8,836 (64.5%), while renter-occupied units make up 4,864 (35.5%).
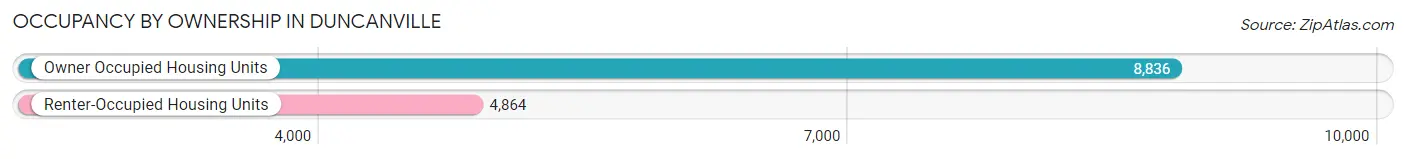
| Occupancy | # Housing Units | % Housing Units |
| Owner Occupied Housing Units | 8,836 | 64.5% |
| Renter-Occupied Housing Units | 4,864 | 35.5% |
| Total Occupied Housing Units | 13,700 | 100.0% |
Occupancy by Household Size in Duncanville
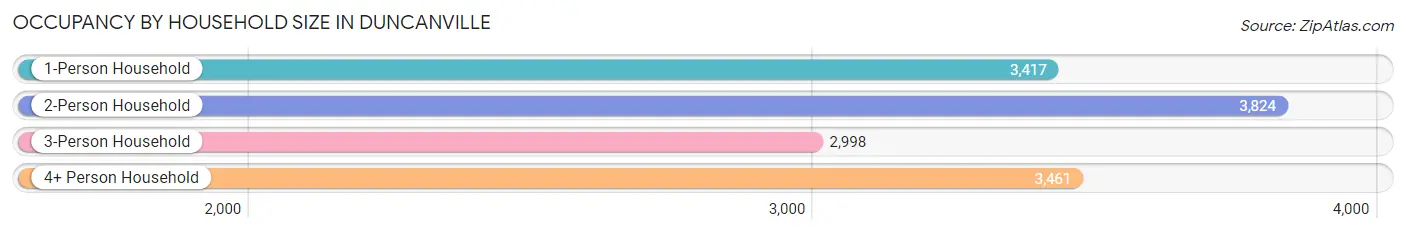
| Household Size | # Housing Units | % Housing Units |
| 1-Person Household | 3,417 | 24.9% |
| 2-Person Household | 3,824 | 27.9% |
| 3-Person Household | 2,998 | 21.9% |
| 4+ Person Household | 3,461 | 25.3% |
| Total Housing Units | 13,700 | 100.0% |
Occupancy by Ownership by Household Size in Duncanville
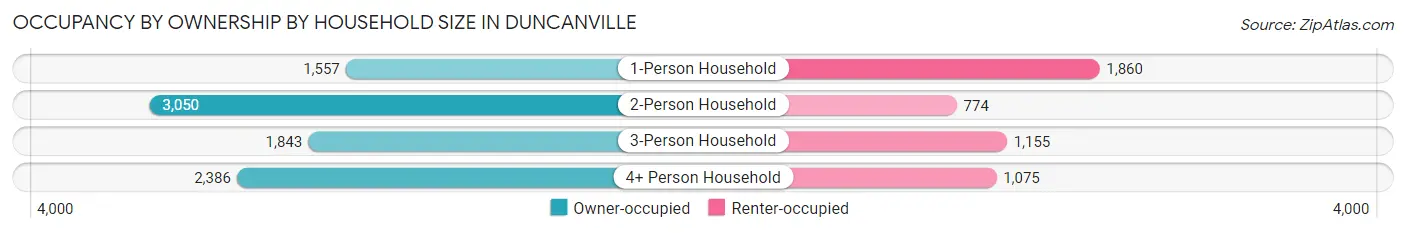
| Household Size | Owner-occupied | Renter-occupied |
| 1-Person Household | 1,557 (45.6%) | 1,860 (54.4%) |
| 2-Person Household | 3,050 (79.8%) | 774 (20.2%) |
| 3-Person Household | 1,843 (61.5%) | 1,155 (38.5%) |
| 4+ Person Household | 2,386 (68.9%) | 1,075 (31.1%) |
| Total Housing Units | 8,836 (64.5%) | 4,864 (35.5%) |
Occupancy by Educational Attainment in Duncanville
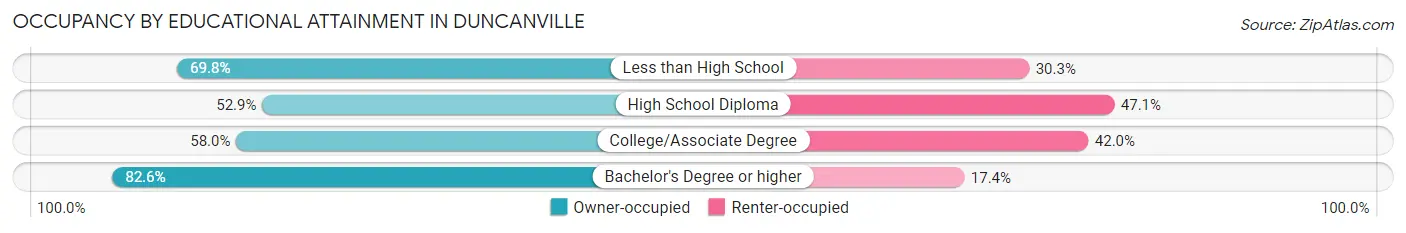
| Household Size | Owner-occupied | Renter-occupied |
| Less than High School | 1,462 (69.8%) | 634 (30.2%) |
| High School Diploma | 1,909 (52.9%) | 1,702 (47.1%) |
| College/Associate Degree | 2,686 (58.0%) | 1,943 (42.0%) |
| Bachelor's Degree or higher | 2,779 (82.6%) | 585 (17.4%) |
Occupancy by Age of Householder in Duncanville
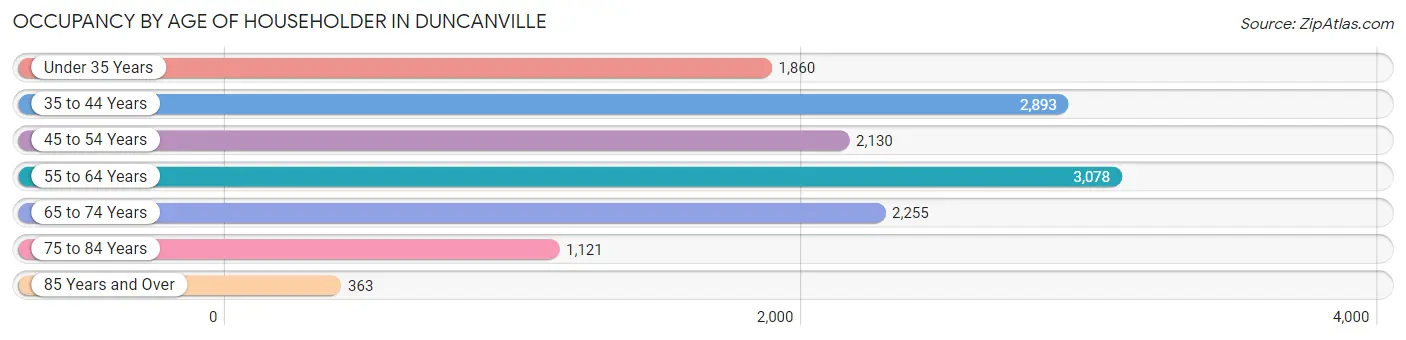
| Age Bracket | # Households | % Households |
| Under 35 Years | 1,860 | 13.6% |
| 35 to 44 Years | 2,893 | 21.1% |
| 45 to 54 Years | 2,130 | 15.5% |
| 55 to 64 Years | 3,078 | 22.5% |
| 65 to 74 Years | 2,255 | 16.5% |
| 75 to 84 Years | 1,121 | 8.2% |
| 85 Years and Over | 363 | 2.6% |
| Total | 13,700 | 100.0% |
Housing Finances in Duncanville
Median Income by Occupancy in Duncanville
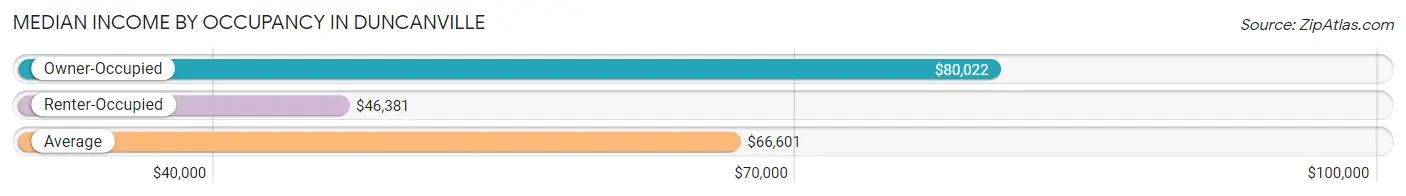
| Occupancy Type | # Households | Median Income |
| Owner-Occupied | 8,836 (64.5%) | $80,022 |
| Renter-Occupied | 4,864 (35.5%) | $46,381 |
| Average | 13,700 (100.0%) | $66,601 |
Occupancy by Householder Income Bracket in Duncanville
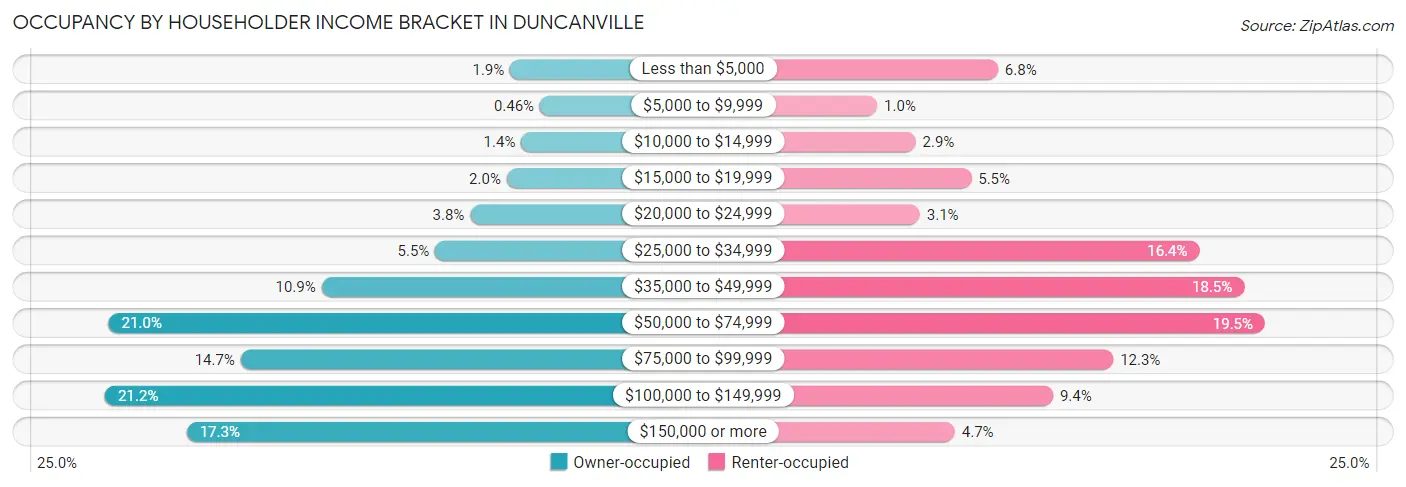
| Income Bracket | Owner-occupied | Renter-occupied |
| Less than $5,000 | 166 (1.9%) | 330 (6.8%) |
| $5,000 to $9,999 | 41 (0.5%) | 50 (1.0%) |
| $10,000 to $14,999 | 119 (1.3%) | 139 (2.9%) |
| $15,000 to $19,999 | 180 (2.0%) | 268 (5.5%) |
| $20,000 to $24,999 | 334 (3.8%) | 149 (3.1%) |
| $25,000 to $34,999 | 482 (5.4%) | 796 (16.4%) |
| $35,000 to $49,999 | 960 (10.9%) | 900 (18.5%) |
| $50,000 to $74,999 | 1,856 (21.0%) | 948 (19.5%) |
| $75,000 to $99,999 | 1,300 (14.7%) | 597 (12.3%) |
| $100,000 to $149,999 | 1,871 (21.2%) | 457 (9.4%) |
| $150,000 or more | 1,527 (17.3%) | 230 (4.7%) |
| Total | 8,836 (100.0%) | 4,864 (100.0%) |
Monthly Housing Cost Tiers in Duncanville
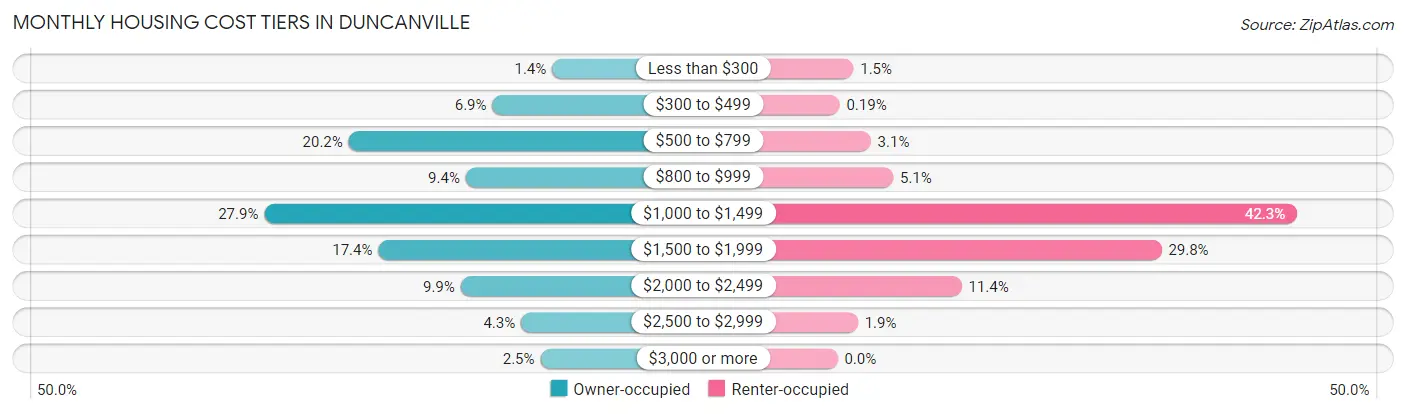
| Monthly Cost | Owner-occupied | Renter-occupied |
| Less than $300 | 127 (1.4%) | 71 (1.5%) |
| $300 to $499 | 613 (6.9%) | 9 (0.2%) |
| $500 to $799 | 1,782 (20.2%) | 149 (3.1%) |
| $800 to $999 | 830 (9.4%) | 249 (5.1%) |
| $1,000 to $1,499 | 2,469 (27.9%) | 2,058 (42.3%) |
| $1,500 to $1,999 | 1,541 (17.4%) | 1,451 (29.8%) |
| $2,000 to $2,499 | 871 (9.9%) | 556 (11.4%) |
| $2,500 to $2,999 | 380 (4.3%) | 91 (1.9%) |
| $3,000 or more | 223 (2.5%) | 0 (0.0%) |
| Total | 8,836 (100.0%) | 4,864 (100.0%) |
Physical Housing Characteristics in Duncanville
Housing Structures in Duncanville
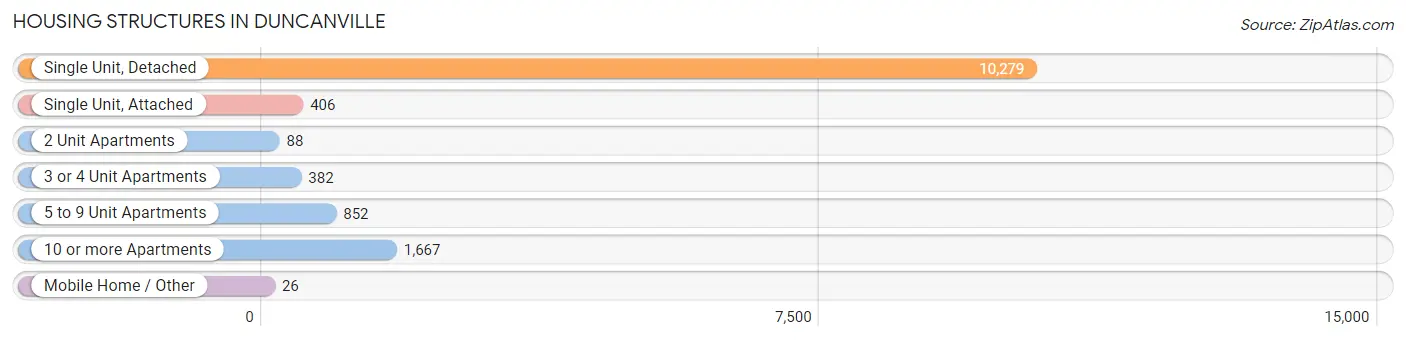
| Structure Type | # Housing Units | % Housing Units |
| Single Unit, Detached | 10,279 | 75.0% |
| Single Unit, Attached | 406 | 3.0% |
| 2 Unit Apartments | 88 | 0.6% |
| 3 or 4 Unit Apartments | 382 | 2.8% |
| 5 to 9 Unit Apartments | 852 | 6.2% |
| 10 or more Apartments | 1,667 | 12.2% |
| Mobile Home / Other | 26 | 0.2% |
| Total | 13,700 | 100.0% |
Housing Structures by Occupancy in Duncanville
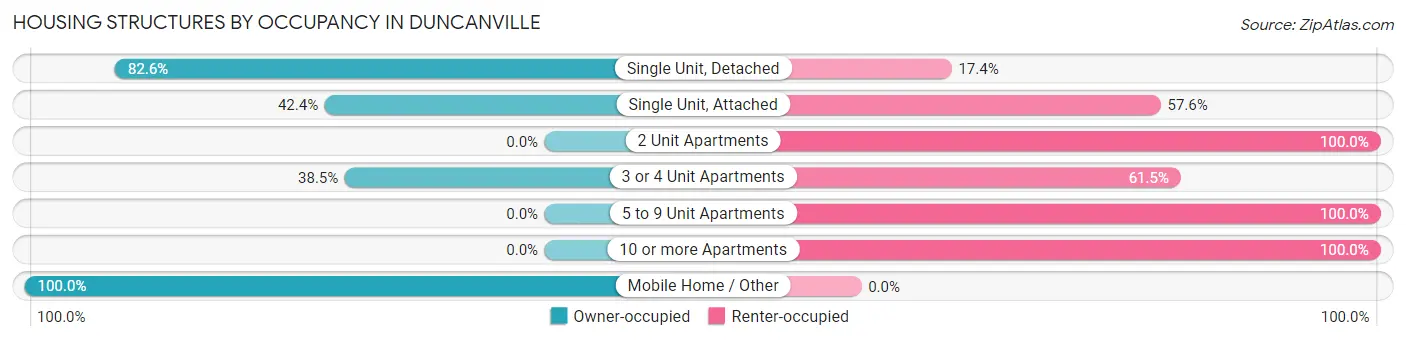
| Structure Type | Owner-occupied | Renter-occupied |
| Single Unit, Detached | 8,491 (82.6%) | 1,788 (17.4%) |
| Single Unit, Attached | 172 (42.4%) | 234 (57.6%) |
| 2 Unit Apartments | 0 (0.0%) | 88 (100.0%) |
| 3 or 4 Unit Apartments | 147 (38.5%) | 235 (61.5%) |
| 5 to 9 Unit Apartments | 0 (0.0%) | 852 (100.0%) |
| 10 or more Apartments | 0 (0.0%) | 1,667 (100.0%) |
| Mobile Home / Other | 26 (100.0%) | 0 (0.0%) |
| Total | 8,836 (64.5%) | 4,864 (35.5%) |
Housing Structures by Number of Rooms in Duncanville
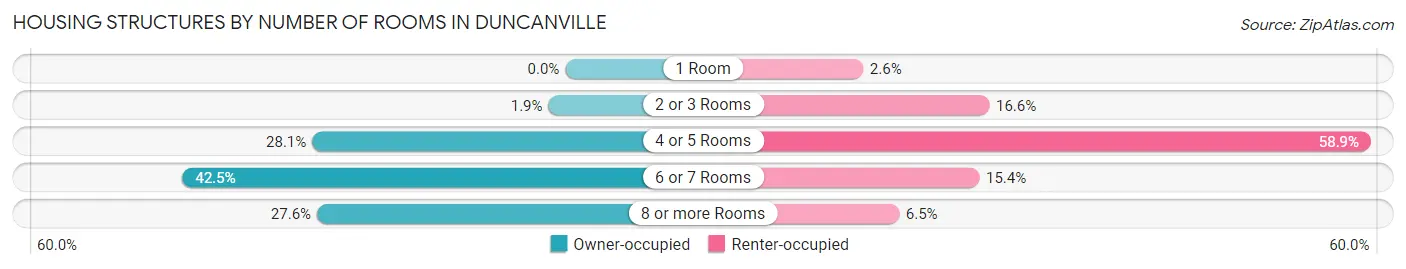
| Number of Rooms | Owner-occupied | Renter-occupied |
| 1 Room | 0 (0.0%) | 124 (2.5%) |
| 2 or 3 Rooms | 165 (1.9%) | 805 (16.6%) |
| 4 or 5 Rooms | 2,482 (28.1%) | 2,866 (58.9%) |
| 6 or 7 Rooms | 3,754 (42.5%) | 751 (15.4%) |
| 8 or more Rooms | 2,435 (27.6%) | 318 (6.5%) |
| Total | 8,836 (100.0%) | 4,864 (100.0%) |
Housing Structure by Heating Type in Duncanville
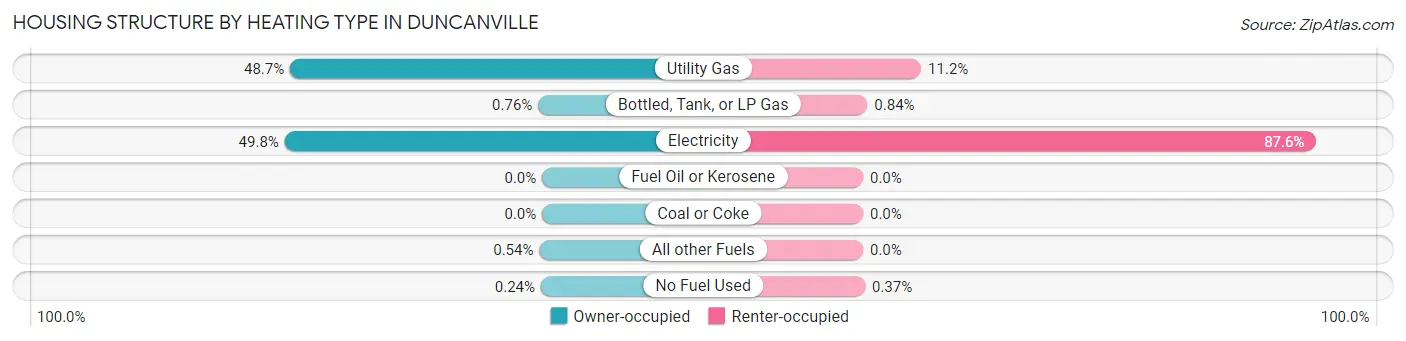
| Heating Type | Owner-occupied | Renter-occupied |
| Utility Gas | 4,304 (48.7%) | 546 (11.2%) |
| Bottled, Tank, or LP Gas | 67 (0.8%) | 41 (0.8%) |
| Electricity | 4,396 (49.7%) | 4,259 (87.6%) |
| Fuel Oil or Kerosene | 0 (0.0%) | 0 (0.0%) |
| Coal or Coke | 0 (0.0%) | 0 (0.0%) |
| All other Fuels | 48 (0.5%) | 0 (0.0%) |
| No Fuel Used | 21 (0.2%) | 18 (0.4%) |
| Total | 8,836 (100.0%) | 4,864 (100.0%) |
Household Vehicle Usage in Duncanville
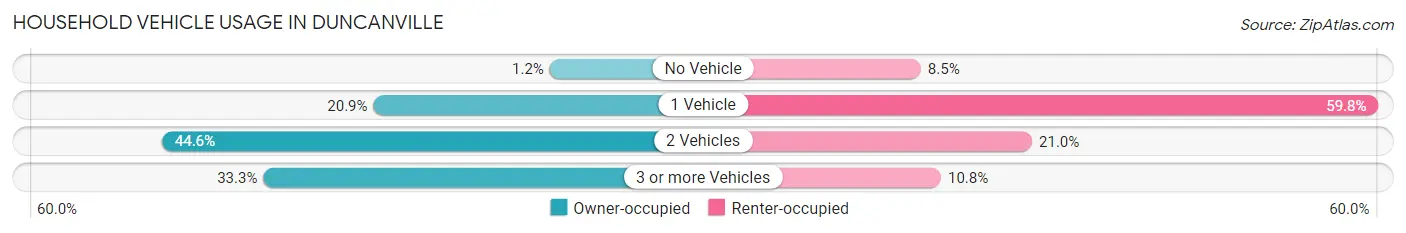
| Vehicles per Household | Owner-occupied | Renter-occupied |
| No Vehicle | 104 (1.2%) | 414 (8.5%) |
| 1 Vehicle | 1,849 (20.9%) | 2,906 (59.8%) |
| 2 Vehicles | 3,943 (44.6%) | 1,020 (21.0%) |
| 3 or more Vehicles | 2,940 (33.3%) | 524 (10.8%) |
| Total | 8,836 (100.0%) | 4,864 (100.0%) |
Real Estate & Mortgages in Duncanville
Real Estate and Mortgage Overview in Duncanville
| Characteristic | Without Mortgage | With Mortgage |
| Housing Units | 3,901 | 4,935 |
| Median Property Value | $215,800 | $214,500 |
| Median Household Income | $68,724 | $948 |
| Monthly Housing Costs | $731 | $223 |
| Real Estate Taxes | $3,152 | $227 |
Property Value by Mortgage Status in Duncanville
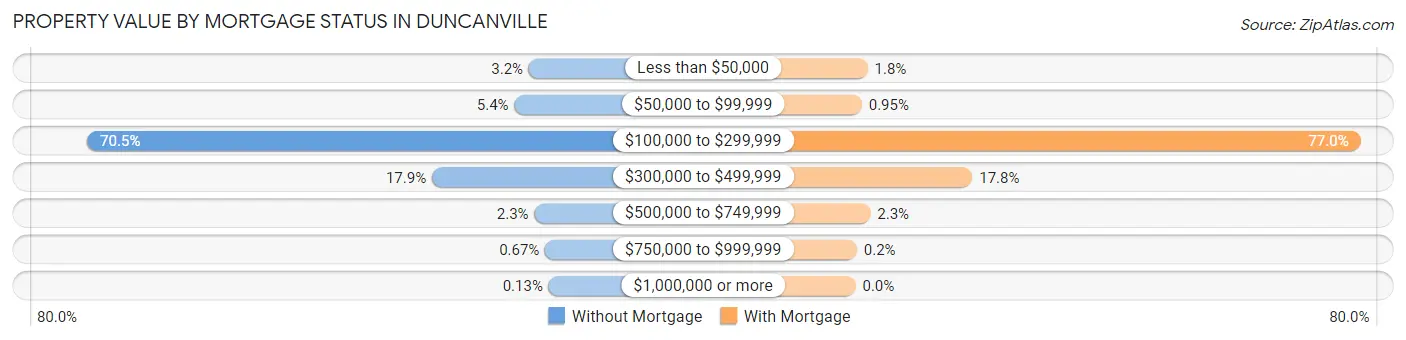
| Property Value | Without Mortgage | With Mortgage |
| Less than $50,000 | 123 (3.2%) | 91 (1.8%) |
| $50,000 to $99,999 | 209 (5.4%) | 47 (0.9%) |
| $100,000 to $299,999 | 2,749 (70.5%) | 3,798 (77.0%) |
| $300,000 to $499,999 | 699 (17.9%) | 878 (17.8%) |
| $500,000 to $749,999 | 90 (2.3%) | 111 (2.2%) |
| $750,000 to $999,999 | 26 (0.7%) | 10 (0.2%) |
| $1,000,000 or more | 5 (0.1%) | 0 (0.0%) |
| Total | 3,901 (100.0%) | 4,935 (100.0%) |
Household Income by Mortgage Status in Duncanville
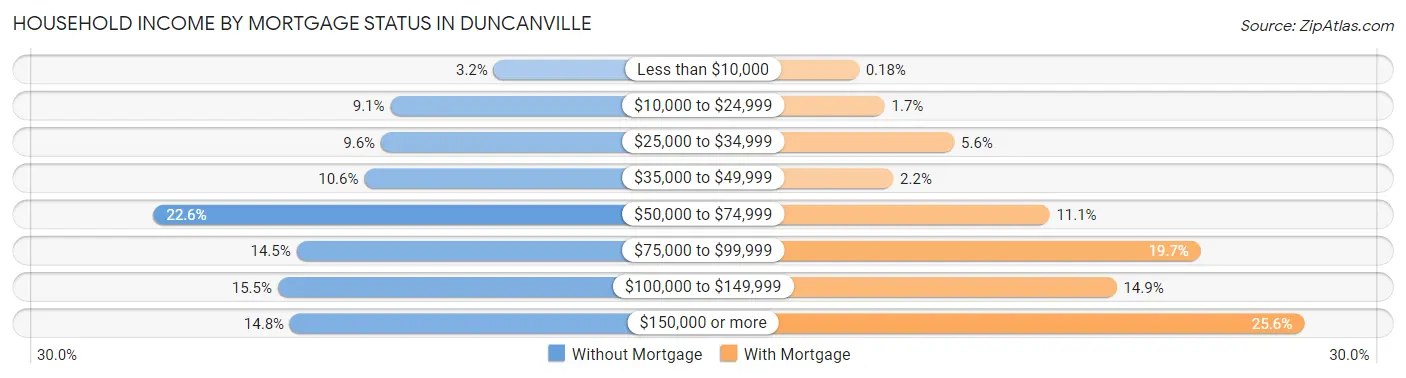
| Household Income | Without Mortgage | With Mortgage |
| Less than $10,000 | 125 (3.2%) | 9 (0.2%) |
| $10,000 to $24,999 | 355 (9.1%) | 82 (1.7%) |
| $25,000 to $34,999 | 376 (9.6%) | 278 (5.6%) |
| $35,000 to $49,999 | 413 (10.6%) | 106 (2.1%) |
| $50,000 to $74,999 | 883 (22.6%) | 547 (11.1%) |
| $75,000 to $99,999 | 564 (14.5%) | 973 (19.7%) |
| $100,000 to $149,999 | 606 (15.5%) | 736 (14.9%) |
| $150,000 or more | 579 (14.8%) | 1,265 (25.6%) |
| Total | 3,901 (100.0%) | 4,935 (100.0%) |
Property Value to Household Income Ratio in Duncanville
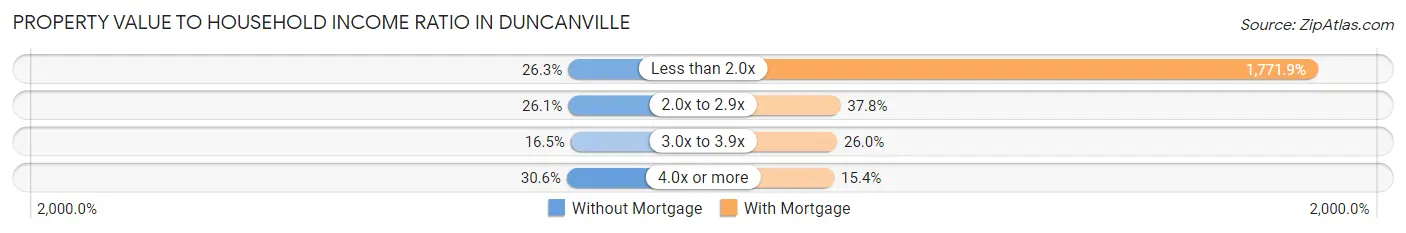
| Value-to-Income Ratio | Without Mortgage | With Mortgage |
| Less than 2.0x | 1,027 (26.3%) | 87,441 (1,771.8%) |
| 2.0x to 2.9x | 1,018 (26.1%) | 1,864 (37.8%) |
| 3.0x to 3.9x | 643 (16.5%) | 1,282 (26.0%) |
| 4.0x or more | 1,195 (30.6%) | 760 (15.4%) |
| Total | 3,901 (100.0%) | 4,935 (100.0%) |
Real Estate Taxes by Mortgage Status in Duncanville
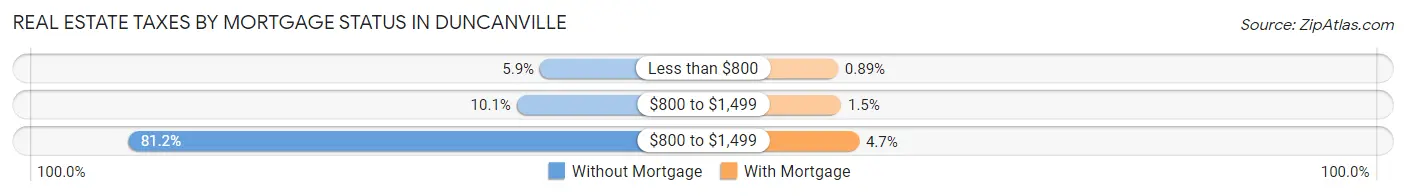
| Property Taxes | Without Mortgage | With Mortgage |
| Less than $800 | 229 (5.9%) | 44 (0.9%) |
| $800 to $1,499 | 395 (10.1%) | 72 (1.5%) |
| $800 to $1,499 | 3,166 (81.2%) | 234 (4.7%) |
| Total | 3,901 (100.0%) | 4,935 (100.0%) |
Health & Disability in Duncanville
Health Insurance Coverage by Age in Duncanville
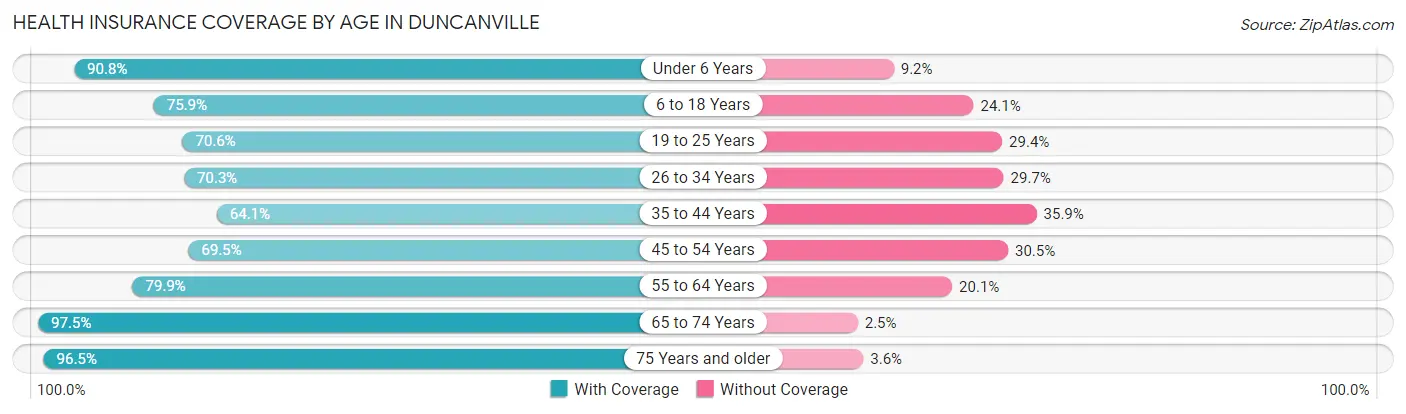
| Age Bracket | With Coverage | Without Coverage |
| Under 6 Years | 2,752 (90.8%) | 280 (9.2%) |
| 6 to 18 Years | 6,308 (75.9%) | 2,003 (24.1%) |
| 19 to 25 Years | 2,452 (70.6%) | 1,023 (29.4%) |
| 26 to 34 Years | 2,769 (70.3%) | 1,171 (29.7%) |
| 35 to 44 Years | 3,477 (64.1%) | 1,944 (35.9%) |
| 45 to 54 Years | 2,988 (69.5%) | 1,314 (30.5%) |
| 55 to 64 Years | 4,220 (79.9%) | 1,062 (20.1%) |
| 65 to 74 Years | 3,957 (97.5%) | 102 (2.5%) |
| 75 Years and older | 2,200 (96.5%) | 81 (3.5%) |
| Total | 31,123 (77.6%) | 8,980 (22.4%) |
Health Insurance Coverage by Citizenship Status in Duncanville
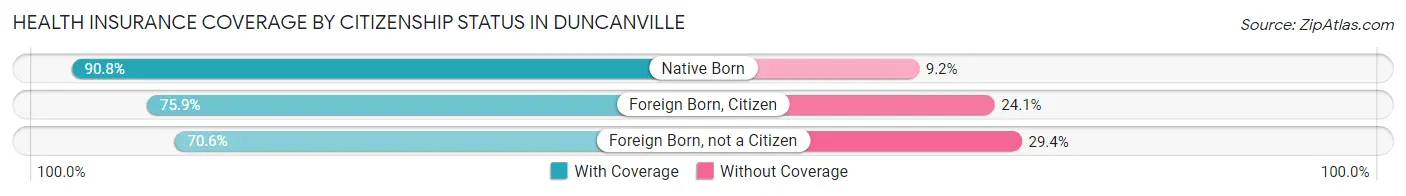
| Citizenship Status | With Coverage | Without Coverage |
| Native Born | 2,752 (90.8%) | 280 (9.2%) |
| Foreign Born, Citizen | 6,308 (75.9%) | 2,003 (24.1%) |
| Foreign Born, not a Citizen | 2,452 (70.6%) | 1,023 (29.4%) |
Health Insurance Coverage by Household Income in Duncanville
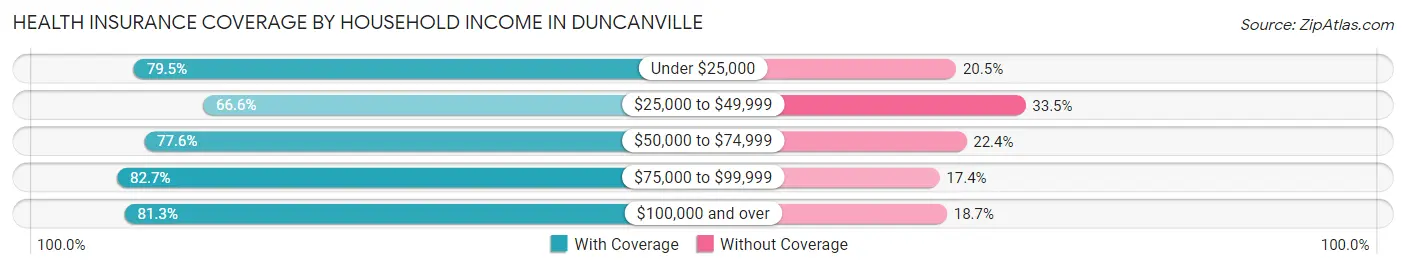
| Household Income | With Coverage | Without Coverage |
| Under $25,000 | 2,628 (79.5%) | 676 (20.5%) |
| $25,000 to $49,999 | 5,516 (66.5%) | 2,773 (33.5%) |
| $50,000 to $74,999 | 5,859 (77.6%) | 1,689 (22.4%) |
| $75,000 to $99,999 | 4,744 (82.7%) | 996 (17.3%) |
| $100,000 and over | 12,317 (81.3%) | 2,838 (18.7%) |
Public vs Private Health Insurance Coverage by Age in Duncanville
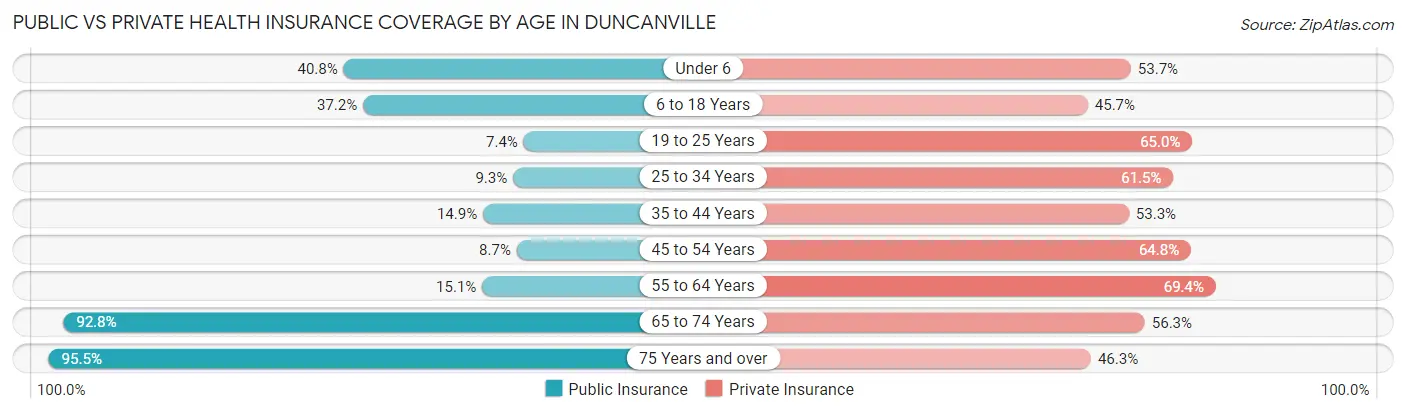
| Age Bracket | Public Insurance | Private Insurance |
| Under 6 | 1,237 (40.8%) | 1,627 (53.7%) |
| 6 to 18 Years | 3,090 (37.2%) | 3,796 (45.7%) |
| 19 to 25 Years | 256 (7.4%) | 2,260 (65.0%) |
| 25 to 34 Years | 368 (9.3%) | 2,424 (61.5%) |
| 35 to 44 Years | 809 (14.9%) | 2,889 (53.3%) |
| 45 to 54 Years | 372 (8.6%) | 2,788 (64.8%) |
| 55 to 64 Years | 796 (15.1%) | 3,667 (69.4%) |
| 65 to 74 Years | 3,767 (92.8%) | 2,283 (56.2%) |
| 75 Years and over | 2,179 (95.5%) | 1,055 (46.3%) |
| Total | 12,874 (32.1%) | 22,789 (56.8%) |
Disability Status by Sex by Age in Duncanville
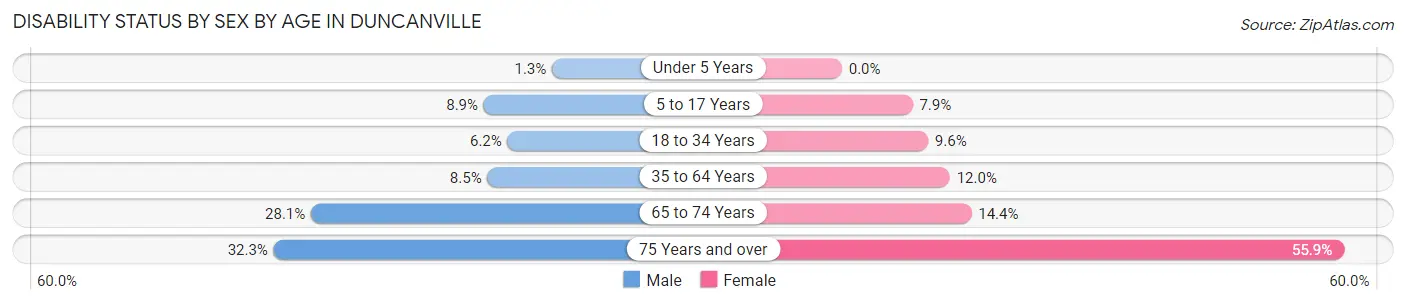
| Age Bracket | Male | Female |
| Under 5 Years | 13 (1.3%) | 0 (0.0%) |
| 5 to 17 Years | 349 (8.8%) | 331 (7.9%) |
| 18 to 34 Years | 256 (6.2%) | 393 (9.6%) |
| 35 to 64 Years | 626 (8.5%) | 914 (12.0%) |
| 65 to 74 Years | 513 (28.1%) | 322 (14.4%) |
| 75 Years and over | 260 (32.3%) | 825 (55.9%) |
Disability Class by Sex by Age in Duncanville
Disability Class: Hearing Difficulty
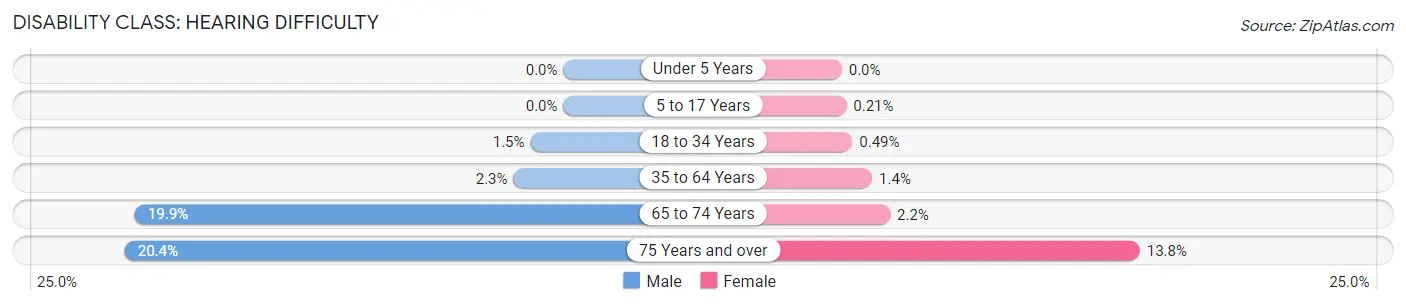
| Age Bracket | Male | Female |
| Under 5 Years | 0 (0.0%) | 0 (0.0%) |
| 5 to 17 Years | 0 (0.0%) | 9 (0.2%) |
| 18 to 34 Years | 63 (1.5%) | 20 (0.5%) |
| 35 to 64 Years | 172 (2.3%) | 107 (1.4%) |
| 65 to 74 Years | 363 (19.9%) | 50 (2.2%) |
| 75 Years and over | 164 (20.3%) | 204 (13.8%) |
Disability Class: Vision Difficulty
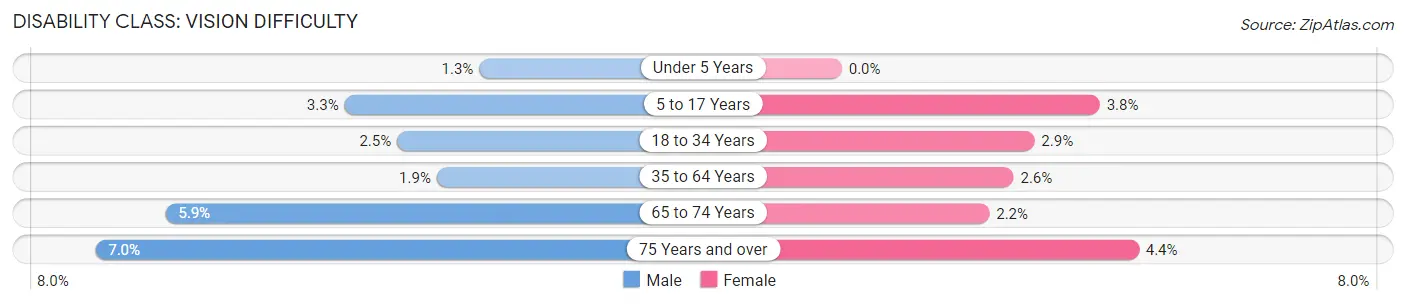
| Age Bracket | Male | Female |
| Under 5 Years | 13 (1.3%) | 0 (0.0%) |
| 5 to 17 Years | 128 (3.3%) | 161 (3.8%) |
| 18 to 34 Years | 102 (2.5%) | 117 (2.9%) |
| 35 to 64 Years | 139 (1.9%) | 194 (2.5%) |
| 65 to 74 Years | 108 (5.9%) | 49 (2.2%) |
| 75 Years and over | 56 (7.0%) | 65 (4.4%) |
Disability Class: Cognitive Difficulty
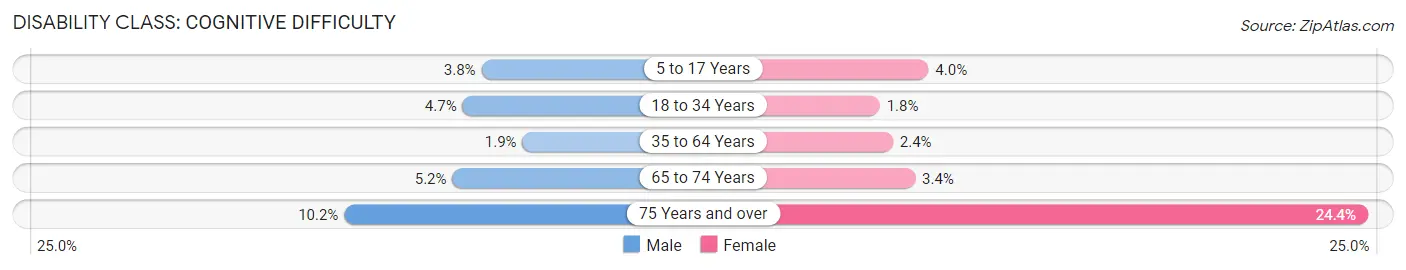
| Age Bracket | Male | Female |
| 5 to 17 Years | 150 (3.8%) | 169 (4.0%) |
| 18 to 34 Years | 193 (4.7%) | 72 (1.8%) |
| 35 to 64 Years | 141 (1.9%) | 180 (2.4%) |
| 65 to 74 Years | 94 (5.1%) | 76 (3.4%) |
| 75 Years and over | 82 (10.2%) | 360 (24.4%) |
Disability Class: Ambulatory Difficulty
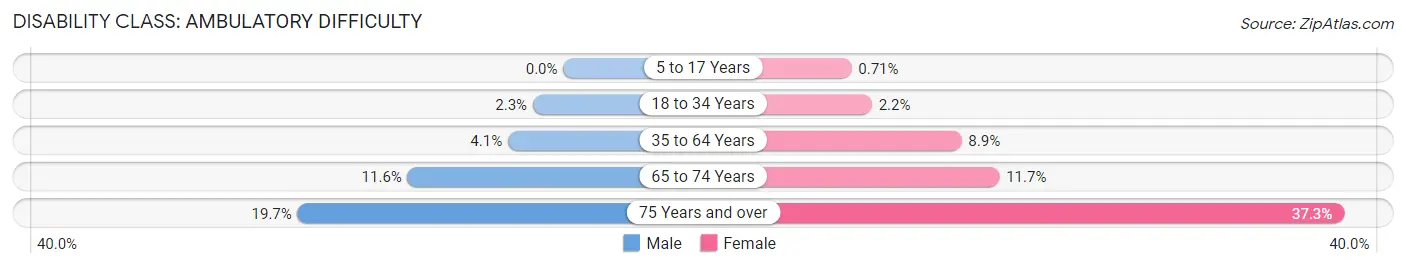
| Age Bracket | Male | Female |
| 5 to 17 Years | 0 (0.0%) | 30 (0.7%) |
| 18 to 34 Years | 93 (2.3%) | 91 (2.2%) |
| 35 to 64 Years | 304 (4.1%) | 675 (8.9%) |
| 65 to 74 Years | 211 (11.6%) | 261 (11.7%) |
| 75 Years and over | 159 (19.7%) | 550 (37.3%) |
Disability Class: Self-Care Difficulty
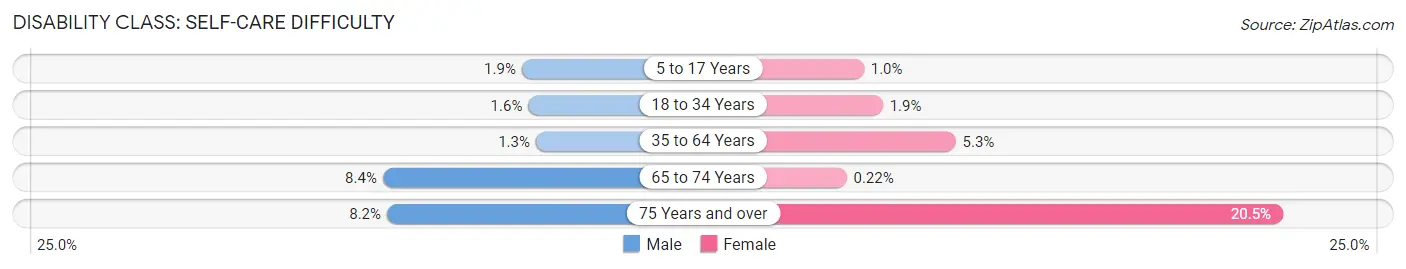
| Age Bracket | Male | Female |
| 5 to 17 Years | 76 (1.9%) | 43 (1.0%) |
| 18 to 34 Years | 67 (1.6%) | 78 (1.9%) |
| 35 to 64 Years | 95 (1.3%) | 401 (5.3%) |
| 65 to 74 Years | 153 (8.4%) | 5 (0.2%) |
| 75 Years and over | 66 (8.2%) | 302 (20.5%) |
Technology Access in Duncanville
Computing Device Access in Duncanville
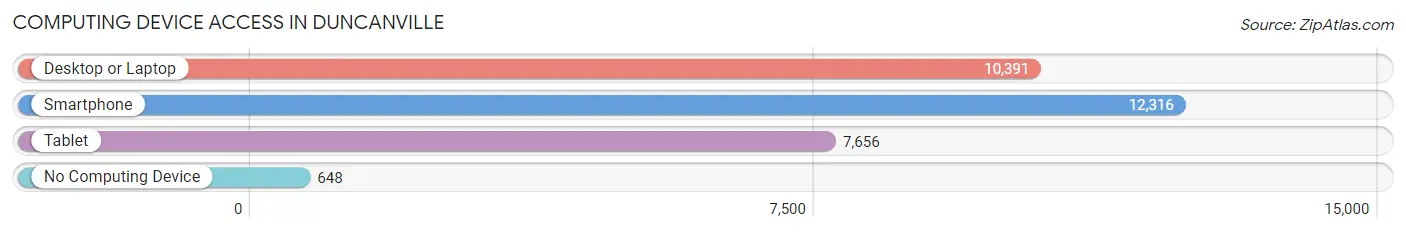
| Device Type | # Households | % Households |
| Desktop or Laptop | 10,391 | 75.8% |
| Smartphone | 12,316 | 89.9% |
| Tablet | 7,656 | 55.9% |
| No Computing Device | 648 | 4.7% |
| Total | 13,700 | 100.0% |
Internet Access in Duncanville
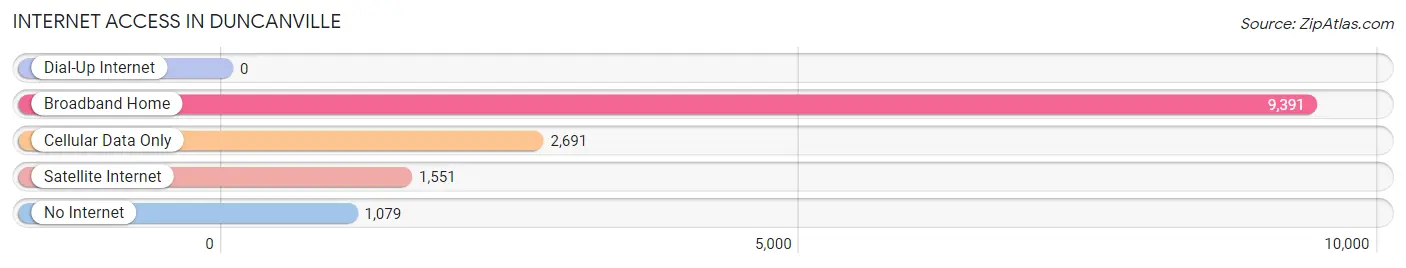
| Internet Type | # Households | % Households |
| Dial-Up Internet | 0 | 0.0% |
| Broadband Home | 9,391 | 68.5% |
| Cellular Data Only | 2,691 | 19.6% |
| Satellite Internet | 1,551 | 11.3% |
| No Internet | 1,079 | 7.9% |
| Total | 13,700 | 100.0% |
Duncanville Summary
Duncanville, Texas is a city located in Dallas County, Texas, United States. It is part of the Dallas–Fort Worth metroplex and is located approximately 15 miles south of downtown Dallas. The city had a population of 38,524 at the 2010 census.
History
The area that is now Duncanville was first settled in the 1840s by a group of settlers from Kentucky. The settlement was originally known as "Duncan's Switch" after one of the settlers, John Duncan. The settlement was later renamed Duncanville in 1882 when the post office was established.
The city was officially incorporated in 1947 and has since grown to become a thriving suburb of Dallas. The city has seen a population boom in recent years, with the population increasing by over 20% between 2000 and 2010.
Geography
Duncanville is located at 32°38'25" North, 96°54'45" West (32.6403, -96.9125). It is situated in the southwestern corner of Dallas County, approximately 15 miles south of downtown Dallas.
The city has a total area of 15.2 square miles, of which 15.1 square miles is land and 0.1 square miles is water. The city is bordered by Cedar Hill to the north, DeSoto to the east, Lancaster to the south, and Grand Prairie to the west.
Economy
Duncanville is home to a variety of businesses and industries. The city is home to several large employers, including Walmart, Home Depot, and Lowe's. The city is also home to several smaller businesses, including restaurants, retail stores, and professional services.
The city's economy is largely driven by its proximity to Dallas. Many residents commute to Dallas for work, and the city is home to several major employers.
Demographics
As of the 2010 census, there were 38,524 people, 13,845 households, and 10,072 families residing in the city. The population density was 2,541.2 people per square mile. The racial makeup of the city was 57.2% White, 25.3% African American, 0.7% Native American, 2.3% Asian, 0.1% Pacific Islander, 11.2% from other races, and 3.2% from two or more races. Hispanic or Latino of any race were 24.3% of the population.
The median income for a household in the city was $50,945, and the median income for a family was $58,945. The per capita income for the city was $21,945. About 11.2% of families and 14.2% of the population were below the poverty line, including 19.2% of those under age 18 and 8.2% of those age 65 or over.
Conclusion
Duncanville, Texas is a thriving suburb of Dallas located in Dallas County. The city has a rich history dating back to the 1840s and has seen a population boom in recent years. The city is home to a variety of businesses and industries, and is largely driven by its proximity to Dallas. The city has a population of 38,524, with a median household income of $50,945. Duncanville is a great place to live, work, and play.
Common Questions
What is Per Capita Income in Duncanville?
Per Capita income in Duncanville is $29,349.
What is the Median Family Income in Duncanville?
Median Family Income in Duncanville is $76,381.
What is the Median Household income in Duncanville?
Median Household Income in Duncanville is $66,601.
What is Income or Wage Gap in Duncanville?
Income or Wage Gap in Duncanville is 9.2%.
Women in Duncanville earn 90.8 cents for every dollar earned by a man.
What is Family Income Deficit in Duncanville?
Family Income Deficit in Duncanville is $10,376.
Families that are below poverty line in Duncanville earn $10,376 less on average than the poverty threshold level.
What is Inequality or Gini Index in Duncanville?
Inequality or Gini Index in Duncanville is 0.41.
What is the Total Population of Duncanville?
Total Population of Duncanville is 40,288.
What is the Total Male Population of Duncanville?
Total Male Population of Duncanville is 19,275.
What is the Total Female Population of Duncanville?
Total Female Population of Duncanville is 21,013.
What is the Ratio of Males per 100 Females in Duncanville?
There are 91.73 Males per 100 Females in Duncanville.
What is the Ratio of Females per 100 Males in Duncanville?
There are 109.02 Females per 100 Males in Duncanville.
What is the Median Population Age in Duncanville?
Median Population Age in Duncanville is 36.9 Years.
What is the Average Family Size in Duncanville
Average Family Size in Duncanville is 3.5 People.
What is the Average Household Size in Duncanville
Average Household Size in Duncanville is 2.9 People.
How Large is the Labor Force in Duncanville?
There are 19,353 People in the Labor Forcein in Duncanville.
What is the Percentage of People in the Labor Force in Duncanville?
62.2% of People are in the Labor Force in Duncanville.
What is the Unemployment Rate in Duncanville?
Unemployment Rate in Duncanville is 7.6%.