Carrizo Springs, TX Map & Demographics
Carrizo Springs Map
Carrizo Springs Overview
$19,379
PER CAPITA INCOME
$26,033
AVG HOUSEHOLD INCOME
0.49
INEQUALITY / GINI INDEX
4,888
TOTAL POPULATION
2,763
MALE POPULATION
2,125
FEMALE POPULATION
130.02
MALES / 100 FEMALES
76.91
FEMALES / 100 MALES
36.4
MEDIAN AGE
3.4
AVG FAMILY SIZE
3.0
AVG HOUSEHOLD SIZE
1,193
LABOR FORCE [ PEOPLE ]
33.4%
PERCENT IN LABOR FORCE
4.9%
UNEMPLOYMENT RATE
Carrizo Springs Zip Codes
Carrizo Springs Area Codes
Income in Carrizo Springs
Income Overview in Carrizo Springs
| Characteristic | Number | Measure |
| Per Capita Income | 4,888 | $19,379 |
| Median Family Income | 1,128 | $0 |
| Mean Family Income | 1,128 | $64,855 |
| Median Household Income | 1,634 | $26,033 |
| Mean Household Income | 1,634 | $56,091 |
| Income Deficit | 1,128 | $0 |
| Wage / Income Gap (%) | 4,888 | 0.00% |
| Wage / Income Gap ($) | 4,888 | 100.00¢ per $1 |
| Gini / Inequality Index | 4,888 | 0.49 |
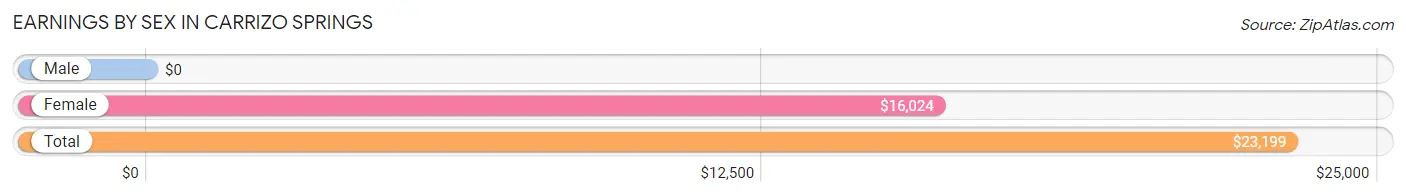
Earnings by Sex in Carrizo Springs
| Sex | Number | Average Earnings |
| Male | 1,290 (70.5%) | $0 |
| Female | 541 (29.5%) | $16,024 |
| Total | 1,831 (100.0%) | $23,199 |
Earnings by Sex by Income Bracket in Carrizo Springs
The most common earnings brackets in Carrizo Springs are $2,499 or less for men (410 | 31.8%) and $12,500 to $14,999 for women (117 | 21.6%).

| Income | Male | Female |
| $2,499 or less | 410 (31.8%) | 19 (3.5%) |
| $2,500 to $4,999 | 0 (0.0%) | 20 (3.7%) |
| $5,000 to $7,499 | 0 (0.0%) | 11 (2.0%) |
| $7,500 to $9,999 | 0 (0.0%) | 0 (0.0%) |
| $10,000 to $12,499 | 61 (4.7%) | 74 (13.7%) |
| $12,500 to $14,999 | 92 (7.1%) | 117 (21.6%) |
| $15,000 to $17,499 | 8 (0.6%) | 72 (13.3%) |
| $17,500 to $19,999 | 0 (0.0%) | 0 (0.0%) |
| $20,000 to $22,499 | 15 (1.2%) | 0 (0.0%) |
| $22,500 to $24,999 | 0 (0.0%) | 59 (10.9%) |
| $25,000 to $29,999 | 45 (3.5%) | 0 (0.0%) |
| $30,000 to $34,999 | 31 (2.4%) | 50 (9.2%) |
| $35,000 to $39,999 | 22 (1.7%) | 21 (3.9%) |
| $40,000 to $44,999 | 20 (1.5%) | 36 (6.7%) |
| $45,000 to $49,999 | 36 (2.8%) | 0 (0.0%) |
| $50,000 to $54,999 | 33 (2.6%) | 0 (0.0%) |
| $55,000 to $64,999 | 78 (6.0%) | 53 (9.8%) |
| $65,000 to $74,999 | 119 (9.2%) | 0 (0.0%) |
| $75,000 to $99,999 | 217 (16.8%) | 9 (1.7%) |
| $100,000+ | 103 (8.0%) | 0 (0.0%) |
| Total | 1,290 (100.0%) | 541 (100.0%) |
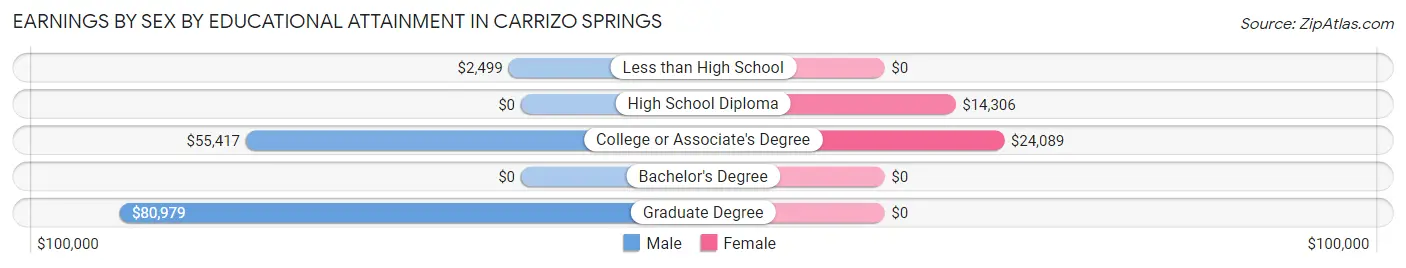
Earnings by Sex by Educational Attainment in Carrizo Springs
Average earnings in Carrizo Springs are $45,764 for men and $16,024 for women, a difference of 65.0%. Men with an educational attainment of graduate degree enjoy the highest average annual earnings of $80,979, while those with less than high school education earn the least with $2,499. Women with an educational attainment of college or associate's degree earn the most with the average annual earnings of $24,089, while those with high school diploma education have the smallest earnings of $14,306.
| Educational Attainment | Male Income | Female Income |
| Less than High School | $2,499 | $0 |
| High School Diploma | - | - |
| College or Associate's Degree | $55,417 | $24,089 |
| Bachelor's Degree | - | - |
| Graduate Degree | $80,979 | $0 |
| Total | $45,764 | $16,024 |
Family Income in Carrizo Springs
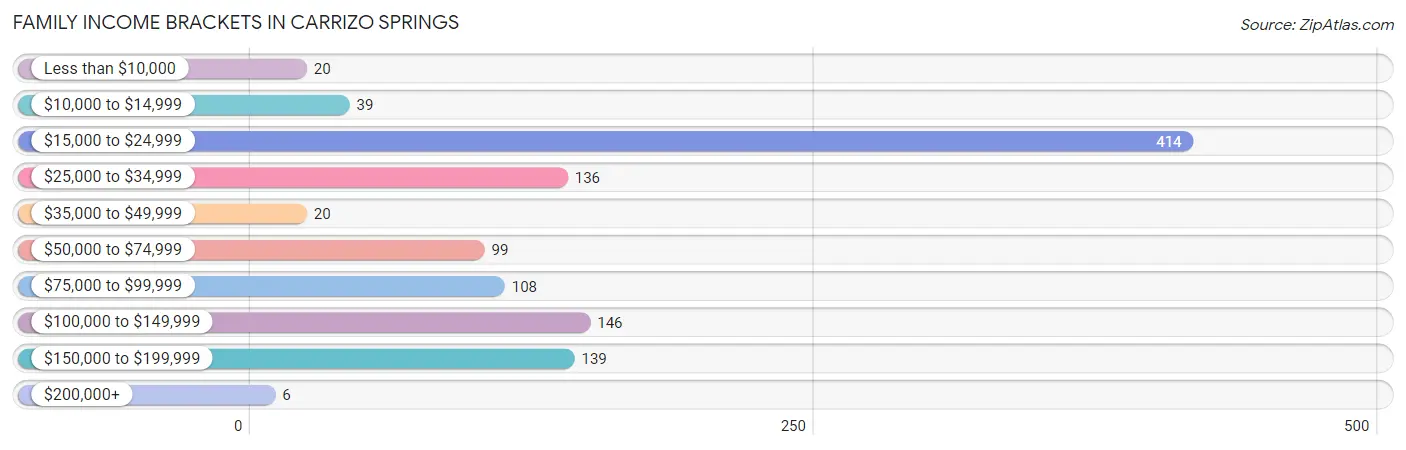
Family Income Brackets in Carrizo Springs
According to the Carrizo Springs family income data, there are 414 families falling into the $15,000 to $24,999 income range, which is the most common income bracket and makes up 36.7% of all families. Conversely, the $200,000+ income bracket is the least frequent group with only 6 families (0.5%) belonging to this category.
| Income Bracket | # Families | % Families |
| Less than $10,000 | 20 | 1.8% |
| $10,000 to $14,999 | 39 | 3.5% |
| $15,000 to $24,999 | 414 | 36.7% |
| $25,000 to $34,999 | 136 | 12.1% |
| $35,000 to $49,999 | 20 | 1.8% |
| $50,000 to $74,999 | 99 | 8.8% |
| $75,000 to $99,999 | 108 | 9.6% |
| $100,000 to $149,999 | 146 | 12.9% |
| $150,000 to $199,999 | 139 | 12.3% |
| $200,000+ | 6 | 0.5% |
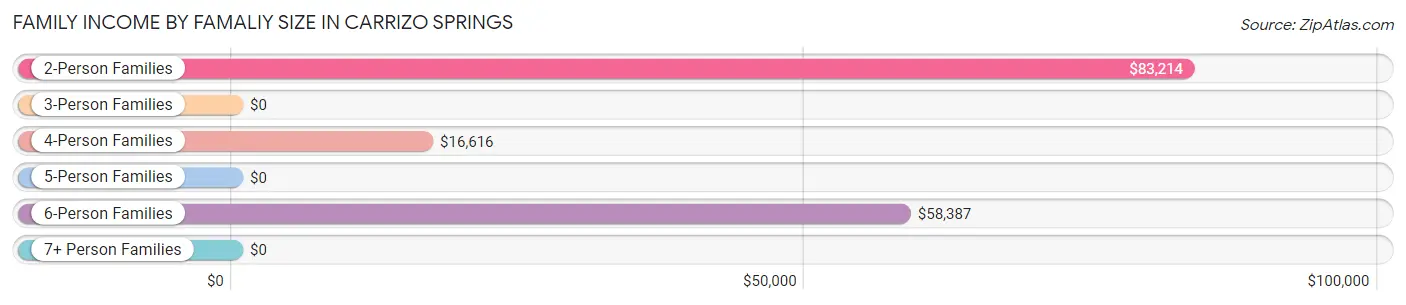
Family Income by Famaliy Size in Carrizo Springs
2-person families (424 | 37.6%) account for the highest median family income in Carrizo Springs with $83,214 per family, while 2-person families (424 | 37.6%) have the highest median income of $41,607 per family member.
| Income Bracket | # Families | Median Income |
| 2-Person Families | 424 (37.6%) | $83,214 |
| 3-Person Families | 326 (28.9%) | $0 |
| 4-Person Families | 106 (9.4%) | $16,616 |
| 5-Person Families | 210 (18.6%) | $0 |
| 6-Person Families | 62 (5.5%) | $58,387 |
| 7+ Person Families | 0 (0.0%) | $0 |
| Total | 1,128 (100.0%) | $0 |
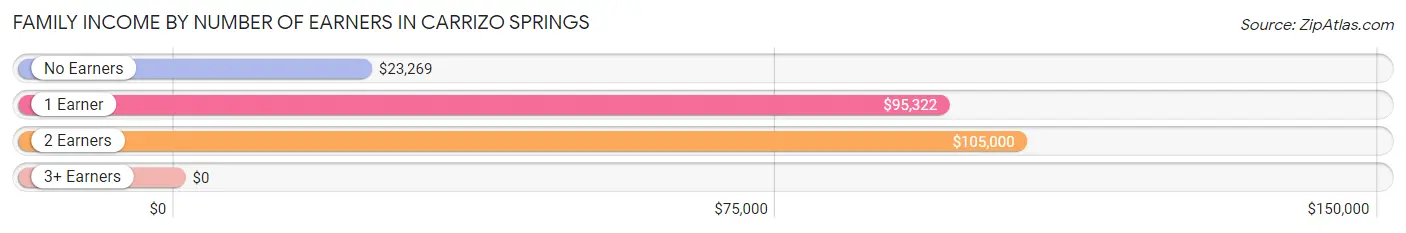
Family Income by Number of Earners in Carrizo Springs
| Number of Earners | # Families | Median Income |
| No Earners | 448 (39.7%) | $23,269 |
| 1 Earner | 277 (24.6%) | $95,322 |
| 2 Earners | 378 (33.5%) | $105,000 |
| 3+ Earners | 25 (2.2%) | $0 |
| Total | 1,128 (100.0%) | $0 |
Household Income in Carrizo Springs
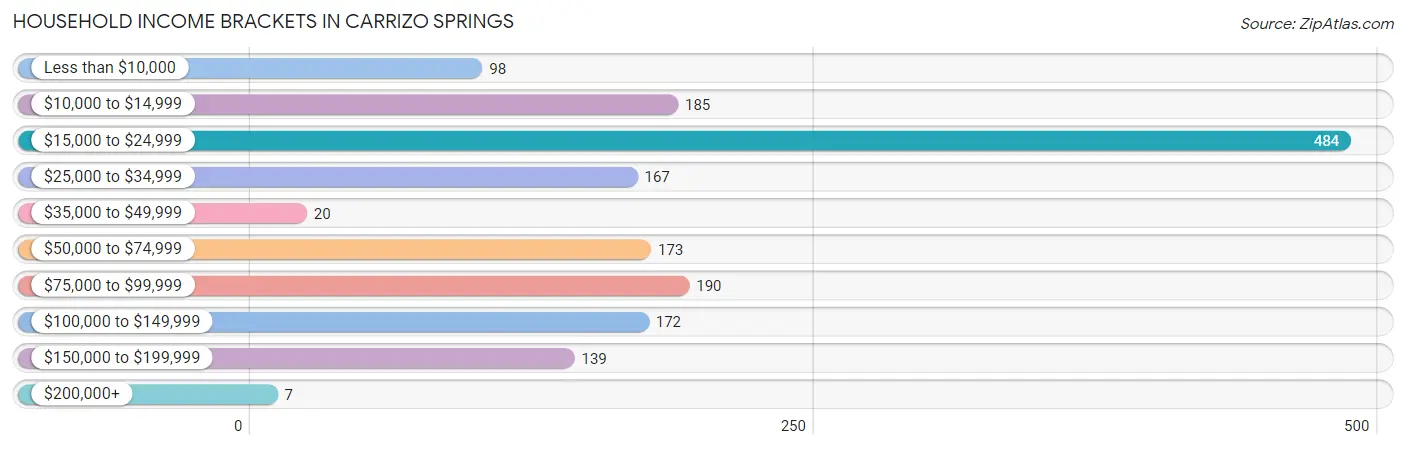
Household Income Brackets in Carrizo Springs
With 484 households falling in the category, the $15,000 to $24,999 income range is the most frequent in Carrizo Springs, accounting for 29.6% of all households. In contrast, only 7 households (0.4%) fall into the $200,000+ income bracket, making it the least populous group.
| Income Bracket | # Households | % Households |
| Less than $10,000 | 98 | 6.0% |
| $10,000 to $14,999 | 185 | 11.3% |
| $15,000 to $24,999 | 484 | 29.6% |
| $25,000 to $34,999 | 167 | 10.2% |
| $35,000 to $49,999 | 20 | 1.2% |
| $50,000 to $74,999 | 173 | 10.6% |
| $75,000 to $99,999 | 190 | 11.6% |
| $100,000 to $149,999 | 172 | 10.5% |
| $150,000 to $199,999 | 139 | 8.5% |
| $200,000+ | 7 | 0.4% |
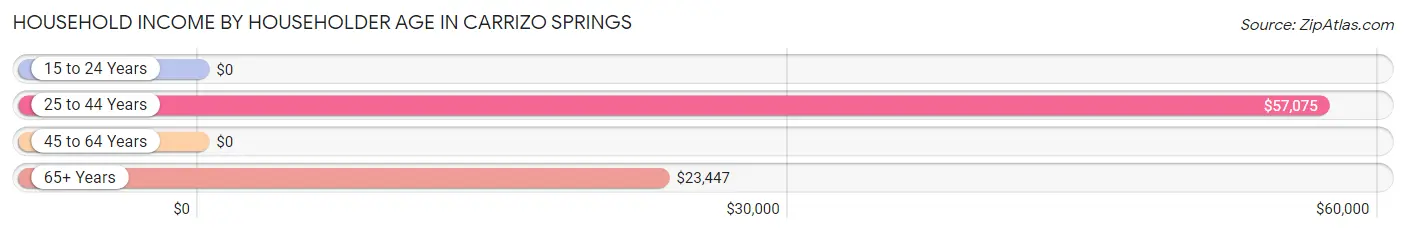
Household Income by Householder Age in Carrizo Springs
The median household income in Carrizo Springs is $26,033, with the highest median household income of $57,075 found in the 25 to 44 years age bracket for the primary householder. A total of 560 households (34.3%) fall into this category. Meanwhile, the 15 to 24 years age bracket for the primary householder has the lowest median household income of $0, with 22 households (1.3%) in this group.
| Income Bracket | # Households | Median Income |
| 15 to 24 Years | 22 (1.3%) | $0 |
| 25 to 44 Years | 560 (34.3%) | $57,075 |
| 45 to 64 Years | 561 (34.3%) | $0 |
| 65+ Years | 491 (30.0%) | $23,447 |
| Total | 1,634 (100.0%) | $26,033 |
Poverty in Carrizo Springs
Income Below Poverty by Sex and Age in Carrizo Springs
With 45.4% poverty level for males and 42.6% for females among the residents of Carrizo Springs, 12 to 14 year old males and 18 to 24 year old females are the most vulnerable to poverty, with 13 males (100.0%) and 34 females (100.0%) in their respective age groups living below the poverty level.
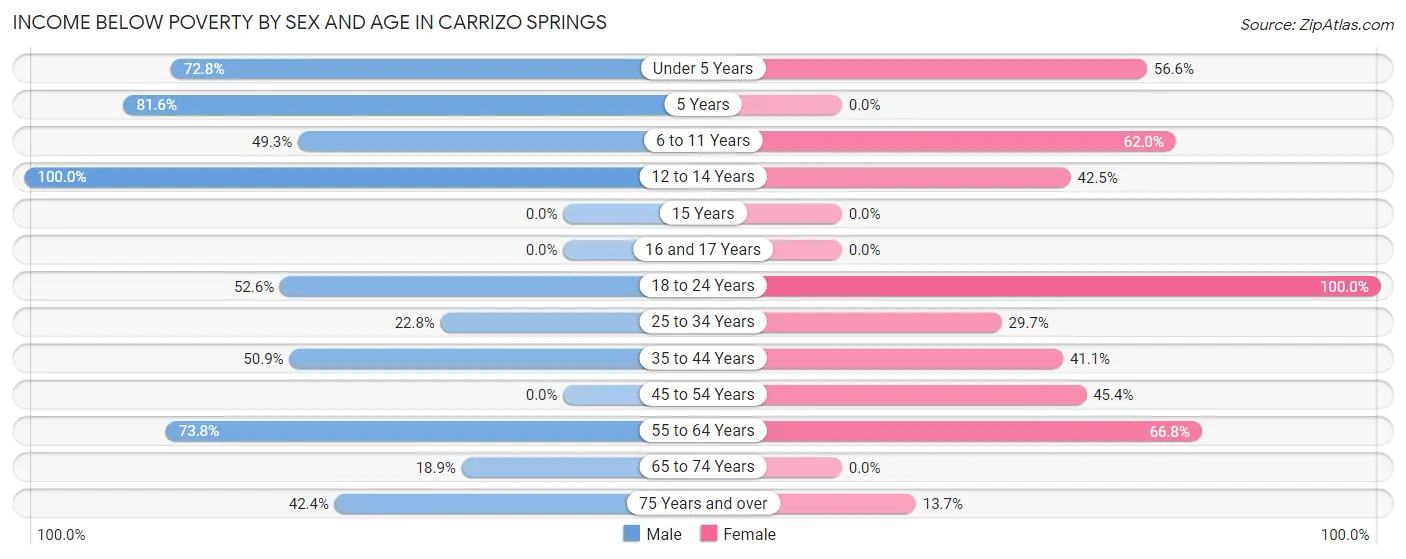
| Age Bracket | Male | Female |
| Under 5 Years | 166 (72.8%) | 47 (56.6%) |
| 5 Years | 120 (81.6%) | 0 (0.0%) |
| 6 to 11 Years | 99 (49.2%) | 261 (62.0%) |
| 12 to 14 Years | 13 (100.0%) | 62 (42.5%) |
| 15 Years | 0 (0.0%) | 0 (0.0%) |
| 16 and 17 Years | 0 (0.0%) | 0 (0.0%) |
| 18 to 24 Years | 142 (52.6%) | 34 (100.0%) |
| 25 to 34 Years | 46 (22.8%) | 78 (29.7%) |
| 35 to 44 Years | 360 (50.8%) | 117 (41.0%) |
| 45 to 54 Years | 0 (0.0%) | 93 (45.4%) |
| 55 to 64 Years | 180 (73.8%) | 165 (66.8%) |
| 65 to 74 Years | 40 (18.9%) | 0 (0.0%) |
| 75 Years and over | 84 (42.4%) | 29 (13.7%) |
| Total | 1,250 (45.4%) | 886 (42.6%) |
Income Above Poverty by Sex and Age in Carrizo Springs
According to the poverty statistics in Carrizo Springs, males aged 15 years and females aged 16 and 17 years are the age groups that are most secure financially, with 100.0% of males and 100.0% of females in these age groups living above the poverty line.
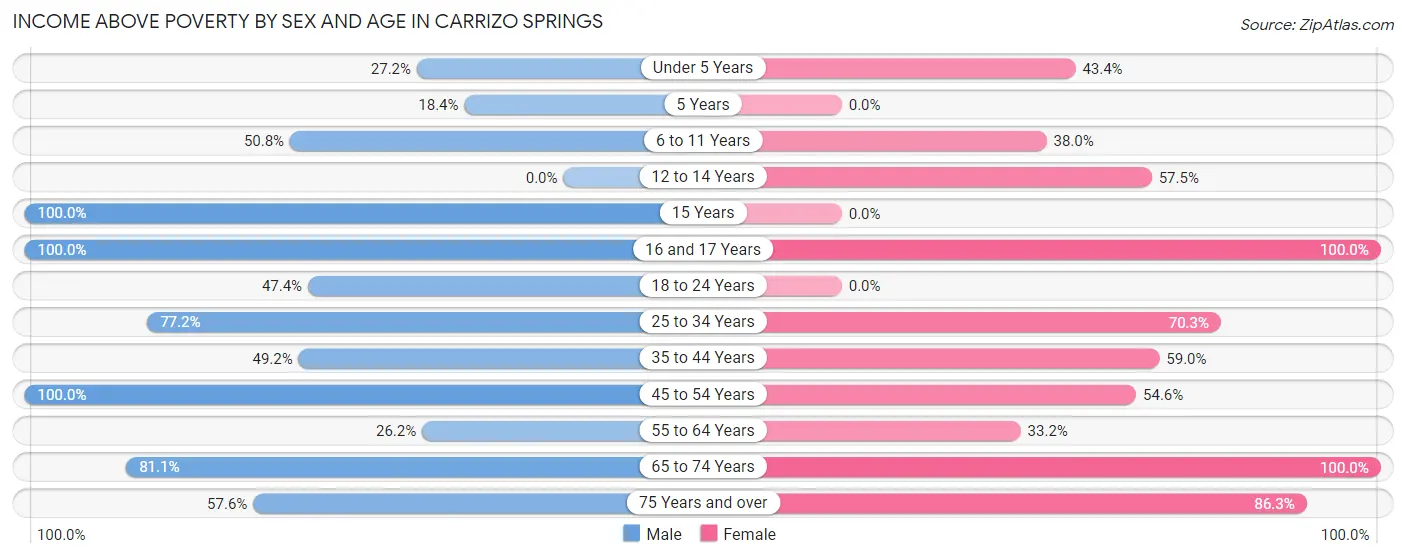
| Age Bracket | Male | Female |
| Under 5 Years | 62 (27.2%) | 36 (43.4%) |
| 5 Years | 27 (18.4%) | 0 (0.0%) |
| 6 to 11 Years | 102 (50.7%) | 160 (38.0%) |
| 12 to 14 Years | 0 (0.0%) | 84 (57.5%) |
| 15 Years | 78 (100.0%) | 0 (0.0%) |
| 16 and 17 Years | 70 (100.0%) | 38 (100.0%) |
| 18 to 24 Years | 128 (47.4%) | 0 (0.0%) |
| 25 to 34 Years | 156 (77.2%) | 185 (70.3%) |
| 35 to 44 Years | 348 (49.1%) | 168 (59.0%) |
| 45 to 54 Years | 183 (100.0%) | 112 (54.6%) |
| 55 to 64 Years | 64 (26.2%) | 82 (33.2%) |
| 65 to 74 Years | 172 (81.1%) | 146 (100.0%) |
| 75 Years and over | 114 (57.6%) | 182 (86.3%) |
| Total | 1,504 (54.6%) | 1,193 (57.4%) |
Income Below Poverty Among Married-Couple Families in Carrizo Springs
The poverty statistics for married-couple families in Carrizo Springs show that 9.5% or 57 of the total 598 families live below the poverty line. Families with no children have the highest poverty rate of 13.6%, comprising of 46 families. On the other hand, families with 3 or 4 children have the lowest poverty rate of 0.0%, which includes 0 families.
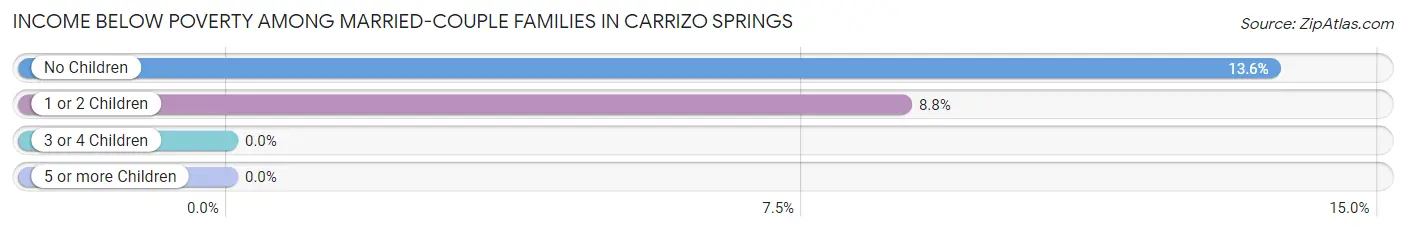
| Children | Above Poverty | Below Poverty |
| No Children | 292 (86.4%) | 46 (13.6%) |
| 1 or 2 Children | 114 (91.2%) | 11 (8.8%) |
| 3 or 4 Children | 135 (100.0%) | 0 (0.0%) |
| 5 or more Children | 0 (0.0%) | 0 (0.0%) |
| Total | 541 (90.5%) | 57 (9.5%) |
Income Below Poverty Among Single-Parent Households in Carrizo Springs
According to the poverty data in Carrizo Springs, 27.0% or 62 single-father households and 78.7% or 236 single-mother households are living below the poverty line. Among single-father households, those with 3 or 4 children have the highest poverty rate, with 22 households (66.7%) experiencing poverty. Likewise, among single-mother households, those with 3 or 4 children have the highest poverty rate, with 82 households (100.0%) falling below the poverty line.
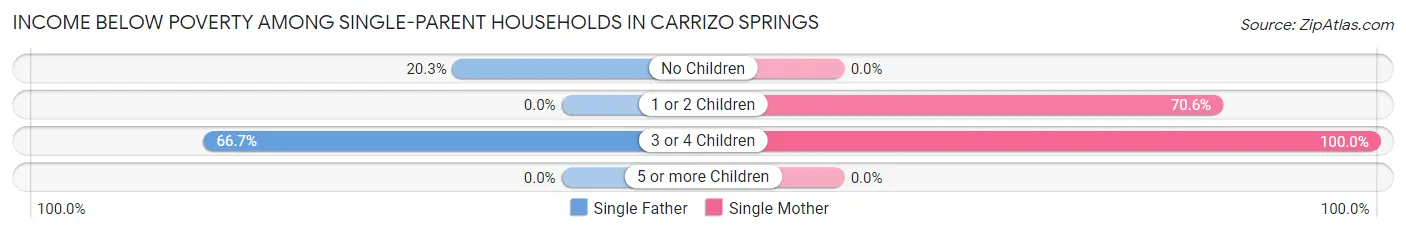
| Children | Single Father | Single Mother |
| No Children | 40 (20.3%) | 0 (0.0%) |
| 1 or 2 Children | 0 (0.0%) | 154 (70.6%) |
| 3 or 4 Children | 22 (66.7%) | 82 (100.0%) |
| 5 or more Children | 0 (0.0%) | 0 (0.0%) |
| Total | 62 (27.0%) | 236 (78.7%) |
Income Below Poverty Among Married-Couple vs Single-Parent Households in Carrizo Springs
The poverty data for Carrizo Springs shows that 57 of the married-couple family households (9.5%) and 298 of the single-parent households (56.2%) are living below the poverty level. Within the married-couple family households, those with no children have the highest poverty rate, with 46 households (13.6%) falling below the poverty line. Among the single-parent households, those with 3 or 4 children have the highest poverty rate, with 104 household (90.4%) living below poverty.
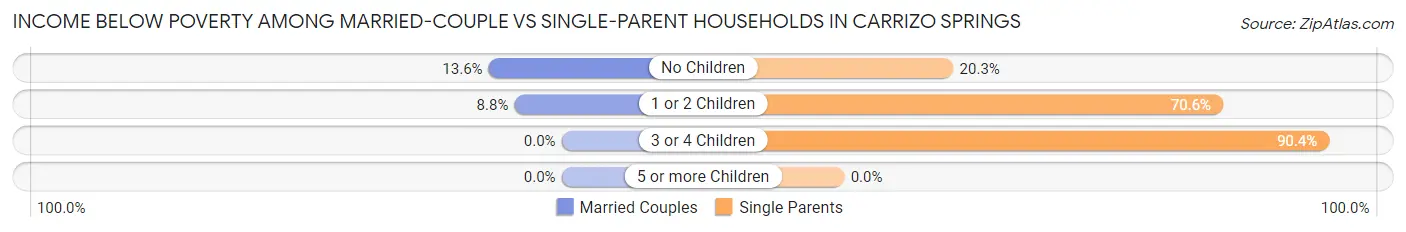
| Children | Married-Couple Families | Single-Parent Households |
| No Children | 46 (13.6%) | 40 (20.3%) |
| 1 or 2 Children | 11 (8.8%) | 154 (70.6%) |
| 3 or 4 Children | 0 (0.0%) | 104 (90.4%) |
| 5 or more Children | 0 (0.0%) | 0 (0.0%) |
| Total | 57 (9.5%) | 298 (56.2%) |
Race in Carrizo Springs
The most populous races in Carrizo Springs are Hispanic or Latino (4,479 | 91.6%), White / Caucasian (2,256 | 46.2%), and Two or more Races (1,813 | 37.1%).
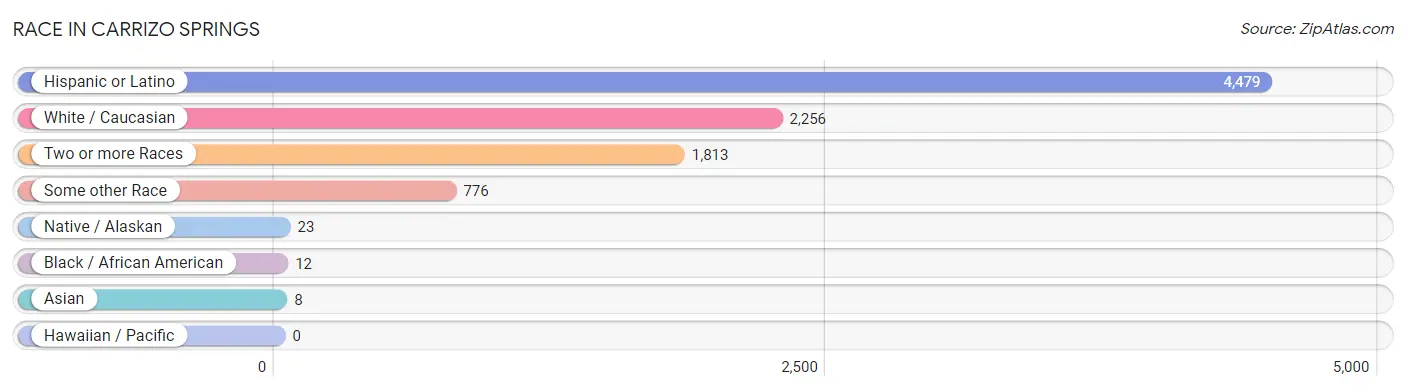
| Race | # Population | % Population |
| Asian | 8 | 0.2% |
| Black / African American | 12 | 0.3% |
| Hawaiian / Pacific | 0 | 0.0% |
| Hispanic or Latino | 4,479 | 91.6% |
| Native / Alaskan | 23 | 0.5% |
| White / Caucasian | 2,256 | 46.2% |
| Two or more Races | 1,813 | 37.1% |
| Some other Race | 776 | 15.9% |
| Total | 4,888 | 100.0% |
Ancestry in Carrizo Springs
The most populous ancestries reported in Carrizo Springs are Mexican (3,614 | 73.9%), Dominican (550 | 11.3%), German (118 | 2.4%), Scotch-Irish (37 | 0.8%), and Scottish (29 | 0.6%), together accounting for 89.0% of all Carrizo Springs residents.
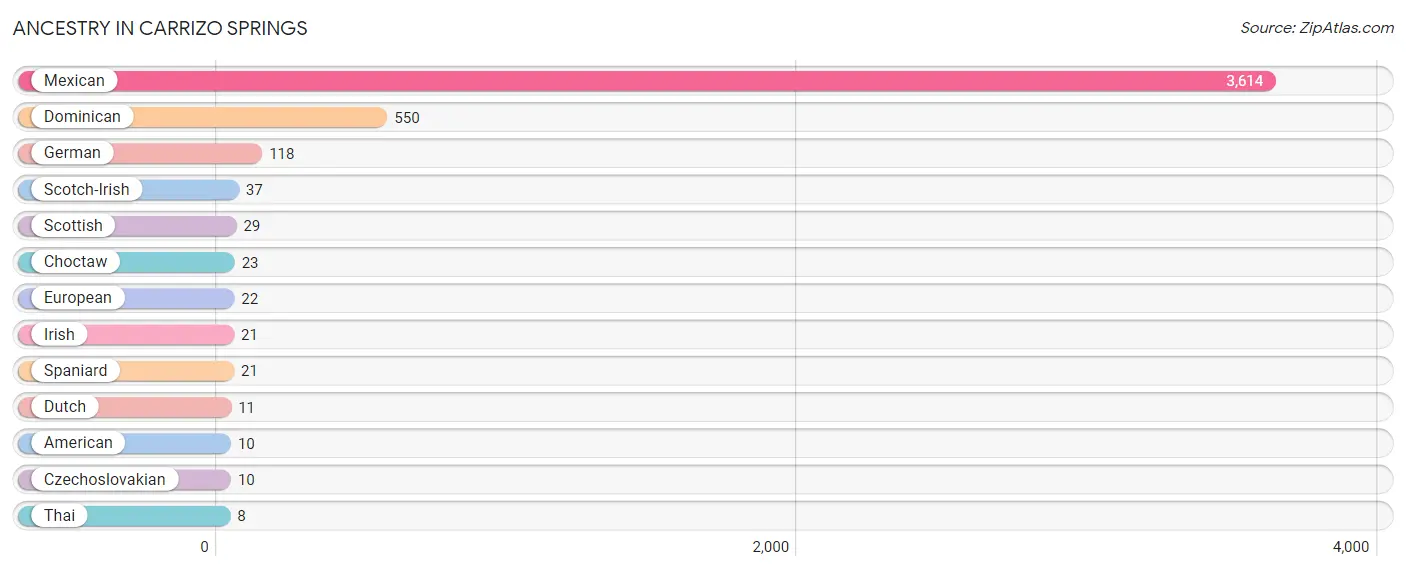
| Ancestry | # Population | % Population |
| American | 10 | 0.2% |
| Choctaw | 23 | 0.5% |
| Czechoslovakian | 10 | 0.2% |
| Dominican | 550 | 11.3% |
| Dutch | 11 | 0.2% |
| European | 22 | 0.4% |
| German | 118 | 2.4% |
| Irish | 21 | 0.4% |
| Mexican | 3,614 | 73.9% |
| Scotch-Irish | 37 | 0.8% |
| Scottish | 29 | 0.6% |
| Spaniard | 21 | 0.4% |
| Thai | 8 | 0.2% | View All 13 Rows |
Immigrants in Carrizo Springs
The most numerous immigrant groups reported in Carrizo Springs came from Latin America (616 | 12.6%), Caribbean (430 | 8.8%), Dominican Republic (430 | 8.8%), Central America (186 | 3.8%), and Mexico (186 | 3.8%), together accounting for 37.8% of all Carrizo Springs residents.
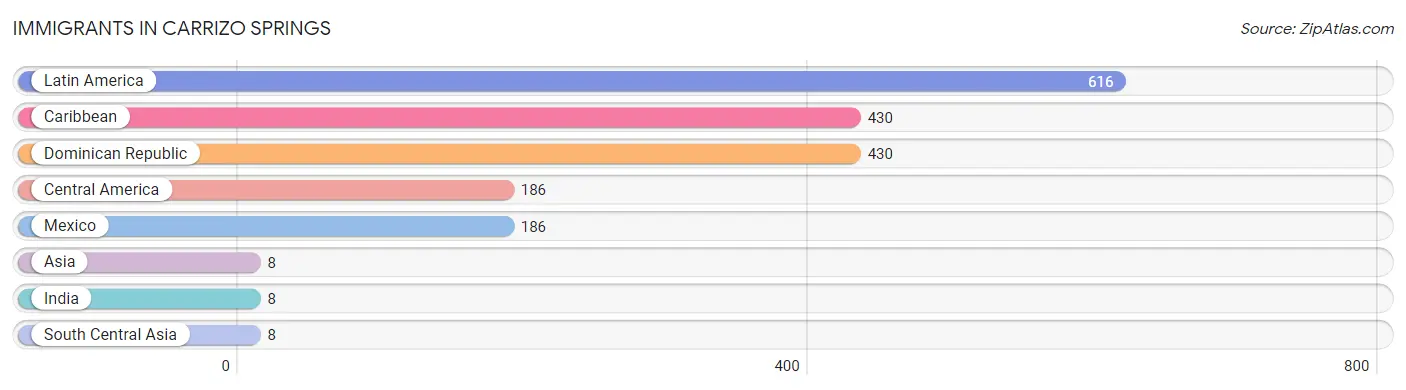
| Immigration Origin | # Population | % Population |
| Asia | 8 | 0.2% |
| Caribbean | 430 | 8.8% |
| Central America | 186 | 3.8% |
| Dominican Republic | 430 | 8.8% |
| India | 8 | 0.2% |
| Latin America | 616 | 12.6% |
| Mexico | 186 | 3.8% |
| South Central Asia | 8 | 0.2% | View All 8 Rows |
Sex and Age in Carrizo Springs
Sex and Age in Carrizo Springs
The most populous age groups in Carrizo Springs are 35 to 39 Years (686 | 24.8%) for men and 10 to 14 Years (325 | 15.3%) for women.
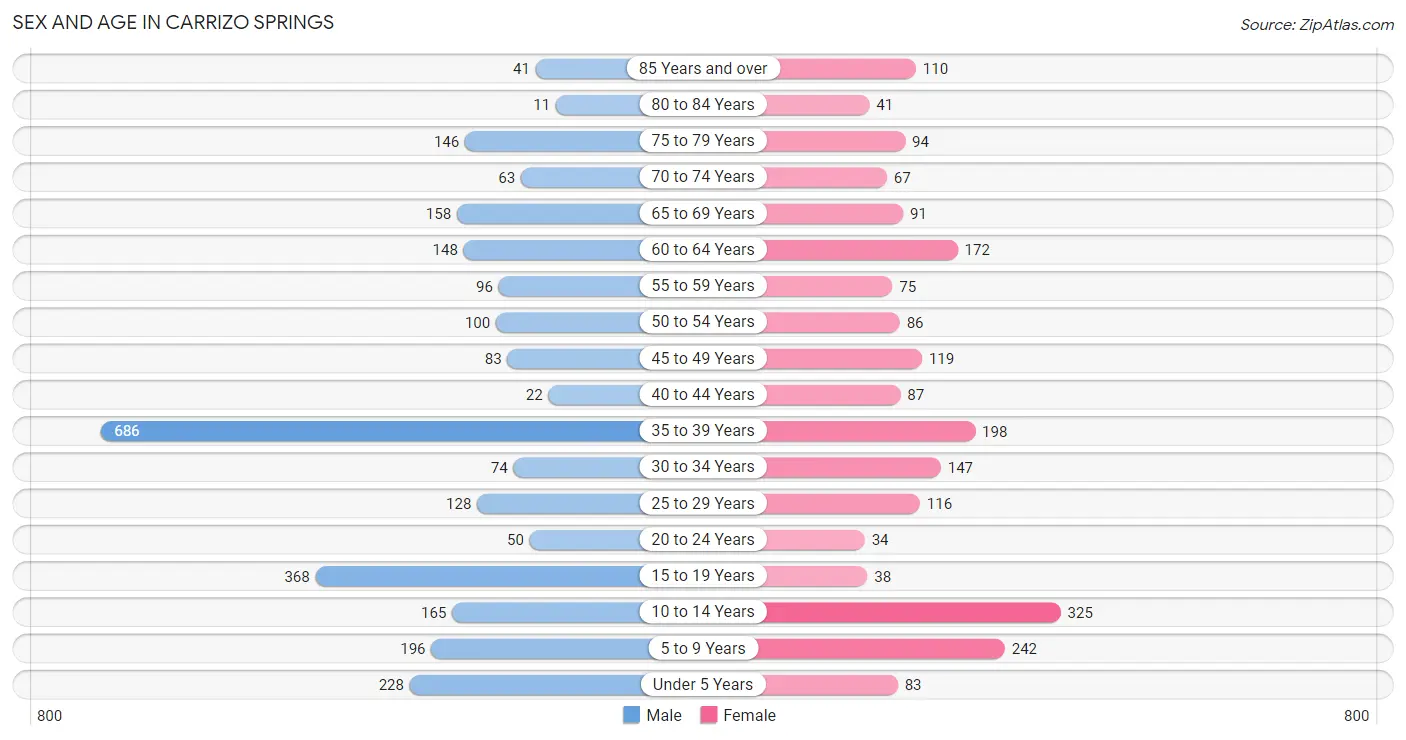
| Age Bracket | Male | Female |
| Under 5 Years | 228 (8.3%) | 83 (3.9%) |
| 5 to 9 Years | 196 (7.1%) | 242 (11.4%) |
| 10 to 14 Years | 165 (6.0%) | 325 (15.3%) |
| 15 to 19 Years | 368 (13.3%) | 38 (1.8%) |
| 20 to 24 Years | 50 (1.8%) | 34 (1.6%) |
| 25 to 29 Years | 128 (4.6%) | 116 (5.5%) |
| 30 to 34 Years | 74 (2.7%) | 147 (6.9%) |
| 35 to 39 Years | 686 (24.8%) | 198 (9.3%) |
| 40 to 44 Years | 22 (0.8%) | 87 (4.1%) |
| 45 to 49 Years | 83 (3.0%) | 119 (5.6%) |
| 50 to 54 Years | 100 (3.6%) | 86 (4.1%) |
| 55 to 59 Years | 96 (3.5%) | 75 (3.5%) |
| 60 to 64 Years | 148 (5.4%) | 172 (8.1%) |
| 65 to 69 Years | 158 (5.7%) | 91 (4.3%) |
| 70 to 74 Years | 63 (2.3%) | 67 (3.2%) |
| 75 to 79 Years | 146 (5.3%) | 94 (4.4%) |
| 80 to 84 Years | 11 (0.4%) | 41 (1.9%) |
| 85 Years and over | 41 (1.5%) | 110 (5.2%) |
| Total | 2,763 (100.0%) | 2,125 (100.0%) |
Families and Households in Carrizo Springs
Median Family Size in Carrizo Springs
The median family size in Carrizo Springs is 3.40 persons per family, with single female/mother families (300 | 26.6%) accounting for the largest median family size of 3.61 persons per family. On the other hand, single male/father families (230 | 20.4%) represent the smallest median family size with 3.04 persons per family.
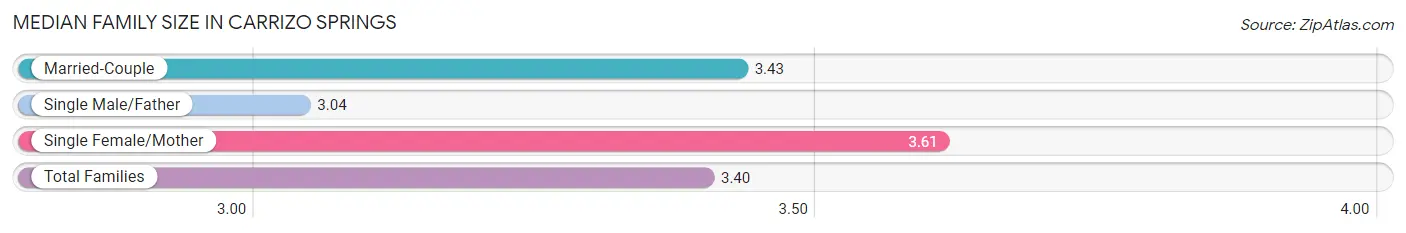
| Family Type | # Families | Family Size |
| Married-Couple | 598 (53.0%) | 3.43 |
| Single Male/Father | 230 (20.4%) | 3.04 |
| Single Female/Mother | 300 (26.6%) | 3.61 |
| Total Families | 1,128 (100.0%) | 3.40 |
Median Household Size in Carrizo Springs
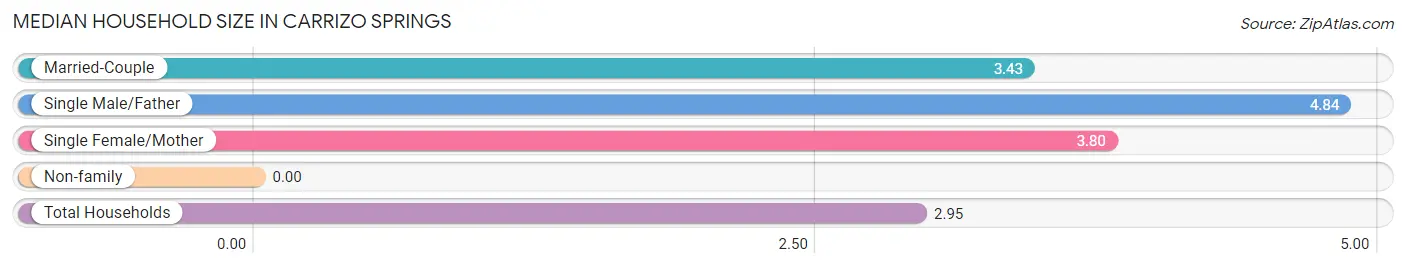
| Household Type | # Households | Household Size |
| Married-Couple | 598 (36.6%) | 3.43 |
| Single Male/Father | 230 (14.1%) | 4.84 |
| Single Female/Mother | 300 (18.4%) | 3.80 |
| Non-family | 506 (31.0%) | - |
| Total Households | 1,634 (100.0%) | 2.95 |
Household Size by Marriage Status in Carrizo Springs
Out of a total of 1,634 households in Carrizo Springs, 1,128 (69.0%) are family households, while 506 (31.0%) are nonfamily households. The most numerous type of family households are 2-person households, comprising 354, and the most common type of nonfamily households are 1-person households, comprising 506.
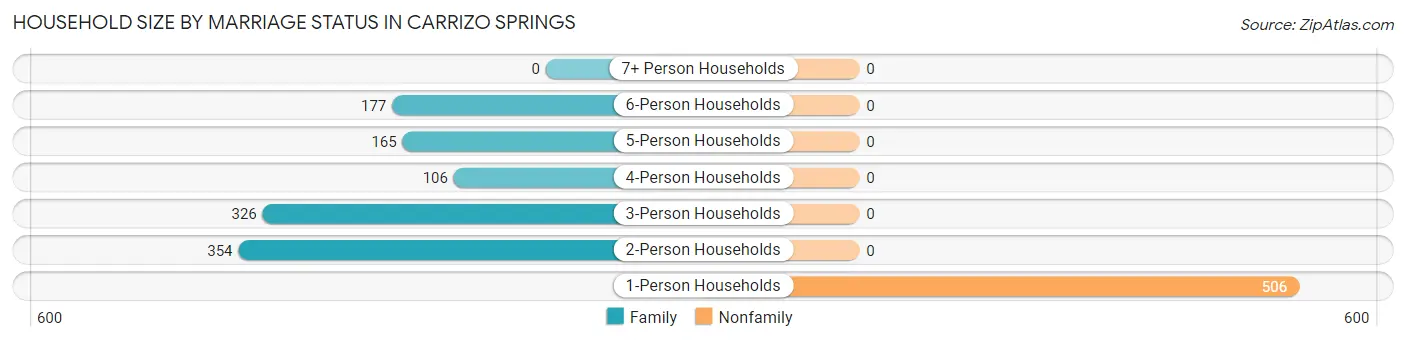
| Household Size | Family Households | Nonfamily Households |
| 1-Person Households | - | 506 (31.0%) |
| 2-Person Households | 354 (21.7%) | 0 (0.0%) |
| 3-Person Households | 326 (20.0%) | 0 (0.0%) |
| 4-Person Households | 106 (6.5%) | 0 (0.0%) |
| 5-Person Households | 165 (10.1%) | 0 (0.0%) |
| 6-Person Households | 177 (10.8%) | 0 (0.0%) |
| 7+ Person Households | 0 (0.0%) | 0 (0.0%) |
| Total | 1,128 (69.0%) | 506 (31.0%) |
Female Fertility in Carrizo Springs
Fertility by Age in Carrizo Springs
Average fertility rate in Carrizo Springs is 141.0 births per 1,000 women. Women in the age bracket of 20 to 34 years have the highest fertility rate with 313.0 births per 1,000 women. Women in the age bracket of 20 to 34 years acount for 80.9% of all women with births.
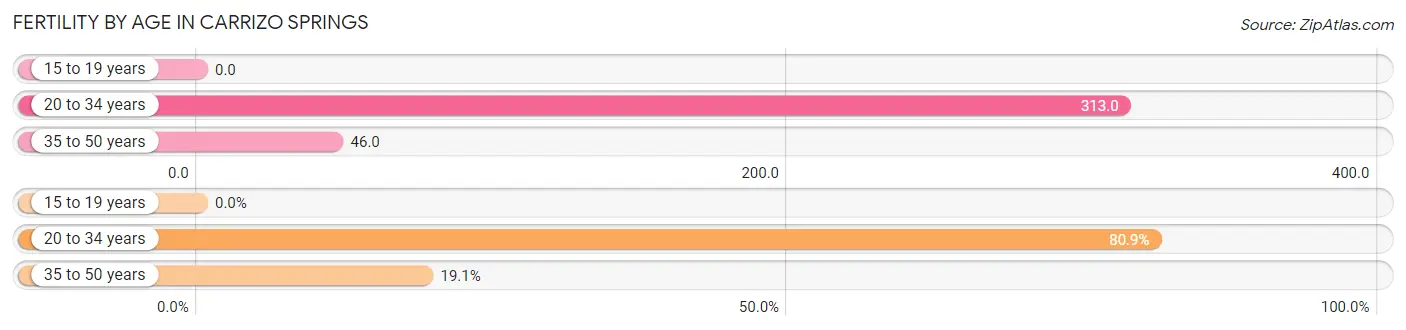
| Age Bracket | Women with Births | Births / 1,000 Women |
| 15 to 19 years | 0 (0.0%) | 0.0 |
| 20 to 34 years | 93 (80.9%) | 313.0 |
| 35 to 50 years | 22 (19.1%) | 46.0 |
| Total | 115 (100.0%) | 141.0 |
Fertility by Age by Marriage Status in Carrizo Springs
70.4% of women with births (115) in Carrizo Springs are married. The highest percentage of unmarried women with births falls into 20 to 34 years age bracket with 36.6% of them unmarried at the time of birth, while the lowest percentage of unmarried women with births belong to 35 to 50 years age bracket with 0.0% of them unmarried.
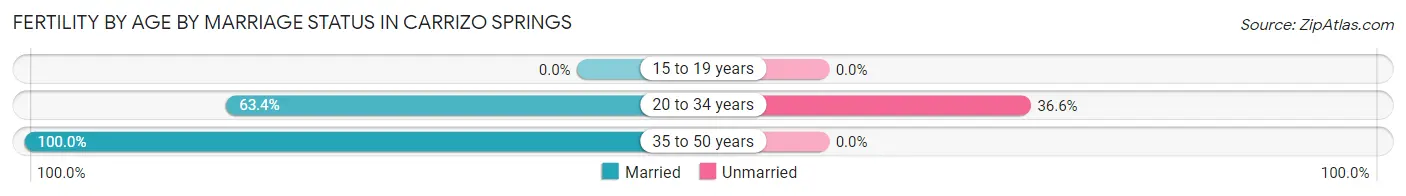
| Age Bracket | Married | Unmarried |
| 15 to 19 years | 0 (0.0%) | 0 (0.0%) |
| 20 to 34 years | 59 (63.4%) | 34 (36.6%) |
| 35 to 50 years | 22 (100.0%) | 0 (0.0%) |
| Total | 81 (70.4%) | 34 (29.6%) |
Fertility by Education in Carrizo Springs
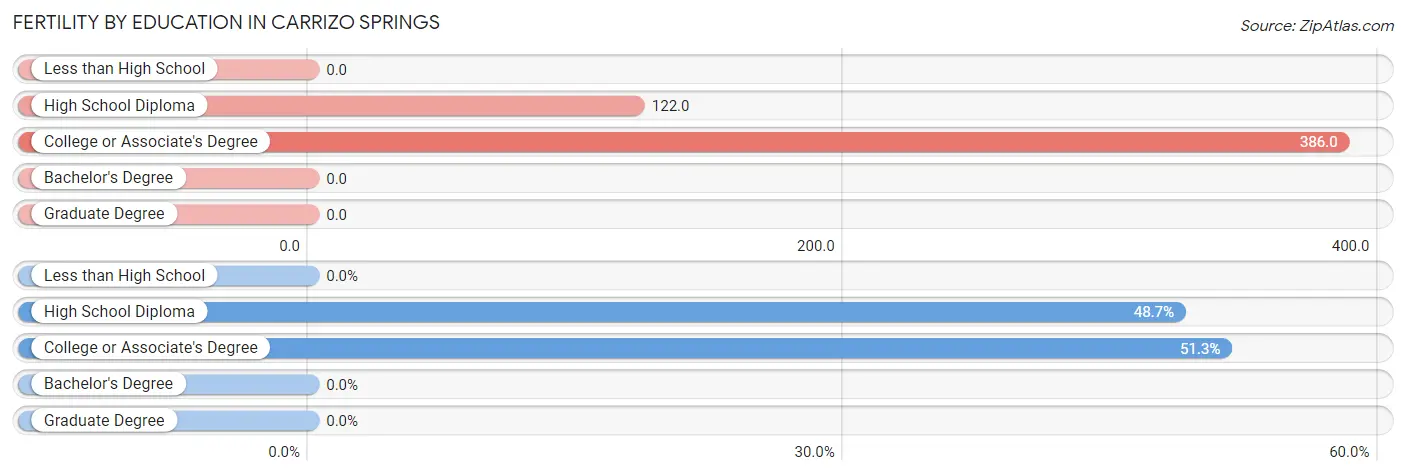
| Educational Attainment | Women with Births | Births / 1,000 Women |
| Less than High School | 0 (0.0%) | 0.0 |
| High School Diploma | 56 (48.7%) | 122.0 |
| College or Associate's Degree | 59 (51.3%) | 386.0 |
| Bachelor's Degree | 0 (0.0%) | 0.0 |
| Graduate Degree | 0 (0.0%) | 0.0 |
| Total | 115 (100.0%) | 141.0 |
Fertility by Education by Marriage Status in Carrizo Springs
29.6% of women with births in Carrizo Springs are unmarried. Women with the educational attainment of college or associate's degree are most likely to be married with 100.0% of them married at childbirth, while women with the educational attainment of high school diploma are least likely to be married with 60.7% of them unmarried at childbirth.
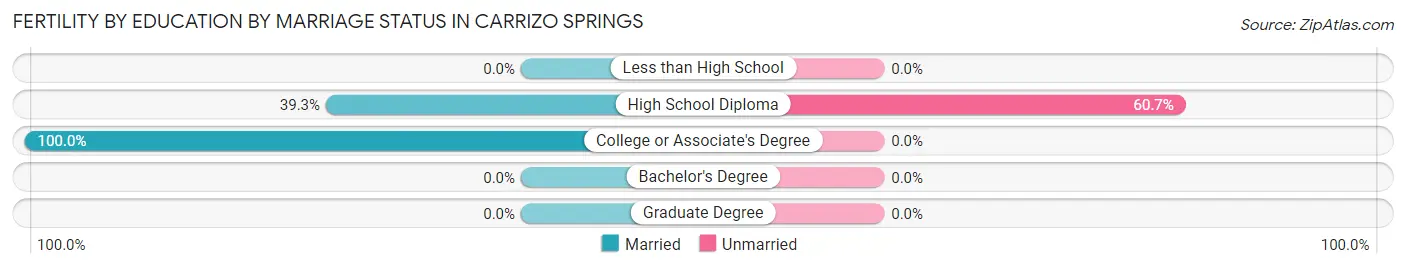
| Educational Attainment | Married | Unmarried |
| Less than High School | 0 (0.0%) | 0 (0.0%) |
| High School Diploma | 22 (39.3%) | 34 (60.7%) |
| College or Associate's Degree | 59 (100.0%) | 0 (0.0%) |
| Bachelor's Degree | 0 (0.0%) | 0 (0.0%) |
| Graduate Degree | 0 (0.0%) | 0 (0.0%) |
| Total | 81 (70.4%) | 34 (29.6%) |
Employment Characteristics in Carrizo Springs
Employment by Class of Employer in Carrizo Springs
Among the 1,136 employed individuals in Carrizo Springs, private company employees (750 | 66.0%), self-employed (not incorporated) (115 | 10.1%), and local government employees (96 | 8.5%) make up the most common classes of employment.
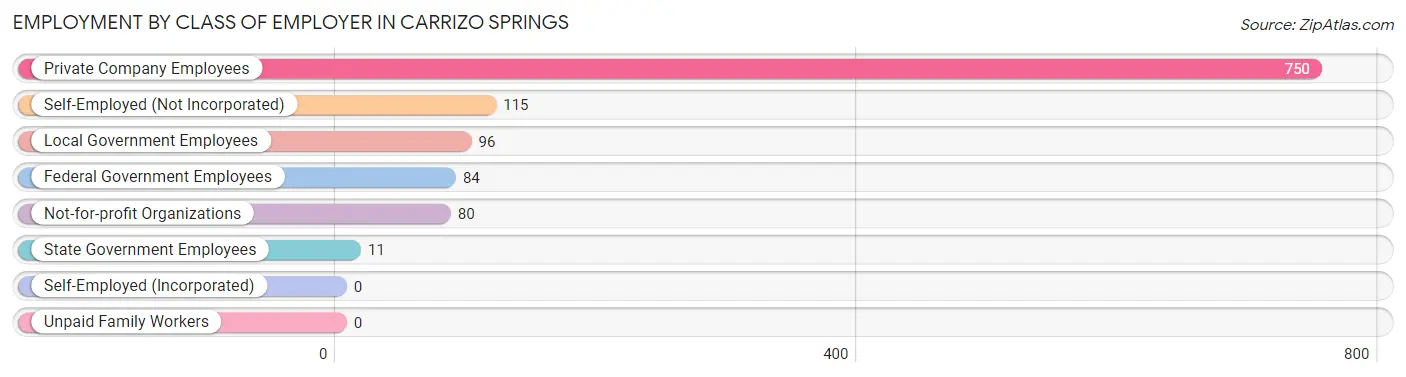
| Employer Class | # Employees | % Employees |
| Private Company Employees | 750 | 66.0% |
| Self-Employed (Incorporated) | 0 | 0.0% |
| Self-Employed (Not Incorporated) | 115 | 10.1% |
| Not-for-profit Organizations | 80 | 7.0% |
| Local Government Employees | 96 | 8.5% |
| State Government Employees | 11 | 1.0% |
| Federal Government Employees | 84 | 7.4% |
| Unpaid Family Workers | 0 | 0.0% |
| Total | 1,136 | 100.0% |
Employment Status by Age in Carrizo Springs
According to the labor force statistics for Carrizo Springs, out of the total population over 16 years of age (3,571), 33.4% or 1,193 individuals are in the labor force, with 4.9% or 58 of them unemployed. The age group with the highest labor force participation rate is 45 to 54 years, with 73.5% or 285 individuals in the labor force. Within the labor force, the 60 to 64 years age range has the highest percentage of unemployed individuals, with 76.9% or 20 of them being unemployed.
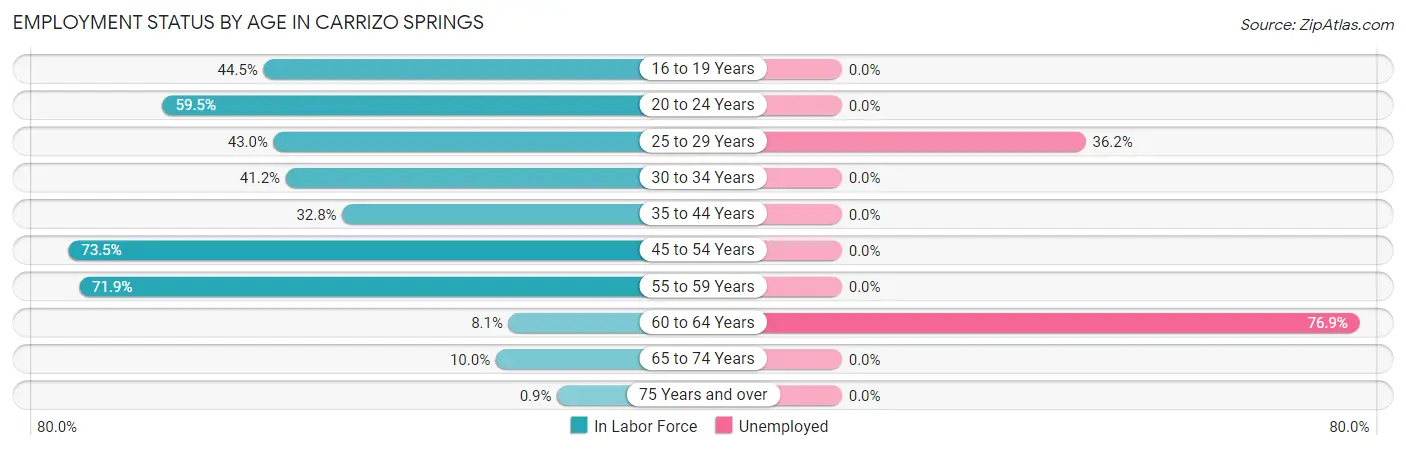
| Age Bracket | In Labor Force | Unemployed |
| 16 to 19 Years | 146 (44.5%) | 0 (0.0%) |
| 20 to 24 Years | 50 (59.5%) | 0 (0.0%) |
| 25 to 29 Years | 105 (43.0%) | 38 (36.2%) |
| 30 to 34 Years | 91 (41.2%) | 0 (0.0%) |
| 35 to 44 Years | 326 (32.8%) | 0 (0.0%) |
| 45 to 54 Years | 285 (73.5%) | 0 (0.0%) |
| 55 to 59 Years | 123 (71.9%) | 0 (0.0%) |
| 60 to 64 Years | 26 (8.1%) | 20 (76.9%) |
| 65 to 74 Years | 38 (10.0%) | 0 (0.0%) |
| 75 Years and over | 4 (0.9%) | 0 (0.0%) |
| Total | 1,193 (33.4%) | 58 (4.9%) |
Employment Status by Educational Attainment in Carrizo Springs
According to labor force statistics for Carrizo Springs, 40.9% of individuals (956) out of the total population between 25 and 64 years of age (2,337) are in the labor force, with 6.1% or 58 of them being unemployed. The group with the highest labor force participation rate are those with the educational attainment of college / associate degree, with 61.0% or 260 individuals in the labor force. Within the labor force, individuals with bachelor's degree or higher education have the highest percentage of unemployment, with 18.3% or 20 of them being unemployed.
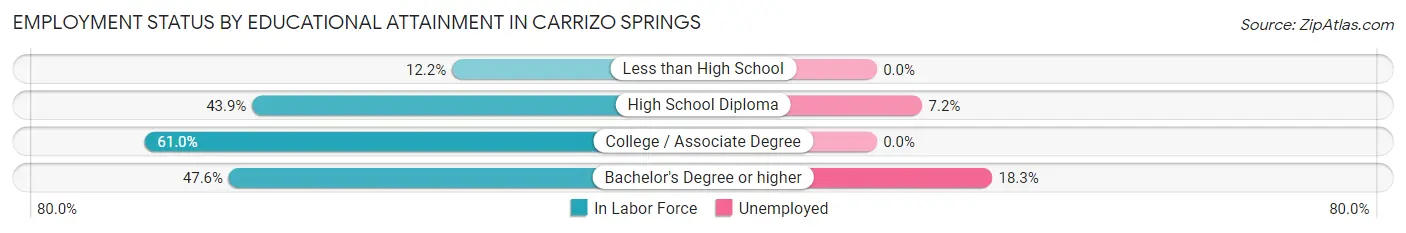
| Educational Attainment | In Labor Force | Unemployed |
| Less than High School | 58 (12.2%) | 0 (0.0%) |
| High School Diploma | 529 (43.9%) | 87 (7.2%) |
| College / Associate Degree | 260 (61.0%) | 0 (0.0%) |
| Bachelor's Degree or higher | 109 (47.6%) | 42 (18.3%) |
| Total | 956 (40.9%) | 143 (6.1%) |
Employment Occupations by Sex in Carrizo Springs
Management, Business, Science and Arts Occupations
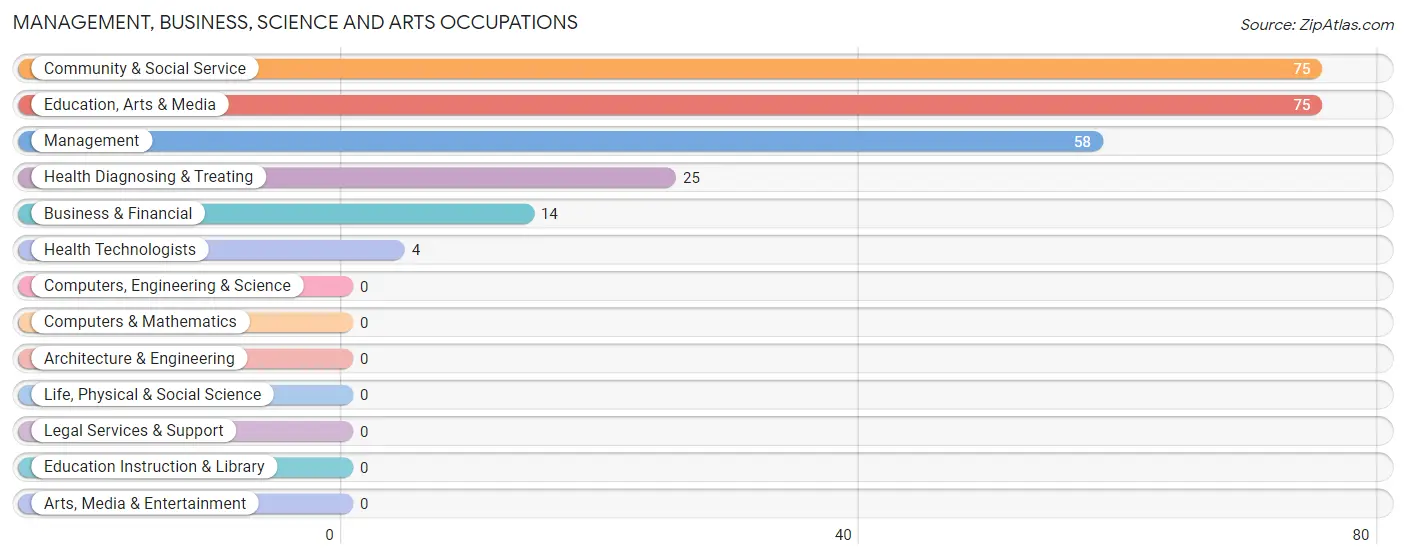
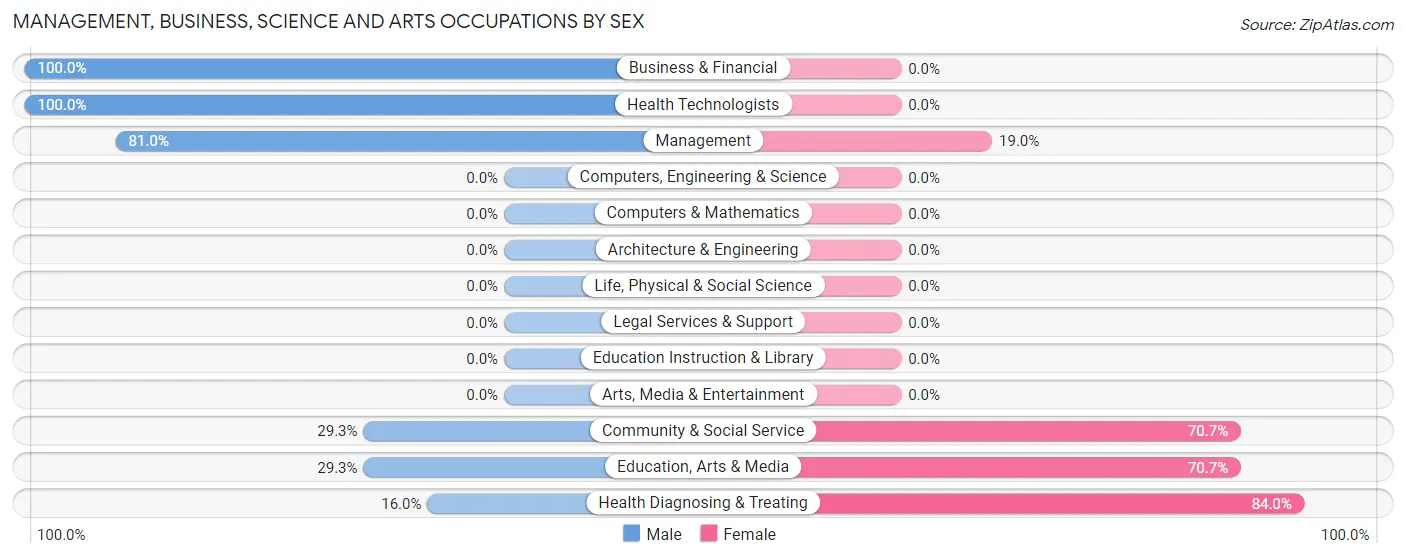
The most common Management, Business, Science and Arts occupations in Carrizo Springs are Community & Social Service (75 | 6.6%), Education, Arts & Media (75 | 6.6%), Management (58 | 5.1%), Health Diagnosing & Treating (25 | 2.2%), and Business & Financial (14 | 1.2%).
Management, Business, Science and Arts Occupations by Sex
Within the Management, Business, Science and Arts occupations in Carrizo Springs, the most male-oriented occupations are Business & Financial (100.0%), Health Technologists (100.0%), and Management (81.0%), while the most female-oriented occupations are Health Diagnosing & Treating (84.0%), Community & Social Service (70.7%), and Education, Arts & Media (70.7%).
| Occupation | Male | Female |
| Management | 47 (81.0%) | 11 (19.0%) |
| Business & Financial | 14 (100.0%) | 0 (0.0%) |
| Computers, Engineering & Science | 0 (0.0%) | 0 (0.0%) |
| Computers & Mathematics | 0 (0.0%) | 0 (0.0%) |
| Architecture & Engineering | 0 (0.0%) | 0 (0.0%) |
| Life, Physical & Social Science | 0 (0.0%) | 0 (0.0%) |
| Community & Social Service | 22 (29.3%) | 53 (70.7%) |
| Education, Arts & Media | 22 (29.3%) | 53 (70.7%) |
| Legal Services & Support | 0 (0.0%) | 0 (0.0%) |
| Education Instruction & Library | 0 (0.0%) | 0 (0.0%) |
| Arts, Media & Entertainment | 0 (0.0%) | 0 (0.0%) |
| Health Diagnosing & Treating | 4 (16.0%) | 21 (84.0%) |
| Health Technologists | 4 (100.0%) | 0 (0.0%) |
| Total (Category) | 87 (50.6%) | 85 (49.4%) |
| Total (Overall) | 762 (67.1%) | 374 (32.9%) |
Services Occupations
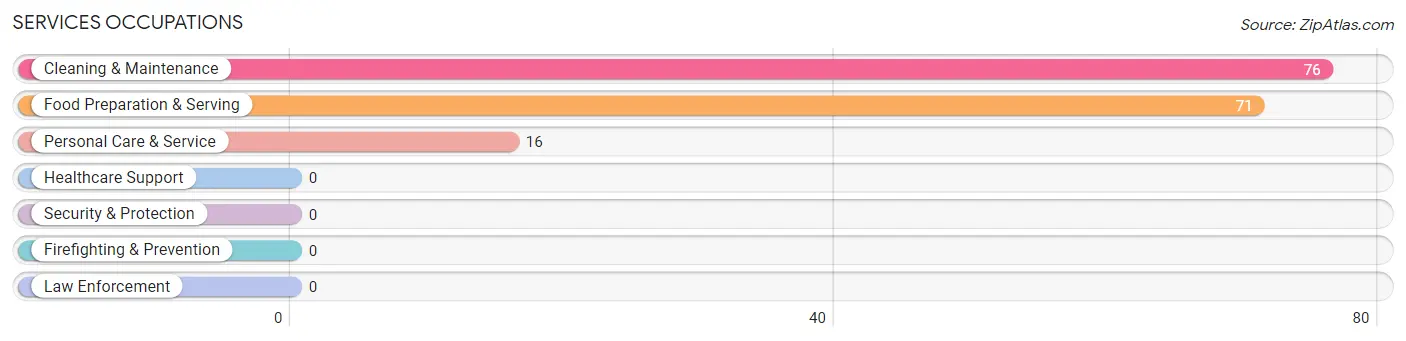
The most common Services occupations in Carrizo Springs are Cleaning & Maintenance (76 | 6.7%), Food Preparation & Serving (71 | 6.2%), and Personal Care & Service (16 | 1.4%).
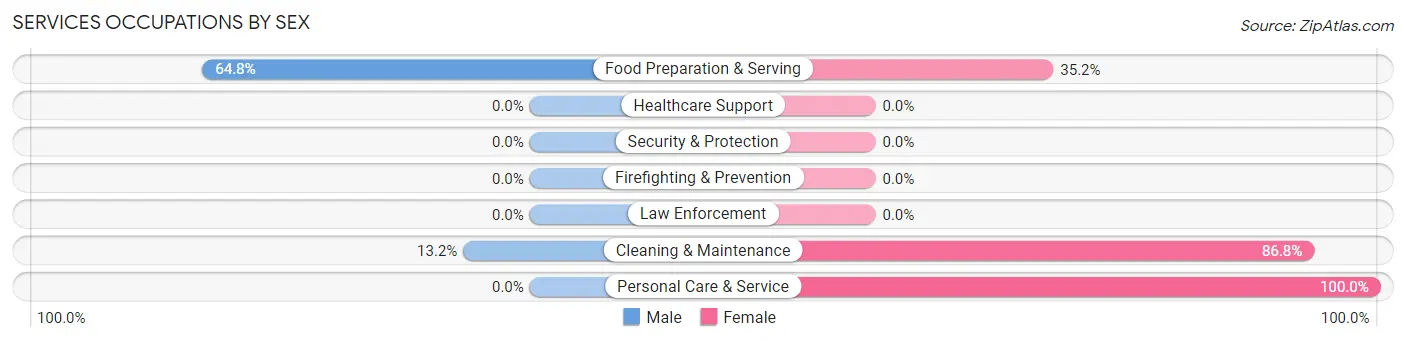
Services Occupations by Sex
Within the Services occupations in Carrizo Springs, the most male-oriented occupations are Food Preparation & Serving (64.8%), and Cleaning & Maintenance (13.2%), while the most female-oriented occupations are Personal Care & Service (100.0%), Cleaning & Maintenance (86.8%), and Food Preparation & Serving (35.2%).
| Occupation | Male | Female |
| Healthcare Support | 0 (0.0%) | 0 (0.0%) |
| Security & Protection | 0 (0.0%) | 0 (0.0%) |
| Firefighting & Prevention | 0 (0.0%) | 0 (0.0%) |
| Law Enforcement | 0 (0.0%) | 0 (0.0%) |
| Food Preparation & Serving | 46 (64.8%) | 25 (35.2%) |
| Cleaning & Maintenance | 10 (13.2%) | 66 (86.8%) |
| Personal Care & Service | 0 (0.0%) | 16 (100.0%) |
| Total (Category) | 56 (34.4%) | 107 (65.6%) |
| Total (Overall) | 762 (67.1%) | 374 (32.9%) |
Sales and Office Occupations
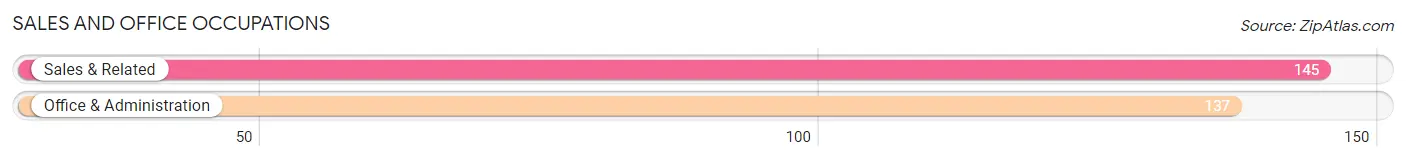
The most common Sales and Office occupations in Carrizo Springs are Sales & Related (145 | 12.8%), and Office & Administration (137 | 12.1%).
Sales and Office Occupations by Sex
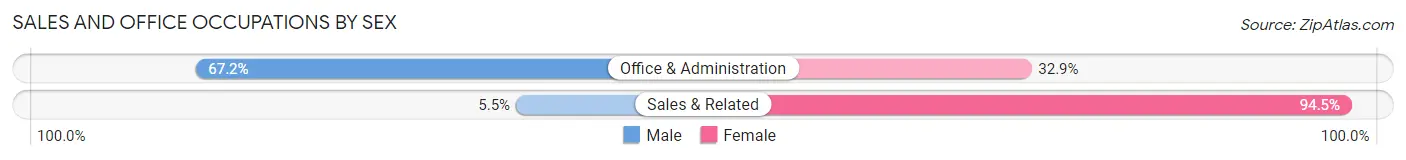
| Occupation | Male | Female |
| Sales & Related | 8 (5.5%) | 137 (94.5%) |
| Office & Administration | 92 (67.1%) | 45 (32.9%) |
| Total (Category) | 100 (35.5%) | 182 (64.5%) |
| Total (Overall) | 762 (67.1%) | 374 (32.9%) |
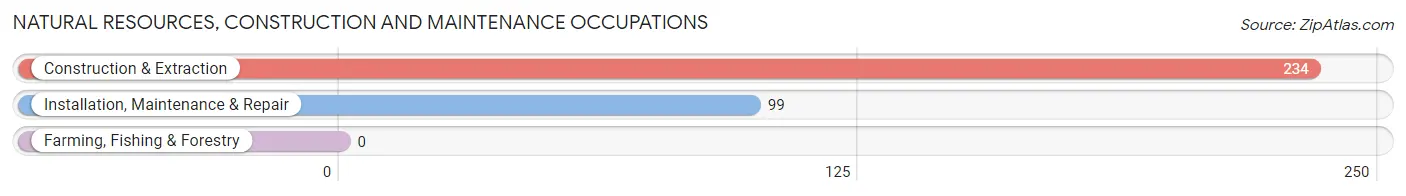
Natural Resources, Construction and Maintenance Occupations
The most common Natural Resources, Construction and Maintenance occupations in Carrizo Springs are Construction & Extraction (234 | 20.6%), and Installation, Maintenance & Repair (99 | 8.7%).
Natural Resources, Construction and Maintenance Occupations by Sex
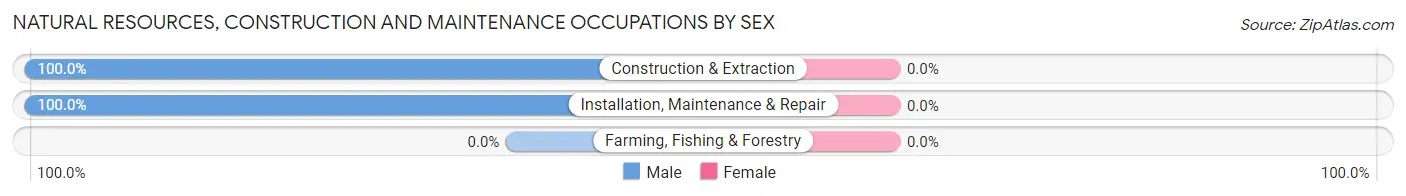
| Occupation | Male | Female |
| Farming, Fishing & Forestry | 0 (0.0%) | 0 (0.0%) |
| Construction & Extraction | 234 (100.0%) | 0 (0.0%) |
| Installation, Maintenance & Repair | 99 (100.0%) | 0 (0.0%) |
| Total (Category) | 333 (100.0%) | 0 (0.0%) |
| Total (Overall) | 762 (67.1%) | 374 (32.9%) |
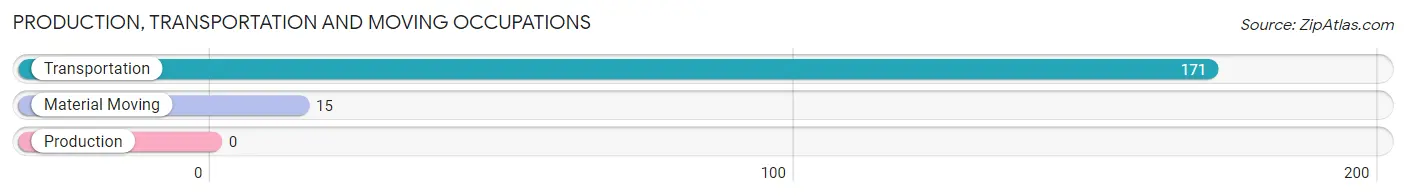
Production, Transportation and Moving Occupations
The most common Production, Transportation and Moving occupations in Carrizo Springs are Transportation (171 | 15.0%), and Material Moving (15 | 1.3%).
Production, Transportation and Moving Occupations by Sex
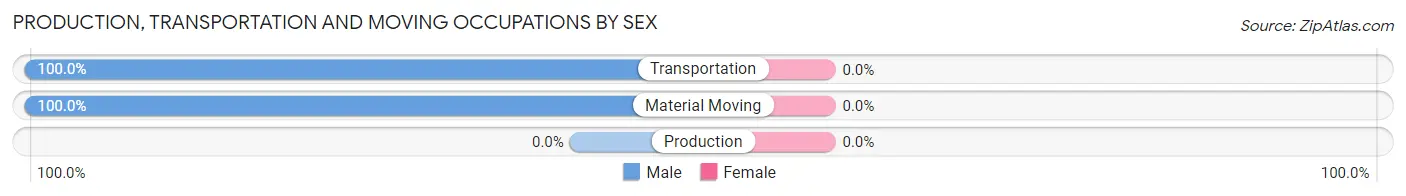
| Occupation | Male | Female |
| Production | 0 (0.0%) | 0 (0.0%) |
| Transportation | 171 (100.0%) | 0 (0.0%) |
| Material Moving | 15 (100.0%) | 0 (0.0%) |
| Total (Category) | 186 (100.0%) | 0 (0.0%) |
| Total (Overall) | 762 (67.1%) | 374 (32.9%) |
Employment Industries by Sex in Carrizo Springs
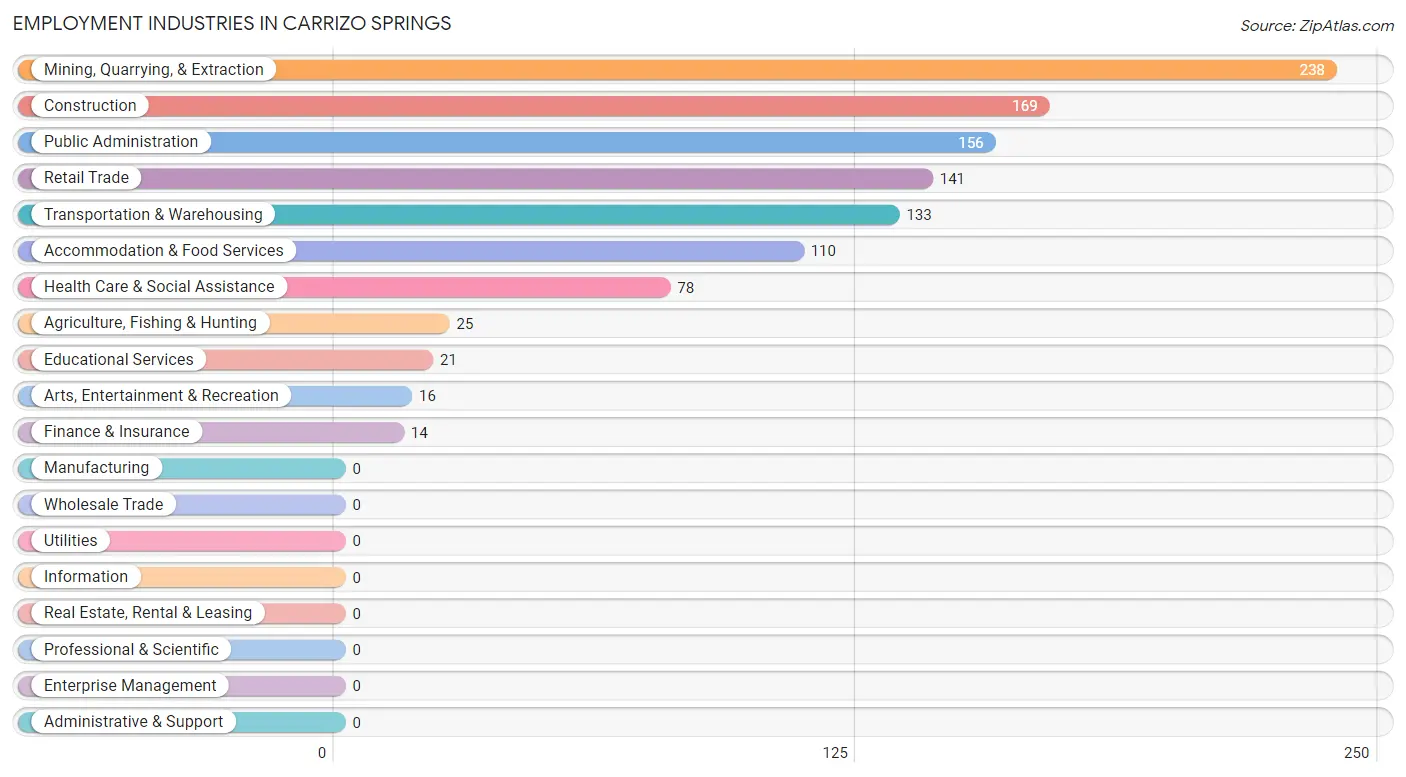
Employment Industries in Carrizo Springs
The major employment industries in Carrizo Springs include Mining, Quarrying, & Extraction (238 | 20.9%), Construction (169 | 14.9%), Public Administration (156 | 13.7%), Retail Trade (141 | 12.4%), and Transportation & Warehousing (133 | 11.7%).
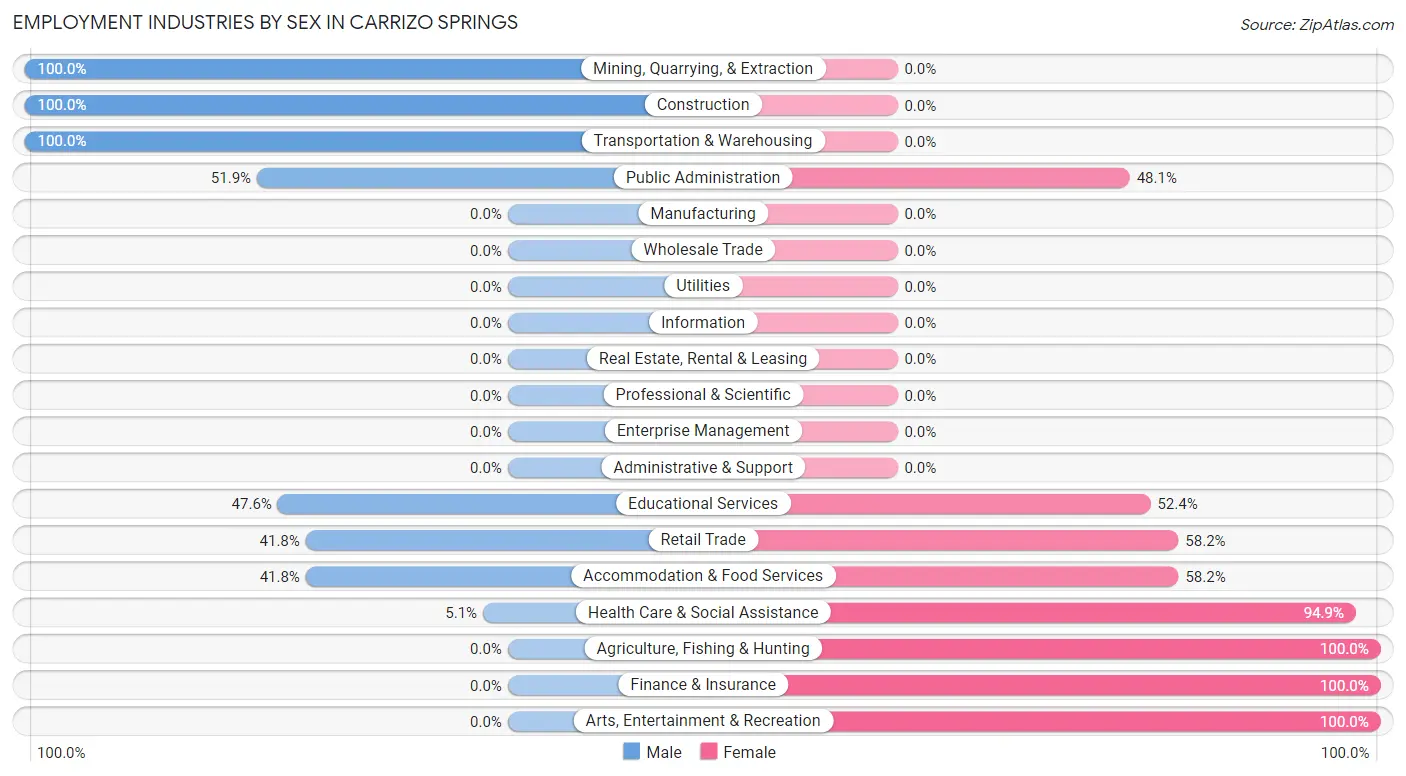
Employment Industries by Sex in Carrizo Springs
The Carrizo Springs industries that see more men than women are Mining, Quarrying, & Extraction (100.0%), Construction (100.0%), and Transportation & Warehousing (100.0%), whereas the industries that tend to have a higher number of women are Agriculture, Fishing & Hunting (100.0%), Finance & Insurance (100.0%), and Arts, Entertainment & Recreation (100.0%).
| Industry | Male | Female |
| Agriculture, Fishing & Hunting | 0 (0.0%) | 25 (100.0%) |
| Mining, Quarrying, & Extraction | 238 (100.0%) | 0 (0.0%) |
| Construction | 169 (100.0%) | 0 (0.0%) |
| Manufacturing | 0 (0.0%) | 0 (0.0%) |
| Wholesale Trade | 0 (0.0%) | 0 (0.0%) |
| Retail Trade | 59 (41.8%) | 82 (58.2%) |
| Transportation & Warehousing | 133 (100.0%) | 0 (0.0%) |
| Utilities | 0 (0.0%) | 0 (0.0%) |
| Information | 0 (0.0%) | 0 (0.0%) |
| Finance & Insurance | 0 (0.0%) | 14 (100.0%) |
| Real Estate, Rental & Leasing | 0 (0.0%) | 0 (0.0%) |
| Professional & Scientific | 0 (0.0%) | 0 (0.0%) |
| Enterprise Management | 0 (0.0%) | 0 (0.0%) |
| Administrative & Support | 0 (0.0%) | 0 (0.0%) |
| Educational Services | 10 (47.6%) | 11 (52.4%) |
| Health Care & Social Assistance | 4 (5.1%) | 74 (94.9%) |
| Arts, Entertainment & Recreation | 0 (0.0%) | 16 (100.0%) |
| Accommodation & Food Services | 46 (41.8%) | 64 (58.2%) |
| Public Administration | 81 (51.9%) | 75 (48.1%) |
| Total | 762 (67.1%) | 374 (32.9%) |
Education in Carrizo Springs
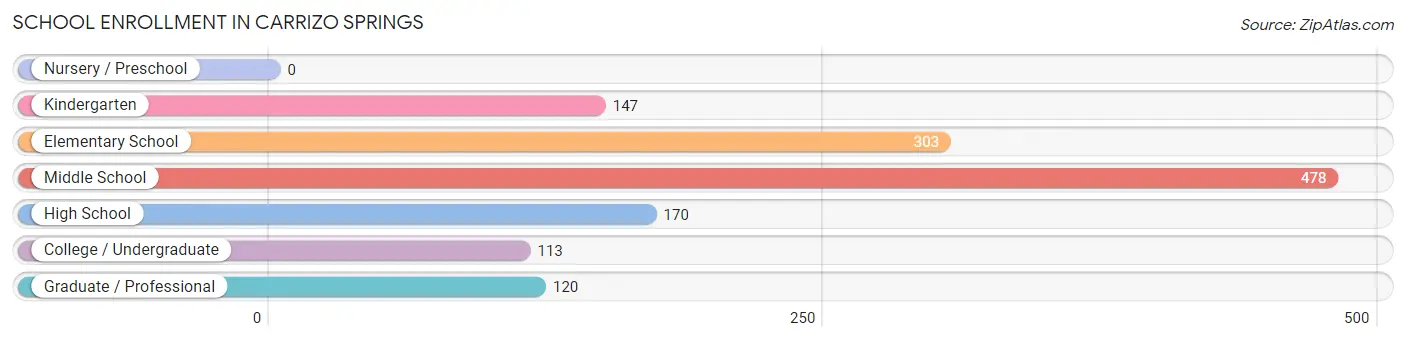
School Enrollment in Carrizo Springs
The most common levels of schooling among the 1,331 students in Carrizo Springs are middle school (478 | 35.9%), elementary school (303 | 22.8%), and high school (170 | 12.8%).
| School Level | # Students | % Students |
| Nursery / Preschool | 0 | 0.0% |
| Kindergarten | 147 | 11.0% |
| Elementary School | 303 | 22.8% |
| Middle School | 478 | 35.9% |
| High School | 170 | 12.8% |
| College / Undergraduate | 113 | 8.5% |
| Graduate / Professional | 120 | 9.0% |
| Total | 1,331 | 100.0% |
School Enrollment by Age by Funding Source in Carrizo Springs
Out of a total of 1,331 students who are enrolled in schools in Carrizo Springs, 44 (3.3%) attend a private institution, while the remaining 1,287 (96.7%) are enrolled in public schools. The age group of 35 years and over has the highest likelihood of being enrolled in private schools, with 15 (7.3% in the age bracket) enrolled. Conversely, the age group of 5 to 9 year old has the lowest likelihood of being enrolled in a private school, with 438 (100.0% in the age bracket) attending a public institution.
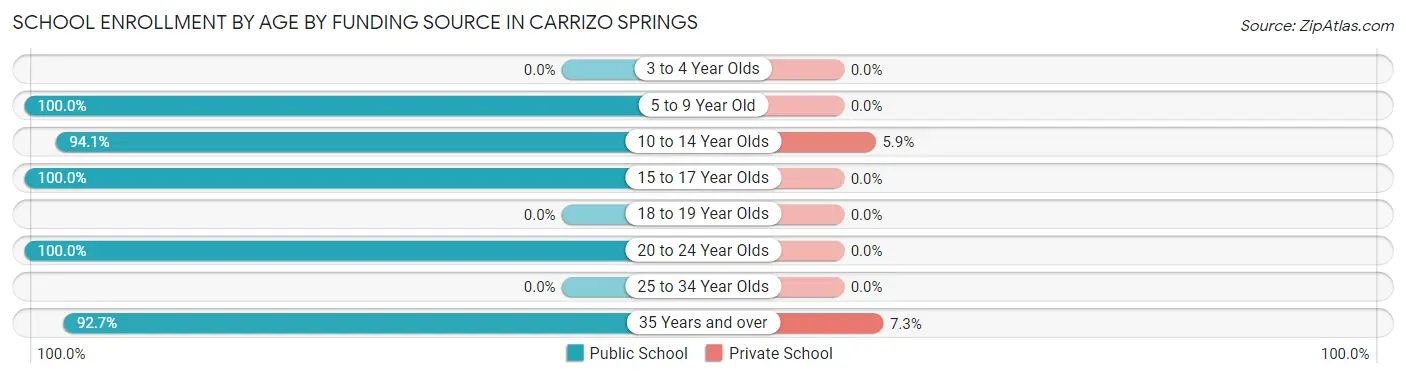
| Age Bracket | Public School | Private School |
| 3 to 4 Year Olds | 0 (0.0%) | 0 (0.0%) |
| 5 to 9 Year Old | 438 (100.0%) | 0 (0.0%) |
| 10 to 14 Year Olds | 461 (94.1%) | 29 (5.9%) |
| 15 to 17 Year Olds | 170 (100.0%) | 0 (0.0%) |
| 18 to 19 Year Olds | 0 (0.0%) | 0 (0.0%) |
| 20 to 24 Year Olds | 28 (100.0%) | 0 (0.0%) |
| 25 to 34 Year Olds | 0 (0.0%) | 0 (0.0%) |
| 35 Years and over | 190 (92.7%) | 15 (7.3%) |
| Total | 1,287 (96.7%) | 44 (3.3%) |
Educational Attainment by Field of Study in Carrizo Springs
Physical & health sciences (124 | 40.0%), psychology (53 | 17.1%), education (34 | 11.0%), science & technology (26 | 8.4%), and liberal arts & history (22 | 7.1%) are the most common fields of study among 310 individuals in Carrizo Springs who have obtained a bachelor's degree or higher.
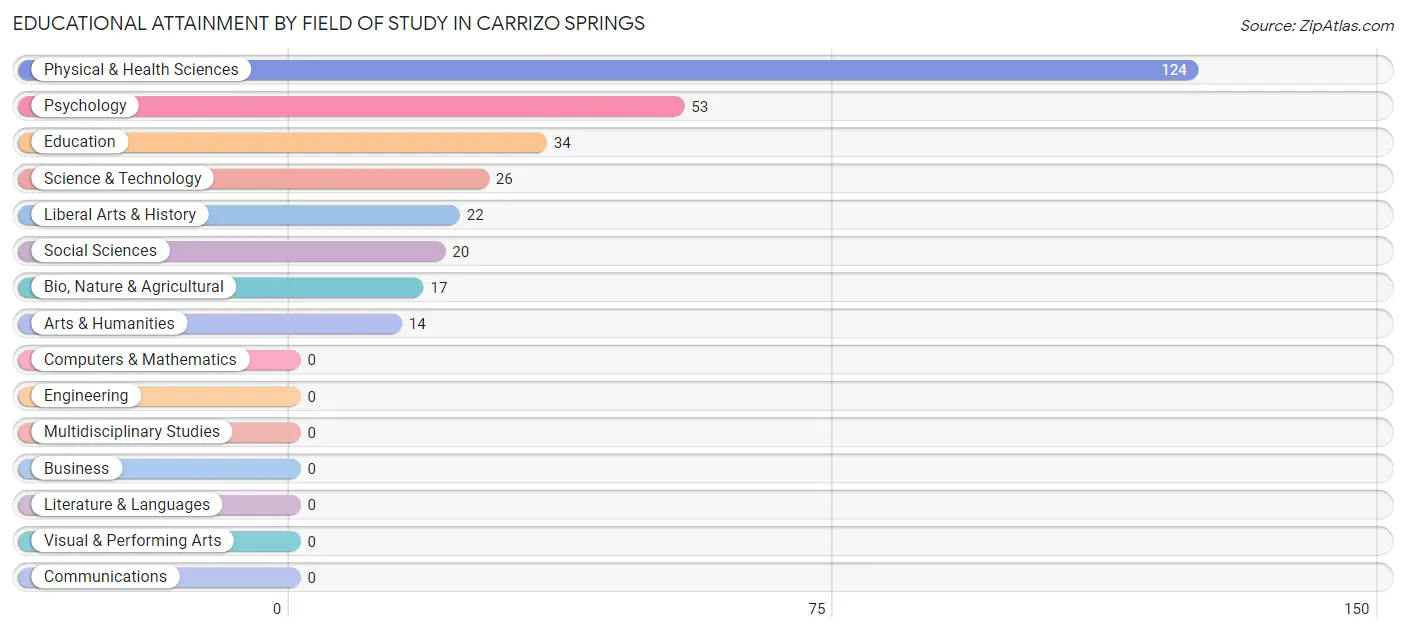
| Field of Study | # Graduates | % Graduates |
| Computers & Mathematics | 0 | 0.0% |
| Bio, Nature & Agricultural | 17 | 5.5% |
| Physical & Health Sciences | 124 | 40.0% |
| Psychology | 53 | 17.1% |
| Social Sciences | 20 | 6.5% |
| Engineering | 0 | 0.0% |
| Multidisciplinary Studies | 0 | 0.0% |
| Science & Technology | 26 | 8.4% |
| Business | 0 | 0.0% |
| Education | 34 | 11.0% |
| Literature & Languages | 0 | 0.0% |
| Liberal Arts & History | 22 | 7.1% |
| Visual & Performing Arts | 0 | 0.0% |
| Communications | 0 | 0.0% |
| Arts & Humanities | 14 | 4.5% |
| Total | 310 | 100.0% |
Transportation & Commute in Carrizo Springs
Vehicle Availability by Sex in Carrizo Springs
The most prevalent vehicle ownership categories in Carrizo Springs are males with 2 vehicles (475, accounting for 62.3%) and females with 2 vehicles (144, making up 127.0%).
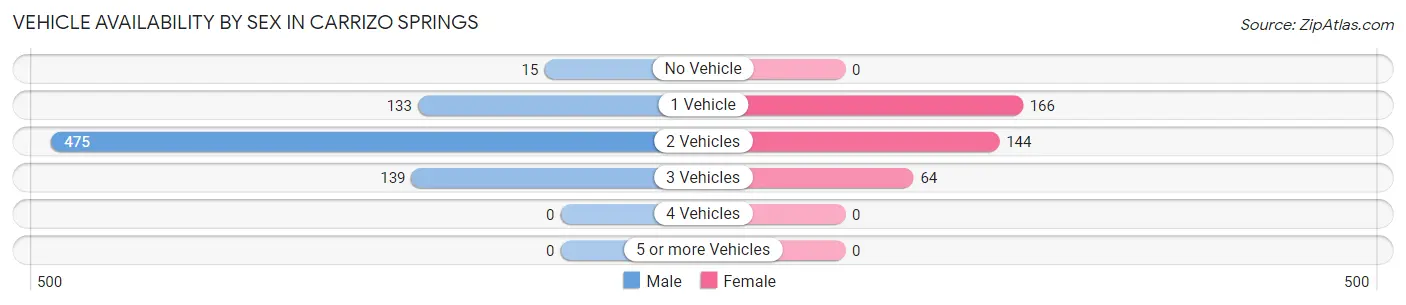
| Vehicles Available | Male | Female |
| No Vehicle | 15 (2.0%) | 0 (0.0%) |
| 1 Vehicle | 133 (17.4%) | 166 (44.4%) |
| 2 Vehicles | 475 (62.3%) | 144 (38.5%) |
| 3 Vehicles | 139 (18.2%) | 64 (17.1%) |
| 4 Vehicles | 0 (0.0%) | 0 (0.0%) |
| 5 or more Vehicles | 0 (0.0%) | 0 (0.0%) |
| Total | 762 (100.0%) | 374 (100.0%) |
Commute Time in Carrizo Springs
The most frequently occuring commute durations in Carrizo Springs are 15 to 19 minutes (226 commuters, 20.6%), 5 to 9 minutes (209 commuters, 19.0%), and 30 to 34 minutes (183 commuters, 16.7%).
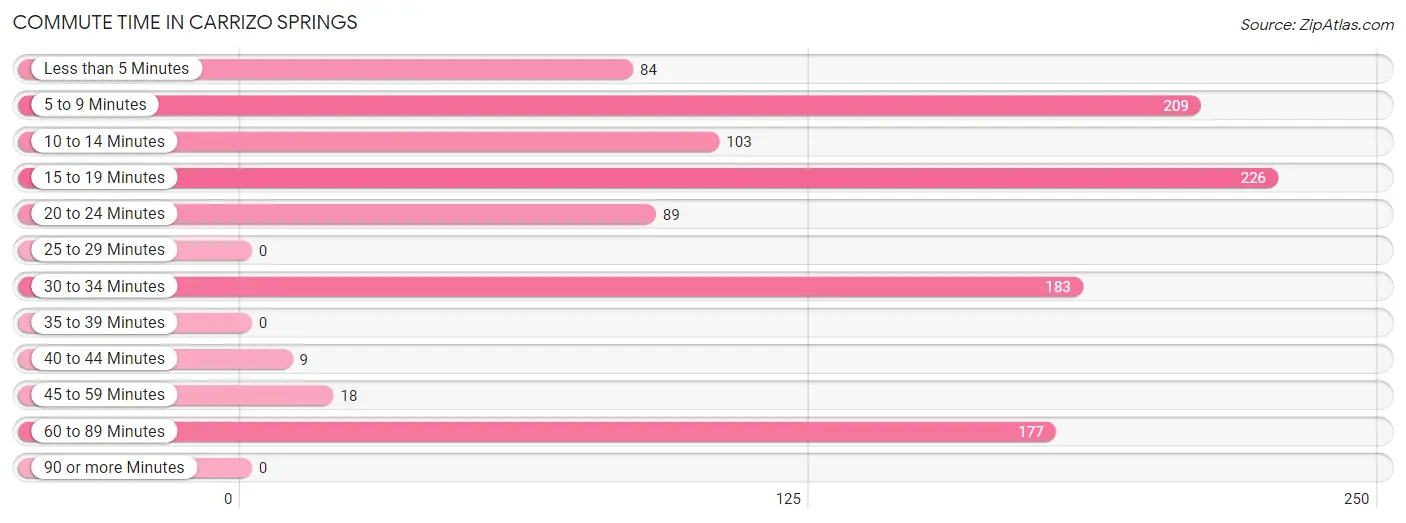
| Commute Time | # Commuters | % Commuters |
| Less than 5 Minutes | 84 | 7.6% |
| 5 to 9 Minutes | 209 | 19.0% |
| 10 to 14 Minutes | 103 | 9.4% |
| 15 to 19 Minutes | 226 | 20.6% |
| 20 to 24 Minutes | 89 | 8.1% |
| 25 to 29 Minutes | 0 | 0.0% |
| 30 to 34 Minutes | 183 | 16.7% |
| 35 to 39 Minutes | 0 | 0.0% |
| 40 to 44 Minutes | 9 | 0.8% |
| 45 to 59 Minutes | 18 | 1.6% |
| 60 to 89 Minutes | 177 | 16.1% |
| 90 or more Minutes | 0 | 0.0% |
Commute Time by Sex in Carrizo Springs
The most common commute times in Carrizo Springs are 60 to 89 minutes (177 commuters, 23.9%) for males and 15 to 19 minutes (211 commuters, 58.9%) for females.
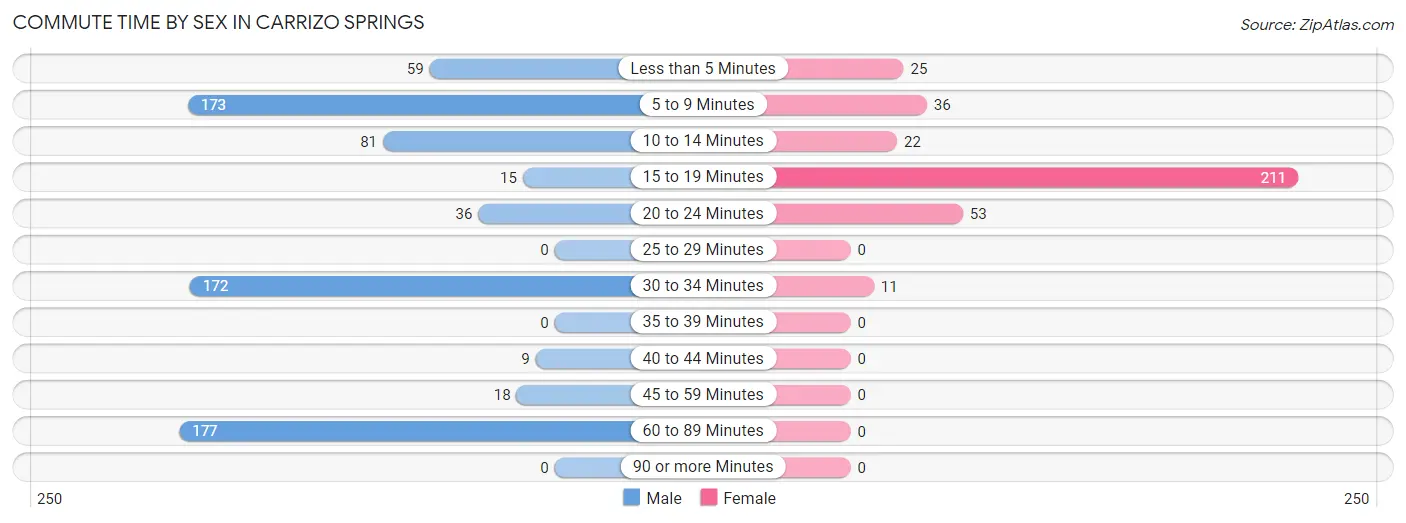
| Commute Time | Male | Female |
| Less than 5 Minutes | 59 (8.0%) | 25 (7.0%) |
| 5 to 9 Minutes | 173 (23.4%) | 36 (10.1%) |
| 10 to 14 Minutes | 81 (11.0%) | 22 (6.1%) |
| 15 to 19 Minutes | 15 (2.0%) | 211 (58.9%) |
| 20 to 24 Minutes | 36 (4.9%) | 53 (14.8%) |
| 25 to 29 Minutes | 0 (0.0%) | 0 (0.0%) |
| 30 to 34 Minutes | 172 (23.2%) | 11 (3.1%) |
| 35 to 39 Minutes | 0 (0.0%) | 0 (0.0%) |
| 40 to 44 Minutes | 9 (1.2%) | 0 (0.0%) |
| 45 to 59 Minutes | 18 (2.4%) | 0 (0.0%) |
| 60 to 89 Minutes | 177 (23.9%) | 0 (0.0%) |
| 90 or more Minutes | 0 (0.0%) | 0 (0.0%) |
Time of Departure to Work by Sex in Carrizo Springs
The most frequent times of departure to work in Carrizo Springs are 6:00 AM to 6:29 AM (265, 35.8%) for males and 7:00 AM to 7:29 AM (165, 46.1%) for females.
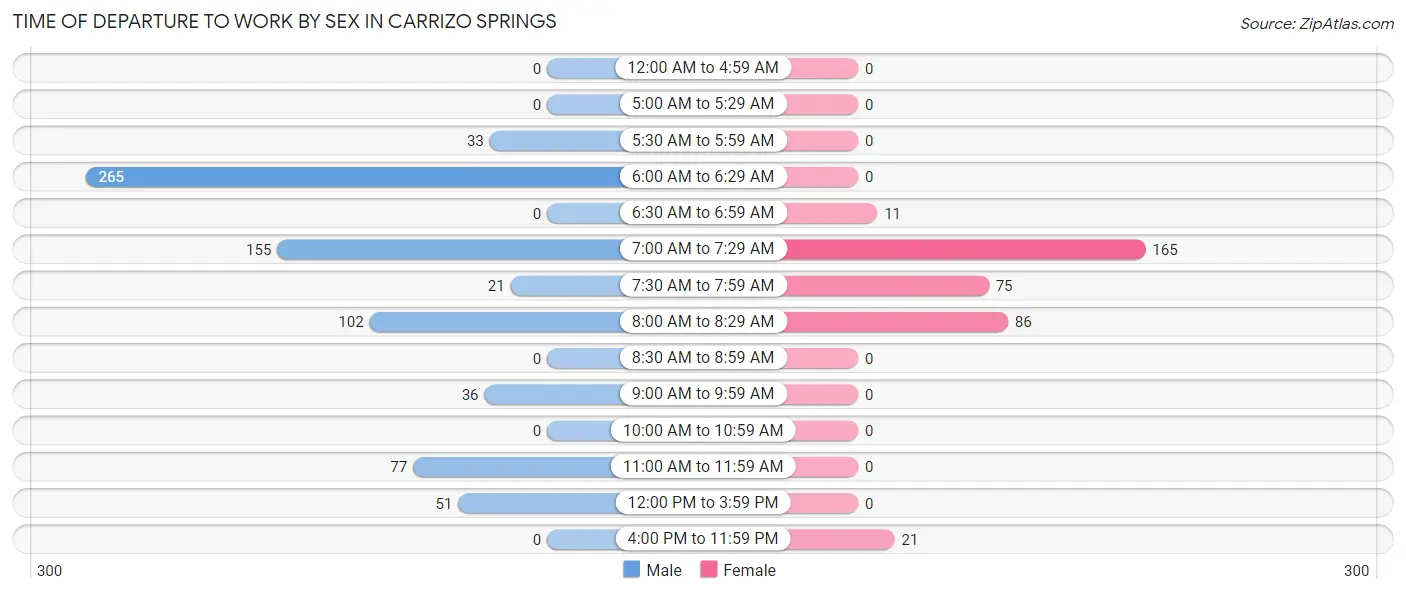
| Time of Departure | Male | Female |
| 12:00 AM to 4:59 AM | 0 (0.0%) | 0 (0.0%) |
| 5:00 AM to 5:29 AM | 0 (0.0%) | 0 (0.0%) |
| 5:30 AM to 5:59 AM | 33 (4.5%) | 0 (0.0%) |
| 6:00 AM to 6:29 AM | 265 (35.8%) | 0 (0.0%) |
| 6:30 AM to 6:59 AM | 0 (0.0%) | 11 (3.1%) |
| 7:00 AM to 7:29 AM | 155 (20.9%) | 165 (46.1%) |
| 7:30 AM to 7:59 AM | 21 (2.8%) | 75 (20.9%) |
| 8:00 AM to 8:29 AM | 102 (13.8%) | 86 (24.0%) |
| 8:30 AM to 8:59 AM | 0 (0.0%) | 0 (0.0%) |
| 9:00 AM to 9:59 AM | 36 (4.9%) | 0 (0.0%) |
| 10:00 AM to 10:59 AM | 0 (0.0%) | 0 (0.0%) |
| 11:00 AM to 11:59 AM | 77 (10.4%) | 0 (0.0%) |
| 12:00 PM to 3:59 PM | 51 (6.9%) | 0 (0.0%) |
| 4:00 PM to 11:59 PM | 0 (0.0%) | 21 (5.9%) |
| Total | 740 (100.0%) | 358 (100.0%) |
Housing Occupancy in Carrizo Springs
Occupancy by Ownership in Carrizo Springs
Of the total 1,634 dwellings in Carrizo Springs, owner-occupied units account for 978 (59.9%), while renter-occupied units make up 656 (40.2%).
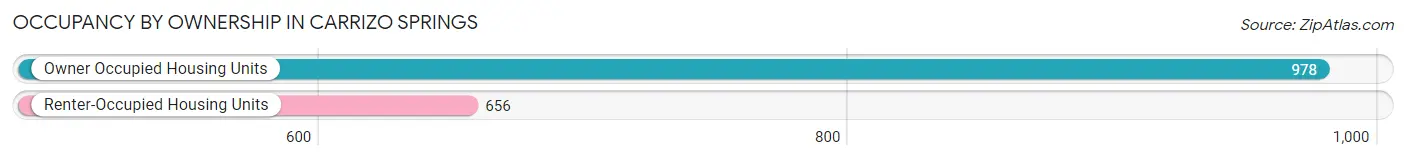
| Occupancy | # Housing Units | % Housing Units |
| Owner Occupied Housing Units | 978 | 59.9% |
| Renter-Occupied Housing Units | 656 | 40.2% |
| Total Occupied Housing Units | 1,634 | 100.0% |
Occupancy by Household Size in Carrizo Springs
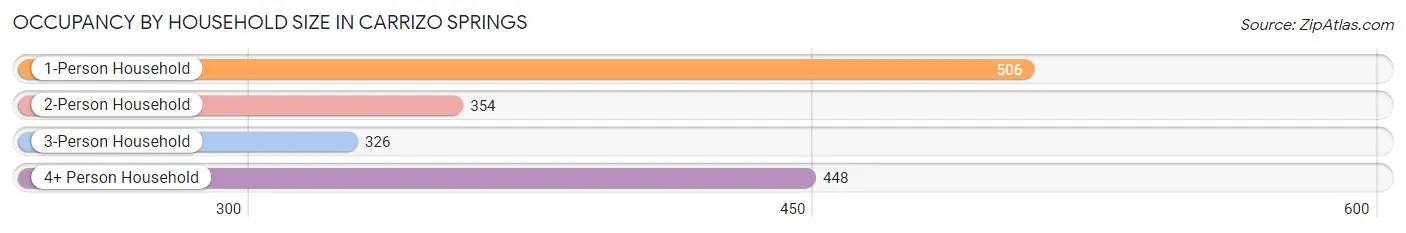
| Household Size | # Housing Units | % Housing Units |
| 1-Person Household | 506 | 31.0% |
| 2-Person Household | 354 | 21.7% |
| 3-Person Household | 326 | 20.0% |
| 4+ Person Household | 448 | 27.4% |
| Total Housing Units | 1,634 | 100.0% |
Occupancy by Ownership by Household Size in Carrizo Springs
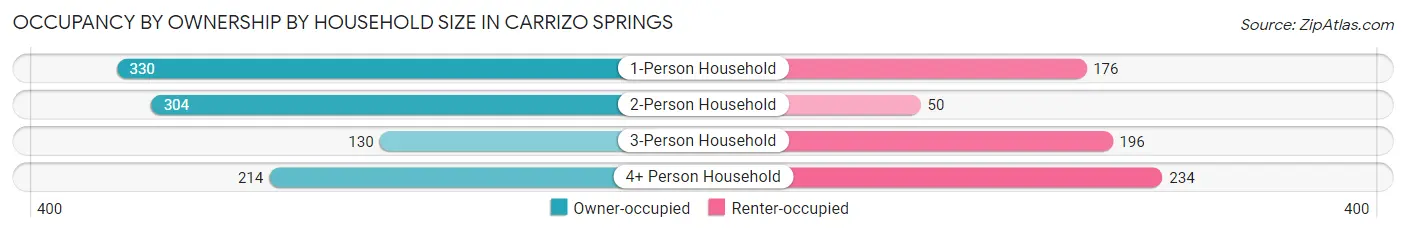
| Household Size | Owner-occupied | Renter-occupied |
| 1-Person Household | 330 (65.2%) | 176 (34.8%) |
| 2-Person Household | 304 (85.9%) | 50 (14.1%) |
| 3-Person Household | 130 (39.9%) | 196 (60.1%) |
| 4+ Person Household | 214 (47.8%) | 234 (52.2%) |
| Total Housing Units | 978 (59.9%) | 656 (40.2%) |
Occupancy by Educational Attainment in Carrizo Springs
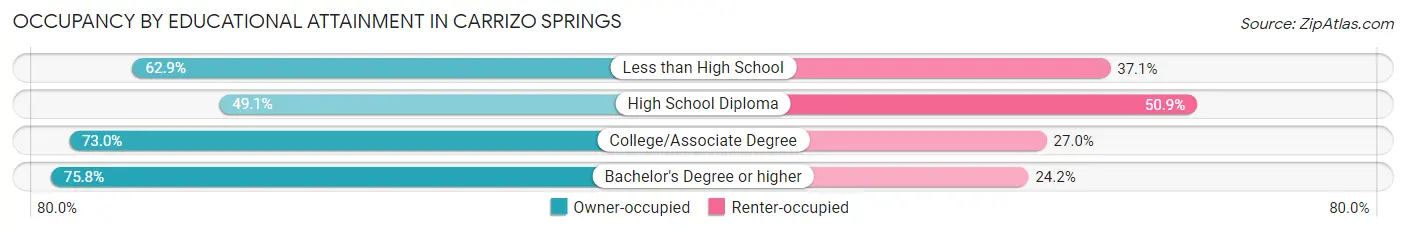
| Household Size | Owner-occupied | Renter-occupied |
| Less than High School | 286 (62.9%) | 169 (37.1%) |
| High School Diploma | 355 (49.1%) | 368 (50.9%) |
| College/Associate Degree | 224 (73.0%) | 83 (27.0%) |
| Bachelor's Degree or higher | 113 (75.8%) | 36 (24.2%) |
Occupancy by Age of Householder in Carrizo Springs
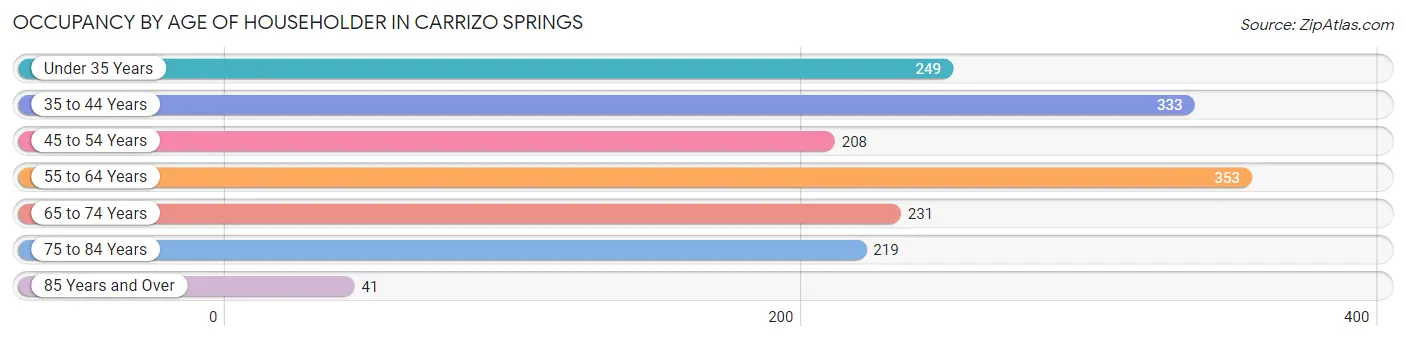
| Age Bracket | # Households | % Households |
| Under 35 Years | 249 | 15.2% |
| 35 to 44 Years | 333 | 20.4% |
| 45 to 54 Years | 208 | 12.7% |
| 55 to 64 Years | 353 | 21.6% |
| 65 to 74 Years | 231 | 14.1% |
| 75 to 84 Years | 219 | 13.4% |
| 85 Years and Over | 41 | 2.5% |
| Total | 1,634 | 100.0% |
Housing Finances in Carrizo Springs
Median Income by Occupancy in Carrizo Springs
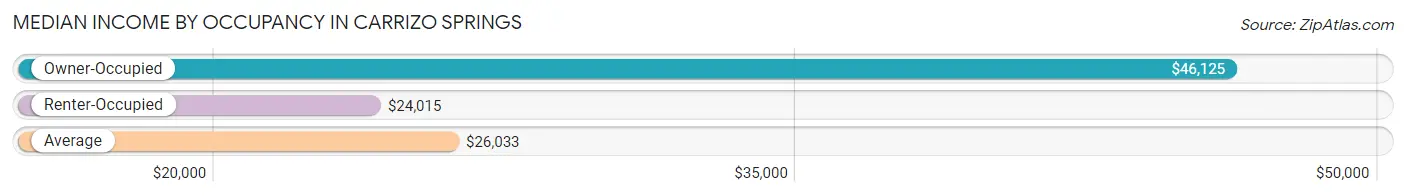
| Occupancy Type | # Households | Median Income |
| Owner-Occupied | 978 (59.9%) | $46,125 |
| Renter-Occupied | 656 (40.2%) | $24,015 |
| Average | 1,634 (100.0%) | $26,033 |
Occupancy by Householder Income Bracket in Carrizo Springs
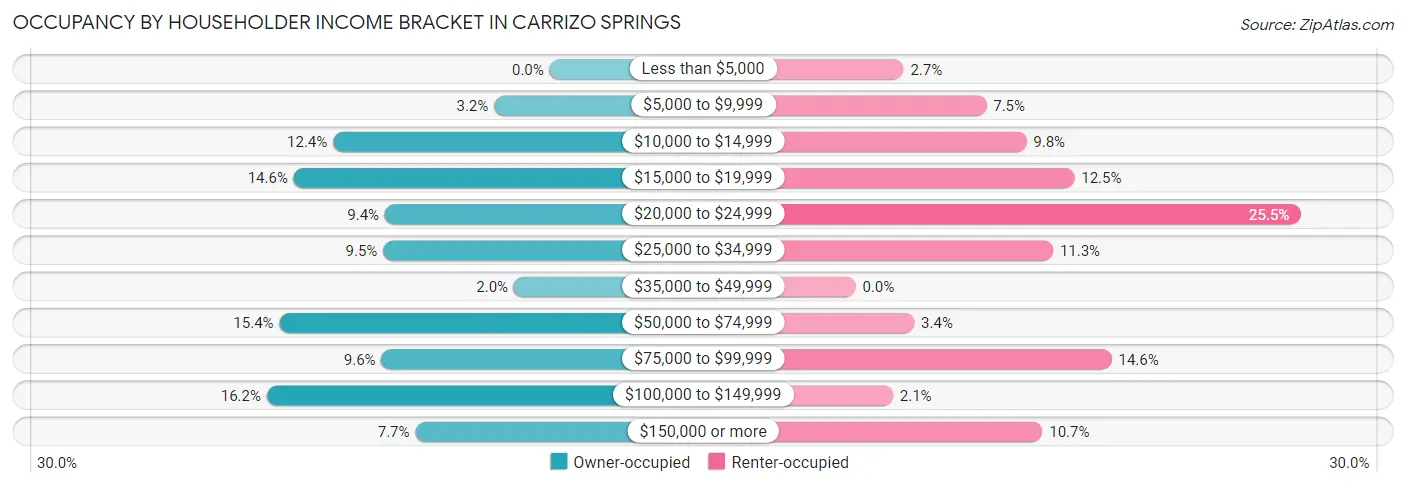
| Income Bracket | Owner-occupied | Renter-occupied |
| Less than $5,000 | 0 (0.0%) | 18 (2.7%) |
| $5,000 to $9,999 | 31 (3.2%) | 49 (7.5%) |
| $10,000 to $14,999 | 121 (12.4%) | 64 (9.8%) |
| $15,000 to $19,999 | 143 (14.6%) | 82 (12.5%) |
| $20,000 to $24,999 | 92 (9.4%) | 167 (25.5%) |
| $25,000 to $34,999 | 93 (9.5%) | 74 (11.3%) |
| $35,000 to $49,999 | 20 (2.0%) | 0 (0.0%) |
| $50,000 to $74,999 | 151 (15.4%) | 22 (3.4%) |
| $75,000 to $99,999 | 94 (9.6%) | 96 (14.6%) |
| $100,000 to $149,999 | 158 (16.2%) | 14 (2.1%) |
| $150,000 or more | 75 (7.7%) | 70 (10.7%) |
| Total | 978 (100.0%) | 656 (100.0%) |
Monthly Housing Cost Tiers in Carrizo Springs
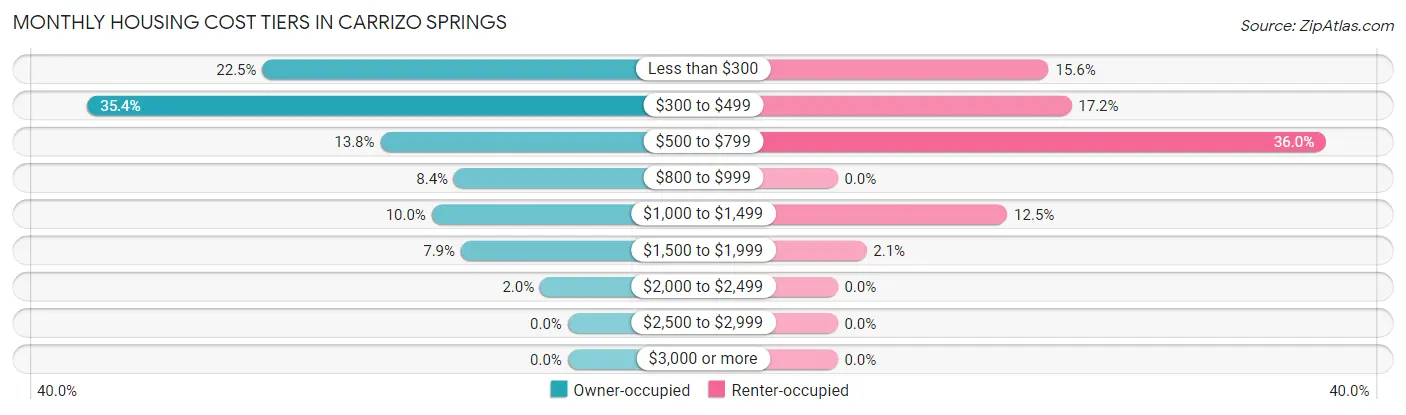
| Monthly Cost | Owner-occupied | Renter-occupied |
| Less than $300 | 220 (22.5%) | 102 (15.5%) |
| $300 to $499 | 346 (35.4%) | 113 (17.2%) |
| $500 to $799 | 135 (13.8%) | 236 (36.0%) |
| $800 to $999 | 82 (8.4%) | 0 (0.0%) |
| $1,000 to $1,499 | 98 (10.0%) | 82 (12.5%) |
| $1,500 to $1,999 | 77 (7.9%) | 14 (2.1%) |
| $2,000 to $2,499 | 20 (2.0%) | 0 (0.0%) |
| $2,500 to $2,999 | 0 (0.0%) | 0 (0.0%) |
| $3,000 or more | 0 (0.0%) | 0 (0.0%) |
| Total | 978 (100.0%) | 656 (100.0%) |
Physical Housing Characteristics in Carrizo Springs
Housing Structures in Carrizo Springs
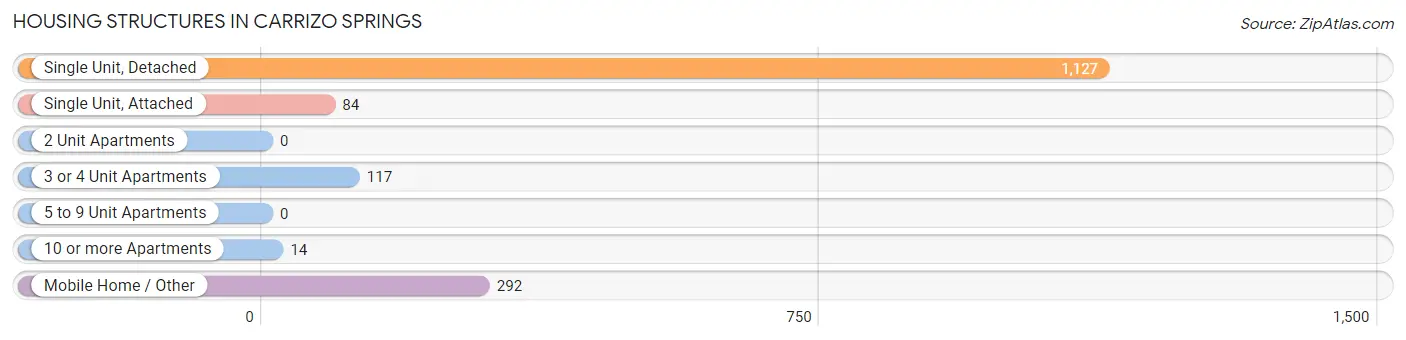
| Structure Type | # Housing Units | % Housing Units |
| Single Unit, Detached | 1,127 | 69.0% |
| Single Unit, Attached | 84 | 5.1% |
| 2 Unit Apartments | 0 | 0.0% |
| 3 or 4 Unit Apartments | 117 | 7.2% |
| 5 to 9 Unit Apartments | 0 | 0.0% |
| 10 or more Apartments | 14 | 0.9% |
| Mobile Home / Other | 292 | 17.9% |
| Total | 1,634 | 100.0% |
Housing Structures by Occupancy in Carrizo Springs
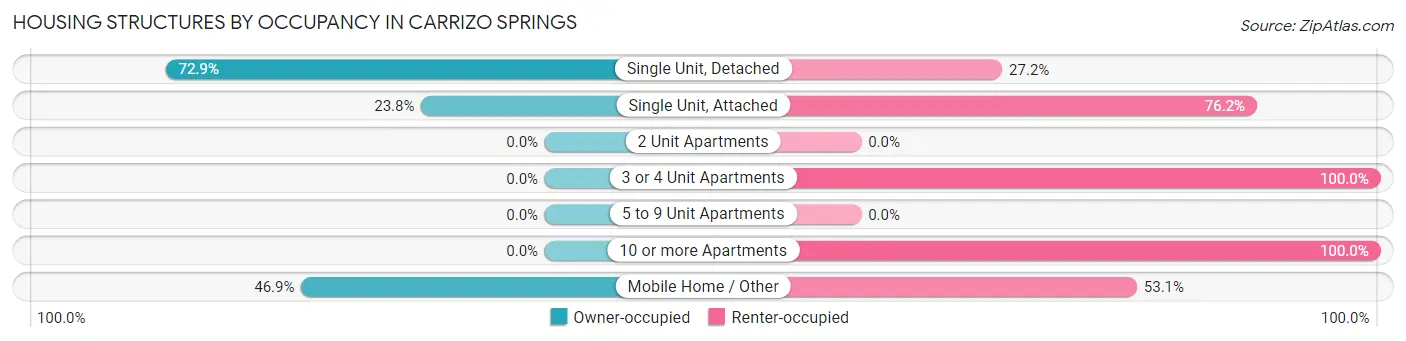
| Structure Type | Owner-occupied | Renter-occupied |
| Single Unit, Detached | 821 (72.9%) | 306 (27.2%) |
| Single Unit, Attached | 20 (23.8%) | 64 (76.2%) |
| 2 Unit Apartments | 0 (0.0%) | 0 (0.0%) |
| 3 or 4 Unit Apartments | 0 (0.0%) | 117 (100.0%) |
| 5 to 9 Unit Apartments | 0 (0.0%) | 0 (0.0%) |
| 10 or more Apartments | 0 (0.0%) | 14 (100.0%) |
| Mobile Home / Other | 137 (46.9%) | 155 (53.1%) |
| Total | 978 (59.9%) | 656 (40.2%) |
Housing Structures by Number of Rooms in Carrizo Springs
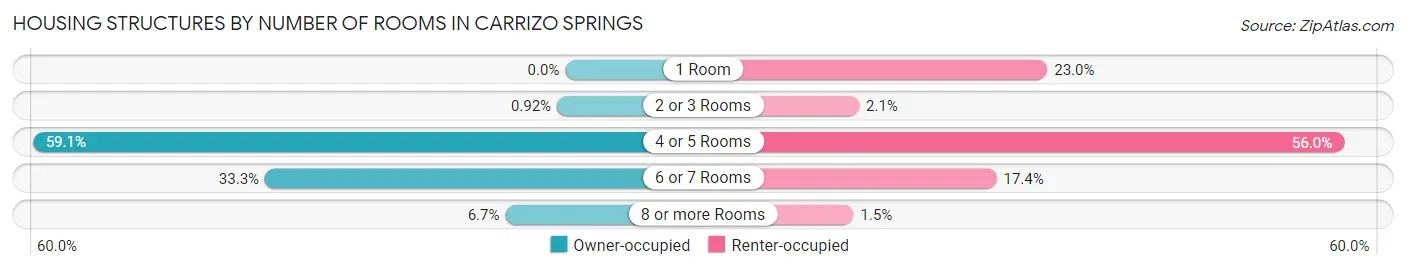
| Number of Rooms | Owner-occupied | Renter-occupied |
| 1 Room | 0 (0.0%) | 151 (23.0%) |
| 2 or 3 Rooms | 9 (0.9%) | 14 (2.1%) |
| 4 or 5 Rooms | 578 (59.1%) | 367 (55.9%) |
| 6 or 7 Rooms | 326 (33.3%) | 114 (17.4%) |
| 8 or more Rooms | 65 (6.7%) | 10 (1.5%) |
| Total | 978 (100.0%) | 656 (100.0%) |
Housing Structure by Heating Type in Carrizo Springs
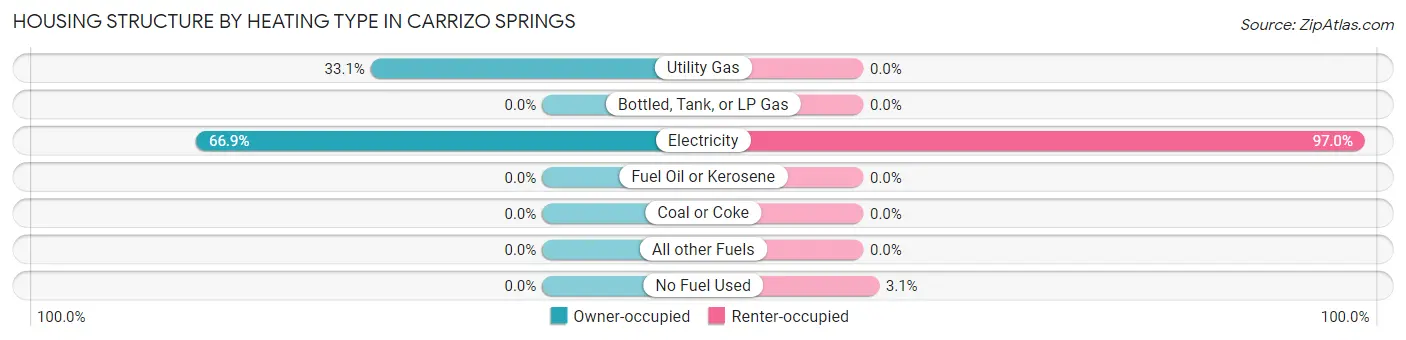
| Heating Type | Owner-occupied | Renter-occupied |
| Utility Gas | 324 (33.1%) | 0 (0.0%) |
| Bottled, Tank, or LP Gas | 0 (0.0%) | 0 (0.0%) |
| Electricity | 654 (66.9%) | 636 (97.0%) |
| Fuel Oil or Kerosene | 0 (0.0%) | 0 (0.0%) |
| Coal or Coke | 0 (0.0%) | 0 (0.0%) |
| All other Fuels | 0 (0.0%) | 0 (0.0%) |
| No Fuel Used | 0 (0.0%) | 20 (3.0%) |
| Total | 978 (100.0%) | 656 (100.0%) |
Household Vehicle Usage in Carrizo Springs
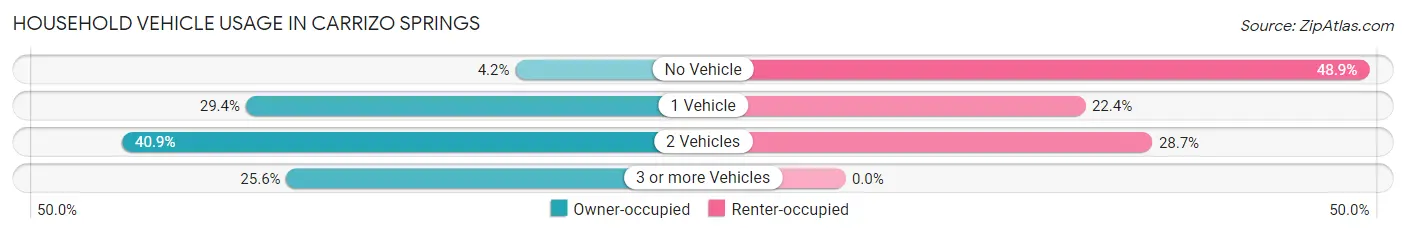
| Vehicles per Household | Owner-occupied | Renter-occupied |
| No Vehicle | 41 (4.2%) | 321 (48.9%) |
| 1 Vehicle | 287 (29.3%) | 147 (22.4%) |
| 2 Vehicles | 400 (40.9%) | 188 (28.7%) |
| 3 or more Vehicles | 250 (25.6%) | 0 (0.0%) |
| Total | 978 (100.0%) | 656 (100.0%) |
Real Estate & Mortgages in Carrizo Springs
Real Estate and Mortgage Overview in Carrizo Springs
| Characteristic | Without Mortgage | With Mortgage |
| Housing Units | 743 | 235 |
| Median Property Value | $47,400 | $116,300 |
| Median Household Income | - | - |
| Monthly Housing Costs | $406 | $0 |
| Real Estate Taxes | $740 | $0 |
Property Value by Mortgage Status in Carrizo Springs
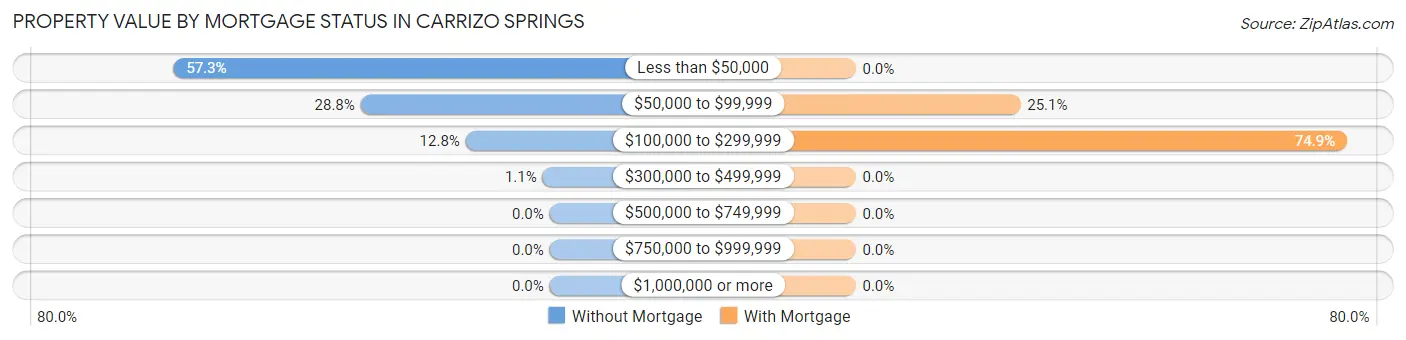
| Property Value | Without Mortgage | With Mortgage |
| Less than $50,000 | 426 (57.3%) | 0 (0.0%) |
| $50,000 to $99,999 | 214 (28.8%) | 59 (25.1%) |
| $100,000 to $299,999 | 95 (12.8%) | 176 (74.9%) |
| $300,000 to $499,999 | 8 (1.1%) | 0 (0.0%) |
| $500,000 to $749,999 | 0 (0.0%) | 0 (0.0%) |
| $750,000 to $999,999 | 0 (0.0%) | 0 (0.0%) |
| $1,000,000 or more | 0 (0.0%) | 0 (0.0%) |
| Total | 743 (100.0%) | 235 (100.0%) |
Household Income by Mortgage Status in Carrizo Springs
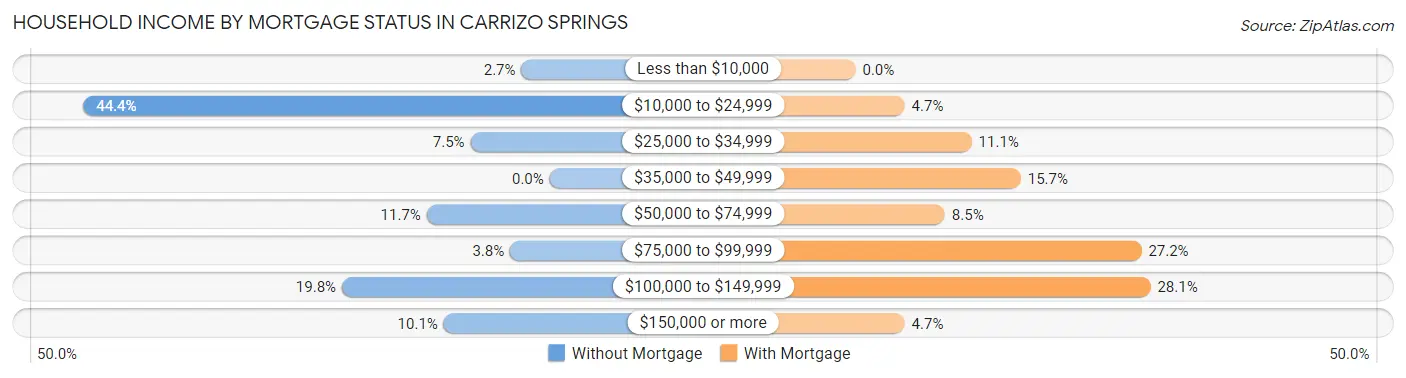
| Household Income | Without Mortgage | With Mortgage |
| Less than $10,000 | 20 (2.7%) | 0 (0.0%) |
| $10,000 to $24,999 | 330 (44.4%) | 11 (4.7%) |
| $25,000 to $34,999 | 56 (7.5%) | 26 (11.1%) |
| $35,000 to $49,999 | 0 (0.0%) | 37 (15.7%) |
| $50,000 to $74,999 | 87 (11.7%) | 20 (8.5%) |
| $75,000 to $99,999 | 28 (3.8%) | 64 (27.2%) |
| $100,000 to $149,999 | 147 (19.8%) | 66 (28.1%) |
| $150,000 or more | 75 (10.1%) | 11 (4.7%) |
| Total | 743 (100.0%) | 235 (100.0%) |
Property Value to Household Income Ratio in Carrizo Springs
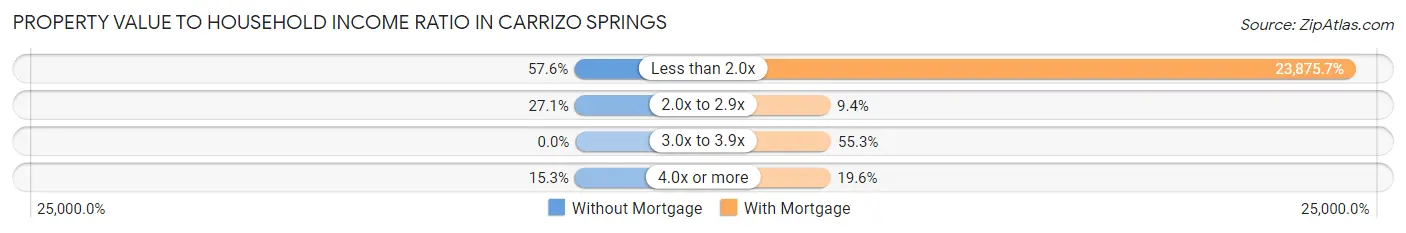
| Value-to-Income Ratio | Without Mortgage | With Mortgage |
| Less than 2.0x | 428 (57.6%) | 56,108 (23,875.7%) |
| 2.0x to 2.9x | 201 (27.1%) | 22 (9.4%) |
| 3.0x to 3.9x | 0 (0.0%) | 130 (55.3%) |
| 4.0x or more | 114 (15.3%) | 46 (19.6%) |
| Total | 743 (100.0%) | 235 (100.0%) |
Real Estate Taxes by Mortgage Status in Carrizo Springs
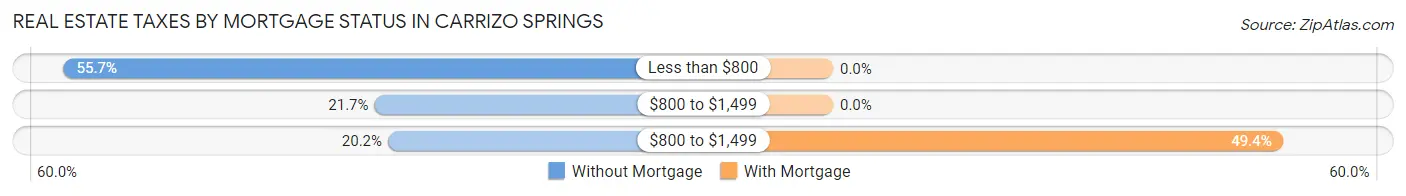
| Property Taxes | Without Mortgage | With Mortgage |
| Less than $800 | 414 (55.7%) | 0 (0.0%) |
| $800 to $1,499 | 161 (21.7%) | 0 (0.0%) |
| $800 to $1,499 | 150 (20.2%) | 116 (49.4%) |
| Total | 743 (100.0%) | 235 (100.0%) |
Health & Disability in Carrizo Springs
Health Insurance Coverage by Age in Carrizo Springs
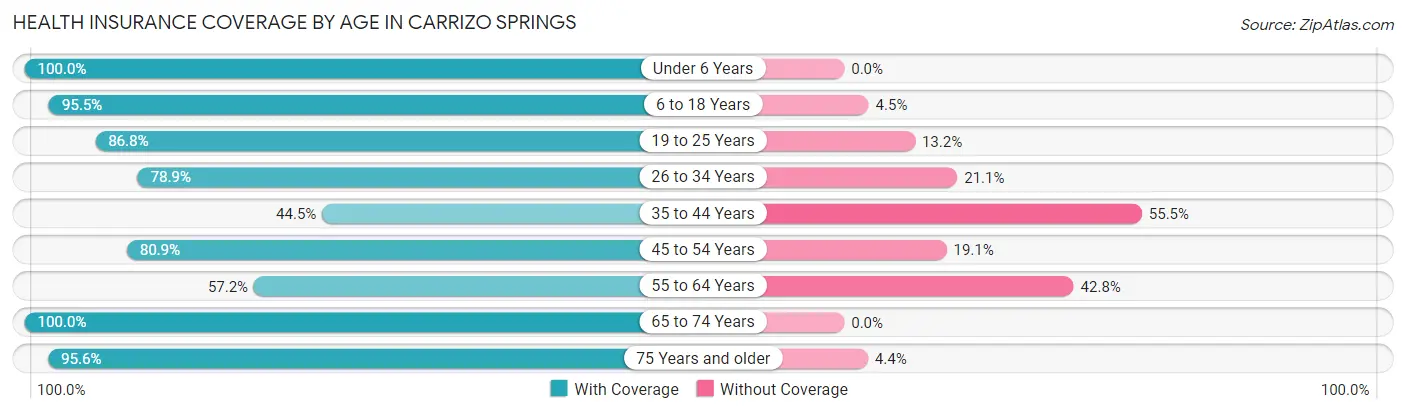
| Age Bracket | With Coverage | Without Coverage |
| Under 6 Years | 458 (100.0%) | 0 (0.0%) |
| 6 to 18 Years | 967 (95.5%) | 46 (4.5%) |
| 19 to 25 Years | 224 (86.8%) | 34 (13.2%) |
| 26 to 34 Years | 367 (78.9%) | 98 (21.1%) |
| 35 to 44 Years | 442 (44.5%) | 551 (55.5%) |
| 45 to 54 Years | 314 (80.9%) | 74 (19.1%) |
| 55 to 64 Years | 281 (57.2%) | 210 (42.8%) |
| 65 to 74 Years | 358 (100.0%) | 0 (0.0%) |
| 75 Years and older | 391 (95.6%) | 18 (4.4%) |
| Total | 3,802 (78.7%) | 1,031 (21.3%) |
Health Insurance Coverage by Citizenship Status in Carrizo Springs
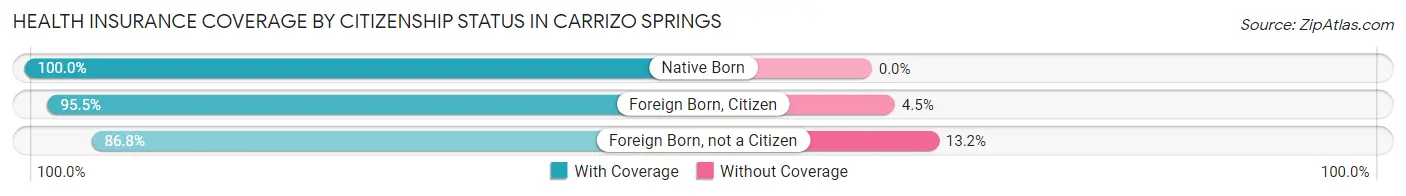
| Citizenship Status | With Coverage | Without Coverage |
| Native Born | 458 (100.0%) | 0 (0.0%) |
| Foreign Born, Citizen | 967 (95.5%) | 46 (4.5%) |
| Foreign Born, not a Citizen | 224 (86.8%) | 34 (13.2%) |
Health Insurance Coverage by Household Income in Carrizo Springs
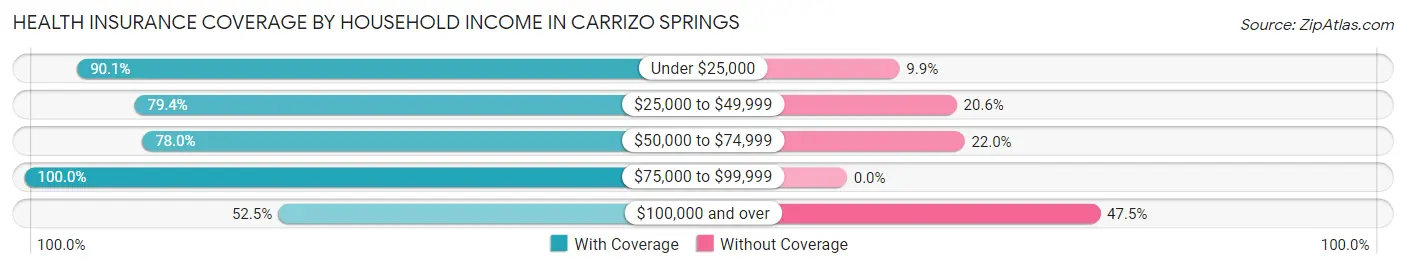
| Household Income | With Coverage | Without Coverage |
| Under $25,000 | 1,298 (90.1%) | 142 (9.9%) |
| $25,000 to $49,999 | 652 (79.4%) | 169 (20.6%) |
| $50,000 to $74,999 | 421 (78.0%) | 119 (22.0%) |
| $75,000 to $99,999 | 788 (100.0%) | 0 (0.0%) |
| $100,000 and over | 643 (52.5%) | 581 (47.5%) |
Public vs Private Health Insurance Coverage by Age in Carrizo Springs
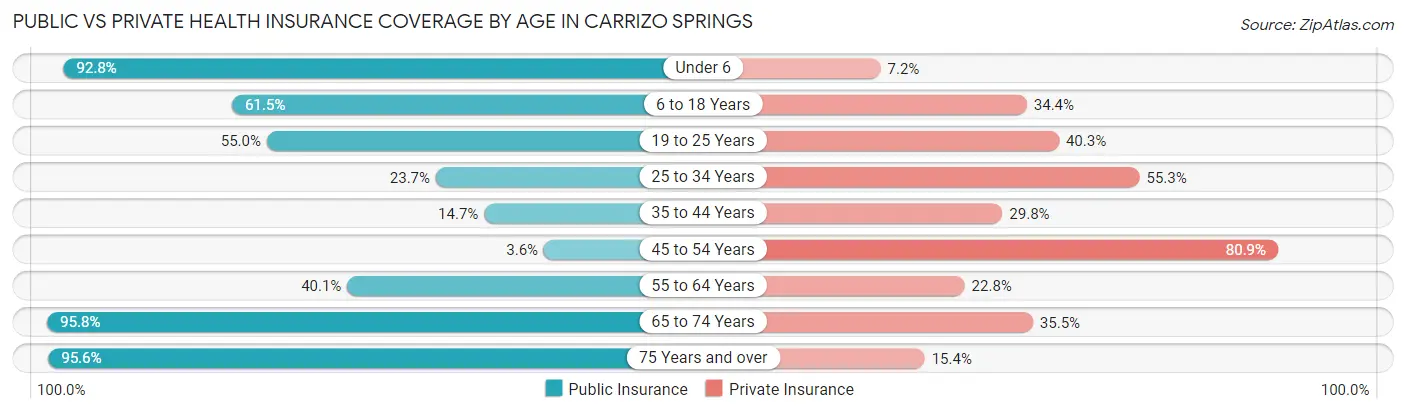
| Age Bracket | Public Insurance | Private Insurance |
| Under 6 | 425 (92.8%) | 33 (7.2%) |
| 6 to 18 Years | 623 (61.5%) | 348 (34.4%) |
| 19 to 25 Years | 142 (55.0%) | 104 (40.3%) |
| 25 to 34 Years | 110 (23.7%) | 257 (55.3%) |
| 35 to 44 Years | 146 (14.7%) | 296 (29.8%) |
| 45 to 54 Years | 14 (3.6%) | 314 (80.9%) |
| 55 to 64 Years | 197 (40.1%) | 112 (22.8%) |
| 65 to 74 Years | 343 (95.8%) | 127 (35.5%) |
| 75 Years and over | 391 (95.6%) | 63 (15.4%) |
| Total | 2,391 (49.5%) | 1,654 (34.2%) |
Disability Status by Sex by Age in Carrizo Springs
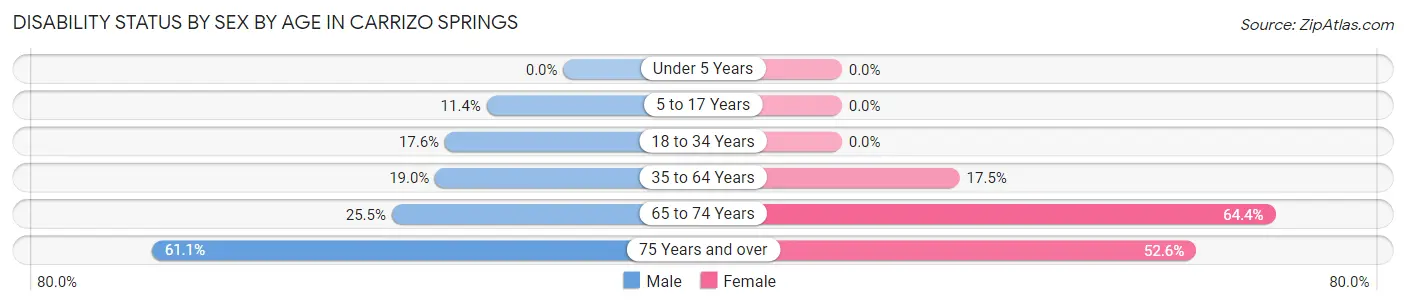
| Age Bracket | Male | Female |
| Under 5 Years | 0 (0.0%) | 0 (0.0%) |
| 5 to 17 Years | 58 (11.4%) | 0 (0.0%) |
| 18 to 34 Years | 83 (17.6%) | 0 (0.0%) |
| 35 to 64 Years | 216 (19.0%) | 129 (17.5%) |
| 65 to 74 Years | 54 (25.5%) | 94 (64.4%) |
| 75 Years and over | 121 (61.1%) | 111 (52.6%) |
Disability Class by Sex by Age in Carrizo Springs
Disability Class: Hearing Difficulty
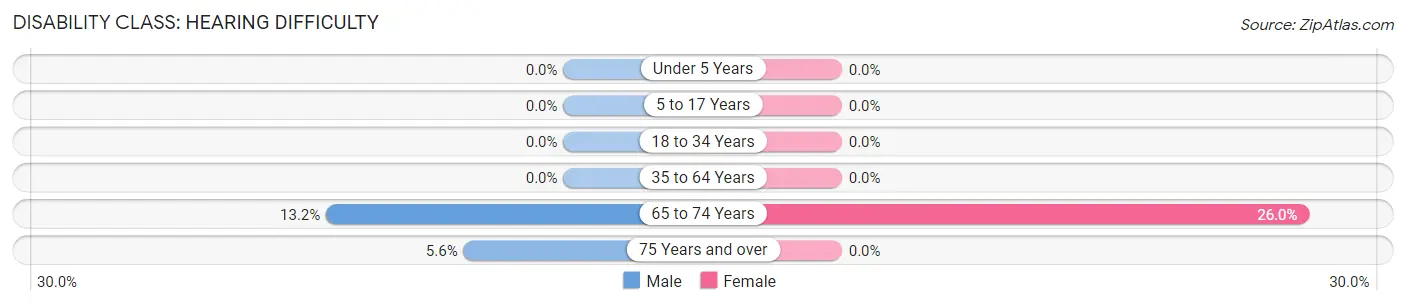
| Age Bracket | Male | Female |
| Under 5 Years | 0 (0.0%) | 0 (0.0%) |
| 5 to 17 Years | 0 (0.0%) | 0 (0.0%) |
| 18 to 34 Years | 0 (0.0%) | 0 (0.0%) |
| 35 to 64 Years | 0 (0.0%) | 0 (0.0%) |
| 65 to 74 Years | 28 (13.2%) | 38 (26.0%) |
| 75 Years and over | 11 (5.6%) | 0 (0.0%) |
Disability Class: Vision Difficulty
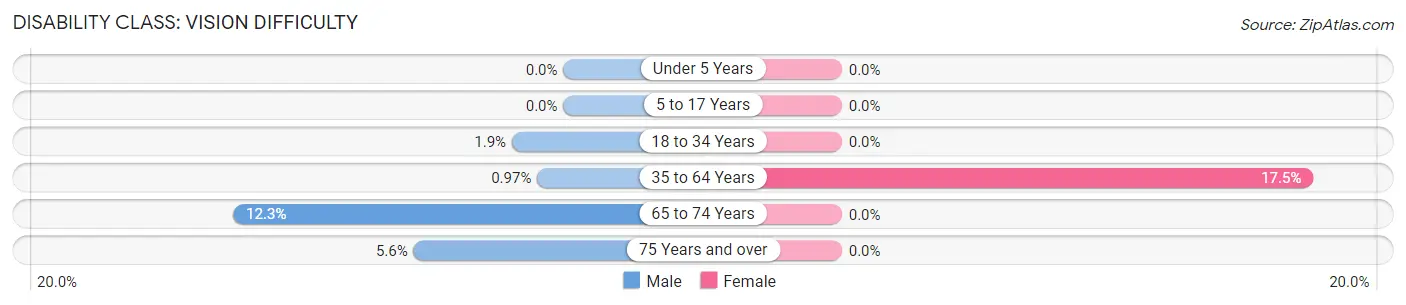
| Age Bracket | Male | Female |
| Under 5 Years | 0 (0.0%) | 0 (0.0%) |
| 5 to 17 Years | 0 (0.0%) | 0 (0.0%) |
| 18 to 34 Years | 9 (1.9%) | 0 (0.0%) |
| 35 to 64 Years | 11 (1.0%) | 129 (17.5%) |
| 65 to 74 Years | 26 (12.3%) | 0 (0.0%) |
| 75 Years and over | 11 (5.6%) | 0 (0.0%) |
Disability Class: Cognitive Difficulty
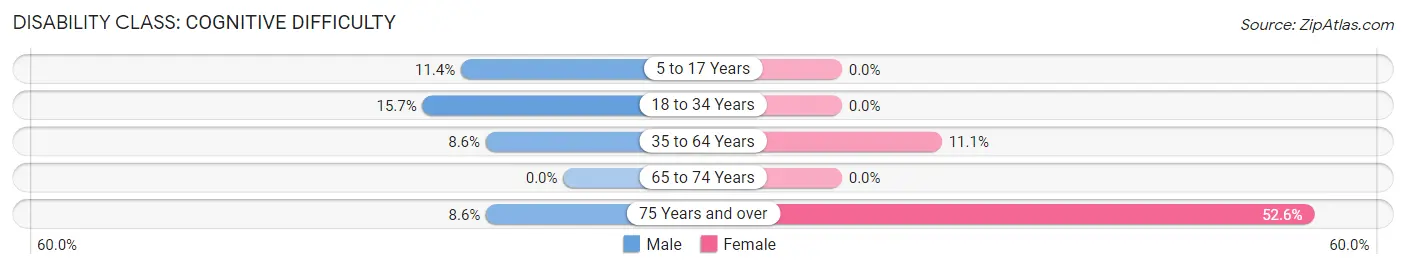
| Age Bracket | Male | Female |
| 5 to 17 Years | 58 (11.4%) | 0 (0.0%) |
| 18 to 34 Years | 74 (15.7%) | 0 (0.0%) |
| 35 to 64 Years | 98 (8.6%) | 82 (11.1%) |
| 65 to 74 Years | 0 (0.0%) | 0 (0.0%) |
| 75 Years and over | 17 (8.6%) | 111 (52.6%) |
Disability Class: Ambulatory Difficulty
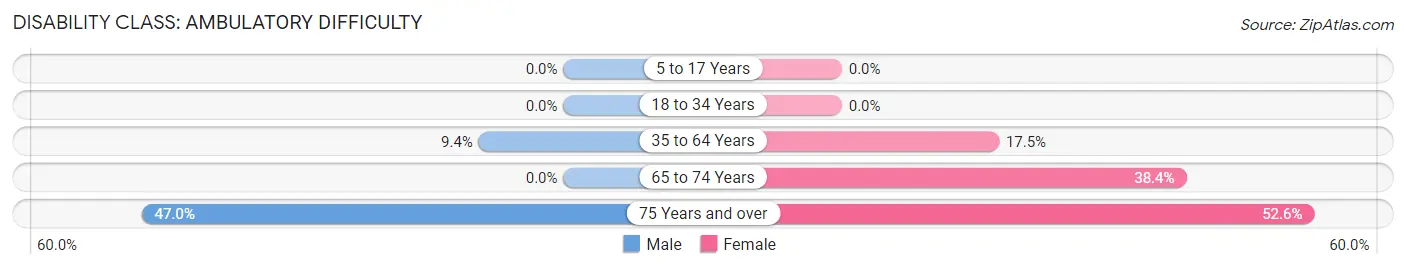
| Age Bracket | Male | Female |
| 5 to 17 Years | 0 (0.0%) | 0 (0.0%) |
| 18 to 34 Years | 0 (0.0%) | 0 (0.0%) |
| 35 to 64 Years | 107 (9.4%) | 129 (17.5%) |
| 65 to 74 Years | 0 (0.0%) | 56 (38.4%) |
| 75 Years and over | 93 (47.0%) | 111 (52.6%) |
Disability Class: Self-Care Difficulty
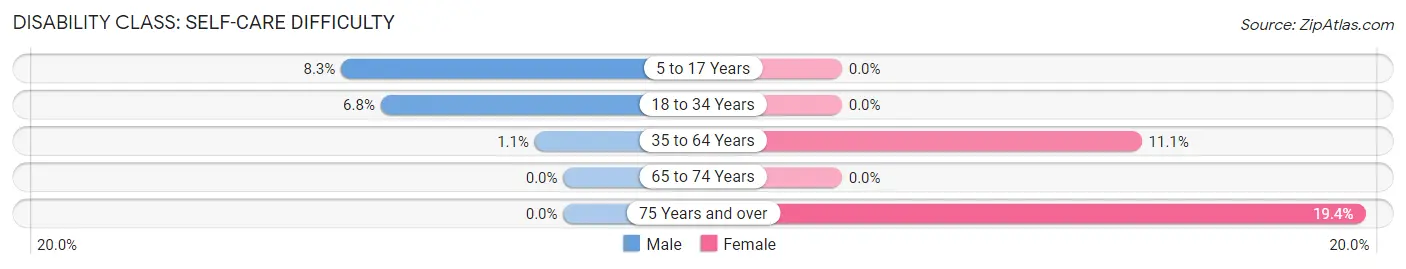
| Age Bracket | Male | Female |
| 5 to 17 Years | 42 (8.3%) | 0 (0.0%) |
| 18 to 34 Years | 32 (6.8%) | 0 (0.0%) |
| 35 to 64 Years | 12 (1.1%) | 82 (11.1%) |
| 65 to 74 Years | 0 (0.0%) | 0 (0.0%) |
| 75 Years and over | 0 (0.0%) | 41 (19.4%) |
Technology Access in Carrizo Springs
Computing Device Access in Carrizo Springs
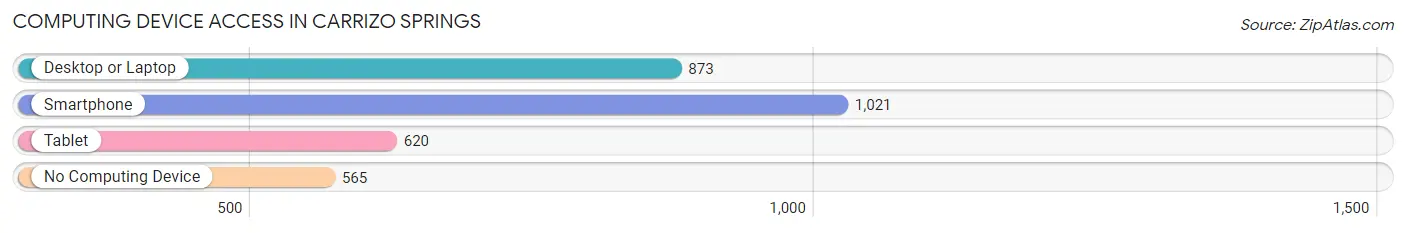
| Device Type | # Households | % Households |
| Desktop or Laptop | 873 | 53.4% |
| Smartphone | 1,021 | 62.5% |
| Tablet | 620 | 37.9% |
| No Computing Device | 565 | 34.6% |
| Total | 1,634 | 100.0% |
Internet Access in Carrizo Springs
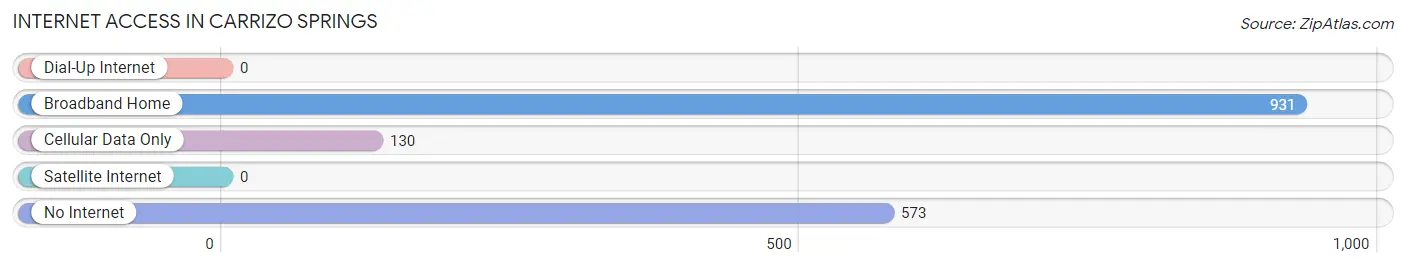
| Internet Type | # Households | % Households |
| Dial-Up Internet | 0 | 0.0% |
| Broadband Home | 931 | 57.0% |
| Cellular Data Only | 130 | 8.0% |
| Satellite Internet | 0 | 0.0% |
| No Internet | 573 | 35.1% |
| Total | 1,634 | 100.0% |
Carrizo Springs Summary
Carrizo Springs is a city located in Dimmit County, Texas, United States. It is the county seat of Dimmit County and is located on the northern edge of the Eagle Ford Shale, a large geological formation that has become a major source of oil and gas production in recent years. The population of Carrizo Springs was 5,368 at the 2010 census, up from 4,655 at the 2000 census.
History
Carrizo Springs was founded in 1881 by rancher and businessman John Legett, who named the town after the nearby Carrizo Creek. The town was incorporated in 1883 and quickly became a center of commerce for the surrounding area. The town was served by the San Antonio and Aransas Pass Railway in the late 19th century, and the railroad helped to spur the growth of the town.
In the early 20th century, Carrizo Springs was a popular destination for tourists, who came to enjoy the area's natural beauty and to hunt and fish in the nearby creeks and rivers. The town was also home to a number of businesses, including a hotel, a bank, a newspaper, and a movie theater.
Geography
Carrizo Springs is located in south-central Dimmit County at 28°30′N 99°51′W (28.50, -99.85). It is situated on the northern edge of the Eagle Ford Shale, a large geological formation that has become a major source of oil and gas production in recent years.
The city is located at the intersection of U.S. Route 83 and State Highway 85. US 83 leads north 37 miles (60 km) to Uvalde and south 45 miles (72 km) to Laredo, while SH 85 leads east 28 miles (45 km) to Asherton and west 28 miles (45 km) to Crystal City.
Economy
Carrizo Springs is the economic center of Dimmit County and the surrounding area. The city is home to a number of businesses, including a hotel, a bank, a newspaper, and a movie theater.
The city is also home to a number of oil and gas companies, which have been drawn to the area by the Eagle Ford Shale. The shale has become a major source of oil and gas production in recent years, and the city has seen an influx of workers and businesses related to the industry.
Demographics
As of the 2010 census, there were 5,368 people, 1,845 households, and 1,323 families residing in the city. The population density was 1,092.3 people per square mile (421.7/km2). There were 2,093 housing units at an average density of 425.3 per square mile (164.2/km2). The racial makeup of the city was 77.2% White, 0.7% African American, 0.7% Native American, 0.3% Asian, 0.1% Pacific Islander, 19.2% from other races, and 2.0% from two or more races. Hispanic or Latino of any race were 81.2% of the population.
There were 1,845 households, out of which 37.2% had children under the age of 18 living with them, 48.2% were married couples living together, 17.7% had a female householder with no husband present, and 28.2% were non-families. 24.2% of all households were made up of individuals, and 11.2% had someone living alone who was 65 years of age or older. The average household size was 2.86 and the average family size was 3.41.
In the city, the population was spread out, with 30.2% under the age of 18, 9.3% from 18 to 24, 25.2% from 25 to 44, 21.2% from 45 to 64, and 14.1% who were 65 years of age or older. The median age was 33 years. For every 100 females, there were 92.2 males. For every 100 females age 18 and over, there were 88.2 males.
The median income for a household in the city was $25,938, and the median income for a family was $30,938. Males had a median income of $25,938 versus $17,938 for females. The per capita income for the city was $12,938. About 22.2% of families and 25.2% of the population were below the poverty line, including 33.2% of those under age 18 and 20.2% of those age 65 or over.
Common Questions
What is Per Capita Income in Carrizo Springs?
Per Capita income in Carrizo Springs is $19,379.
What is the Median Household income in Carrizo Springs?
Median Household Income in Carrizo Springs is $26,033.
What is Inequality or Gini Index in Carrizo Springs?
Inequality or Gini Index in Carrizo Springs is 0.49.
What is the Total Population of Carrizo Springs?
Total Population of Carrizo Springs is 4,888.
What is the Total Male Population of Carrizo Springs?
Total Male Population of Carrizo Springs is 2,763.
What is the Total Female Population of Carrizo Springs?
Total Female Population of Carrizo Springs is 2,125.
What is the Ratio of Males per 100 Females in Carrizo Springs?
There are 130.02 Males per 100 Females in Carrizo Springs.
What is the Ratio of Females per 100 Males in Carrizo Springs?
There are 76.91 Females per 100 Males in Carrizo Springs.
What is the Median Population Age in Carrizo Springs?
Median Population Age in Carrizo Springs is 36.4 Years.
What is the Average Family Size in Carrizo Springs
Average Family Size in Carrizo Springs is 3.4 People.
What is the Average Household Size in Carrizo Springs
Average Household Size in Carrizo Springs is 3.0 People.
How Large is the Labor Force in Carrizo Springs?
There are 1,193 People in the Labor Forcein in Carrizo Springs.
What is the Percentage of People in the Labor Force in Carrizo Springs?
33.4% of People are in the Labor Force in Carrizo Springs.
What is the Unemployment Rate in Carrizo Springs?
Unemployment Rate in Carrizo Springs is 4.9%.