Kyle, TX Map & Demographics
Kyle Map
Kyle Overview
$34,631
PER CAPITA INCOME
$93,441
AVG FAMILY INCOME
$85,199
AVG HOUSEHOLD INCOME
24.0%
WAGE / INCOME GAP [ % ]
76.0¢/ $1
WAGE / INCOME GAP [ $ ]
0.36
INEQUALITY / GINI INDEX
48,484
TOTAL POPULATION
24,609
MALE POPULATION
23,875
FEMALE POPULATION
103.07
MALES / 100 FEMALES
97.02
FEMALES / 100 MALES
33.2
MEDIAN AGE
3.3
AVG FAMILY SIZE
2.8
AVG HOUSEHOLD SIZE
26,852
LABOR FORCE [ PEOPLE ]
73.4%
PERCENT IN LABOR FORCE
3.0%
UNEMPLOYMENT RATE
Kyle Zip Codes
Kyle Area Codes
Income in Kyle
Income Overview in Kyle
Per Capita Income in Kyle is $34,631, while median incomes of families and households are $93,441 and $85,199 respectively.
| Characteristic | Number | Measure |
| Per Capita Income | 48,484 | $34,631 |
| Median Family Income | 11,886 | $93,441 |
| Mean Family Income | 11,886 | $104,559 |
| Median Household Income | 17,316 | $85,199 |
| Mean Household Income | 17,316 | $95,767 |
| Income Deficit | 11,886 | $0 |
| Wage / Income Gap (%) | 48,484 | 24.03% |
| Wage / Income Gap ($) | 48,484 | 75.97¢ per $1 |
| Gini / Inequality Index | 48,484 | 0.36 |
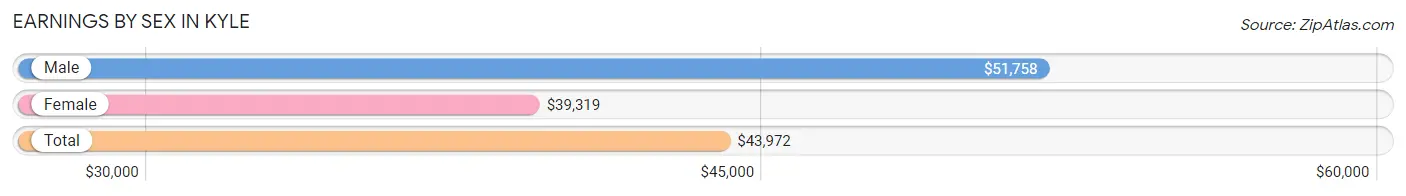
Earnings by Sex in Kyle
Average Earnings in Kyle are $43,972, $51,758 for men and $39,319 for women, a difference of 24.0%.
| Sex | Number | Average Earnings |
| Male | 15,011 (54.5%) | $51,758 |
| Female | 12,543 (45.5%) | $39,319 |
| Total | 27,554 (100.0%) | $43,972 |
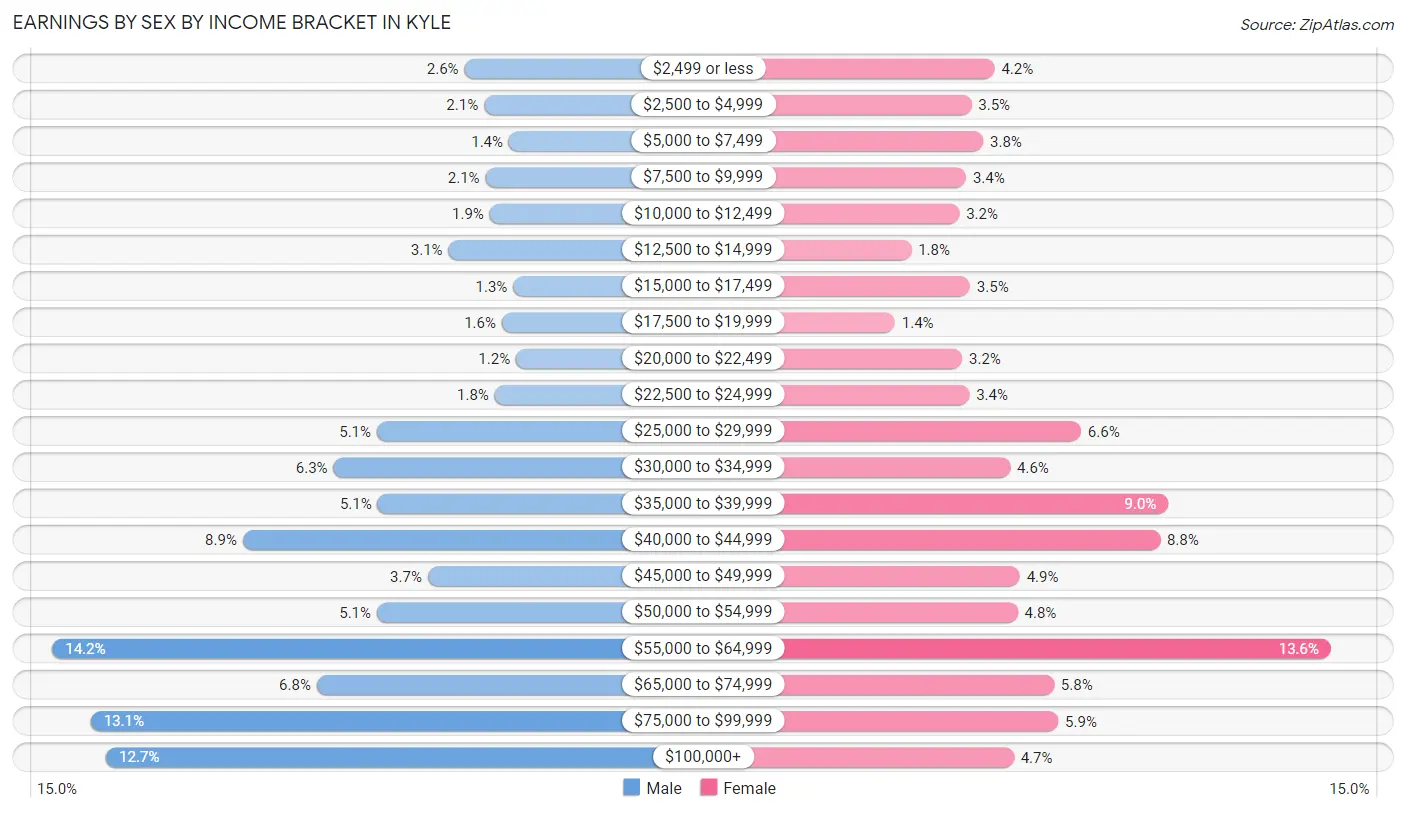
Earnings by Sex by Income Bracket in Kyle
The most common earnings brackets in Kyle are $55,000 to $64,999 for men (2,134 | 14.2%) and $55,000 to $64,999 for women (1,706 | 13.6%).
| Income | Male | Female |
| $2,499 or less | 396 (2.6%) | 520 (4.2%) |
| $2,500 to $4,999 | 314 (2.1%) | 439 (3.5%) |
| $5,000 to $7,499 | 208 (1.4%) | 480 (3.8%) |
| $7,500 to $9,999 | 307 (2.1%) | 420 (3.4%) |
| $10,000 to $12,499 | 289 (1.9%) | 396 (3.2%) |
| $12,500 to $14,999 | 464 (3.1%) | 227 (1.8%) |
| $15,000 to $17,499 | 190 (1.3%) | 434 (3.5%) |
| $17,500 to $19,999 | 239 (1.6%) | 169 (1.3%) |
| $20,000 to $22,499 | 178 (1.2%) | 407 (3.2%) |
| $22,500 to $24,999 | 269 (1.8%) | 432 (3.4%) |
| $25,000 to $29,999 | 766 (5.1%) | 825 (6.6%) |
| $30,000 to $34,999 | 948 (6.3%) | 576 (4.6%) |
| $35,000 to $39,999 | 763 (5.1%) | 1,133 (9.0%) |
| $40,000 to $44,999 | 1,331 (8.9%) | 1,104 (8.8%) |
| $45,000 to $49,999 | 551 (3.7%) | 610 (4.9%) |
| $50,000 to $54,999 | 765 (5.1%) | 602 (4.8%) |
| $55,000 to $64,999 | 2,134 (14.2%) | 1,706 (13.6%) |
| $65,000 to $74,999 | 1,019 (6.8%) | 730 (5.8%) |
| $75,000 to $99,999 | 1,972 (13.1%) | 745 (5.9%) |
| $100,000+ | 1,908 (12.7%) | 588 (4.7%) |
| Total | 15,011 (100.0%) | 12,543 (100.0%) |
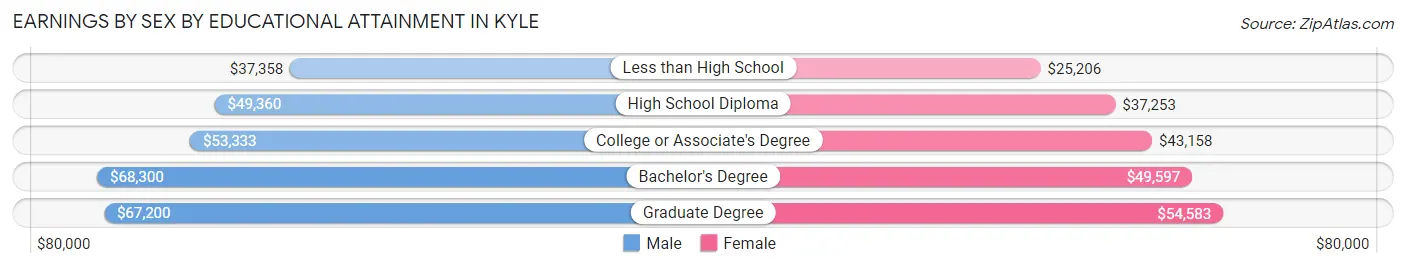
Earnings by Sex by Educational Attainment in Kyle
Average earnings in Kyle are $55,869 for men and $42,213 for women, a difference of 24.4%. Men with an educational attainment of bachelor's degree enjoy the highest average annual earnings of $68,300, while those with less than high school education earn the least with $37,358. Women with an educational attainment of graduate degree earn the most with the average annual earnings of $54,583, while those with less than high school education have the smallest earnings of $25,206.
| Educational Attainment | Male Income | Female Income |
| Less than High School | $37,358 | $25,206 |
| High School Diploma | $49,360 | $37,253 |
| College or Associate's Degree | $53,333 | $43,158 |
| Bachelor's Degree | $68,300 | $49,597 |
| Graduate Degree | $67,200 | $54,583 |
| Total | $55,869 | $42,213 |
Family Income in Kyle
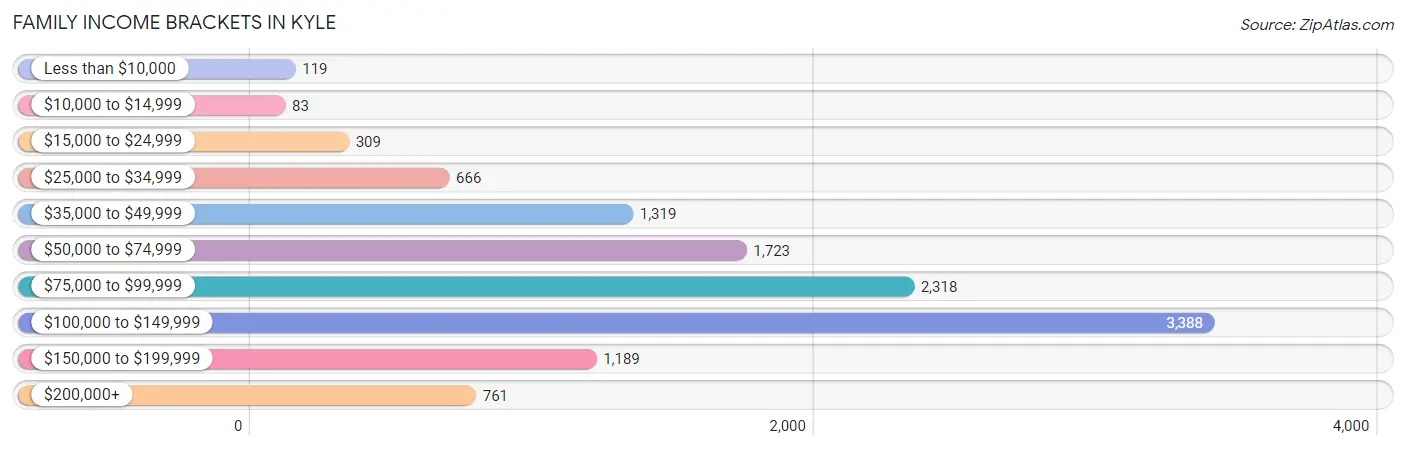
Family Income Brackets in Kyle
According to the Kyle family income data, there are 3,388 families falling into the $100,000 to $149,999 income range, which is the most common income bracket and makes up 28.5% of all families. Conversely, the $10,000 to $14,999 income bracket is the least frequent group with only 83 families (0.7%) belonging to this category.
| Income Bracket | # Families | % Families |
| Less than $10,000 | 119 | 1.0% |
| $10,000 to $14,999 | 83 | 0.7% |
| $15,000 to $24,999 | 309 | 2.6% |
| $25,000 to $34,999 | 666 | 5.6% |
| $35,000 to $49,999 | 1,319 | 11.1% |
| $50,000 to $74,999 | 1,723 | 14.5% |
| $75,000 to $99,999 | 2,318 | 19.5% |
| $100,000 to $149,999 | 3,388 | 28.5% |
| $150,000 to $199,999 | 1,189 | 10.0% |
| $200,000+ | 761 | 6.4% |
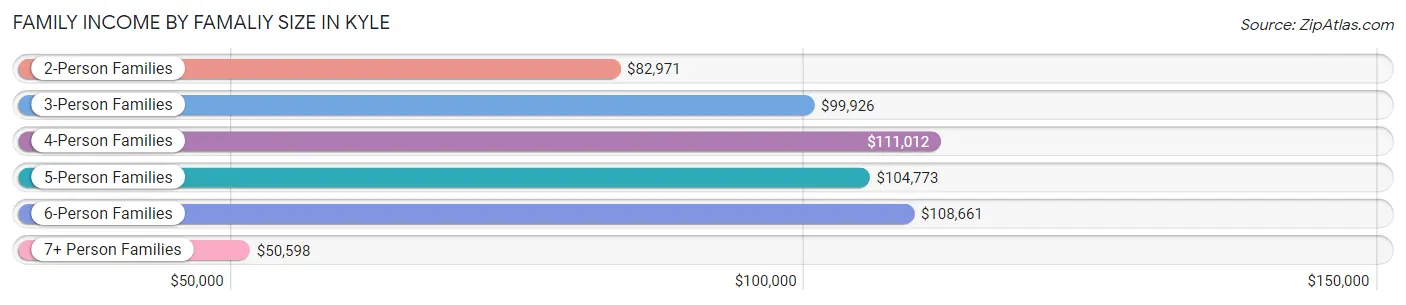
Family Income by Famaliy Size in Kyle
4-person families (2,768 | 23.3%) account for the highest median family income in Kyle with $111,012 per family, while 2-person families (4,687 | 39.4%) have the highest median income of $41,486 per family member.
| Income Bracket | # Families | Median Income |
| 2-Person Families | 4,687 (39.4%) | $82,971 |
| 3-Person Families | 2,458 (20.7%) | $99,926 |
| 4-Person Families | 2,768 (23.3%) | $111,012 |
| 5-Person Families | 1,008 (8.5%) | $104,773 |
| 6-Person Families | 407 (3.4%) | $108,661 |
| 7+ Person Families | 558 (4.7%) | $50,598 |
| Total | 11,886 (100.0%) | $93,441 |
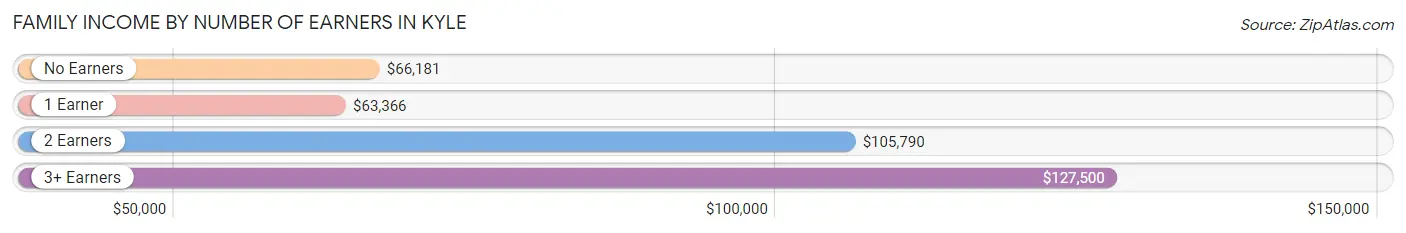
Family Income by Number of Earners in Kyle
The median family income in Kyle is $93,441, with families comprising 3+ earners (1,452) having the highest median family income of $127,500, while families with 1 earner (4,156) have the lowest median family income of $63,366, accounting for 12.2% and 35.0% of families, respectively.
| Number of Earners | # Families | Median Income |
| No Earners | 833 (7.0%) | $66,181 |
| 1 Earner | 4,156 (35.0%) | $63,366 |
| 2 Earners | 5,445 (45.8%) | $105,790 |
| 3+ Earners | 1,452 (12.2%) | $127,500 |
| Total | 11,886 (100.0%) | $93,441 |
Household Income in Kyle
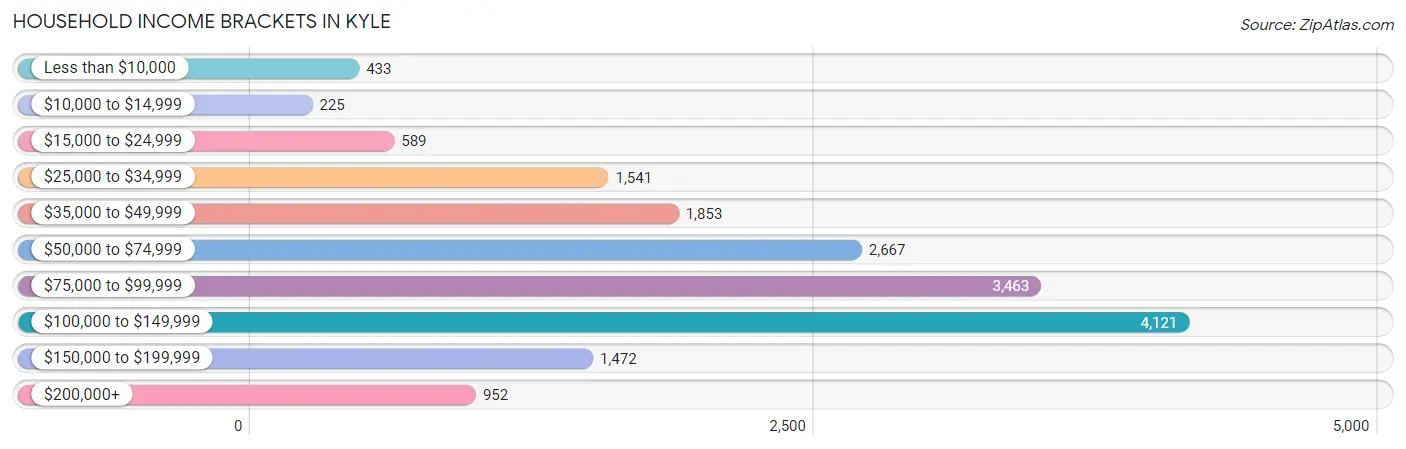
Household Income Brackets in Kyle
With 4,121 households falling in the category, the $100,000 to $149,999 income range is the most frequent in Kyle, accounting for 23.8% of all households. In contrast, only 225 households (1.3%) fall into the $10,000 to $14,999 income bracket, making it the least populous group.
| Income Bracket | # Households | % Households |
| Less than $10,000 | 433 | 2.5% |
| $10,000 to $14,999 | 225 | 1.3% |
| $15,000 to $24,999 | 589 | 3.4% |
| $25,000 to $34,999 | 1,541 | 8.9% |
| $35,000 to $49,999 | 1,853 | 10.7% |
| $50,000 to $74,999 | 2,667 | 15.4% |
| $75,000 to $99,999 | 3,463 | 20.0% |
| $100,000 to $149,999 | 4,121 | 23.8% |
| $150,000 to $199,999 | 1,472 | 8.5% |
| $200,000+ | 952 | 5.5% |
Household Income by Householder Age in Kyle
The median household income in Kyle is $85,199, with the highest median household income of $93,734 found in the 45 to 64 years age bracket for the primary householder. A total of 6,076 households (35.1%) fall into this category. Meanwhile, the 15 to 24 years age bracket for the primary householder has the lowest median household income of $41,603, with 1,104 households (6.4%) in this group.
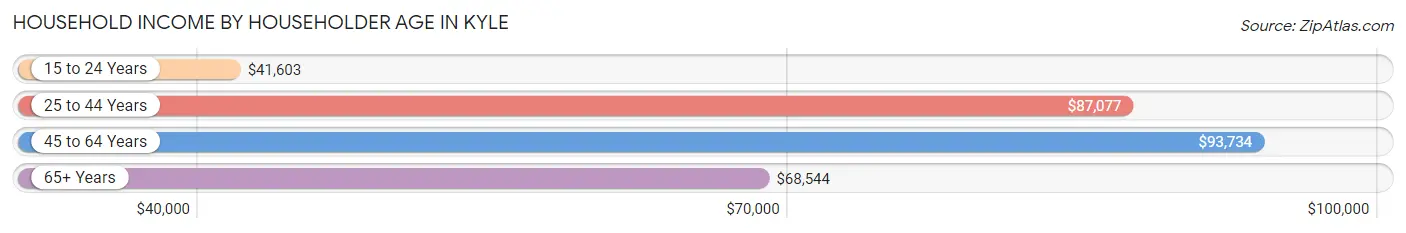
| Income Bracket | # Households | Median Income |
| 15 to 24 Years | 1,104 (6.4%) | $41,603 |
| 25 to 44 Years | 8,000 (46.2%) | $87,077 |
| 45 to 64 Years | 6,076 (35.1%) | $93,734 |
| 65+ Years | 2,136 (12.3%) | $68,544 |
| Total | 17,316 (100.0%) | $85,199 |
Poverty in Kyle
Income Below Poverty by Sex and Age in Kyle
With 6.8% poverty level for males and 7.7% for females among the residents of Kyle, 18 to 24 year old males and 16 and 17 year old females are the most vulnerable to poverty, with 354 males (15.1%) and 121 females (17.7%) in their respective age groups living below the poverty level.
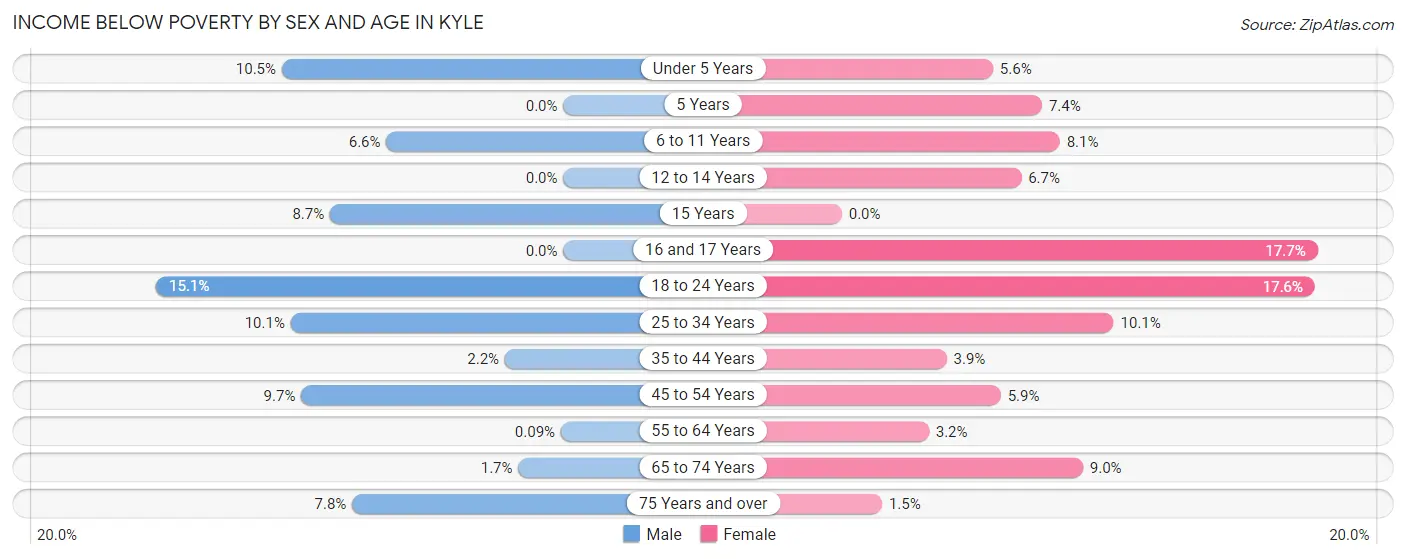
| Age Bracket | Male | Female |
| Under 5 Years | 193 (10.4%) | 91 (5.6%) |
| 5 Years | 0 (0.0%) | 15 (7.4%) |
| 6 to 11 Years | 139 (6.6%) | 177 (8.1%) |
| 12 to 14 Years | 0 (0.0%) | 73 (6.7%) |
| 15 Years | 67 (8.7%) | 0 (0.0%) |
| 16 and 17 Years | 0 (0.0%) | 121 (17.7%) |
| 18 to 24 Years | 354 (15.1%) | 447 (17.6%) |
| 25 to 34 Years | 460 (10.1%) | 378 (10.1%) |
| 35 to 44 Years | 86 (2.2%) | 140 (3.9%) |
| 45 to 54 Years | 274 (9.7%) | 160 (5.9%) |
| 55 to 64 Years | 2 (0.1%) | 86 (3.2%) |
| 65 to 74 Years | 18 (1.7%) | 123 (8.9%) |
| 75 Years and over | 45 (7.8%) | 8 (1.5%) |
| Total | 1,638 (6.8%) | 1,819 (7.7%) |
Income Above Poverty by Sex and Age in Kyle
According to the poverty statistics in Kyle, males aged 5 years and females aged 15 years are the age groups that are most secure financially, with 100.0% of males and 100.0% of females in these age groups living above the poverty line.
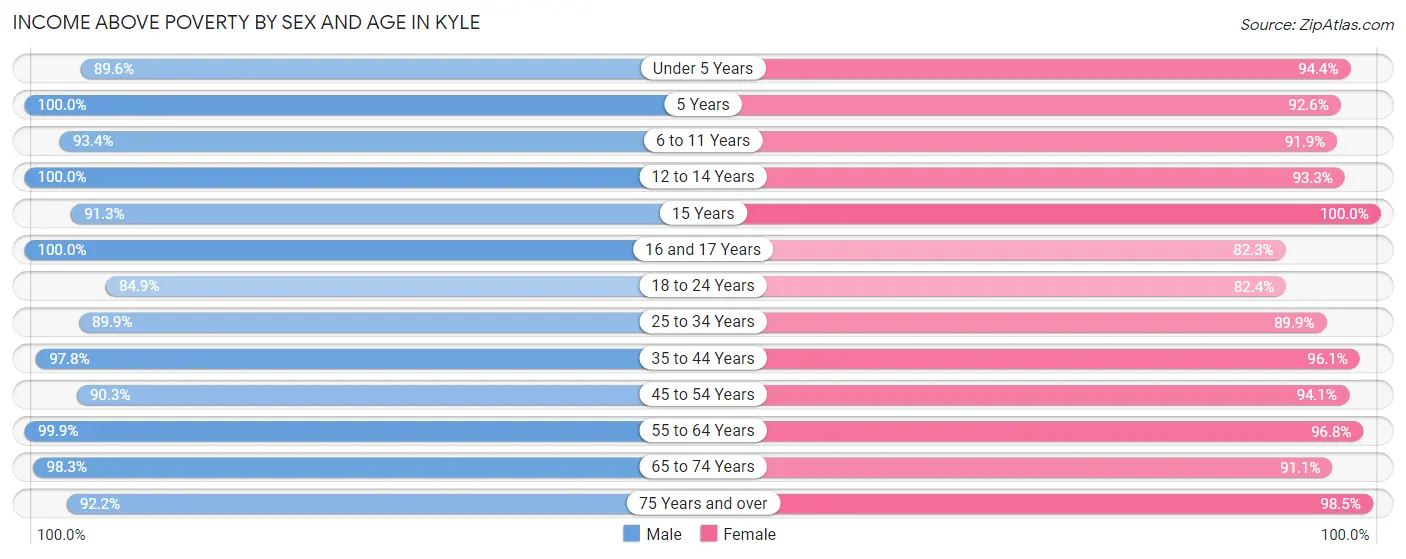
| Age Bracket | Male | Female |
| Under 5 Years | 1,654 (89.5%) | 1,530 (94.4%) |
| 5 Years | 317 (100.0%) | 187 (92.6%) |
| 6 to 11 Years | 1,978 (93.4%) | 2,011 (91.9%) |
| 12 to 14 Years | 717 (100.0%) | 1,023 (93.3%) |
| 15 Years | 707 (91.3%) | 723 (100.0%) |
| 16 and 17 Years | 566 (100.0%) | 564 (82.3%) |
| 18 to 24 Years | 1,987 (84.9%) | 2,098 (82.4%) |
| 25 to 34 Years | 4,087 (89.9%) | 3,368 (89.9%) |
| 35 to 44 Years | 3,873 (97.8%) | 3,459 (96.1%) |
| 45 to 54 Years | 2,543 (90.3%) | 2,551 (94.1%) |
| 55 to 64 Years | 2,327 (99.9%) | 2,578 (96.8%) |
| 65 to 74 Years | 1,059 (98.3%) | 1,251 (91.0%) |
| 75 Years and over | 529 (92.2%) | 528 (98.5%) |
| Total | 22,344 (93.2%) | 21,871 (92.3%) |
Income Below Poverty Among Married-Couple Families in Kyle
The poverty statistics for married-couple families in Kyle show that 2.1% or 187 of the total 8,778 families live below the poverty line. Families with 5 or more children have the highest poverty rate of 33.3%, comprising of 58 families. On the other hand, families with 3 or 4 children have the lowest poverty rate of 0.0%, which includes 0 families.
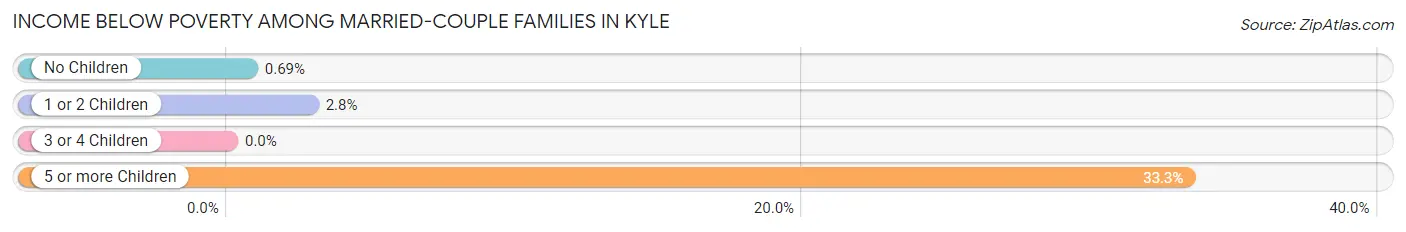
| Children | Above Poverty | Below Poverty |
| No Children | 4,004 (99.3%) | 28 (0.7%) |
| 1 or 2 Children | 3,498 (97.2%) | 101 (2.8%) |
| 3 or 4 Children | 973 (100.0%) | 0 (0.0%) |
| 5 or more Children | 116 (66.7%) | 58 (33.3%) |
| Total | 8,591 (97.9%) | 187 (2.1%) |
Income Below Poverty Among Single-Parent Households in Kyle
According to the poverty data in Kyle, 9.1% or 79 single-father households and 8.8% or 198 single-mother households are living below the poverty line. Among single-father households, those with no children have the highest poverty rate, with 79 households (22.9%) experiencing poverty. Likewise, among single-mother households, those with 3 or 4 children have the highest poverty rate, with 71 households (28.0%) falling below the poverty line.
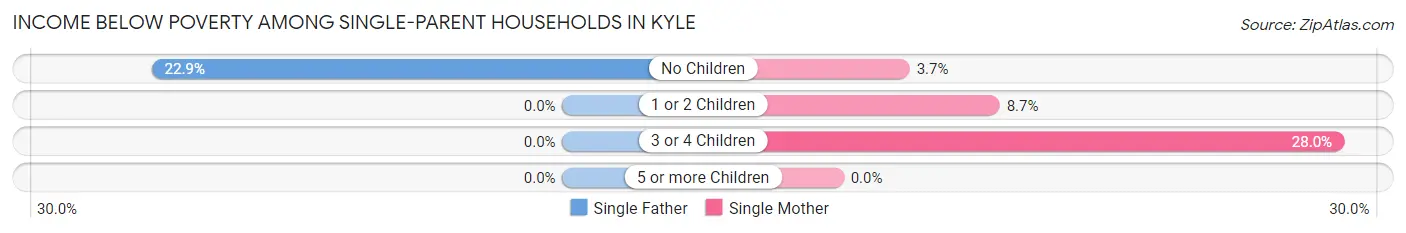
| Children | Single Father | Single Mother |
| No Children | 79 (22.9%) | 30 (3.7%) |
| 1 or 2 Children | 0 (0.0%) | 97 (8.7%) |
| 3 or 4 Children | 0 (0.0%) | 71 (28.0%) |
| 5 or more Children | 0 (0.0%) | 0 (0.0%) |
| Total | 79 (9.1%) | 198 (8.8%) |
Income Below Poverty Among Married-Couple vs Single-Parent Households in Kyle
The poverty data for Kyle shows that 187 of the married-couple family households (2.1%) and 277 of the single-parent households (8.9%) are living below the poverty level. Within the married-couple family households, those with 5 or more children have the highest poverty rate, with 58 households (33.3%) falling below the poverty line. Among the single-parent households, those with 3 or 4 children have the highest poverty rate, with 71 household (17.9%) living below poverty.
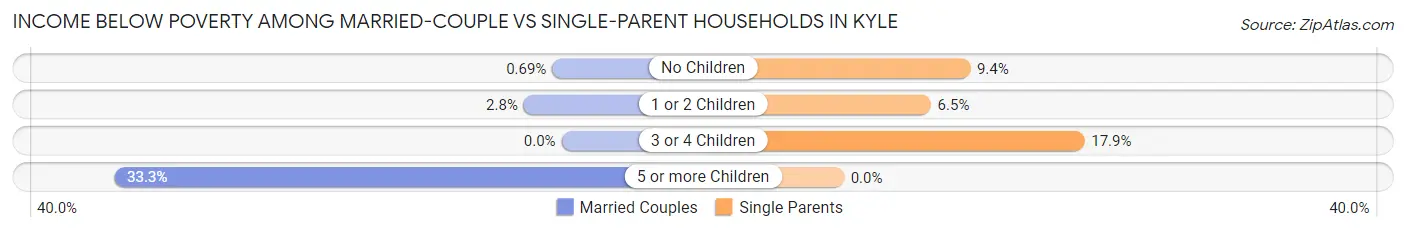
| Children | Married-Couple Families | Single-Parent Households |
| No Children | 28 (0.7%) | 109 (9.4%) |
| 1 or 2 Children | 101 (2.8%) | 97 (6.5%) |
| 3 or 4 Children | 0 (0.0%) | 71 (17.9%) |
| 5 or more Children | 58 (33.3%) | 0 (0.0%) |
| Total | 187 (2.1%) | 277 (8.9%) |
Race in Kyle
The most populous races in Kyle are White / Caucasian (30,927 | 63.8%), Hispanic or Latino (25,076 | 51.7%), and Two or more Races (11,725 | 24.2%).
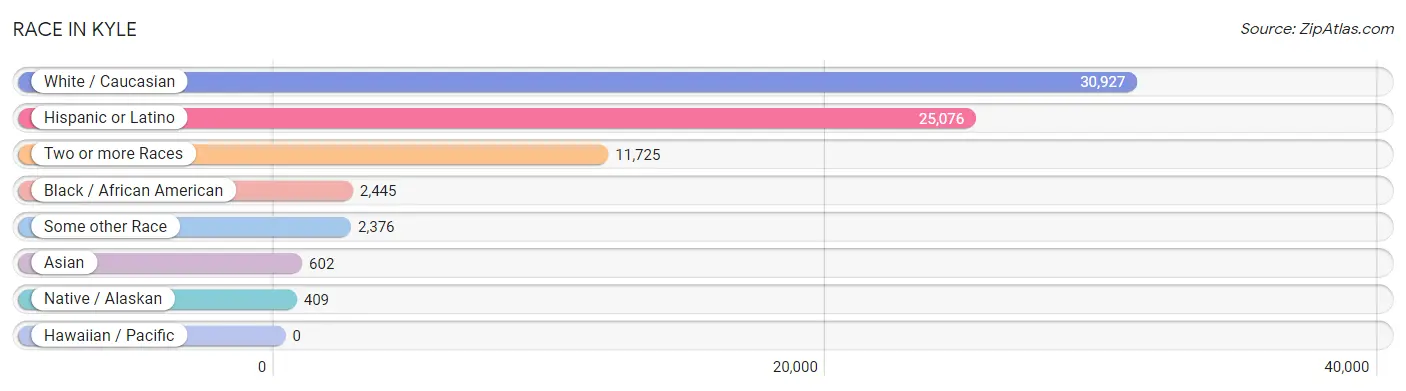
| Race | # Population | % Population |
| Asian | 602 | 1.2% |
| Black / African American | 2,445 | 5.0% |
| Hawaiian / Pacific | 0 | 0.0% |
| Hispanic or Latino | 25,076 | 51.7% |
| Native / Alaskan | 409 | 0.8% |
| White / Caucasian | 30,927 | 63.8% |
| Two or more Races | 11,725 | 24.2% |
| Some other Race | 2,376 | 4.9% |
| Total | 48,484 | 100.0% |
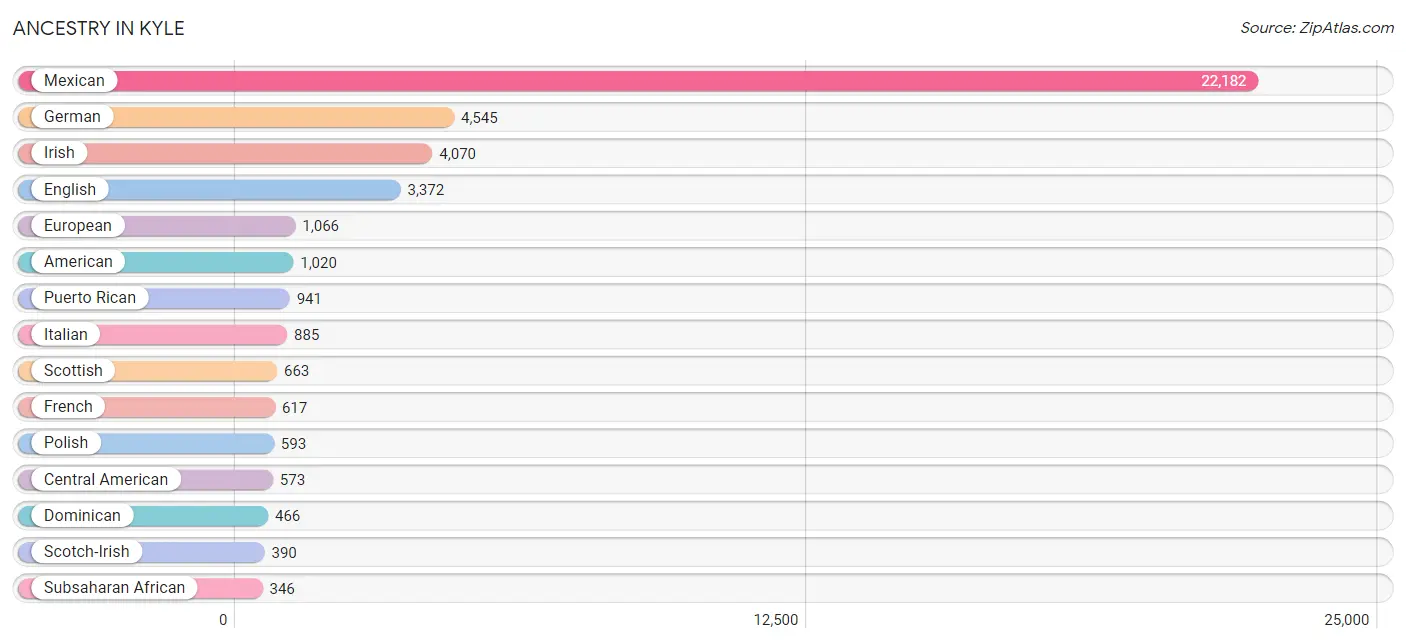
Ancestry in Kyle
The most populous ancestries reported in Kyle are Mexican (22,182 | 45.8%), German (4,545 | 9.4%), Irish (4,070 | 8.4%), English (3,372 | 7.0%), and European (1,066 | 2.2%), together accounting for 72.7% of all Kyle residents.
| Ancestry | # Population | % Population |
| African | 185 | 0.4% |
| American | 1,020 | 2.1% |
| Apache | 28 | 0.1% |
| Arab | 129 | 0.3% |
| Australian | 13 | 0.0% |
| Belgian | 28 | 0.1% |
| Bhutanese | 34 | 0.1% |
| Blackfeet | 20 | 0.0% |
| British | 304 | 0.6% |
| Burmese | 211 | 0.4% |
| Canadian | 78 | 0.2% |
| Central American | 573 | 1.2% |
| Cherokee | 168 | 0.4% |
| Choctaw | 9 | 0.0% |
| Colombian | 38 | 0.1% |
| Comanche | 42 | 0.1% |
| Cuban | 83 | 0.2% |
| Czech | 159 | 0.3% |
| Danish | 101 | 0.2% |
| Dominican | 466 | 1.0% |
| Dutch | 96 | 0.2% |
| Eastern European | 8 | 0.0% |
| Egyptian | 11 | 0.0% |
| English | 3,372 | 7.0% |
| European | 1,066 | 2.2% |
| Filipino | 5 | 0.0% |
| Finnish | 32 | 0.1% |
| French | 617 | 1.3% |
| French Canadian | 252 | 0.5% |
| German | 4,545 | 9.4% |
| Ghanaian | 43 | 0.1% |
| Greek | 55 | 0.1% |
| Guatemalan | 201 | 0.4% |
| Honduran | 13 | 0.0% |
| Hungarian | 44 | 0.1% |
| Indian (Asian) | 140 | 0.3% |
| Indonesian | 59 | 0.1% |
| Irish | 4,070 | 8.4% |
| Italian | 885 | 1.8% |
| Korean | 293 | 0.6% |
| Lebanese | 40 | 0.1% |
| Maltese | 5 | 0.0% |
| Mexican | 22,182 | 45.8% |
| Mexican American Indian | 182 | 0.4% |
| Mongolian | 40 | 0.1% |
| Nicaraguan | 109 | 0.2% |
| Nigerian | 139 | 0.3% |
| Northern European | 118 | 0.2% |
| Norwegian | 131 | 0.3% |
| Paiute | 113 | 0.2% |
| Pakistani | 113 | 0.2% |
| Panamanian | 148 | 0.3% |
| Polish | 593 | 1.2% |
| Portuguese | 124 | 0.3% |
| Potawatomi | 16 | 0.0% |
| Puerto Rican | 941 | 1.9% |
| Russian | 19 | 0.0% |
| Salvadoran | 78 | 0.2% |
| Scandinavian | 200 | 0.4% |
| Scotch-Irish | 390 | 0.8% |
| Scottish | 663 | 1.4% |
| Slovak | 52 | 0.1% |
| South American | 75 | 0.2% |
| Spaniard | 275 | 0.6% |
| Spanish | 86 | 0.2% |
| Sri Lankan | 54 | 0.1% |
| Subsaharan African | 346 | 0.7% |
| Sudanese | 20 | 0.0% |
| Swedish | 208 | 0.4% |
| Swiss | 23 | 0.1% |
| Thai | 33 | 0.1% |
| Ukrainian | 117 | 0.2% |
| Venezuelan | 37 | 0.1% |
| Welsh | 276 | 0.6% |
| West Indian | 48 | 0.1% |
| Yaqui | 291 | 0.6% | View All 76 Rows |
Immigrants in Kyle
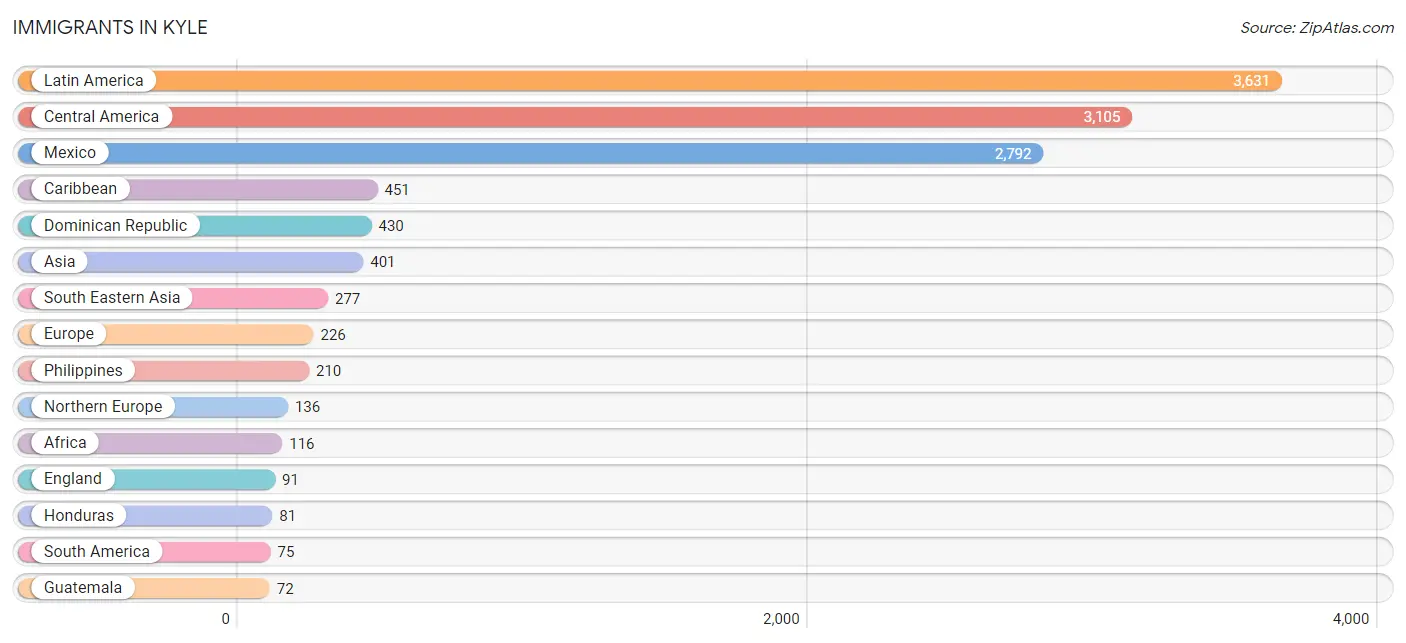
The most numerous immigrant groups reported in Kyle came from Latin America (3,631 | 7.5%), Central America (3,105 | 6.4%), Mexico (2,792 | 5.8%), Caribbean (451 | 0.9%), and Dominican Republic (430 | 0.9%), together accounting for 21.5% of all Kyle residents.
| Immigration Origin | # Population | % Population |
| Africa | 116 | 0.2% |
| Asia | 401 | 0.8% |
| Canada | 19 | 0.0% |
| Caribbean | 451 | 0.9% |
| Central America | 3,105 | 6.4% |
| China | 29 | 0.1% |
| Colombia | 38 | 0.1% |
| Cuba | 21 | 0.0% |
| Dominican Republic | 430 | 0.9% |
| Eastern Africa | 66 | 0.1% |
| Eastern Asia | 65 | 0.1% |
| Eastern Europe | 27 | 0.1% |
| El Salvador | 57 | 0.1% |
| England | 91 | 0.2% |
| Europe | 226 | 0.5% |
| France | 50 | 0.1% |
| Germany | 13 | 0.0% |
| Guatemala | 72 | 0.2% |
| Honduras | 81 | 0.2% |
| India | 33 | 0.1% |
| Japan | 15 | 0.0% |
| Jordan | 17 | 0.0% |
| Korea | 21 | 0.0% |
| Latin America | 3,631 | 7.5% |
| Lebanon | 9 | 0.0% |
| Malaysia | 7 | 0.0% |
| Mexico | 2,792 | 5.8% |
| Nicaragua | 71 | 0.2% |
| Nigeria | 50 | 0.1% |
| Northern Europe | 136 | 0.3% |
| Panama | 32 | 0.1% |
| Philippines | 210 | 0.4% |
| Scotland | 45 | 0.1% |
| South America | 75 | 0.2% |
| South Central Asia | 33 | 0.1% |
| South Eastern Asia | 277 | 0.6% |
| Thailand | 28 | 0.1% |
| Ukraine | 27 | 0.1% |
| Venezuela | 37 | 0.1% |
| Vietnam | 32 | 0.1% |
| Western Africa | 50 | 0.1% |
| Western Asia | 26 | 0.1% |
| Western Europe | 63 | 0.1% |
| Zimbabwe | 66 | 0.1% | View All 44 Rows |
Sex and Age in Kyle
Sex and Age in Kyle
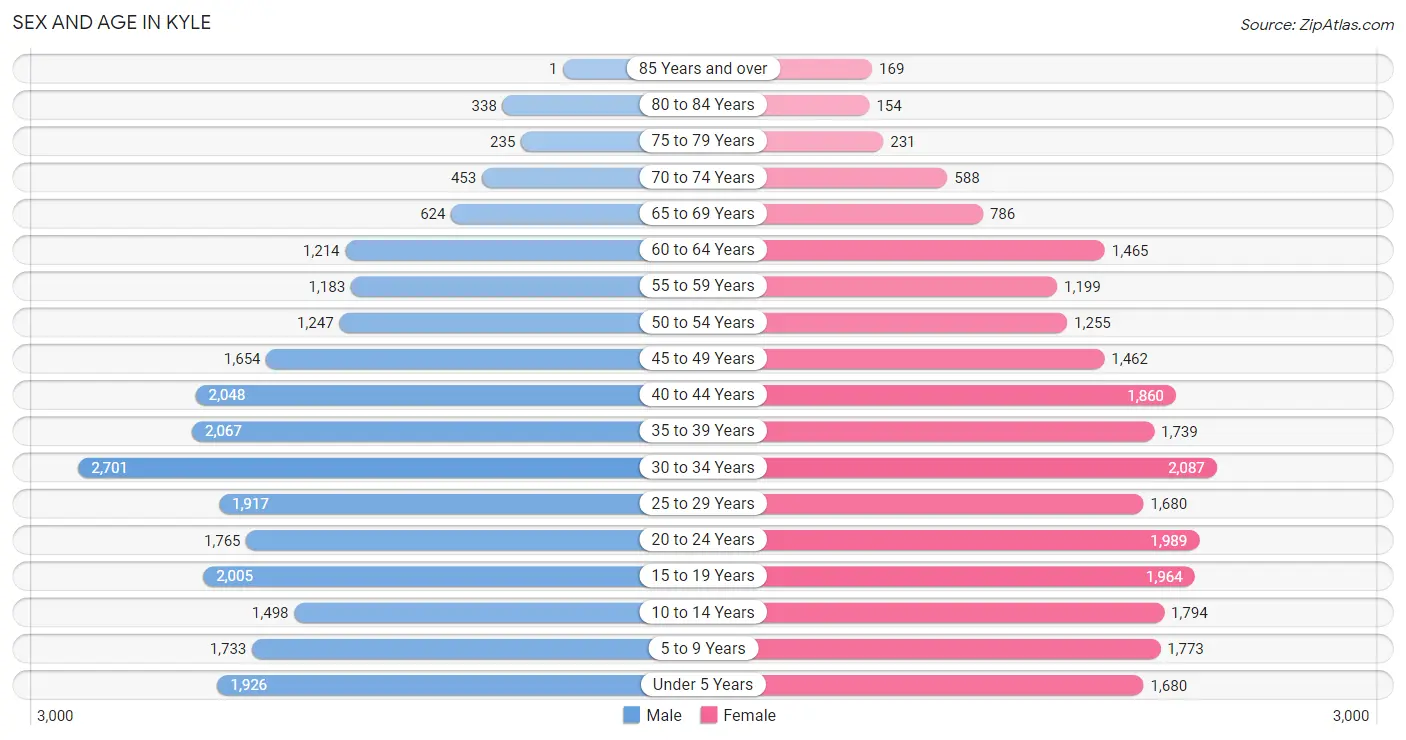
The most populous age groups in Kyle are 30 to 34 Years (2,701 | 11.0%) for men and 30 to 34 Years (2,087 | 8.7%) for women.
| Age Bracket | Male | Female |
| Under 5 Years | 1,926 (7.8%) | 1,680 (7.0%) |
| 5 to 9 Years | 1,733 (7.0%) | 1,773 (7.4%) |
| 10 to 14 Years | 1,498 (6.1%) | 1,794 (7.5%) |
| 15 to 19 Years | 2,005 (8.2%) | 1,964 (8.2%) |
| 20 to 24 Years | 1,765 (7.2%) | 1,989 (8.3%) |
| 25 to 29 Years | 1,917 (7.8%) | 1,680 (7.0%) |
| 30 to 34 Years | 2,701 (11.0%) | 2,087 (8.7%) |
| 35 to 39 Years | 2,067 (8.4%) | 1,739 (7.3%) |
| 40 to 44 Years | 2,048 (8.3%) | 1,860 (7.8%) |
| 45 to 49 Years | 1,654 (6.7%) | 1,462 (6.1%) |
| 50 to 54 Years | 1,247 (5.1%) | 1,255 (5.3%) |
| 55 to 59 Years | 1,183 (4.8%) | 1,199 (5.0%) |
| 60 to 64 Years | 1,214 (4.9%) | 1,465 (6.1%) |
| 65 to 69 Years | 624 (2.5%) | 786 (3.3%) |
| 70 to 74 Years | 453 (1.8%) | 588 (2.5%) |
| 75 to 79 Years | 235 (0.9%) | 231 (1.0%) |
| 80 to 84 Years | 338 (1.4%) | 154 (0.6%) |
| 85 Years and over | 1 (0.0%) | 169 (0.7%) |
| Total | 24,609 (100.0%) | 23,875 (100.0%) |
Families and Households in Kyle
Median Family Size in Kyle
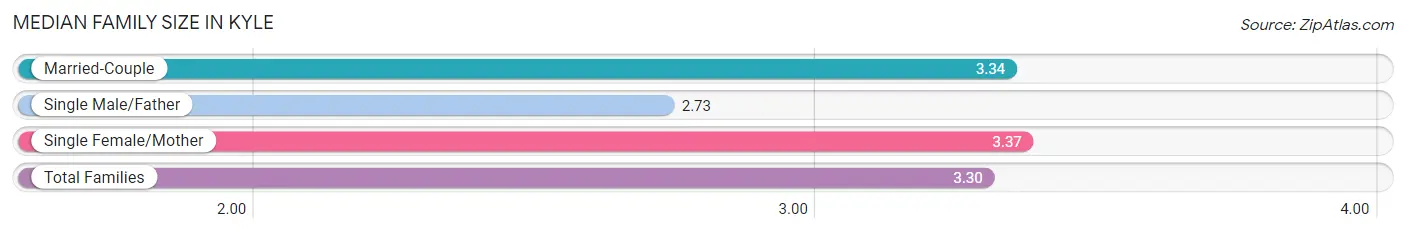
The median family size in Kyle is 3.30 persons per family, with single female/mother families (2,237 | 18.8%) accounting for the largest median family size of 3.37 persons per family. On the other hand, single male/father families (871 | 7.3%) represent the smallest median family size with 2.73 persons per family.
| Family Type | # Families | Family Size |
| Married-Couple | 8,778 (73.9%) | 3.34 |
| Single Male/Father | 871 (7.3%) | 2.73 |
| Single Female/Mother | 2,237 (18.8%) | 3.37 |
| Total Families | 11,886 (100.0%) | 3.30 |
Median Household Size in Kyle
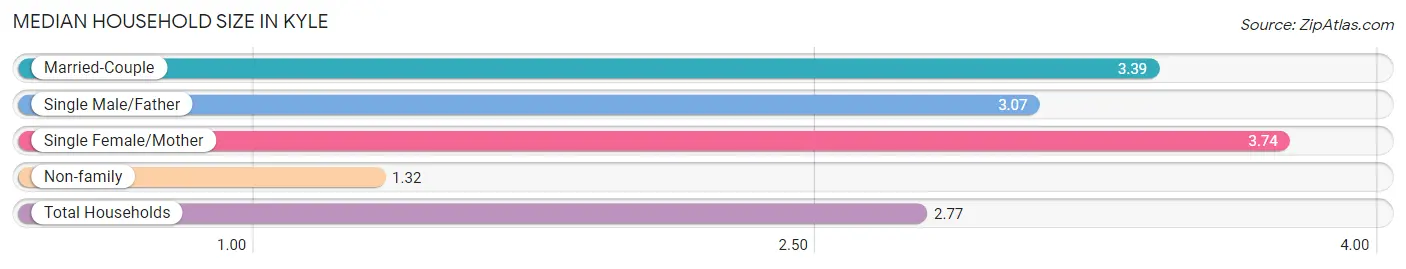
The median household size in Kyle is 2.77 persons per household, with single female/mother households (2,237 | 12.9%) accounting for the largest median household size of 3.74 persons per household. non-family households (5,430 | 31.4%) represent the smallest median household size with 1.32 persons per household.
| Household Type | # Households | Household Size |
| Married-Couple | 8,778 (50.7%) | 3.39 |
| Single Male/Father | 871 (5.0%) | 3.07 |
| Single Female/Mother | 2,237 (12.9%) | 3.74 |
| Non-family | 5,430 (31.4%) | 1.32 |
| Total Households | 17,316 (100.0%) | 2.77 |
Household Size by Marriage Status in Kyle
Out of a total of 17,316 households in Kyle, 11,886 (68.6%) are family households, while 5,430 (31.4%) are nonfamily households. The most numerous type of family households are 2-person households, comprising 4,378, and the most common type of nonfamily households are 1-person households, comprising 3,846.
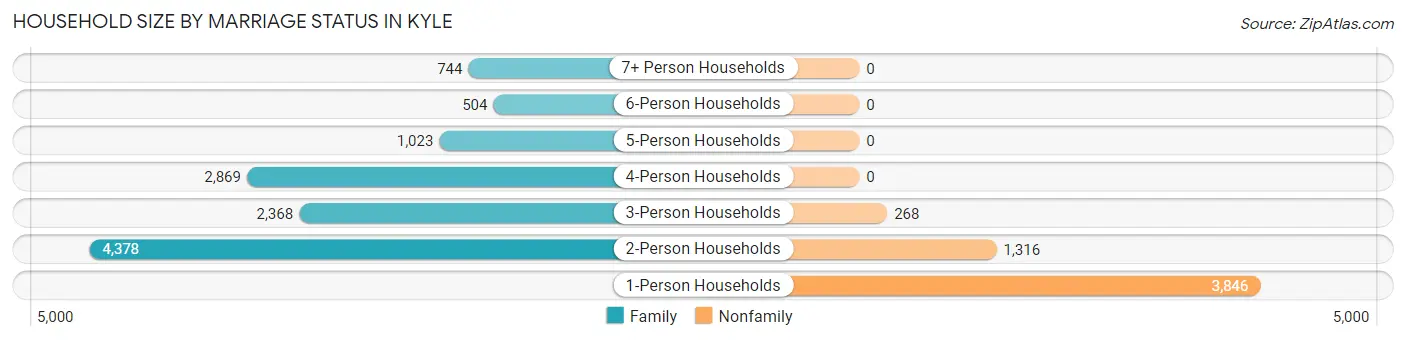
| Household Size | Family Households | Nonfamily Households |
| 1-Person Households | - | 3,846 (22.2%) |
| 2-Person Households | 4,378 (25.3%) | 1,316 (7.6%) |
| 3-Person Households | 2,368 (13.7%) | 268 (1.5%) |
| 4-Person Households | 2,869 (16.6%) | 0 (0.0%) |
| 5-Person Households | 1,023 (5.9%) | 0 (0.0%) |
| 6-Person Households | 504 (2.9%) | 0 (0.0%) |
| 7+ Person Households | 744 (4.3%) | 0 (0.0%) |
| Total | 11,886 (68.6%) | 5,430 (31.4%) |
Female Fertility in Kyle
Fertility by Age in Kyle
Average fertility rate in Kyle is 59.0 births per 1,000 women. Women in the age bracket of 35 to 50 years have the highest fertility rate with 86.0 births per 1,000 women. Women in the age bracket of 35 to 50 years acount for 58.8% of all women with births.
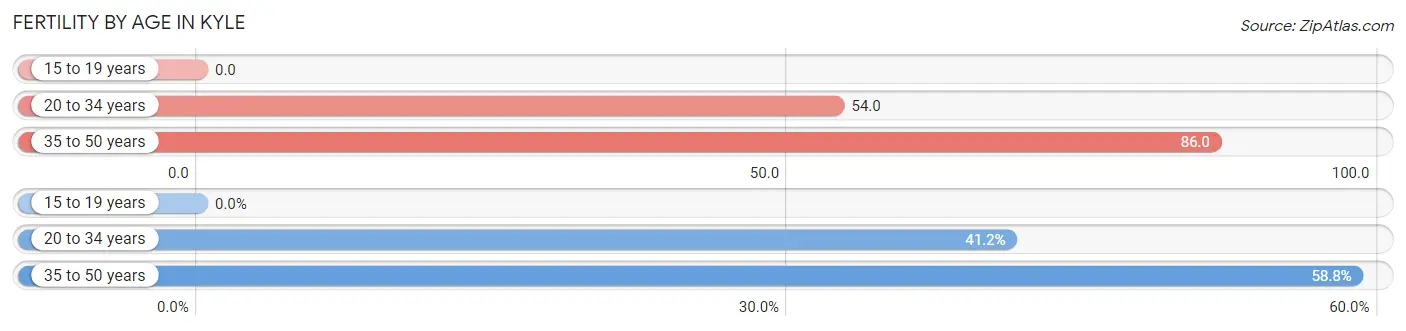
| Age Bracket | Women with Births | Births / 1,000 Women |
| 15 to 19 years | 0 (0.0%) | 0.0 |
| 20 to 34 years | 311 (41.2%) | 54.0 |
| 35 to 50 years | 444 (58.8%) | 86.0 |
| Total | 755 (100.0%) | 59.0 |
Fertility by Age by Marriage Status in Kyle
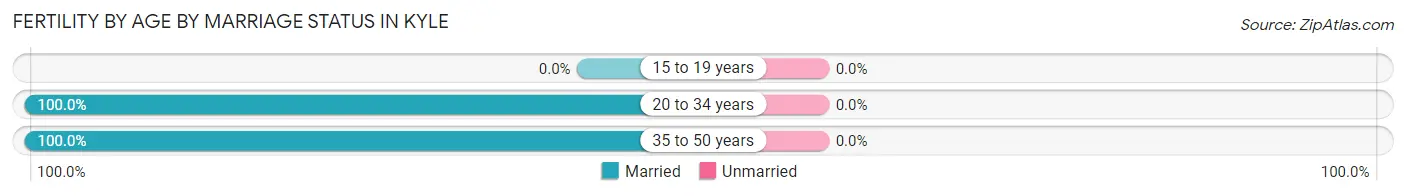
| Age Bracket | Married | Unmarried |
| 15 to 19 years | 0 (0.0%) | 0 (0.0%) |
| 20 to 34 years | 311 (100.0%) | 0 (0.0%) |
| 35 to 50 years | 444 (100.0%) | 0 (0.0%) |
| Total | 755 (100.0%) | 0 (0.0%) |
Fertility by Education in Kyle
Average fertility rate in Kyle is 59.0 births per 1,000 women. Women with the education attainment of high school diploma have the highest fertility rate of 116.0 births per 1,000 women, while women with the education attainment of college or associate's degree have the lowest fertility at 16.0 births per 1,000 women. Women with the education attainment of high school diploma represent 45.4% of all women with births.
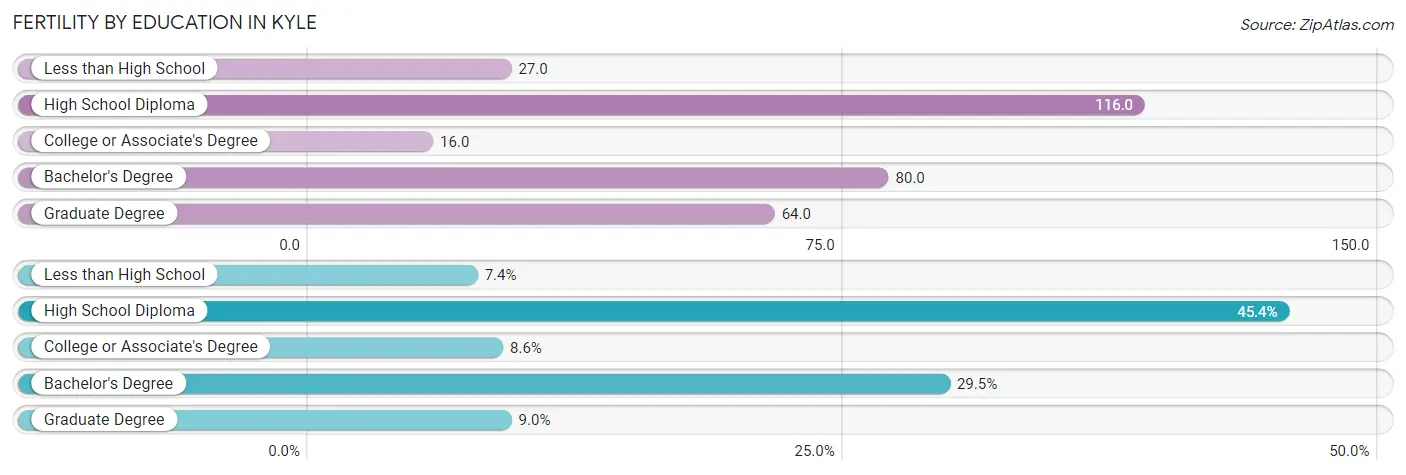
| Educational Attainment | Women with Births | Births / 1,000 Women |
| Less than High School | 56 (7.4%) | 27.0 |
| High School Diploma | 343 (45.4%) | 116.0 |
| College or Associate's Degree | 65 (8.6%) | 16.0 |
| Bachelor's Degree | 223 (29.5%) | 80.0 |
| Graduate Degree | 68 (9.0%) | 64.0 |
| Total | 755 (100.0%) | 59.0 |
Fertility by Education by Marriage Status in Kyle
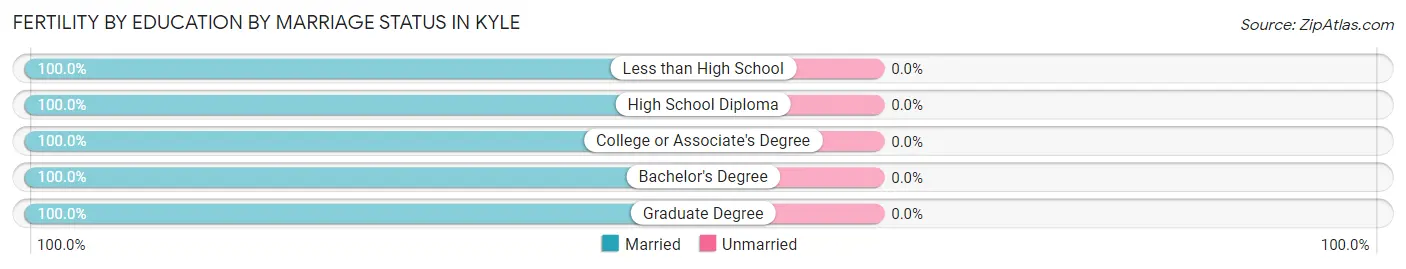
| Educational Attainment | Married | Unmarried |
| Less than High School | 56 (100.0%) | 0 (0.0%) |
| High School Diploma | 343 (100.0%) | 0 (0.0%) |
| College or Associate's Degree | 65 (100.0%) | 0 (0.0%) |
| Bachelor's Degree | 223 (100.0%) | 0 (0.0%) |
| Graduate Degree | 68 (100.0%) | 0 (0.0%) |
| Total | 755 (100.0%) | 0 (0.0%) |
Employment Characteristics in Kyle
Employment by Class of Employer in Kyle
Among the 25,614 employed individuals in Kyle, private company employees (16,514 | 64.5%), local government employees (3,232 | 12.6%), and not-for-profit organizations (1,563 | 6.1%) make up the most common classes of employment.
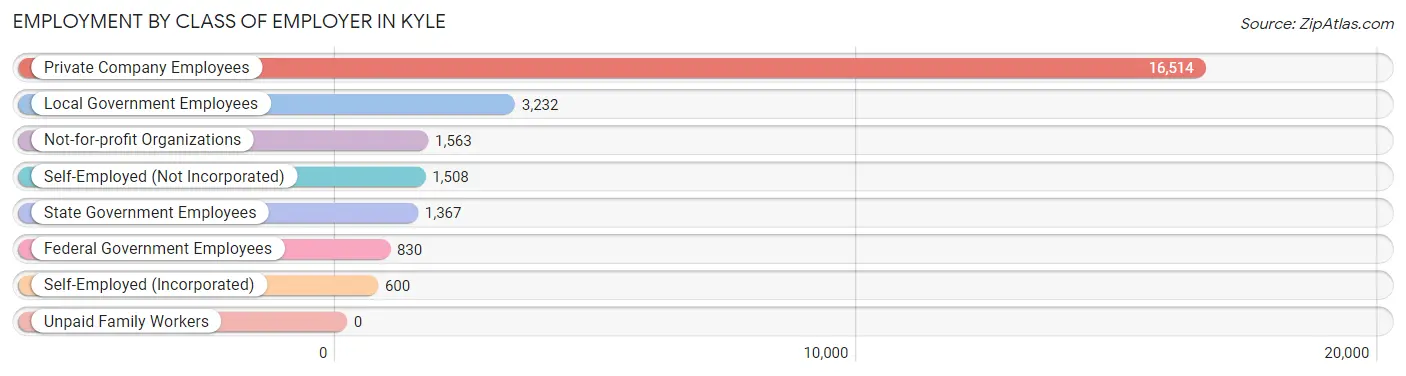
| Employer Class | # Employees | % Employees |
| Private Company Employees | 16,514 | 64.5% |
| Self-Employed (Incorporated) | 600 | 2.3% |
| Self-Employed (Not Incorporated) | 1,508 | 5.9% |
| Not-for-profit Organizations | 1,563 | 6.1% |
| Local Government Employees | 3,232 | 12.6% |
| State Government Employees | 1,367 | 5.3% |
| Federal Government Employees | 830 | 3.2% |
| Unpaid Family Workers | 0 | 0.0% |
| Total | 25,614 | 100.0% |
Employment Status by Age in Kyle
According to the labor force statistics for Kyle, out of the total population over 16 years of age (36,583), 73.4% or 26,852 individuals are in the labor force, with 3.0% or 806 of them unemployed. The age group with the highest labor force participation rate is 25 to 29 years, with 90.7% or 3,262 individuals in the labor force. Within the labor force, the 20 to 24 years age range has the highest percentage of unemployed individuals, with 9.6% or 264 of them being unemployed.
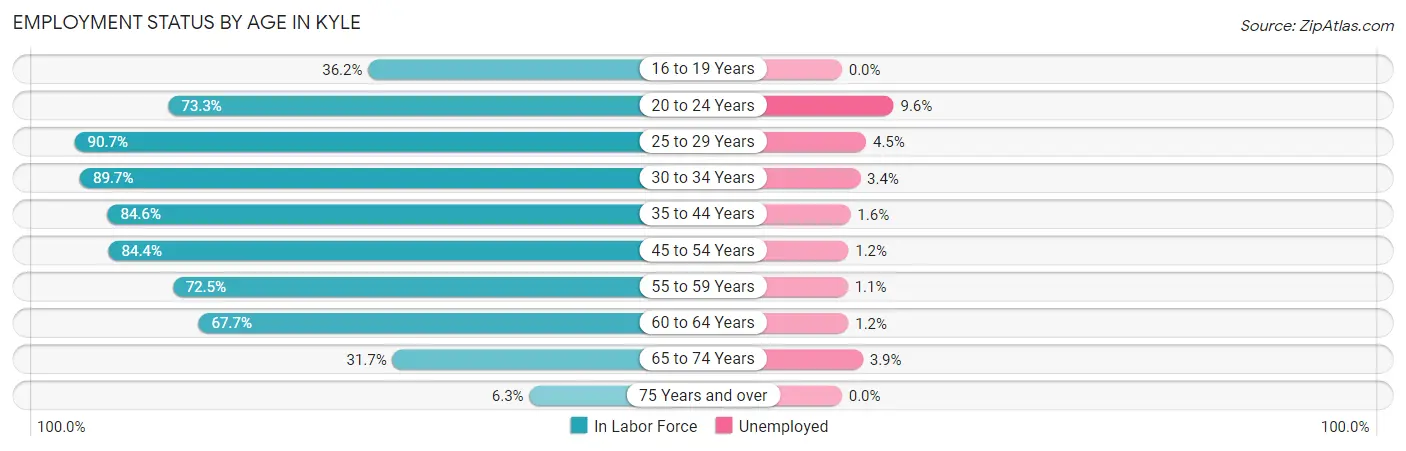
| Age Bracket | In Labor Force | Unemployed |
| 16 to 19 Years | 895 (36.2%) | 0 (0.0%) |
| 20 to 24 Years | 2,752 (73.3%) | 264 (9.6%) |
| 25 to 29 Years | 3,262 (90.7%) | 147 (4.5%) |
| 30 to 34 Years | 4,295 (89.7%) | 146 (3.4%) |
| 35 to 44 Years | 6,526 (84.6%) | 104 (1.6%) |
| 45 to 54 Years | 4,742 (84.4%) | 57 (1.2%) |
| 55 to 59 Years | 1,727 (72.5%) | 19 (1.1%) |
| 60 to 64 Years | 1,814 (67.7%) | 22 (1.2%) |
| 65 to 74 Years | 777 (31.7%) | 30 (3.9%) |
| 75 Years and over | 71 (6.3%) | 0 (0.0%) |
| Total | 26,852 (73.4%) | 806 (3.0%) |
Employment Status by Educational Attainment in Kyle
According to labor force statistics for Kyle, 83.5% of individuals (22,360) out of the total population between 25 and 64 years of age (26,778) are in the labor force, with 2.2% or 492 of them being unemployed. The group with the highest labor force participation rate are those with the educational attainment of bachelor's degree or higher, with 90.2% or 7,751 individuals in the labor force. Within the labor force, individuals with high school diploma education have the highest percentage of unemployment, with 3.2% or 171 of them being unemployed.
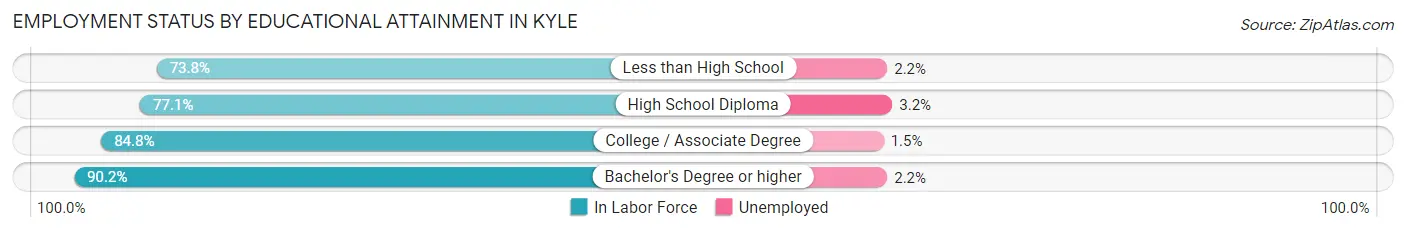
| Educational Attainment | In Labor Force | Unemployed |
| Less than High School | 1,788 (73.8%) | 53 (2.2%) |
| High School Diploma | 5,357 (77.1%) | 222 (3.2%) |
| College / Associate Degree | 7,474 (84.8%) | 132 (1.5%) |
| Bachelor's Degree or higher | 7,751 (90.2%) | 189 (2.2%) |
| Total | 22,360 (83.5%) | 589 (2.2%) |
Employment Occupations by Sex in Kyle
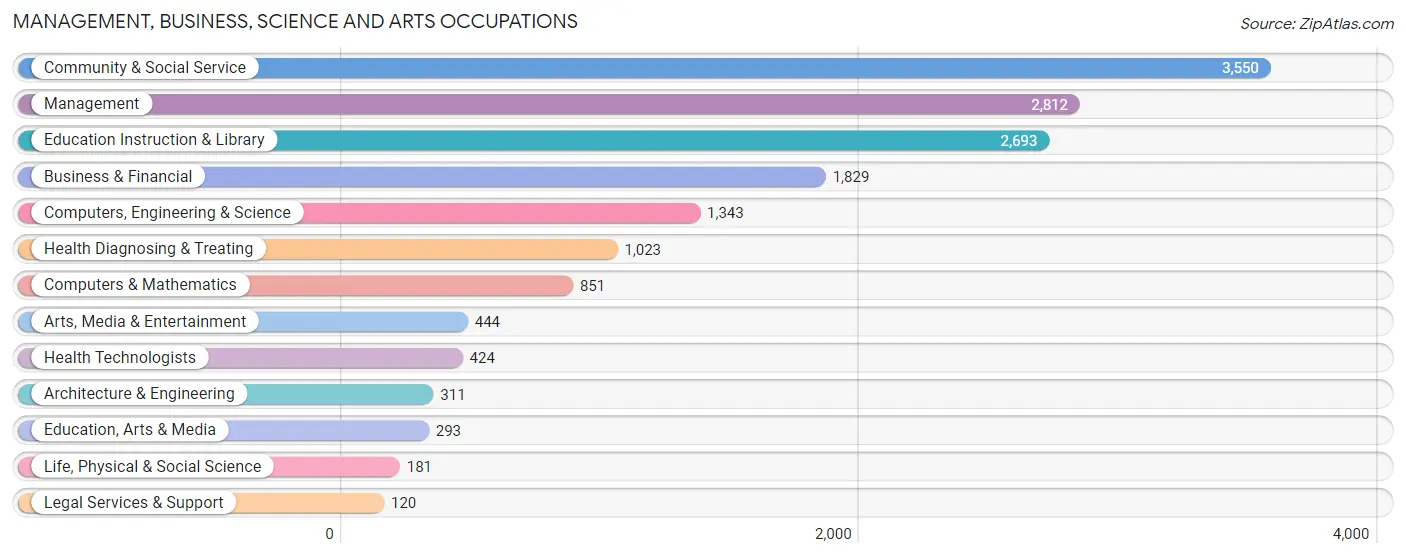
Management, Business, Science and Arts Occupations
The most common Management, Business, Science and Arts occupations in Kyle are Community & Social Service (3,550 | 13.7%), Management (2,812 | 10.8%), Education Instruction & Library (2,693 | 10.4%), Business & Financial (1,829 | 7.1%), and Computers, Engineering & Science (1,343 | 5.2%).
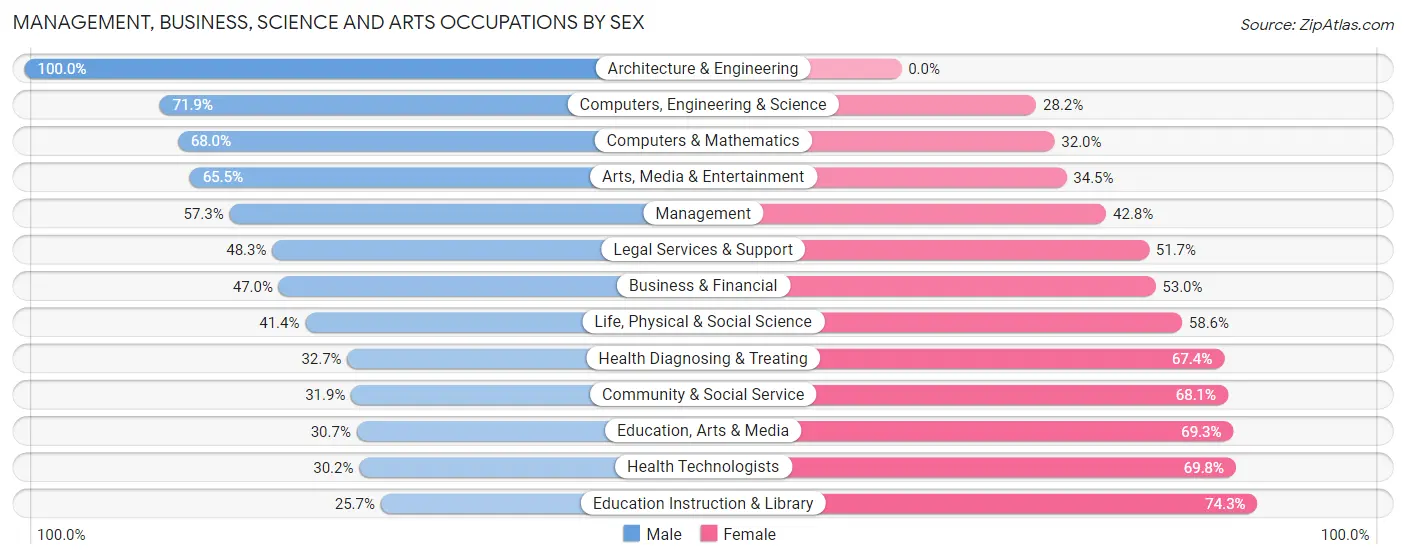
Management, Business, Science and Arts Occupations by Sex
Within the Management, Business, Science and Arts occupations in Kyle, the most male-oriented occupations are Architecture & Engineering (100.0%), Computers, Engineering & Science (71.9%), and Computers & Mathematics (68.0%), while the most female-oriented occupations are Education Instruction & Library (74.3%), Health Technologists (69.8%), and Education, Arts & Media (69.3%).
| Occupation | Male | Female |
| Management | 1,610 (57.3%) | 1,202 (42.7%) |
| Business & Financial | 859 (47.0%) | 970 (53.0%) |
| Computers, Engineering & Science | 965 (71.9%) | 378 (28.1%) |
| Computers & Mathematics | 579 (68.0%) | 272 (32.0%) |
| Architecture & Engineering | 311 (100.0%) | 0 (0.0%) |
| Life, Physical & Social Science | 75 (41.4%) | 106 (58.6%) |
| Community & Social Service | 1,131 (31.9%) | 2,419 (68.1%) |
| Education, Arts & Media | 90 (30.7%) | 203 (69.3%) |
| Legal Services & Support | 58 (48.3%) | 62 (51.7%) |
| Education Instruction & Library | 692 (25.7%) | 2,001 (74.3%) |
| Arts, Media & Entertainment | 291 (65.5%) | 153 (34.5%) |
| Health Diagnosing & Treating | 334 (32.7%) | 689 (67.3%) |
| Health Technologists | 128 (30.2%) | 296 (69.8%) |
| Total (Category) | 4,899 (46.4%) | 5,658 (53.6%) |
| Total (Overall) | 13,924 (53.7%) | 11,985 (46.3%) |
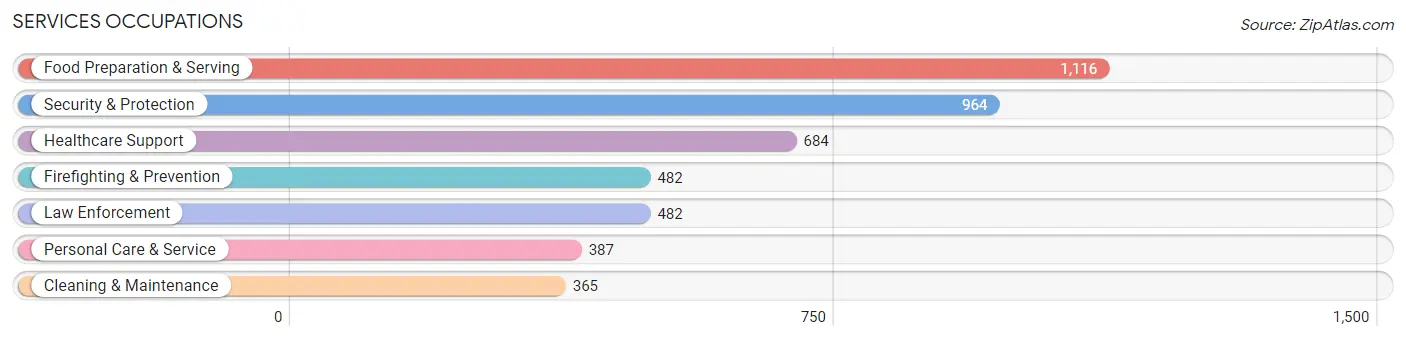
Services Occupations
The most common Services occupations in Kyle are Food Preparation & Serving (1,116 | 4.3%), Security & Protection (964 | 3.7%), Healthcare Support (684 | 2.6%), Firefighting & Prevention (482 | 1.9%), and Law Enforcement (482 | 1.9%).
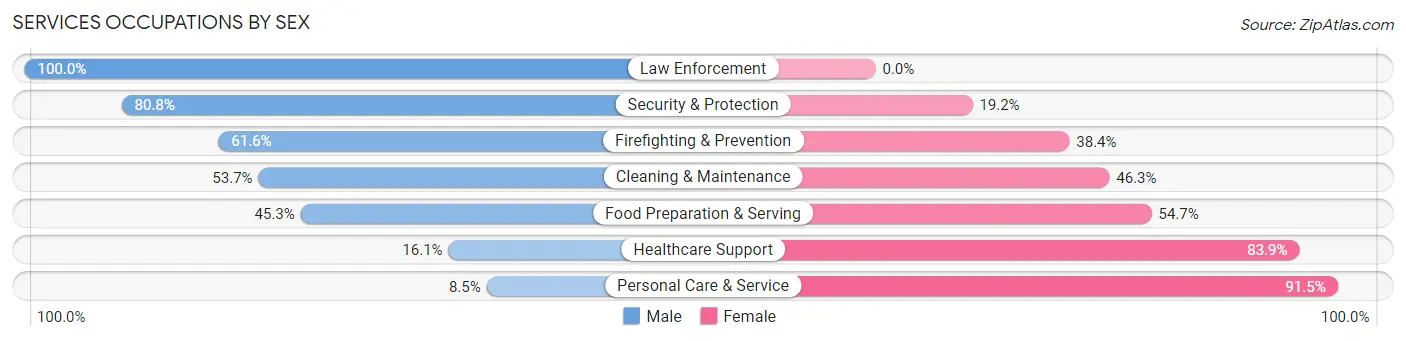
Services Occupations by Sex
Within the Services occupations in Kyle, the most male-oriented occupations are Law Enforcement (100.0%), Security & Protection (80.8%), and Firefighting & Prevention (61.6%), while the most female-oriented occupations are Personal Care & Service (91.5%), Healthcare Support (83.9%), and Food Preparation & Serving (54.7%).
| Occupation | Male | Female |
| Healthcare Support | 110 (16.1%) | 574 (83.9%) |
| Security & Protection | 779 (80.8%) | 185 (19.2%) |
| Firefighting & Prevention | 297 (61.6%) | 185 (38.4%) |
| Law Enforcement | 482 (100.0%) | 0 (0.0%) |
| Food Preparation & Serving | 506 (45.3%) | 610 (54.7%) |
| Cleaning & Maintenance | 196 (53.7%) | 169 (46.3%) |
| Personal Care & Service | 33 (8.5%) | 354 (91.5%) |
| Total (Category) | 1,624 (46.2%) | 1,892 (53.8%) |
| Total (Overall) | 13,924 (53.7%) | 11,985 (46.3%) |
Sales and Office Occupations
The most common Sales and Office occupations in Kyle are Office & Administration (3,028 | 11.7%), and Sales & Related (2,911 | 11.2%).

Sales and Office Occupations by Sex
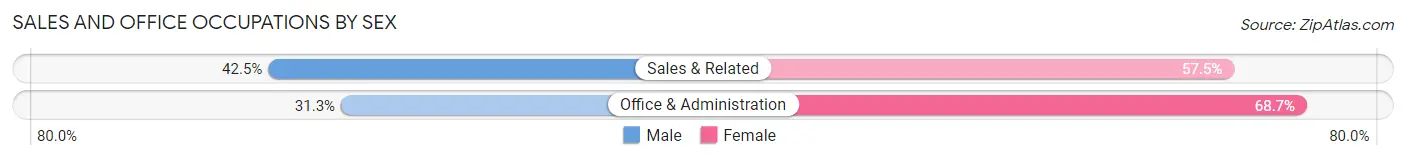
| Occupation | Male | Female |
| Sales & Related | 1,238 (42.5%) | 1,673 (57.5%) |
| Office & Administration | 949 (31.3%) | 2,079 (68.7%) |
| Total (Category) | 2,187 (36.8%) | 3,752 (63.2%) |
| Total (Overall) | 13,924 (53.7%) | 11,985 (46.3%) |
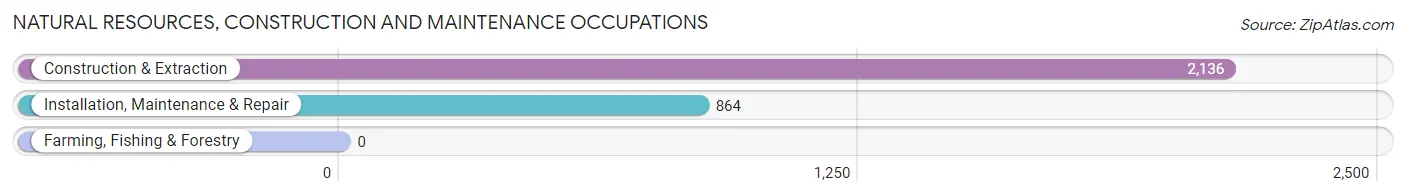
Natural Resources, Construction and Maintenance Occupations
The most common Natural Resources, Construction and Maintenance occupations in Kyle are Construction & Extraction (2,136 | 8.2%), and Installation, Maintenance & Repair (864 | 3.3%).
Natural Resources, Construction and Maintenance Occupations by Sex
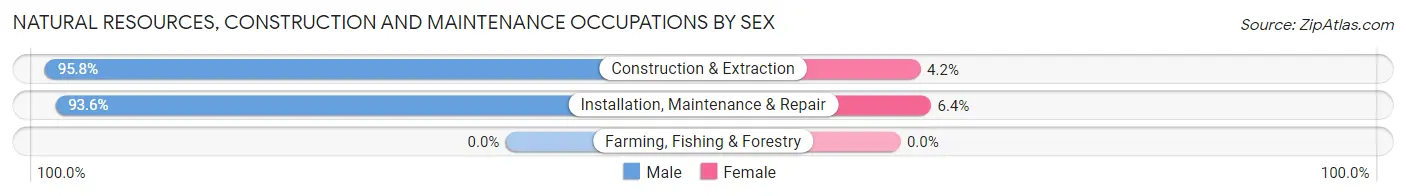
| Occupation | Male | Female |
| Farming, Fishing & Forestry | 0 (0.0%) | 0 (0.0%) |
| Construction & Extraction | 2,046 (95.8%) | 90 (4.2%) |
| Installation, Maintenance & Repair | 809 (93.6%) | 55 (6.4%) |
| Total (Category) | 2,855 (95.2%) | 145 (4.8%) |
| Total (Overall) | 13,924 (53.7%) | 11,985 (46.3%) |
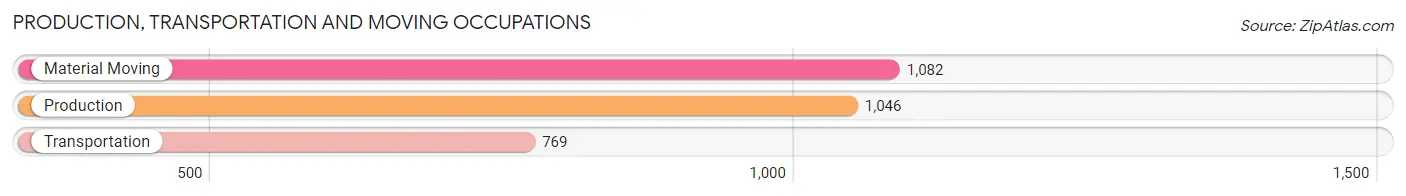
Production, Transportation and Moving Occupations
The most common Production, Transportation and Moving occupations in Kyle are Material Moving (1,082 | 4.2%), Production (1,046 | 4.0%), and Transportation (769 | 3.0%).
Production, Transportation and Moving Occupations by Sex
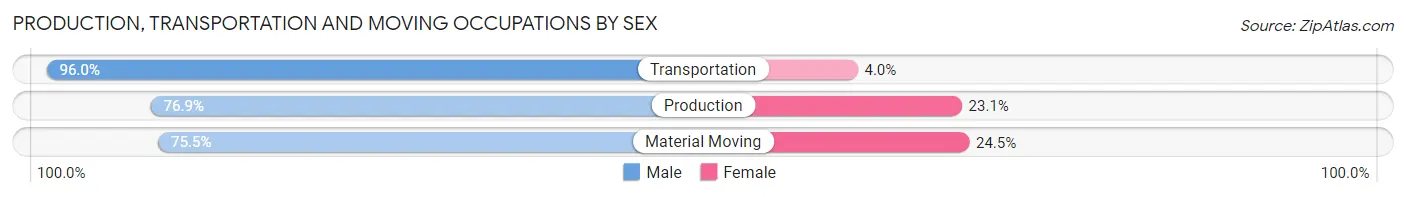
| Occupation | Male | Female |
| Production | 804 (76.9%) | 242 (23.1%) |
| Transportation | 738 (96.0%) | 31 (4.0%) |
| Material Moving | 817 (75.5%) | 265 (24.5%) |
| Total (Category) | 2,359 (81.4%) | 538 (18.6%) |
| Total (Overall) | 13,924 (53.7%) | 11,985 (46.3%) |
Employment Industries by Sex in Kyle
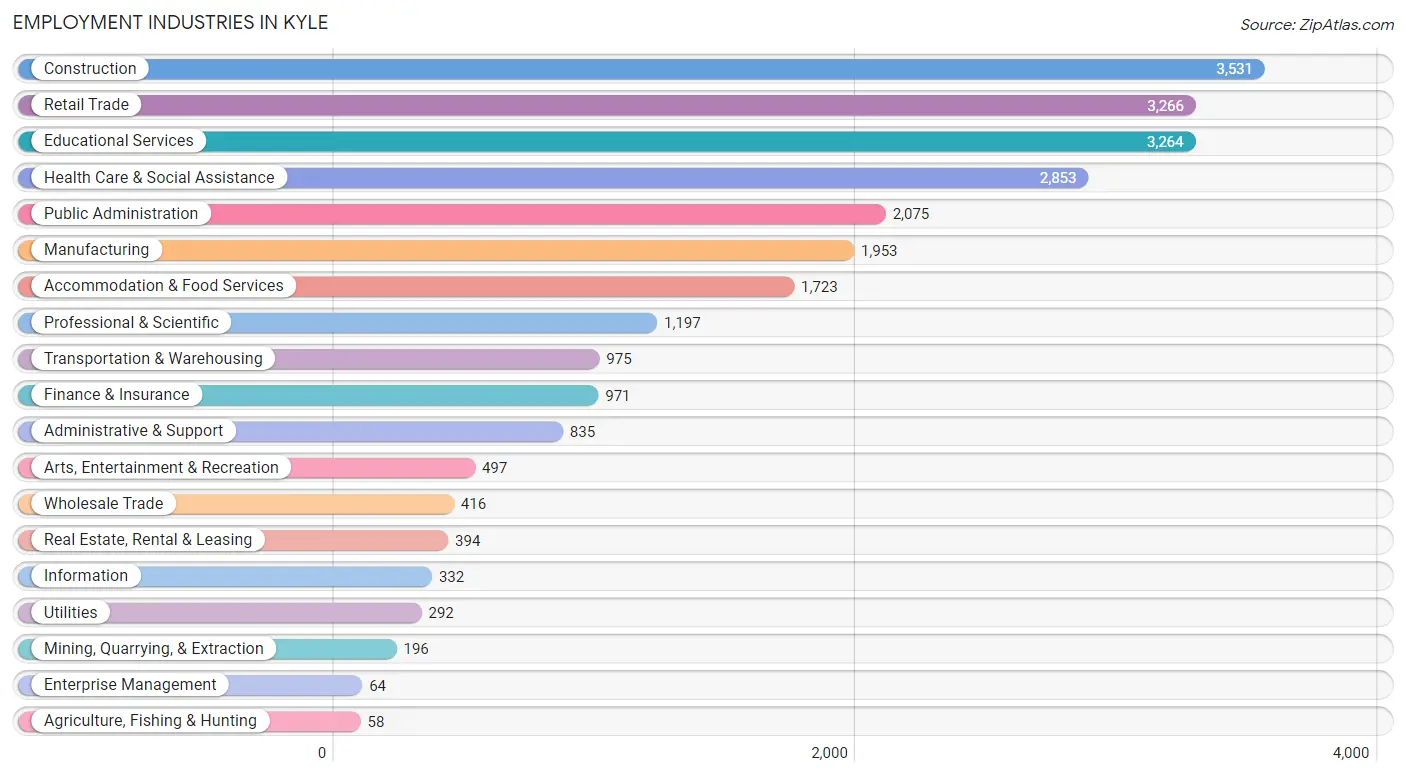
Employment Industries in Kyle
The major employment industries in Kyle include Construction (3,531 | 13.6%), Retail Trade (3,266 | 12.6%), Educational Services (3,264 | 12.6%), Health Care & Social Assistance (2,853 | 11.0%), and Public Administration (2,075 | 8.0%).
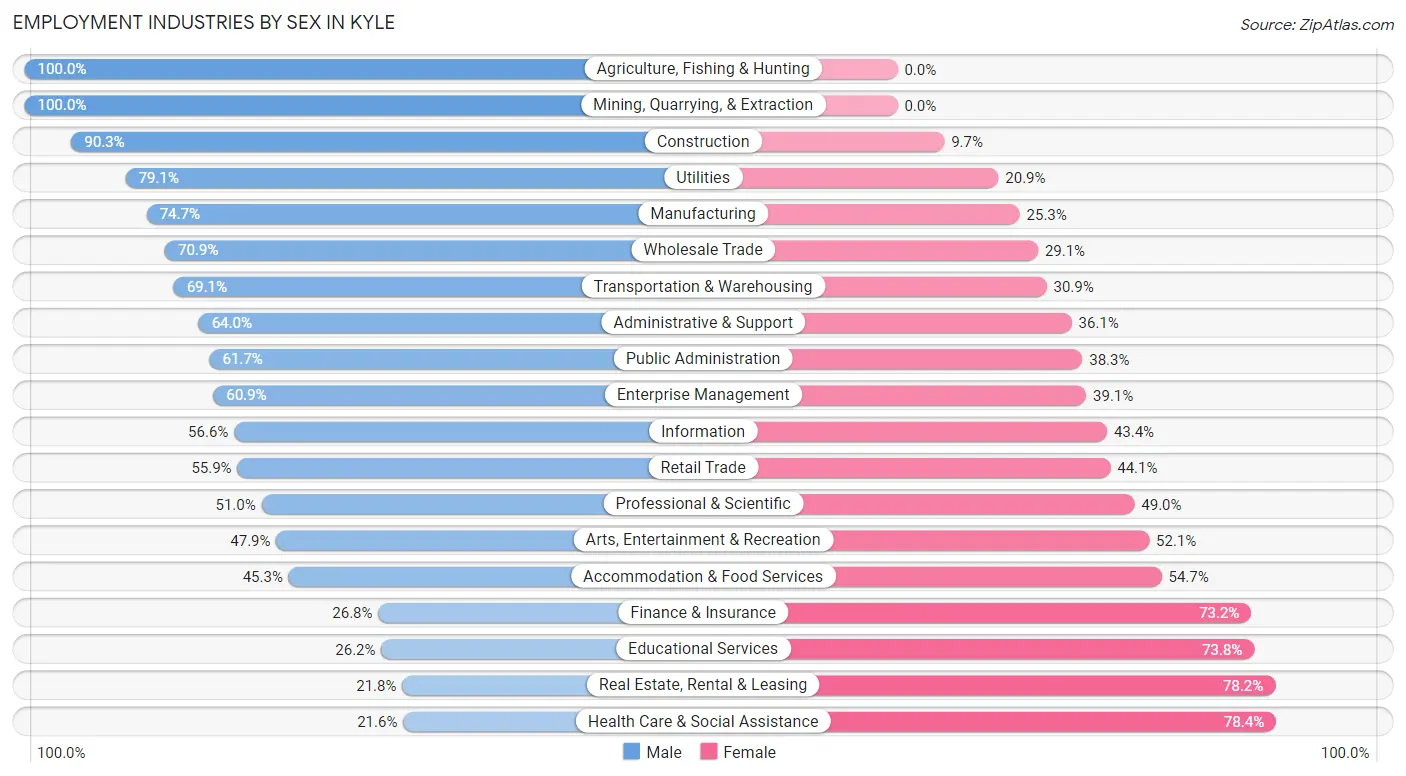
Employment Industries by Sex in Kyle
The Kyle industries that see more men than women are Agriculture, Fishing & Hunting (100.0%), Mining, Quarrying, & Extraction (100.0%), and Construction (90.3%), whereas the industries that tend to have a higher number of women are Health Care & Social Assistance (78.4%), Real Estate, Rental & Leasing (78.2%), and Educational Services (73.8%).
| Industry | Male | Female |
| Agriculture, Fishing & Hunting | 58 (100.0%) | 0 (0.0%) |
| Mining, Quarrying, & Extraction | 196 (100.0%) | 0 (0.0%) |
| Construction | 3,189 (90.3%) | 342 (9.7%) |
| Manufacturing | 1,459 (74.7%) | 494 (25.3%) |
| Wholesale Trade | 295 (70.9%) | 121 (29.1%) |
| Retail Trade | 1,827 (55.9%) | 1,439 (44.1%) |
| Transportation & Warehousing | 674 (69.1%) | 301 (30.9%) |
| Utilities | 231 (79.1%) | 61 (20.9%) |
| Information | 188 (56.6%) | 144 (43.4%) |
| Finance & Insurance | 260 (26.8%) | 711 (73.2%) |
| Real Estate, Rental & Leasing | 86 (21.8%) | 308 (78.2%) |
| Professional & Scientific | 610 (51.0%) | 587 (49.0%) |
| Enterprise Management | 39 (60.9%) | 25 (39.1%) |
| Administrative & Support | 534 (63.9%) | 301 (36.0%) |
| Educational Services | 854 (26.2%) | 2,410 (73.8%) |
| Health Care & Social Assistance | 617 (21.6%) | 2,236 (78.4%) |
| Arts, Entertainment & Recreation | 238 (47.9%) | 259 (52.1%) |
| Accommodation & Food Services | 781 (45.3%) | 942 (54.7%) |
| Public Administration | 1,281 (61.7%) | 794 (38.3%) |
| Total | 13,924 (53.7%) | 11,985 (46.3%) |
Education in Kyle
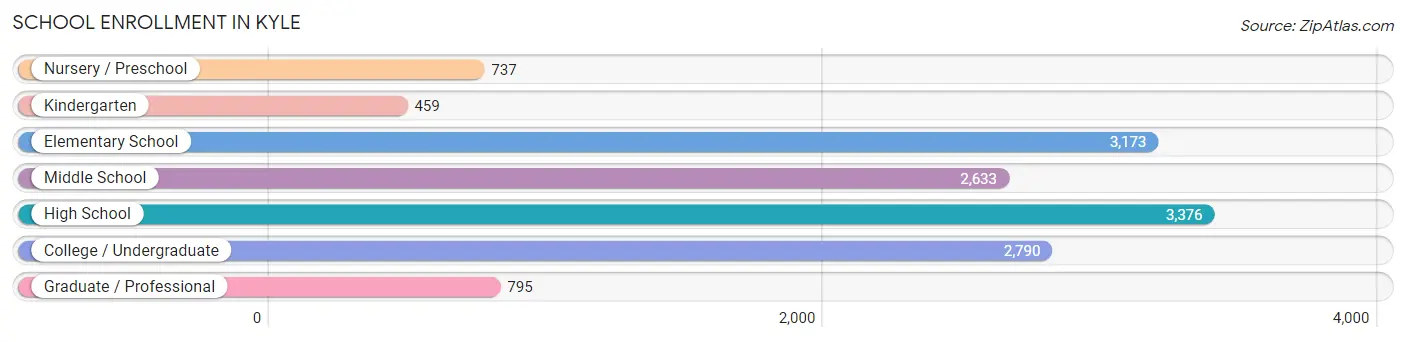
School Enrollment in Kyle
The most common levels of schooling among the 13,963 students in Kyle are high school (3,376 | 24.2%), elementary school (3,173 | 22.7%), and college / undergraduate (2,790 | 20.0%).
| School Level | # Students | % Students |
| Nursery / Preschool | 737 | 5.3% |
| Kindergarten | 459 | 3.3% |
| Elementary School | 3,173 | 22.7% |
| Middle School | 2,633 | 18.9% |
| High School | 3,376 | 24.2% |
| College / Undergraduate | 2,790 | 20.0% |
| Graduate / Professional | 795 | 5.7% |
| Total | 13,963 | 100.0% |
School Enrollment by Age by Funding Source in Kyle
Out of a total of 13,963 students who are enrolled in schools in Kyle, 1,745 (12.5%) attend a private institution, while the remaining 12,218 (87.5%) are enrolled in public schools. The age group of 35 years and over has the highest likelihood of being enrolled in private schools, with 545 (53.8% in the age bracket) enrolled. Conversely, the age group of 25 to 34 year olds has the lowest likelihood of being enrolled in a private school, with 777 (97.9% in the age bracket) attending a public institution.
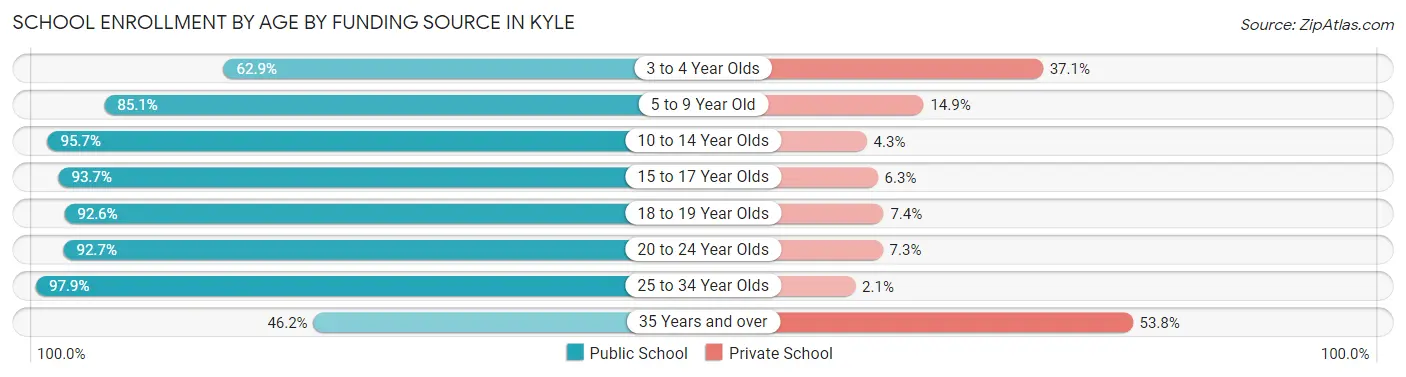
| Age Bracket | Public School | Private School |
| 3 to 4 Year Olds | 358 (62.9%) | 211 (37.1%) |
| 5 to 9 Year Old | 2,793 (85.1%) | 488 (14.9%) |
| 10 to 14 Year Olds | 3,151 (95.7%) | 141 (4.3%) |
| 15 to 17 Year Olds | 2,574 (93.7%) | 174 (6.3%) |
| 18 to 19 Year Olds | 900 (92.6%) | 72 (7.4%) |
| 20 to 24 Year Olds | 1,200 (92.7%) | 94 (7.3%) |
| 25 to 34 Year Olds | 777 (97.9%) | 17 (2.1%) |
| 35 Years and over | 468 (46.2%) | 545 (53.8%) |
| Total | 12,218 (87.5%) | 1,745 (12.5%) |
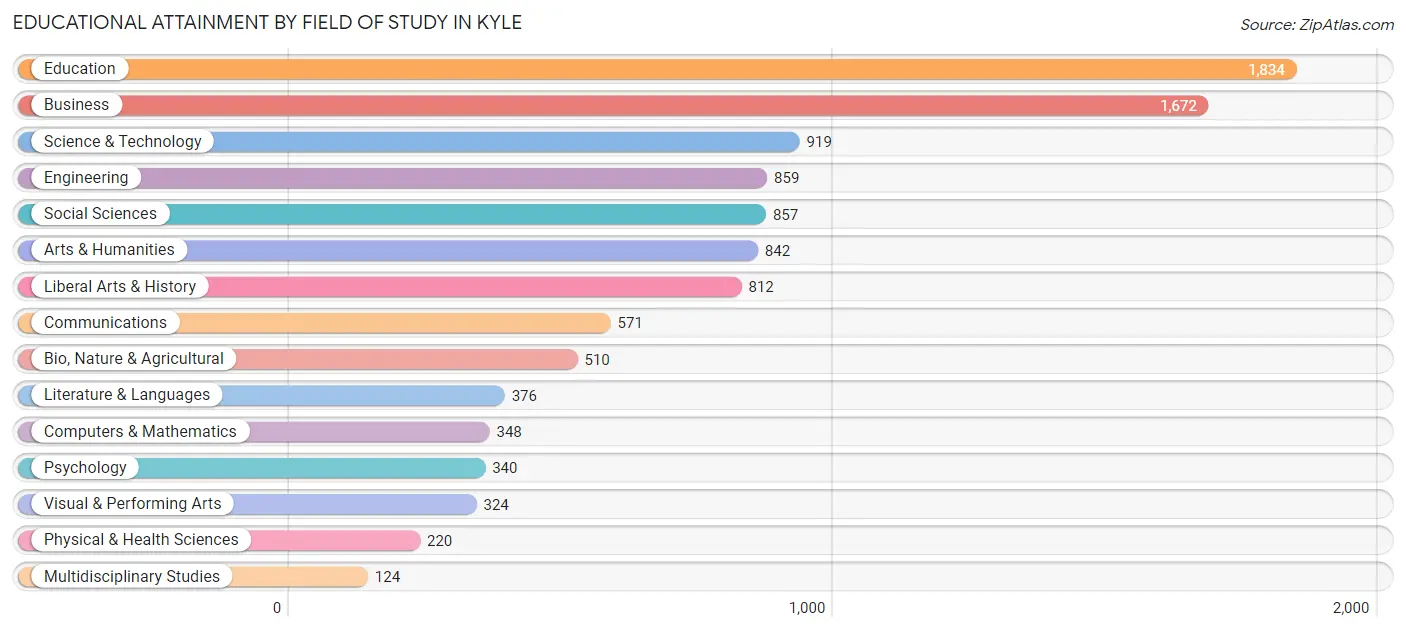
Educational Attainment by Field of Study in Kyle
Education (1,834 | 17.3%), business (1,672 | 15.8%), science & technology (919 | 8.7%), engineering (859 | 8.1%), and social sciences (857 | 8.1%) are the most common fields of study among 10,608 individuals in Kyle who have obtained a bachelor's degree or higher.
| Field of Study | # Graduates | % Graduates |
| Computers & Mathematics | 348 | 3.3% |
| Bio, Nature & Agricultural | 510 | 4.8% |
| Physical & Health Sciences | 220 | 2.1% |
| Psychology | 340 | 3.2% |
| Social Sciences | 857 | 8.1% |
| Engineering | 859 | 8.1% |
| Multidisciplinary Studies | 124 | 1.2% |
| Science & Technology | 919 | 8.7% |
| Business | 1,672 | 15.8% |
| Education | 1,834 | 17.3% |
| Literature & Languages | 376 | 3.5% |
| Liberal Arts & History | 812 | 7.6% |
| Visual & Performing Arts | 324 | 3.0% |
| Communications | 571 | 5.4% |
| Arts & Humanities | 842 | 7.9% |
| Total | 10,608 | 100.0% |
Transportation & Commute in Kyle
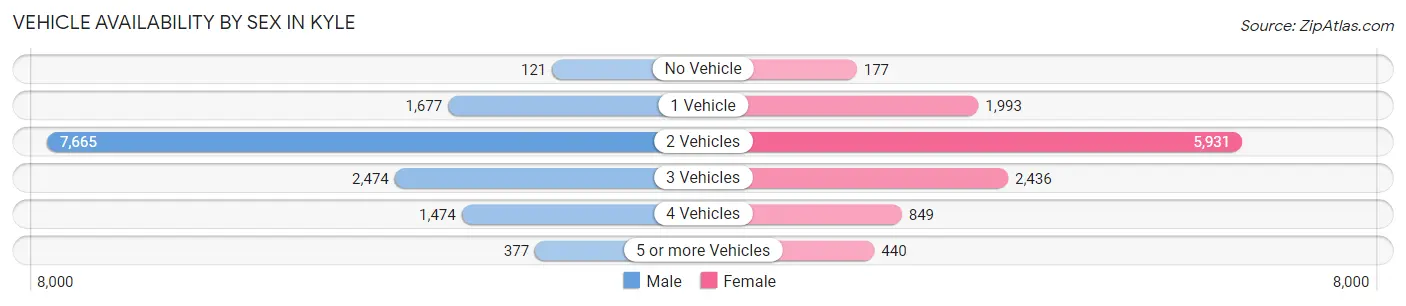
Vehicle Availability by Sex in Kyle
The most prevalent vehicle ownership categories in Kyle are males with 2 vehicles (7,665, accounting for 55.6%) and females with 2 vehicles (5,931, making up 64.8%).
| Vehicles Available | Male | Female |
| No Vehicle | 121 (0.9%) | 177 (1.5%) |
| 1 Vehicle | 1,677 (12.2%) | 1,993 (16.9%) |
| 2 Vehicles | 7,665 (55.6%) | 5,931 (50.1%) |
| 3 Vehicles | 2,474 (17.9%) | 2,436 (20.6%) |
| 4 Vehicles | 1,474 (10.7%) | 849 (7.2%) |
| 5 or more Vehicles | 377 (2.7%) | 440 (3.7%) |
| Total | 13,788 (100.0%) | 11,826 (100.0%) |
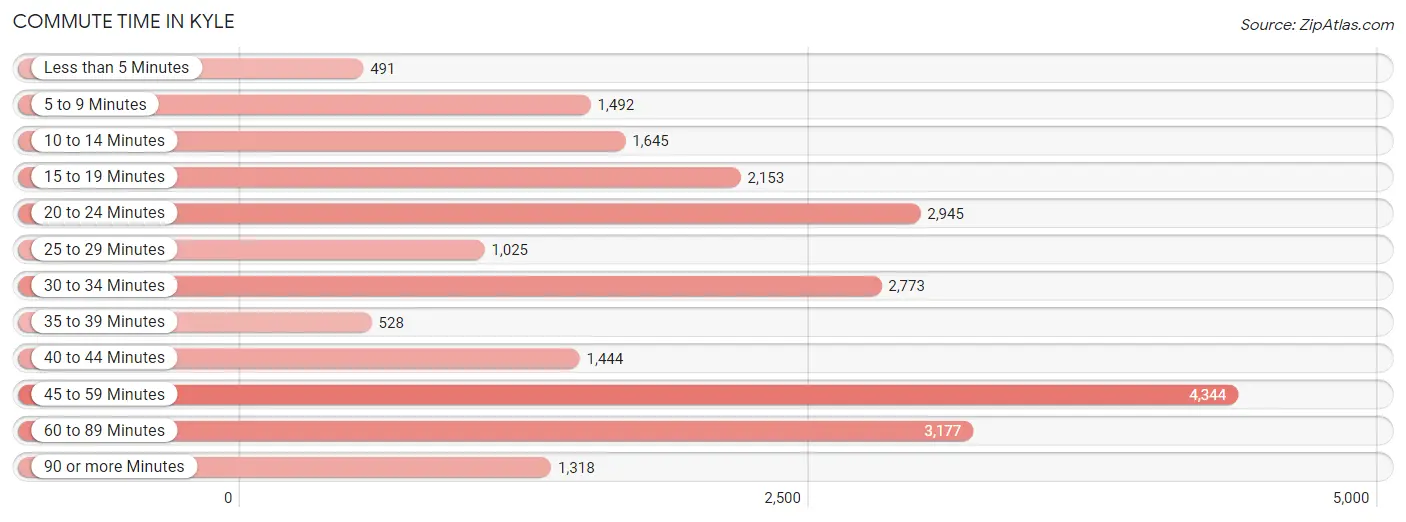
Commute Time in Kyle
The most frequently occuring commute durations in Kyle are 45 to 59 minutes (4,344 commuters, 18.6%), 60 to 89 minutes (3,177 commuters, 13.6%), and 20 to 24 minutes (2,945 commuters, 12.6%).
| Commute Time | # Commuters | % Commuters |
| Less than 5 Minutes | 491 | 2.1% |
| 5 to 9 Minutes | 1,492 | 6.4% |
| 10 to 14 Minutes | 1,645 | 7.0% |
| 15 to 19 Minutes | 2,153 | 9.2% |
| 20 to 24 Minutes | 2,945 | 12.6% |
| 25 to 29 Minutes | 1,025 | 4.4% |
| 30 to 34 Minutes | 2,773 | 11.9% |
| 35 to 39 Minutes | 528 | 2.3% |
| 40 to 44 Minutes | 1,444 | 6.2% |
| 45 to 59 Minutes | 4,344 | 18.6% |
| 60 to 89 Minutes | 3,177 | 13.6% |
| 90 or more Minutes | 1,318 | 5.7% |
Commute Time by Sex in Kyle
The most common commute times in Kyle are 45 to 59 minutes (2,155 commuters, 16.9%) for males and 45 to 59 minutes (2,189 commuters, 20.7%) for females.
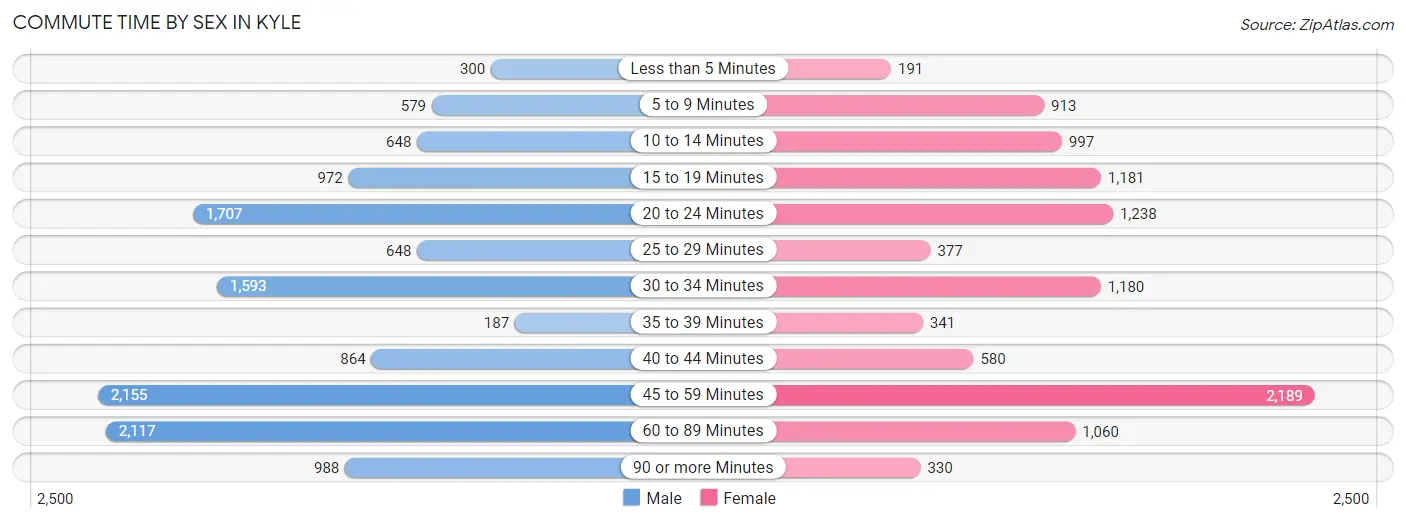
| Commute Time | Male | Female |
| Less than 5 Minutes | 300 (2.4%) | 191 (1.8%) |
| 5 to 9 Minutes | 579 (4.5%) | 913 (8.6%) |
| 10 to 14 Minutes | 648 (5.1%) | 997 (9.4%) |
| 15 to 19 Minutes | 972 (7.6%) | 1,181 (11.2%) |
| 20 to 24 Minutes | 1,707 (13.4%) | 1,238 (11.7%) |
| 25 to 29 Minutes | 648 (5.1%) | 377 (3.6%) |
| 30 to 34 Minutes | 1,593 (12.5%) | 1,180 (11.2%) |
| 35 to 39 Minutes | 187 (1.5%) | 341 (3.2%) |
| 40 to 44 Minutes | 864 (6.8%) | 580 (5.5%) |
| 45 to 59 Minutes | 2,155 (16.9%) | 2,189 (20.7%) |
| 60 to 89 Minutes | 2,117 (16.6%) | 1,060 (10.0%) |
| 90 or more Minutes | 988 (7.7%) | 330 (3.1%) |
Time of Departure to Work by Sex in Kyle
The most frequent times of departure to work in Kyle are 7:00 AM to 7:29 AM (2,157, 16.9%) for males and 7:00 AM to 7:29 AM (1,517, 14.3%) for females.
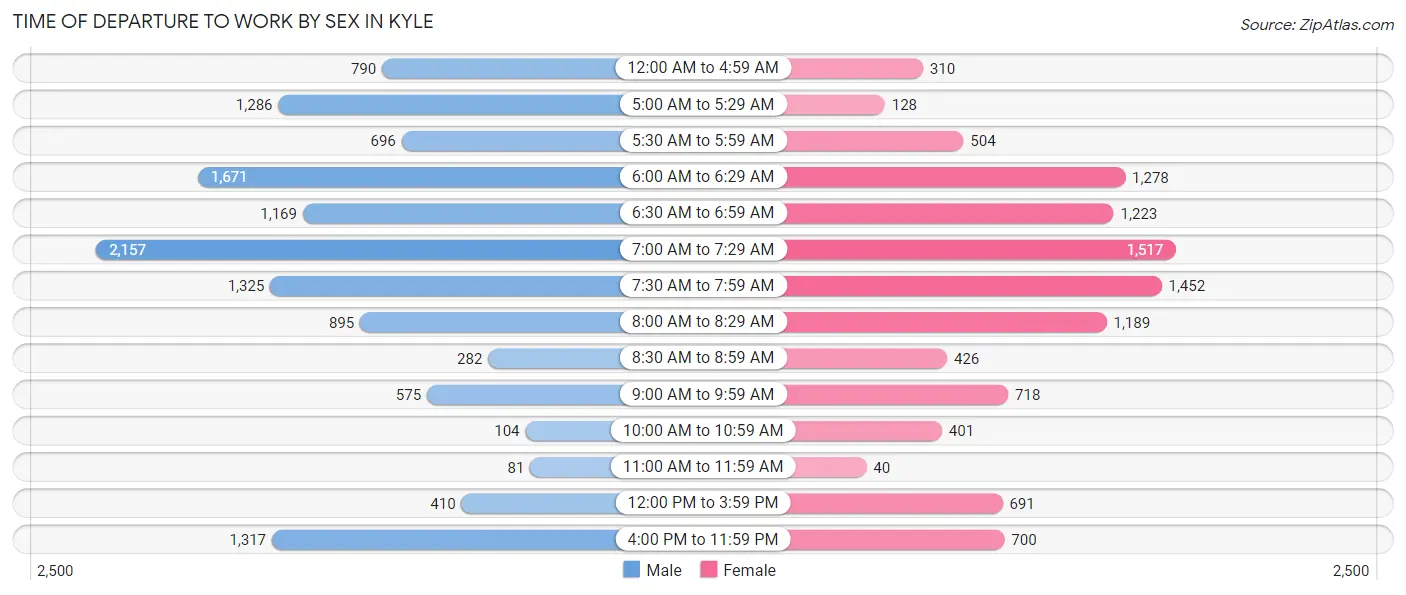
| Time of Departure | Male | Female |
| 12:00 AM to 4:59 AM | 790 (6.2%) | 310 (2.9%) |
| 5:00 AM to 5:29 AM | 1,286 (10.1%) | 128 (1.2%) |
| 5:30 AM to 5:59 AM | 696 (5.5%) | 504 (4.8%) |
| 6:00 AM to 6:29 AM | 1,671 (13.1%) | 1,278 (12.1%) |
| 6:30 AM to 6:59 AM | 1,169 (9.2%) | 1,223 (11.6%) |
| 7:00 AM to 7:29 AM | 2,157 (16.9%) | 1,517 (14.3%) |
| 7:30 AM to 7:59 AM | 1,325 (10.4%) | 1,452 (13.7%) |
| 8:00 AM to 8:29 AM | 895 (7.0%) | 1,189 (11.2%) |
| 8:30 AM to 8:59 AM | 282 (2.2%) | 426 (4.0%) |
| 9:00 AM to 9:59 AM | 575 (4.5%) | 718 (6.8%) |
| 10:00 AM to 10:59 AM | 104 (0.8%) | 401 (3.8%) |
| 11:00 AM to 11:59 AM | 81 (0.6%) | 40 (0.4%) |
| 12:00 PM to 3:59 PM | 410 (3.2%) | 691 (6.5%) |
| 4:00 PM to 11:59 PM | 1,317 (10.3%) | 700 (6.6%) |
| Total | 12,758 (100.0%) | 10,577 (100.0%) |
Housing Occupancy in Kyle
Occupancy by Ownership in Kyle
Of the total 17,316 dwellings in Kyle, owner-occupied units account for 11,558 (66.7%), while renter-occupied units make up 5,758 (33.3%).
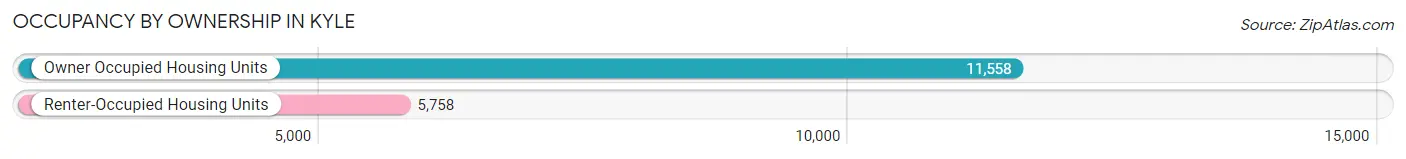
| Occupancy | # Housing Units | % Housing Units |
| Owner Occupied Housing Units | 11,558 | 66.7% |
| Renter-Occupied Housing Units | 5,758 | 33.3% |
| Total Occupied Housing Units | 17,316 | 100.0% |
Occupancy by Household Size in Kyle
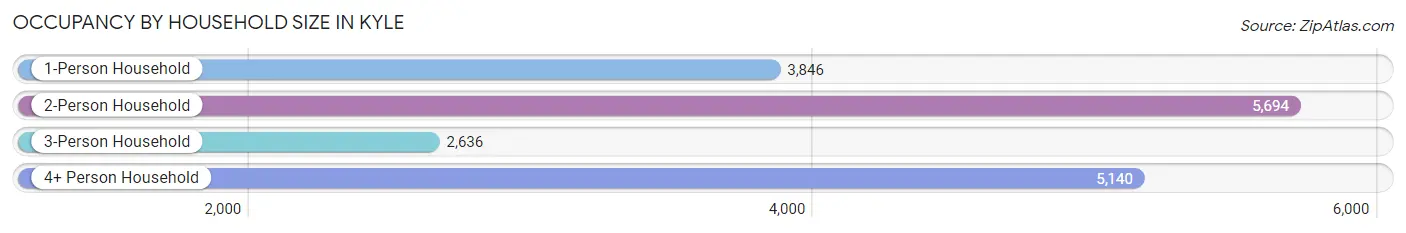
| Household Size | # Housing Units | % Housing Units |
| 1-Person Household | 3,846 | 22.2% |
| 2-Person Household | 5,694 | 32.9% |
| 3-Person Household | 2,636 | 15.2% |
| 4+ Person Household | 5,140 | 29.7% |
| Total Housing Units | 17,316 | 100.0% |
Occupancy by Ownership by Household Size in Kyle
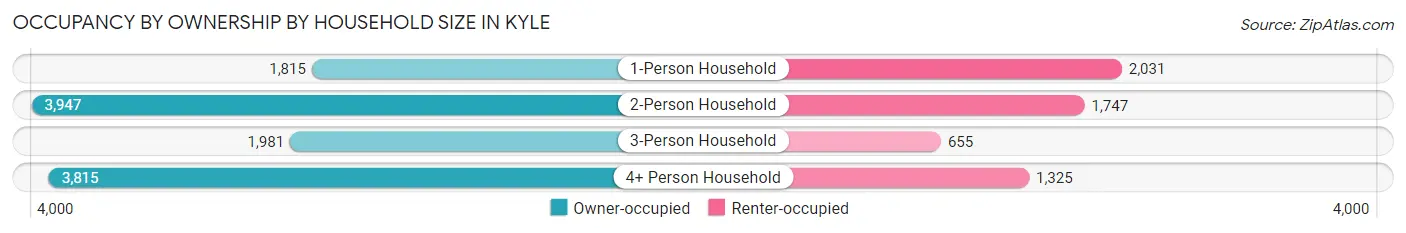
| Household Size | Owner-occupied | Renter-occupied |
| 1-Person Household | 1,815 (47.2%) | 2,031 (52.8%) |
| 2-Person Household | 3,947 (69.3%) | 1,747 (30.7%) |
| 3-Person Household | 1,981 (75.1%) | 655 (24.8%) |
| 4+ Person Household | 3,815 (74.2%) | 1,325 (25.8%) |
| Total Housing Units | 11,558 (66.7%) | 5,758 (33.3%) |
Occupancy by Educational Attainment in Kyle
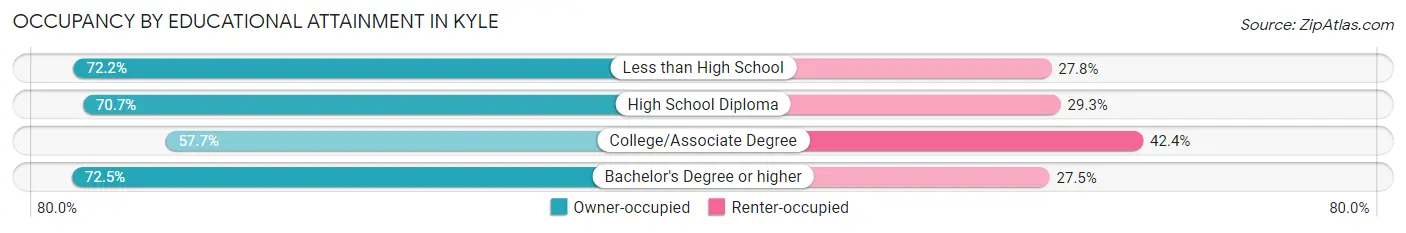
| Household Size | Owner-occupied | Renter-occupied |
| Less than High School | 655 (72.2%) | 252 (27.8%) |
| High School Diploma | 2,592 (70.7%) | 1,072 (29.3%) |
| College/Associate Degree | 3,605 (57.7%) | 2,648 (42.3%) |
| Bachelor's Degree or higher | 4,706 (72.5%) | 1,786 (27.5%) |
Occupancy by Age of Householder in Kyle
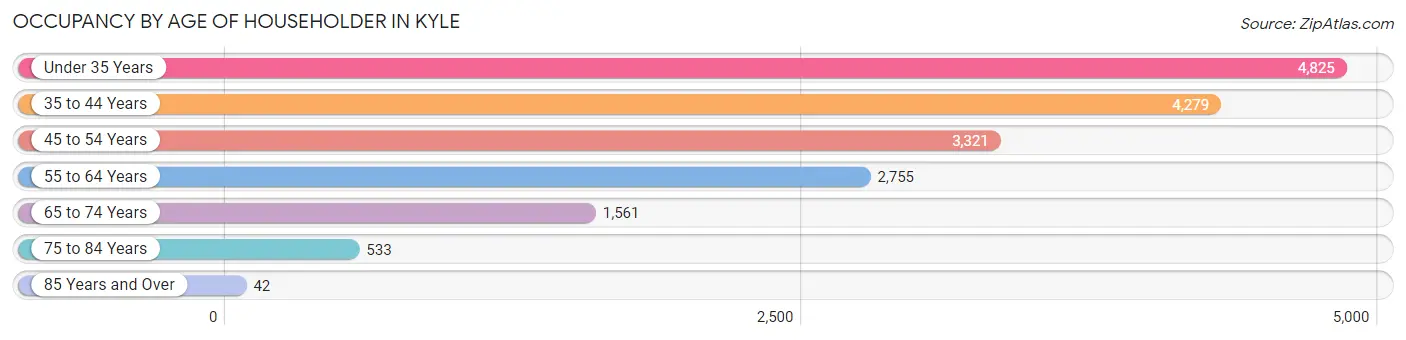
| Age Bracket | # Households | % Households |
| Under 35 Years | 4,825 | 27.9% |
| 35 to 44 Years | 4,279 | 24.7% |
| 45 to 54 Years | 3,321 | 19.2% |
| 55 to 64 Years | 2,755 | 15.9% |
| 65 to 74 Years | 1,561 | 9.0% |
| 75 to 84 Years | 533 | 3.1% |
| 85 Years and Over | 42 | 0.2% |
| Total | 17,316 | 100.0% |
Housing Finances in Kyle
Median Income by Occupancy in Kyle
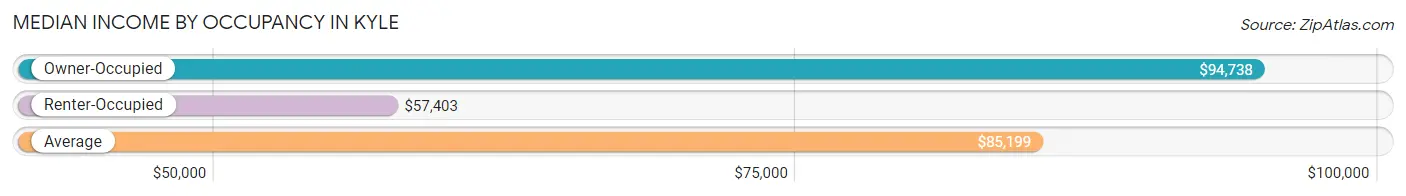
| Occupancy Type | # Households | Median Income |
| Owner-Occupied | 11,558 (66.7%) | $94,738 |
| Renter-Occupied | 5,758 (33.3%) | $57,403 |
| Average | 17,316 (100.0%) | $85,199 |
Occupancy by Householder Income Bracket in Kyle
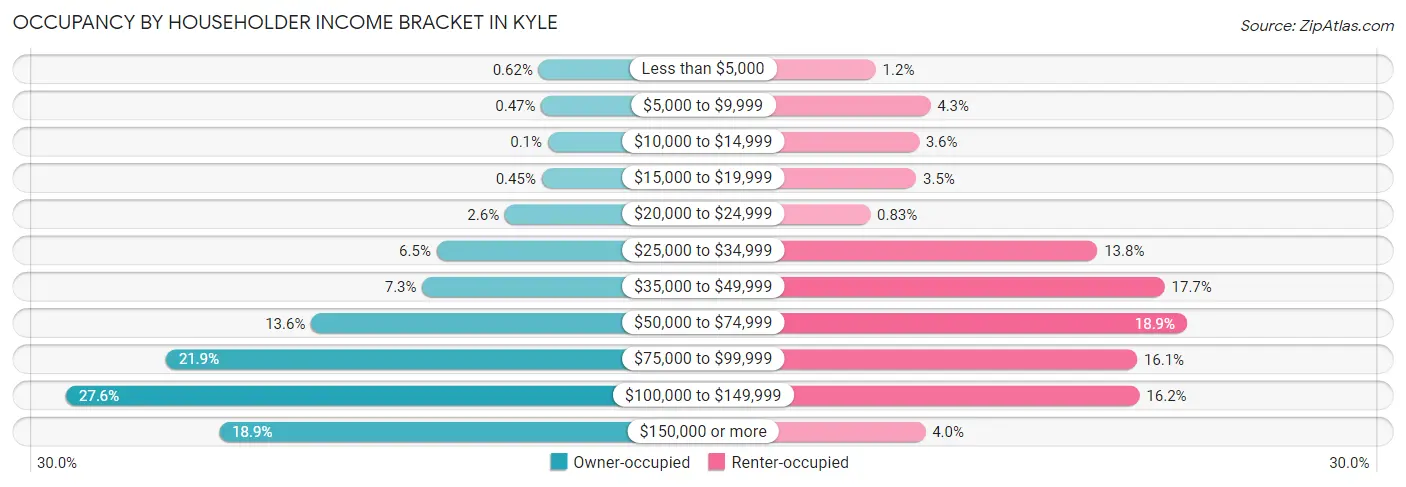
| Income Bracket | Owner-occupied | Renter-occupied |
| Less than $5,000 | 72 (0.6%) | 66 (1.1%) |
| $5,000 to $9,999 | 54 (0.5%) | 246 (4.3%) |
| $10,000 to $14,999 | 12 (0.1%) | 208 (3.6%) |
| $15,000 to $19,999 | 52 (0.4%) | 199 (3.5%) |
| $20,000 to $24,999 | 295 (2.5%) | 48 (0.8%) |
| $25,000 to $34,999 | 746 (6.5%) | 795 (13.8%) |
| $35,000 to $49,999 | 840 (7.3%) | 1,017 (17.7%) |
| $50,000 to $74,999 | 1,574 (13.6%) | 1,090 (18.9%) |
| $75,000 to $99,999 | 2,535 (21.9%) | 926 (16.1%) |
| $100,000 to $149,999 | 3,195 (27.6%) | 934 (16.2%) |
| $150,000 or more | 2,183 (18.9%) | 229 (4.0%) |
| Total | 11,558 (100.0%) | 5,758 (100.0%) |
Monthly Housing Cost Tiers in Kyle
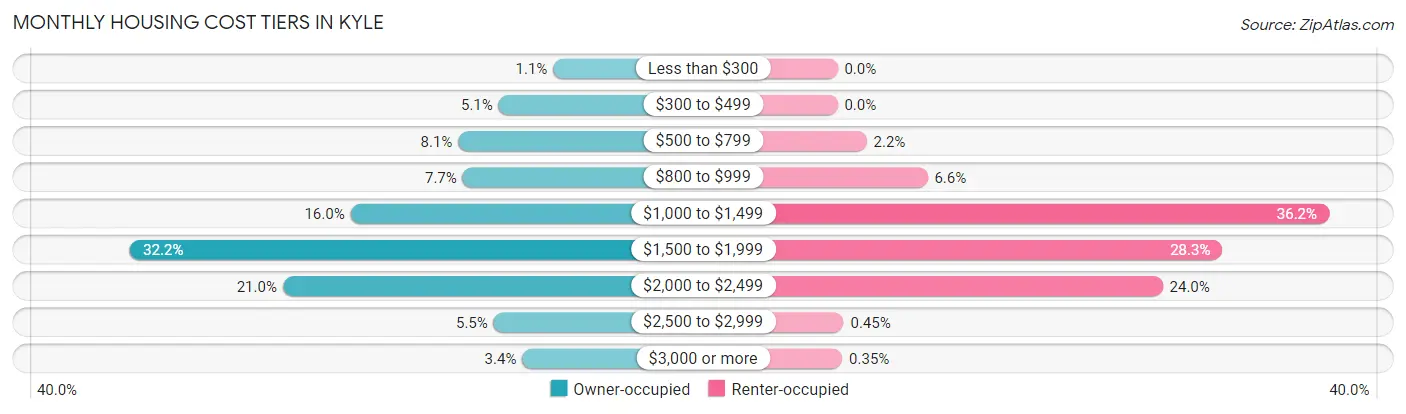
| Monthly Cost | Owner-occupied | Renter-occupied |
| Less than $300 | 124 (1.1%) | 0 (0.0%) |
| $300 to $499 | 588 (5.1%) | 0 (0.0%) |
| $500 to $799 | 933 (8.1%) | 124 (2.1%) |
| $800 to $999 | 895 (7.7%) | 382 (6.6%) |
| $1,000 to $1,499 | 1,849 (16.0%) | 2,084 (36.2%) |
| $1,500 to $1,999 | 3,725 (32.2%) | 1,632 (28.3%) |
| $2,000 to $2,499 | 2,426 (21.0%) | 1,379 (23.9%) |
| $2,500 to $2,999 | 631 (5.5%) | 26 (0.4%) |
| $3,000 or more | 387 (3.4%) | 20 (0.4%) |
| Total | 11,558 (100.0%) | 5,758 (100.0%) |
Physical Housing Characteristics in Kyle
Housing Structures in Kyle
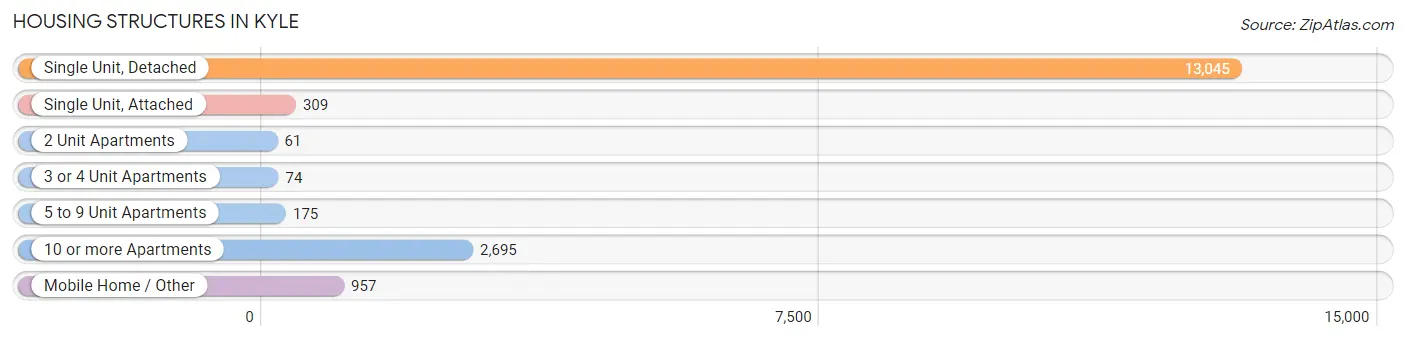
| Structure Type | # Housing Units | % Housing Units |
| Single Unit, Detached | 13,045 | 75.3% |
| Single Unit, Attached | 309 | 1.8% |
| 2 Unit Apartments | 61 | 0.4% |
| 3 or 4 Unit Apartments | 74 | 0.4% |
| 5 to 9 Unit Apartments | 175 | 1.0% |
| 10 or more Apartments | 2,695 | 15.6% |
| Mobile Home / Other | 957 | 5.5% |
| Total | 17,316 | 100.0% |
Housing Structures by Occupancy in Kyle
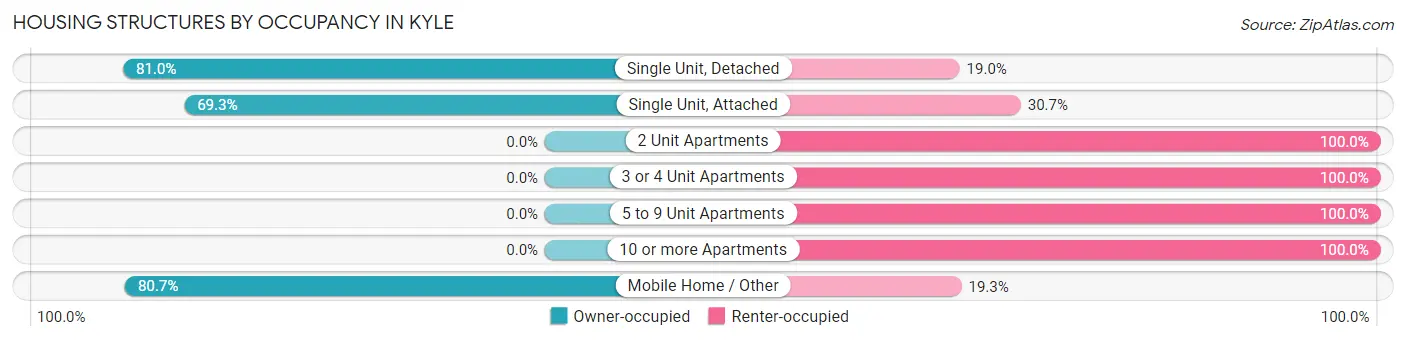
| Structure Type | Owner-occupied | Renter-occupied |
| Single Unit, Detached | 10,572 (81.0%) | 2,473 (19.0%) |
| Single Unit, Attached | 214 (69.3%) | 95 (30.7%) |
| 2 Unit Apartments | 0 (0.0%) | 61 (100.0%) |
| 3 or 4 Unit Apartments | 0 (0.0%) | 74 (100.0%) |
| 5 to 9 Unit Apartments | 0 (0.0%) | 175 (100.0%) |
| 10 or more Apartments | 0 (0.0%) | 2,695 (100.0%) |
| Mobile Home / Other | 772 (80.7%) | 185 (19.3%) |
| Total | 11,558 (66.7%) | 5,758 (33.3%) |
Housing Structures by Number of Rooms in Kyle
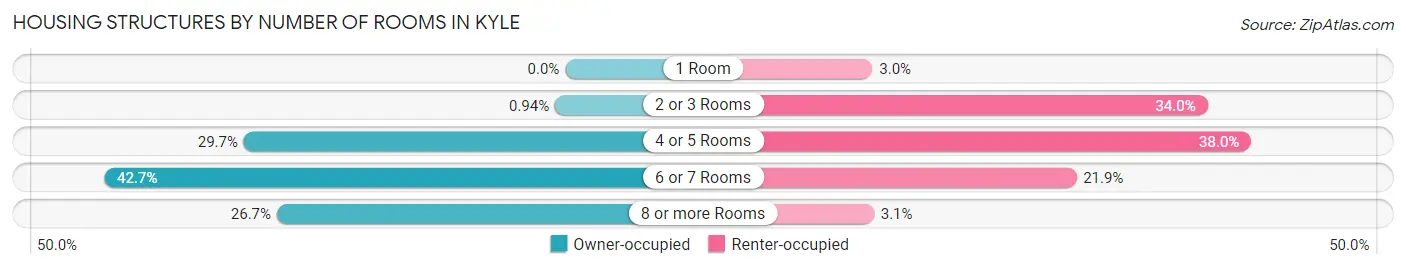
| Number of Rooms | Owner-occupied | Renter-occupied |
| 1 Room | 0 (0.0%) | 173 (3.0%) |
| 2 or 3 Rooms | 109 (0.9%) | 1,957 (34.0%) |
| 4 or 5 Rooms | 3,436 (29.7%) | 2,190 (38.0%) |
| 6 or 7 Rooms | 4,930 (42.6%) | 1,258 (21.8%) |
| 8 or more Rooms | 3,083 (26.7%) | 180 (3.1%) |
| Total | 11,558 (100.0%) | 5,758 (100.0%) |
Housing Structure by Heating Type in Kyle
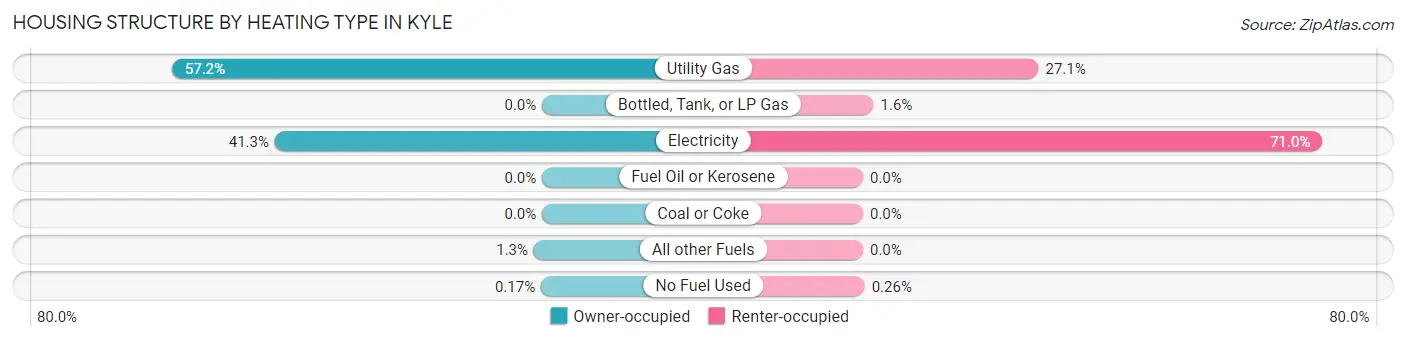
| Heating Type | Owner-occupied | Renter-occupied |
| Utility Gas | 6,615 (57.2%) | 1,562 (27.1%) |
| Bottled, Tank, or LP Gas | 0 (0.0%) | 94 (1.6%) |
| Electricity | 4,776 (41.3%) | 4,087 (71.0%) |
| Fuel Oil or Kerosene | 0 (0.0%) | 0 (0.0%) |
| Coal or Coke | 0 (0.0%) | 0 (0.0%) |
| All other Fuels | 147 (1.3%) | 0 (0.0%) |
| No Fuel Used | 20 (0.2%) | 15 (0.3%) |
| Total | 11,558 (100.0%) | 5,758 (100.0%) |
Household Vehicle Usage in Kyle
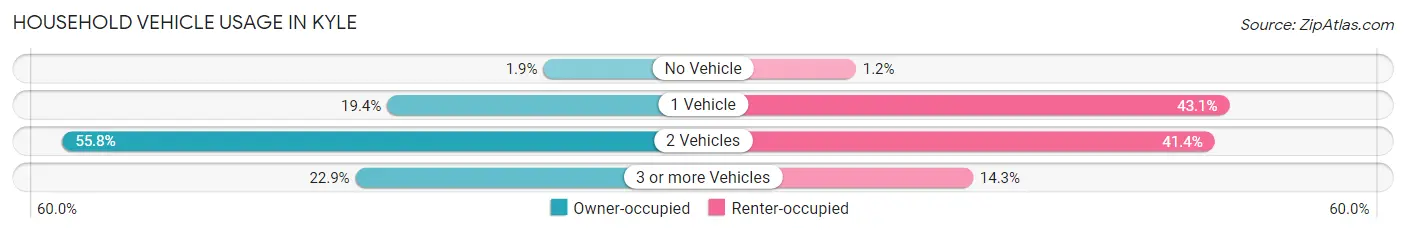
| Vehicles per Household | Owner-occupied | Renter-occupied |
| No Vehicle | 220 (1.9%) | 70 (1.2%) |
| 1 Vehicle | 2,241 (19.4%) | 2,479 (43.0%) |
| 2 Vehicles | 6,446 (55.8%) | 2,384 (41.4%) |
| 3 or more Vehicles | 2,651 (22.9%) | 825 (14.3%) |
| Total | 11,558 (100.0%) | 5,758 (100.0%) |
Real Estate & Mortgages in Kyle
Real Estate and Mortgage Overview in Kyle
| Characteristic | Without Mortgage | With Mortgage |
| Housing Units | 2,533 | 9,025 |
| Median Property Value | $271,000 | $271,100 |
| Median Household Income | $88,978 | $1,901 |
| Monthly Housing Costs | $733 | $387 |
| Real Estate Taxes | $5,598 | $286 |
Property Value by Mortgage Status in Kyle
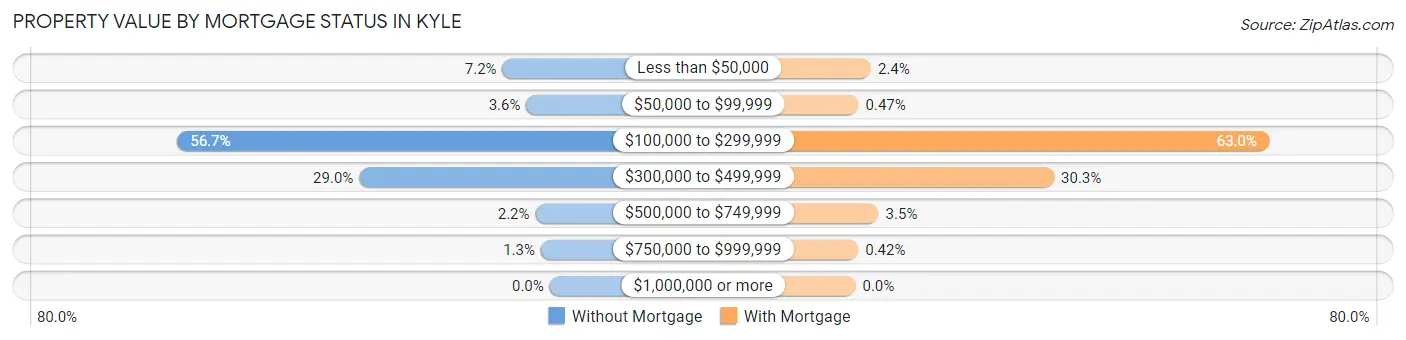
| Property Value | Without Mortgage | With Mortgage |
| Less than $50,000 | 182 (7.2%) | 213 (2.4%) |
| $50,000 to $99,999 | 90 (3.5%) | 42 (0.5%) |
| $100,000 to $299,999 | 1,437 (56.7%) | 5,683 (63.0%) |
| $300,000 to $499,999 | 735 (29.0%) | 2,731 (30.3%) |
| $500,000 to $749,999 | 55 (2.2%) | 318 (3.5%) |
| $750,000 to $999,999 | 34 (1.3%) | 38 (0.4%) |
| $1,000,000 or more | 0 (0.0%) | 0 (0.0%) |
| Total | 2,533 (100.0%) | 9,025 (100.0%) |
Household Income by Mortgage Status in Kyle
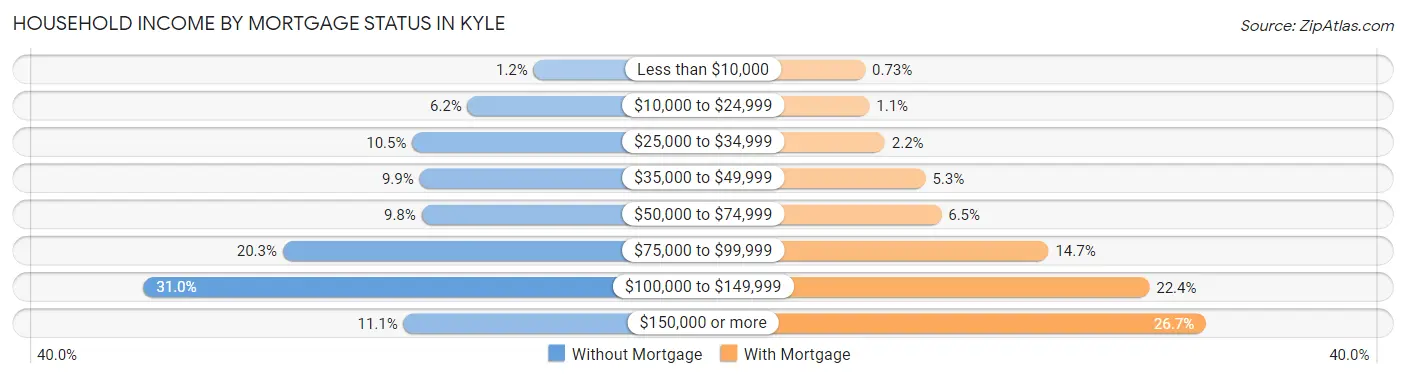
| Household Income | Without Mortgage | With Mortgage |
| Less than $10,000 | 31 (1.2%) | 66 (0.7%) |
| $10,000 to $24,999 | 158 (6.2%) | 95 (1.1%) |
| $25,000 to $34,999 | 265 (10.5%) | 201 (2.2%) |
| $35,000 to $49,999 | 251 (9.9%) | 481 (5.3%) |
| $50,000 to $74,999 | 247 (9.8%) | 589 (6.5%) |
| $75,000 to $99,999 | 515 (20.3%) | 1,327 (14.7%) |
| $100,000 to $149,999 | 784 (30.9%) | 2,020 (22.4%) |
| $150,000 or more | 282 (11.1%) | 2,411 (26.7%) |
| Total | 2,533 (100.0%) | 9,025 (100.0%) |
Property Value to Household Income Ratio in Kyle
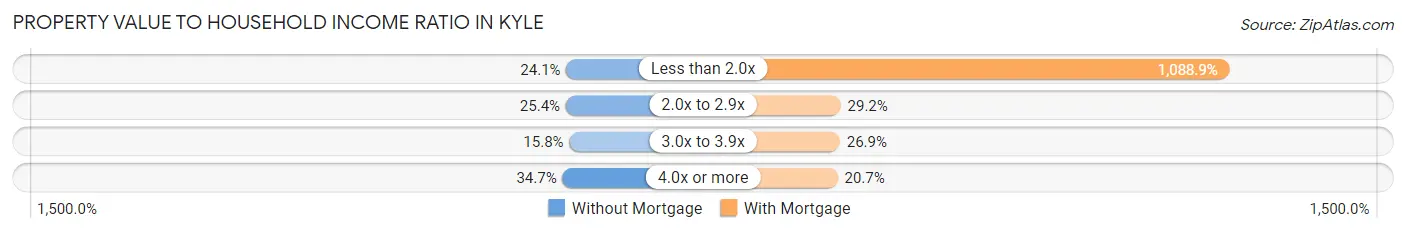
| Value-to-Income Ratio | Without Mortgage | With Mortgage |
| Less than 2.0x | 610 (24.1%) | 98,277 (1,088.9%) |
| 2.0x to 2.9x | 643 (25.4%) | 2,634 (29.2%) |
| 3.0x to 3.9x | 401 (15.8%) | 2,431 (26.9%) |
| 4.0x or more | 879 (34.7%) | 1,867 (20.7%) |
| Total | 2,533 (100.0%) | 9,025 (100.0%) |
Real Estate Taxes by Mortgage Status in Kyle
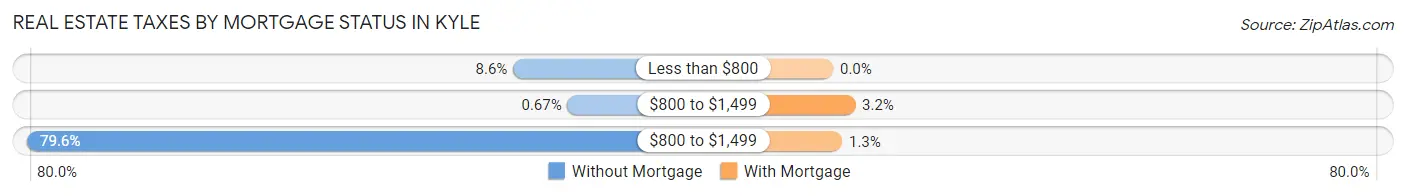
| Property Taxes | Without Mortgage | With Mortgage |
| Less than $800 | 218 (8.6%) | 0 (0.0%) |
| $800 to $1,499 | 17 (0.7%) | 291 (3.2%) |
| $800 to $1,499 | 2,017 (79.6%) | 118 (1.3%) |
| Total | 2,533 (100.0%) | 9,025 (100.0%) |
Health & Disability in Kyle
Health Insurance Coverage by Age in Kyle
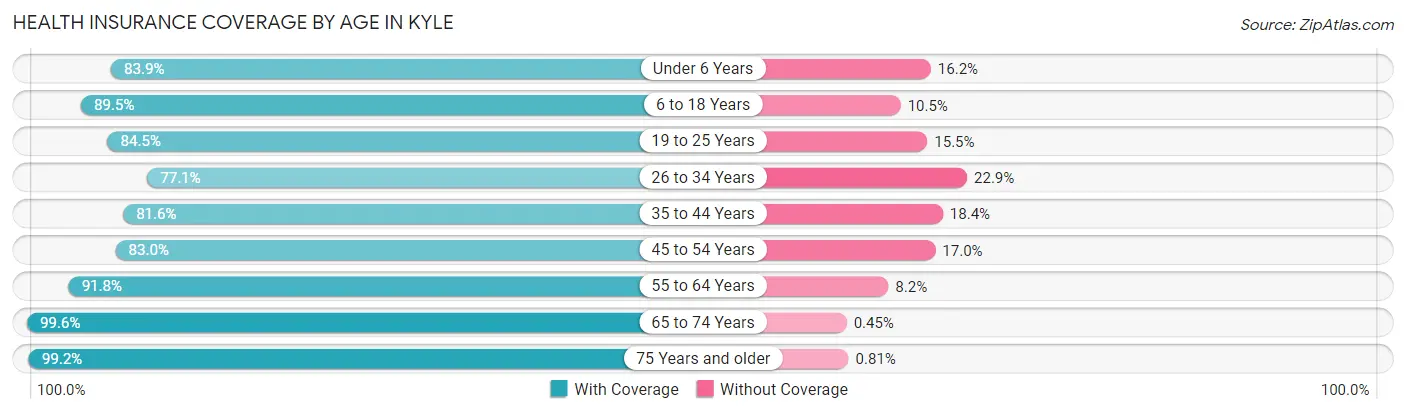
| Age Bracket | With Coverage | Without Coverage |
| Under 6 Years | 3,459 (83.9%) | 666 (16.2%) |
| 6 to 18 Years | 8,527 (89.5%) | 1,002 (10.5%) |
| 19 to 25 Years | 4,255 (84.5%) | 780 (15.5%) |
| 26 to 34 Years | 5,878 (77.1%) | 1,746 (22.9%) |
| 35 to 44 Years | 6,109 (81.6%) | 1,377 (18.4%) |
| 45 to 54 Years | 4,530 (83.0%) | 927 (17.0%) |
| 55 to 64 Years | 4,582 (91.8%) | 411 (8.2%) |
| 65 to 74 Years | 2,440 (99.6%) | 11 (0.4%) |
| 75 Years and older | 1,101 (99.2%) | 9 (0.8%) |
| Total | 40,881 (85.5%) | 6,929 (14.5%) |
Health Insurance Coverage by Citizenship Status in Kyle
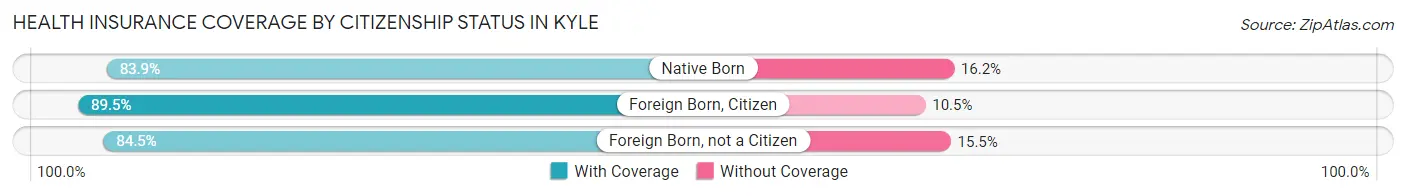
| Citizenship Status | With Coverage | Without Coverage |
| Native Born | 3,459 (83.9%) | 666 (16.2%) |
| Foreign Born, Citizen | 8,527 (89.5%) | 1,002 (10.5%) |
| Foreign Born, not a Citizen | 4,255 (84.5%) | 780 (15.5%) |
Health Insurance Coverage by Household Income in Kyle
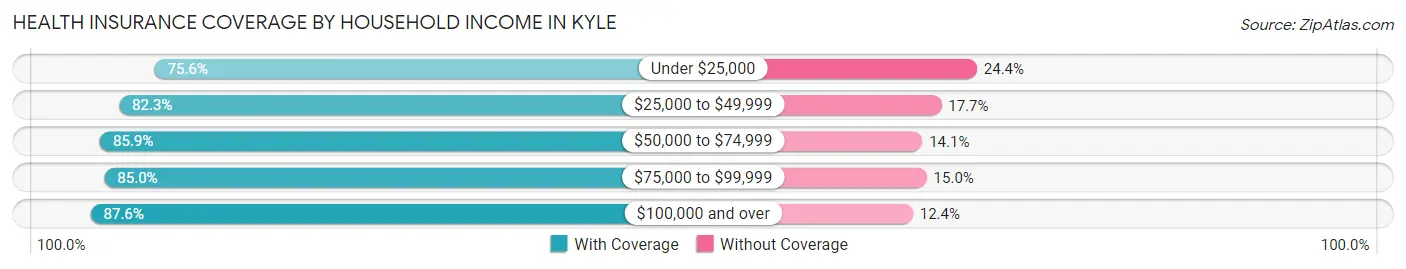
| Household Income | With Coverage | Without Coverage |
| Under $25,000 | 1,580 (75.6%) | 509 (24.4%) |
| $25,000 to $49,999 | 6,084 (82.3%) | 1,309 (17.7%) |
| $50,000 to $74,999 | 5,986 (85.9%) | 985 (14.1%) |
| $75,000 to $99,999 | 8,074 (85.0%) | 1,420 (15.0%) |
| $100,000 and over | 19,145 (87.6%) | 2,703 (12.4%) |
Public vs Private Health Insurance Coverage by Age in Kyle
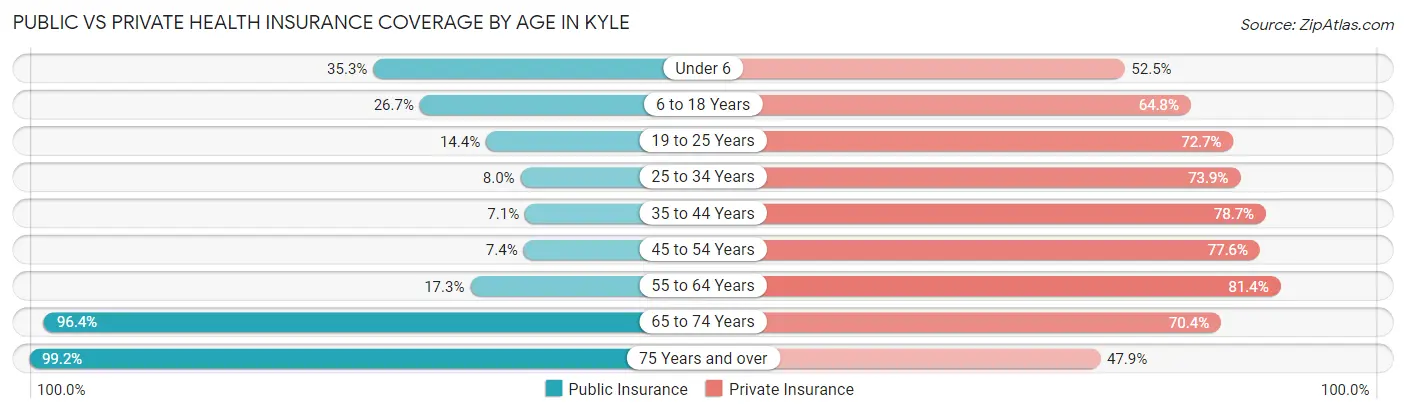
| Age Bracket | Public Insurance | Private Insurance |
| Under 6 | 1,456 (35.3%) | 2,164 (52.5%) |
| 6 to 18 Years | 2,540 (26.7%) | 6,174 (64.8%) |
| 19 to 25 Years | 723 (14.4%) | 3,660 (72.7%) |
| 25 to 34 Years | 608 (8.0%) | 5,637 (73.9%) |
| 35 to 44 Years | 533 (7.1%) | 5,893 (78.7%) |
| 45 to 54 Years | 404 (7.4%) | 4,234 (77.6%) |
| 55 to 64 Years | 863 (17.3%) | 4,066 (81.4%) |
| 65 to 74 Years | 2,363 (96.4%) | 1,725 (70.4%) |
| 75 Years and over | 1,101 (99.2%) | 532 (47.9%) |
| Total | 10,591 (22.2%) | 34,085 (71.3%) |
Disability Status by Sex by Age in Kyle
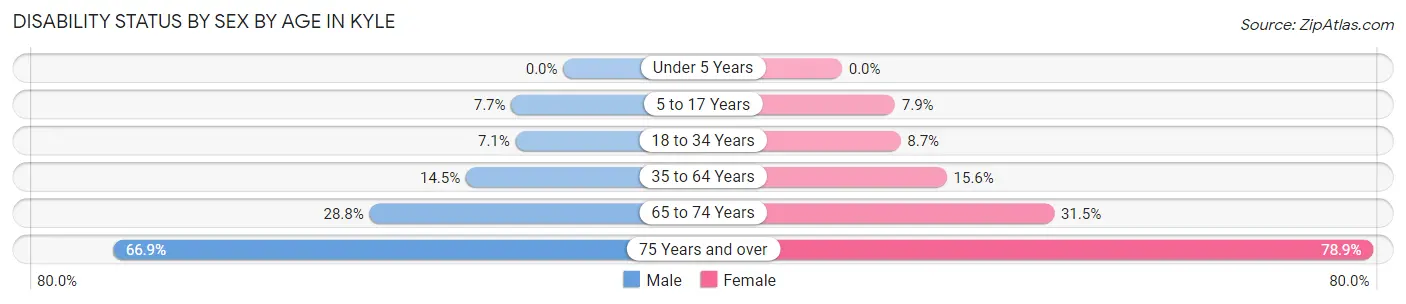
| Age Bracket | Male | Female |
| Under 5 Years | 0 (0.0%) | 0 (0.0%) |
| 5 to 17 Years | 353 (7.7%) | 392 (7.9%) |
| 18 to 34 Years | 487 (7.1%) | 547 (8.7%) |
| 35 to 64 Years | 1,295 (14.4%) | 1,396 (15.6%) |
| 65 to 74 Years | 310 (28.8%) | 433 (31.5%) |
| 75 Years and over | 384 (66.9%) | 423 (78.9%) |
Disability Class by Sex by Age in Kyle
Disability Class: Hearing Difficulty
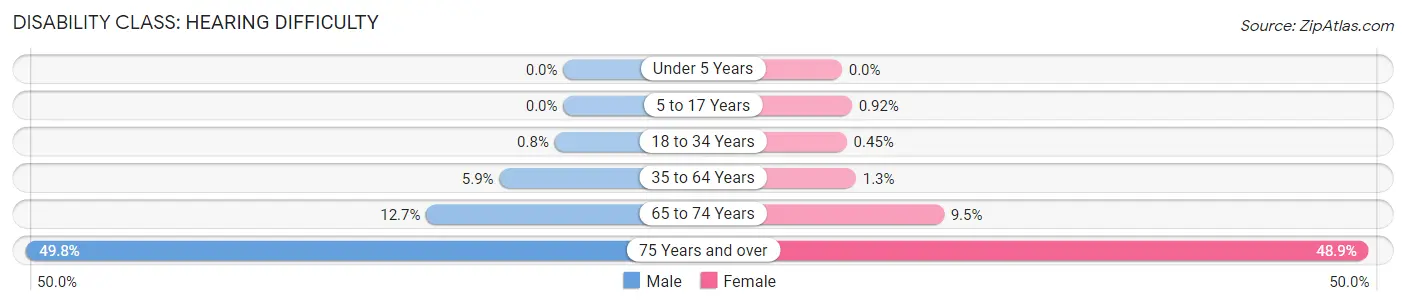
| Age Bracket | Male | Female |
| Under 5 Years | 0 (0.0%) | 0 (0.0%) |
| 5 to 17 Years | 0 (0.0%) | 46 (0.9%) |
| 18 to 34 Years | 55 (0.8%) | 28 (0.4%) |
| 35 to 64 Years | 531 (5.9%) | 117 (1.3%) |
| 65 to 74 Years | 137 (12.7%) | 130 (9.5%) |
| 75 Years and over | 286 (49.8%) | 262 (48.9%) |
Disability Class: Vision Difficulty
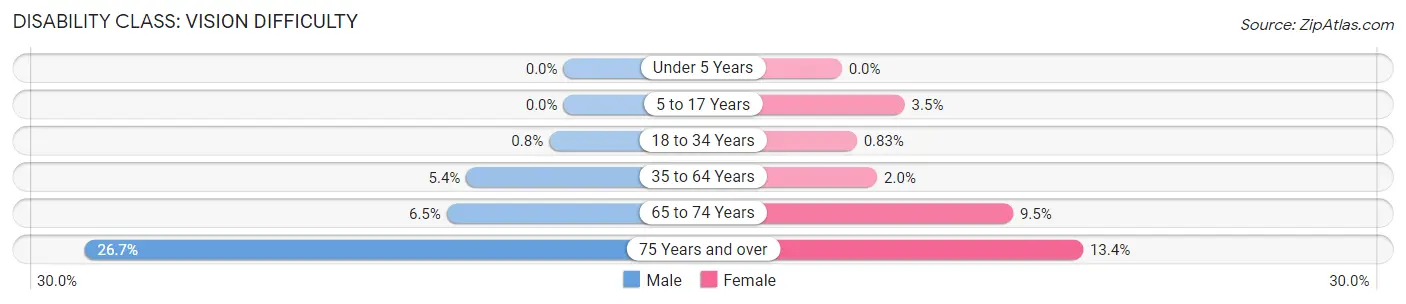
| Age Bracket | Male | Female |
| Under 5 Years | 0 (0.0%) | 0 (0.0%) |
| 5 to 17 Years | 0 (0.0%) | 174 (3.5%) |
| 18 to 34 Years | 55 (0.8%) | 52 (0.8%) |
| 35 to 64 Years | 485 (5.4%) | 177 (2.0%) |
| 65 to 74 Years | 70 (6.5%) | 131 (9.5%) |
| 75 Years and over | 153 (26.7%) | 72 (13.4%) |
Disability Class: Cognitive Difficulty
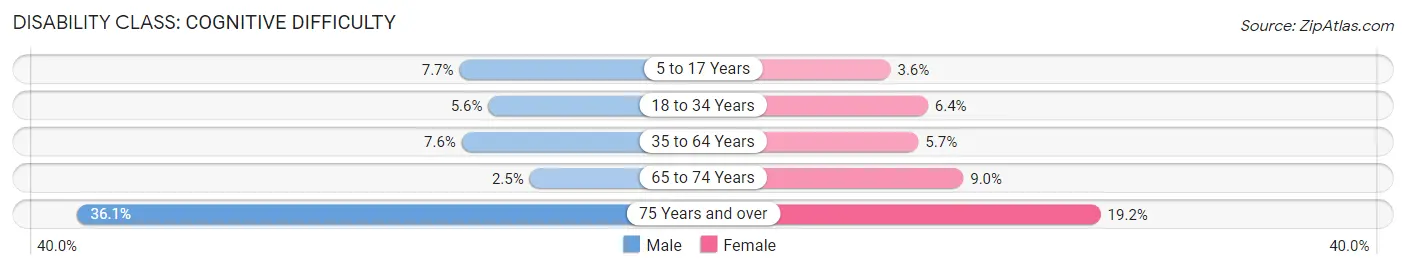
| Age Bracket | Male | Female |
| 5 to 17 Years | 353 (7.7%) | 180 (3.6%) |
| 18 to 34 Years | 383 (5.6%) | 402 (6.4%) |
| 35 to 64 Years | 677 (7.5%) | 511 (5.7%) |
| 65 to 74 Years | 27 (2.5%) | 124 (9.0%) |
| 75 Years and over | 207 (36.1%) | 103 (19.2%) |
Disability Class: Ambulatory Difficulty
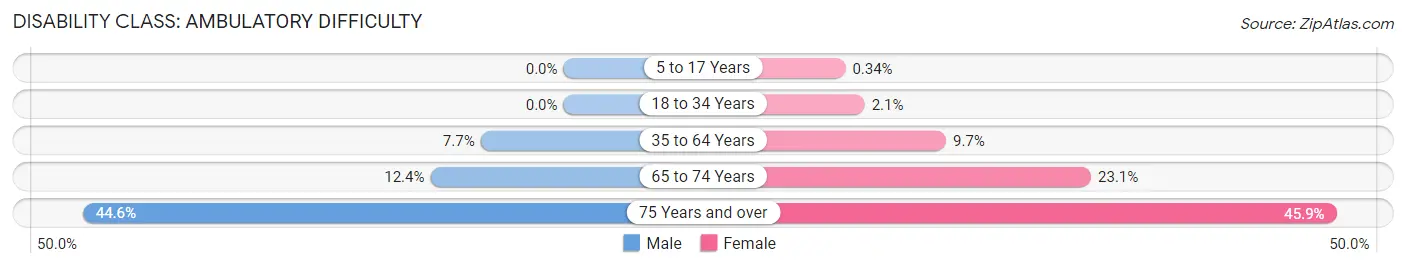
| Age Bracket | Male | Female |
| 5 to 17 Years | 0 (0.0%) | 17 (0.3%) |
| 18 to 34 Years | 0 (0.0%) | 134 (2.1%) |
| 35 to 64 Years | 689 (7.7%) | 869 (9.7%) |
| 65 to 74 Years | 133 (12.3%) | 318 (23.1%) |
| 75 Years and over | 256 (44.6%) | 246 (45.9%) |
Disability Class: Self-Care Difficulty
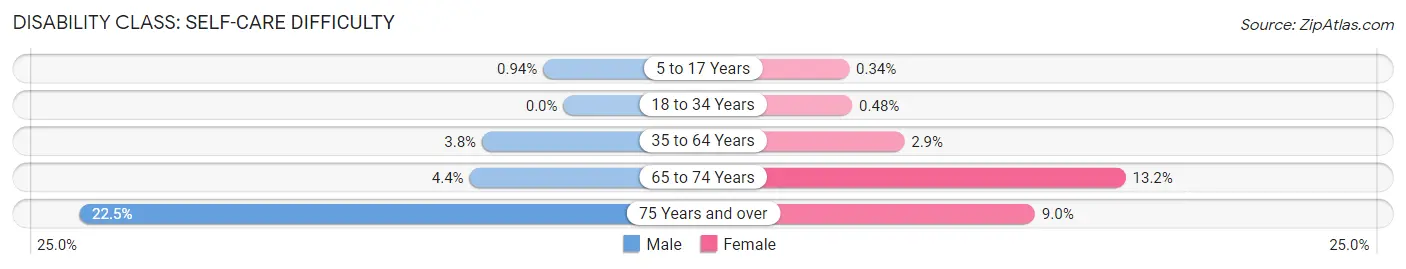
| Age Bracket | Male | Female |
| 5 to 17 Years | 43 (0.9%) | 17 (0.3%) |
| 18 to 34 Years | 0 (0.0%) | 30 (0.5%) |
| 35 to 64 Years | 339 (3.8%) | 260 (2.9%) |
| 65 to 74 Years | 47 (4.4%) | 181 (13.2%) |
| 75 Years and over | 129 (22.5%) | 48 (9.0%) |
Technology Access in Kyle
Computing Device Access in Kyle
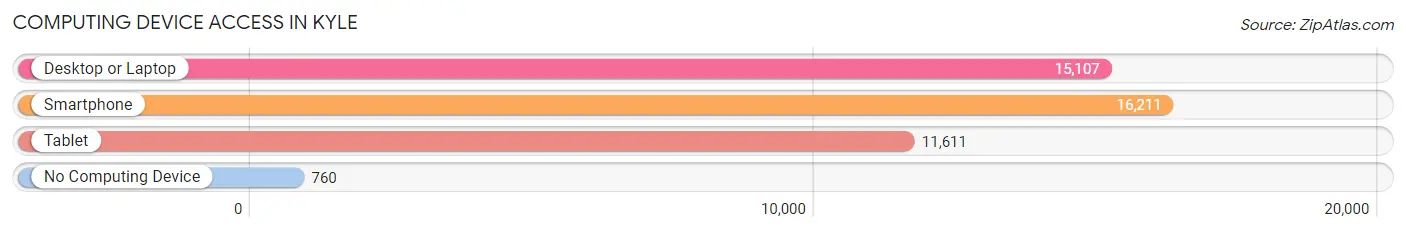
| Device Type | # Households | % Households |
| Desktop or Laptop | 15,107 | 87.2% |
| Smartphone | 16,211 | 93.6% |
| Tablet | 11,611 | 67.0% |
| No Computing Device | 760 | 4.4% |
| Total | 17,316 | 100.0% |
Internet Access in Kyle
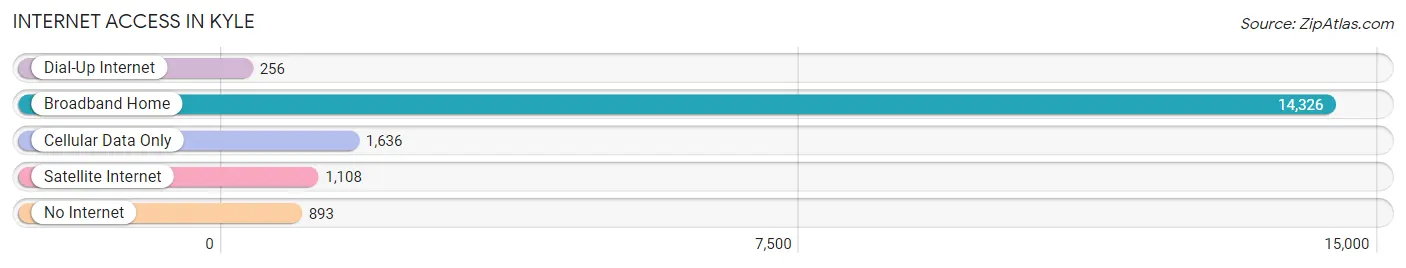
| Internet Type | # Households | % Households |
| Dial-Up Internet | 256 | 1.5% |
| Broadband Home | 14,326 | 82.7% |
| Cellular Data Only | 1,636 | 9.5% |
| Satellite Internet | 1,108 | 6.4% |
| No Internet | 893 | 5.2% |
| Total | 17,316 | 100.0% |
Kyle Summary
Kyle, Texas is a city located in Hays County, Texas, United States. It is part of the Austin-Round Rock metropolitan area. The population was 28,016 at the 2010 census. Kyle is one of the fastest-growing cities in Texas and the nation.
Geography
Kyle is located at 30°03′N 97°52′W (30.05, -97.87). According to the United States Census Bureau, the city has a total area of 16.2 square miles (41.8 km2), of which 16.1 square miles (41.6 km2) is land and 0.1 square miles (0.2 km2) (0.62%) is water.
History
The area around Kyle was first settled in the mid-1800s by German and Czech immigrants. The town was named after Captain Fergus Kyle, a Confederate soldier who was killed in the Battle of the Nueces in 1862. The town was officially incorporated in 1880.
In the early 1900s, Kyle was a farming community, with cotton, corn, and wheat as the main crops. The town was also home to a number of businesses, including a cotton gin, a blacksmith shop, and a general store.
In the 1950s, the city began to grow rapidly as the Austin-San Antonio corridor developed. The population of Kyle increased from 1,000 in 1950 to over 28,000 in 2010.
Economy
The economy of Kyle is largely based on the service industry. The city is home to a number of retail stores, restaurants, and other businesses. The city is also home to Seton Medical Center Hays, a hospital that serves the surrounding area.
The city is also home to a number of manufacturing companies, including a plastics manufacturer, a metal fabrication company, and a food processing plant.
Demographics
As of the 2010 census, there were 28,016 people, 8,945 households, and 6,845 families residing in the city. The population density was 1,735.2 people per square mile (671.3/km2). There were 9,541 housing units at an average density of 593.3 per square mile (229.2/km2). The racial makeup of the city was 74.2% White, 8.3% African American, 0.6% Native American, 1.2% Asian, 0.1% Pacific Islander, 12.7% from other races, and 2.9% from two or more races. Hispanic or Latino of any race were 33.2% of the population.
There were 8,945 households, out of which 44.2% had children under the age of 18 living with them, 57.2% were married couples living together, 13.2% had a female householder with no husband present, and 24.2% were non-families. 19.2% of all households were made up of individuals, and 6.2% had someone living alone who was 65 years of age or older. The average household size was 3.09 and the average family size was 3.54.
In the city, the population was spread out, with 33.2% under the age of 18, 8.7% from 18 to 24, 33.2% from 25 to 44, 17.7% from 45 to 64, and 7.2% who were 65 years of age or older. The median age was 30 years. For every 100 females, there were 95.2 males. For every 100 females age 18 and over, there were 91.7 males.
The median income for a household in the city was $50,945, and the median income for a family was $56,945. Males had a median income of $41,945 versus $30,945 for females. The per capita income for the city was $20,945. About 8.2% of families and 10.2% of the population were below the poverty line, including 13.2% of those under age 18 and 8.2% of those age 65 or over.
Common Questions
What is Per Capita Income in Kyle?
Per Capita income in Kyle is $34,631.
What is the Median Family Income in Kyle?
Median Family Income in Kyle is $93,441.
What is the Median Household income in Kyle?
Median Household Income in Kyle is $85,199.
What is Income or Wage Gap in Kyle?
Income or Wage Gap in Kyle is 24.0%.
Women in Kyle earn 76.0 cents for every dollar earned by a man.
What is Inequality or Gini Index in Kyle?
Inequality or Gini Index in Kyle is 0.36.
What is the Total Population of Kyle?
Total Population of Kyle is 48,484.
What is the Total Male Population of Kyle?
Total Male Population of Kyle is 24,609.
What is the Total Female Population of Kyle?
Total Female Population of Kyle is 23,875.
What is the Ratio of Males per 100 Females in Kyle?
There are 103.07 Males per 100 Females in Kyle.
What is the Ratio of Females per 100 Males in Kyle?
There are 97.02 Females per 100 Males in Kyle.
What is the Median Population Age in Kyle?
Median Population Age in Kyle is 33.2 Years.
What is the Average Family Size in Kyle
Average Family Size in Kyle is 3.3 People.
What is the Average Household Size in Kyle
Average Household Size in Kyle is 2.8 People.
How Large is the Labor Force in Kyle?
There are 26,852 People in the Labor Forcein in Kyle.
What is the Percentage of People in the Labor Force in Kyle?
73.4% of People are in the Labor Force in Kyle.
What is the Unemployment Rate in Kyle?
Unemployment Rate in Kyle is 3.0%.