Crandall, TX Map & Demographics
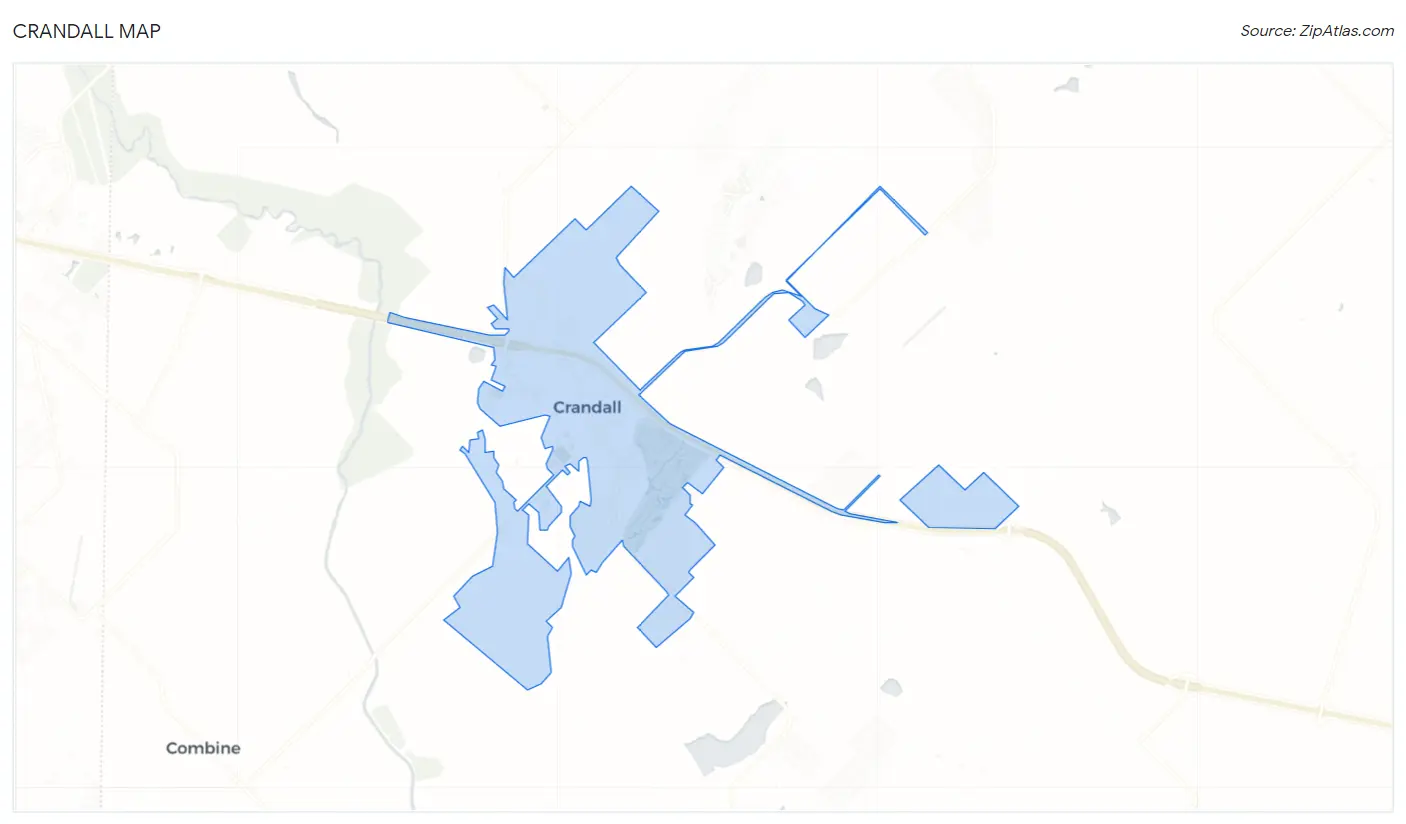
Crandall Map
Crandall Overview
$37,248
PER CAPITA INCOME
$109,798
AVG FAMILY INCOME
$101,829
AVG HOUSEHOLD INCOME
8.8%
WAGE / INCOME GAP [ % ]
91.2¢/ $1
WAGE / INCOME GAP [ $ ]
0.32
INEQUALITY / GINI INDEX
4,028
TOTAL POPULATION
2,221
MALE POPULATION
1,807
FEMALE POPULATION
122.91
MALES / 100 FEMALES
81.36
FEMALES / 100 MALES
37.3
MEDIAN AGE
3.4
AVG FAMILY SIZE
3.0
AVG HOUSEHOLD SIZE
2,184
LABOR FORCE [ PEOPLE ]
70.5%
PERCENT IN LABOR FORCE
5.5%
UNEMPLOYMENT RATE
Crandall Zip Codes
Crandall Area Codes
Income in Crandall
Income Overview in Crandall
Per Capita Income in Crandall is $37,248, while median incomes of families and households are $109,798 and $101,829 respectively.
| Characteristic | Number | Measure |
| Per Capita Income | 4,028 | $37,248 |
| Median Family Income | 1,093 | $109,798 |
| Mean Family Income | 1,093 | $112,962 |
| Median Household Income | 1,362 | $101,829 |
| Mean Household Income | 1,362 | $103,076 |
| Income Deficit | 1,093 | $0 |
| Wage / Income Gap (%) | 4,028 | 8.80% |
| Wage / Income Gap ($) | 4,028 | 91.20¢ per $1 |
| Gini / Inequality Index | 4,028 | 0.32 |
Earnings by Sex in Crandall
Average Earnings in Crandall are $55,920, $58,162 for men and $53,043 for women, a difference of 8.8%.
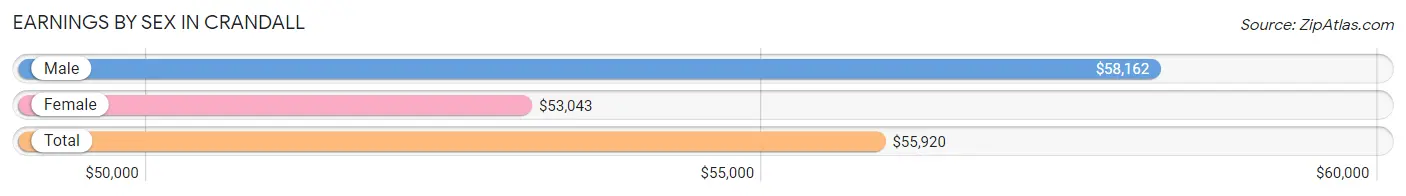
| Sex | Number | Average Earnings |
| Male | 1,352 (61.1%) | $58,162 |
| Female | 860 (38.9%) | $53,043 |
| Total | 2,212 (100.0%) | $55,920 |
Earnings by Sex by Income Bracket in Crandall
The most common earnings brackets in Crandall are $75,000 to $99,999 for men (268 | 19.8%) and $55,000 to $64,999 for women (188 | 21.9%).
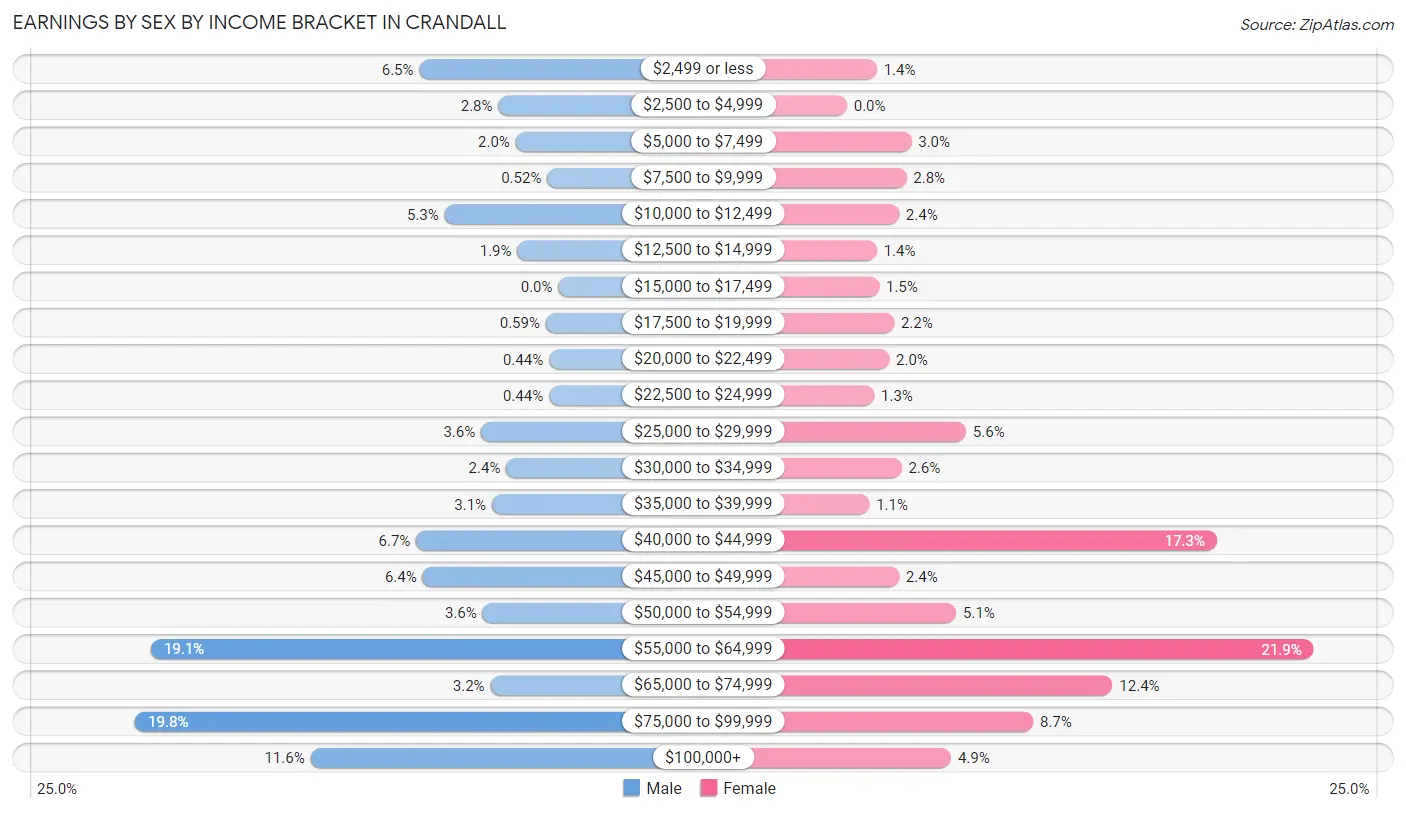
| Income | Male | Female |
| $2,499 or less | 88 (6.5%) | 12 (1.4%) |
| $2,500 to $4,999 | 38 (2.8%) | 0 (0.0%) |
| $5,000 to $7,499 | 27 (2.0%) | 26 (3.0%) |
| $7,500 to $9,999 | 7 (0.5%) | 24 (2.8%) |
| $10,000 to $12,499 | 72 (5.3%) | 21 (2.4%) |
| $12,500 to $14,999 | 26 (1.9%) | 12 (1.4%) |
| $15,000 to $17,499 | 0 (0.0%) | 13 (1.5%) |
| $17,500 to $19,999 | 8 (0.6%) | 19 (2.2%) |
| $20,000 to $22,499 | 6 (0.4%) | 17 (2.0%) |
| $22,500 to $24,999 | 6 (0.4%) | 11 (1.3%) |
| $25,000 to $29,999 | 49 (3.6%) | 48 (5.6%) |
| $30,000 to $34,999 | 33 (2.4%) | 22 (2.6%) |
| $35,000 to $39,999 | 42 (3.1%) | 9 (1.1%) |
| $40,000 to $44,999 | 90 (6.7%) | 149 (17.3%) |
| $45,000 to $49,999 | 86 (6.4%) | 21 (2.4%) |
| $50,000 to $54,999 | 48 (3.5%) | 44 (5.1%) |
| $55,000 to $64,999 | 258 (19.1%) | 188 (21.9%) |
| $65,000 to $74,999 | 43 (3.2%) | 107 (12.4%) |
| $75,000 to $99,999 | 268 (19.8%) | 75 (8.7%) |
| $100,000+ | 157 (11.6%) | 42 (4.9%) |
| Total | 1,352 (100.0%) | 860 (100.0%) |
Earnings by Sex by Educational Attainment in Crandall
Average earnings in Crandall are $58,981 for men and $55,092 for women, a difference of 6.6%. Men with an educational attainment of graduate degree enjoy the highest average annual earnings of $83,946, while those with college or associate's degree education earn the least with $57,967. Women with an educational attainment of graduate degree earn the most with the average annual earnings of $57,167, while those with high school diploma education have the smallest earnings of $27,000.
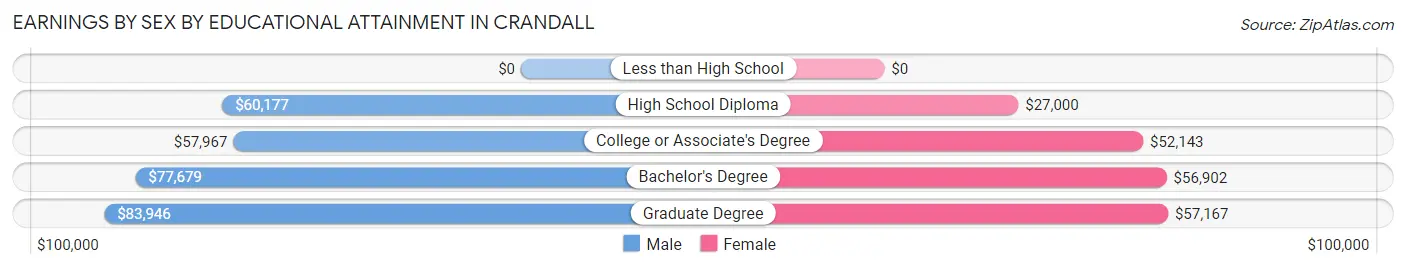
| Educational Attainment | Male Income | Female Income |
| Less than High School | - | - |
| High School Diploma | $60,177 | $27,000 |
| College or Associate's Degree | $57,967 | $52,143 |
| Bachelor's Degree | $77,679 | $56,902 |
| Graduate Degree | $83,946 | $57,167 |
| Total | $58,981 | $55,092 |
Family Income in Crandall
Family Income Brackets in Crandall
According to the Crandall family income data, there are 456 families falling into the $100,000 to $149,999 income range, which is the most common income bracket and makes up 41.7% of all families. Conversely, the $15,000 to $24,999 income bracket is the least frequent group with only 14 families (1.3%) belonging to this category.
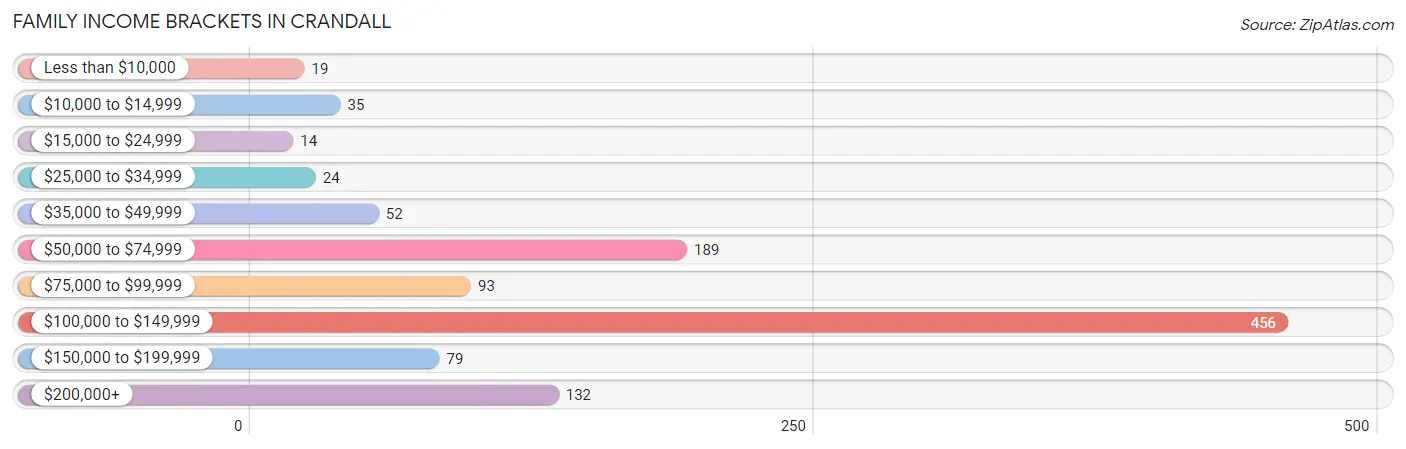
| Income Bracket | # Families | % Families |
| Less than $10,000 | 19 | 1.7% |
| $10,000 to $14,999 | 35 | 3.2% |
| $15,000 to $24,999 | 14 | 1.3% |
| $25,000 to $34,999 | 24 | 2.2% |
| $35,000 to $49,999 | 52 | 4.8% |
| $50,000 to $74,999 | 189 | 17.3% |
| $75,000 to $99,999 | 93 | 8.5% |
| $100,000 to $149,999 | 456 | 41.7% |
| $150,000 to $199,999 | 79 | 7.2% |
| $200,000+ | 132 | 12.1% |
Family Income by Famaliy Size in Crandall
5-person families (138 | 12.6%) account for the highest median family income in Crandall with $141,016 per family, while 2-person families (486 | 44.5%) have the highest median income of $51,042 per family member.
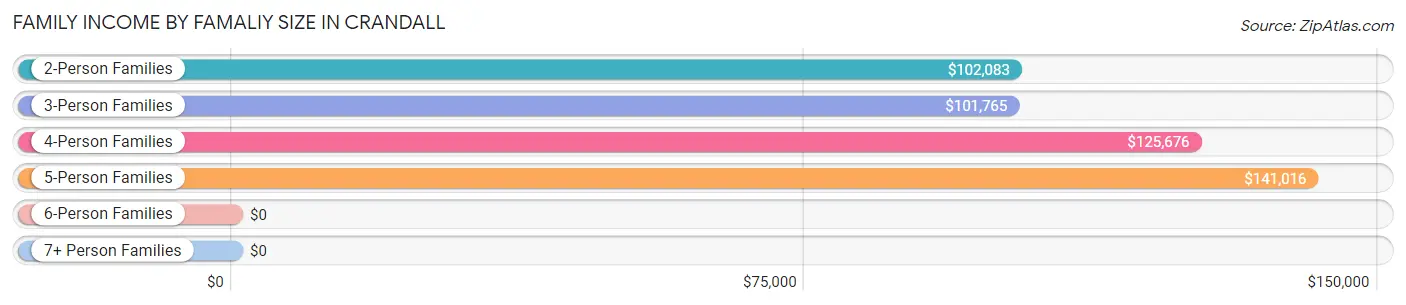
| Income Bracket | # Families | Median Income |
| 2-Person Families | 486 (44.5%) | $102,083 |
| 3-Person Families | 180 (16.5%) | $101,765 |
| 4-Person Families | 200 (18.3%) | $125,676 |
| 5-Person Families | 138 (12.6%) | $141,016 |
| 6-Person Families | 34 (3.1%) | $0 |
| 7+ Person Families | 55 (5.0%) | $0 |
| Total | 1,093 (100.0%) | $109,798 |
Family Income by Number of Earners in Crandall
The median family income in Crandall is $109,798, with families comprising 3+ earners (57) having the highest median family income of $174,375, while families with no earners (30) have the lowest median family income of $2,499, accounting for 5.2% and 2.7% of families, respectively.
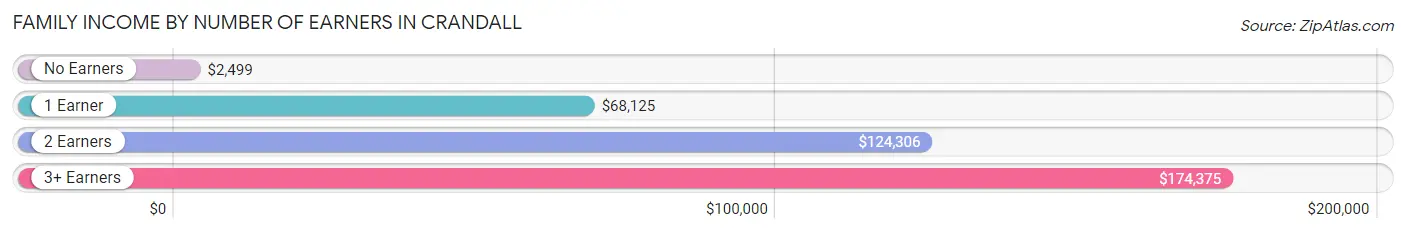
| Number of Earners | # Families | Median Income |
| No Earners | 30 (2.7%) | $2,499 |
| 1 Earner | 359 (32.9%) | $68,125 |
| 2 Earners | 647 (59.2%) | $124,306 |
| 3+ Earners | 57 (5.2%) | $174,375 |
| Total | 1,093 (100.0%) | $109,798 |
Household Income in Crandall
Household Income Brackets in Crandall
With 494 households falling in the category, the $100,000 to $149,999 income range is the most frequent in Crandall, accounting for 36.3% of all households. In contrast, only 19 households (1.4%) fall into the less than $10,000 income bracket, making it the least populous group.
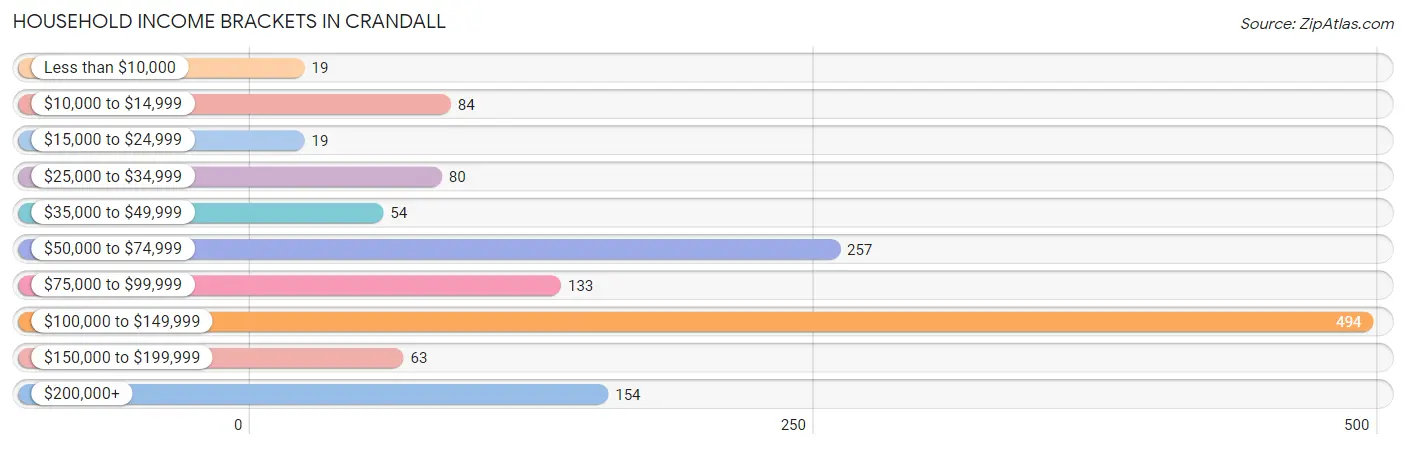
| Income Bracket | # Households | % Households |
| Less than $10,000 | 19 | 1.4% |
| $10,000 to $14,999 | 84 | 6.2% |
| $15,000 to $24,999 | 19 | 1.4% |
| $25,000 to $34,999 | 80 | 5.9% |
| $35,000 to $49,999 | 54 | 4.0% |
| $50,000 to $74,999 | 257 | 18.9% |
| $75,000 to $99,999 | 133 | 9.8% |
| $100,000 to $149,999 | 494 | 36.3% |
| $150,000 to $199,999 | 63 | 4.6% |
| $200,000+ | 154 | 11.3% |
Household Income by Householder Age in Crandall
The median household income in Crandall is $101,829, with the highest median household income of $111,705 found in the 45 to 64 years age bracket for the primary householder. A total of 554 households (40.7%) fall into this category. Meanwhile, the 15 to 24 years age bracket for the primary householder has the lowest median household income of $0, with 19 households (1.4%) in this group.
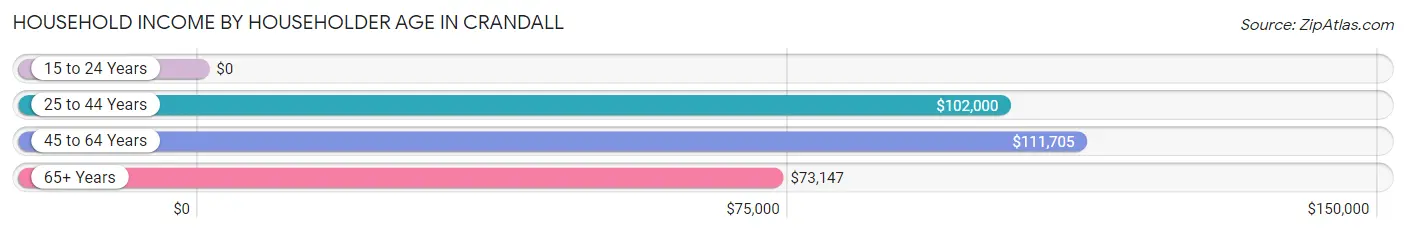
| Income Bracket | # Households | Median Income |
| 15 to 24 Years | 19 (1.4%) | $0 |
| 25 to 44 Years | 502 (36.9%) | $102,000 |
| 45 to 64 Years | 554 (40.7%) | $111,705 |
| 65+ Years | 287 (21.1%) | $73,147 |
| Total | 1,362 (100.0%) | $101,829 |
Poverty in Crandall
Income Below Poverty by Sex and Age in Crandall
With 6.7% poverty level for males and 9.1% for females among the residents of Crandall, under 5 year old males and 75 year old and over females are the most vulnerable to poverty, with 37 males (24.3%) and 50 females (52.6%) in their respective age groups living below the poverty level.
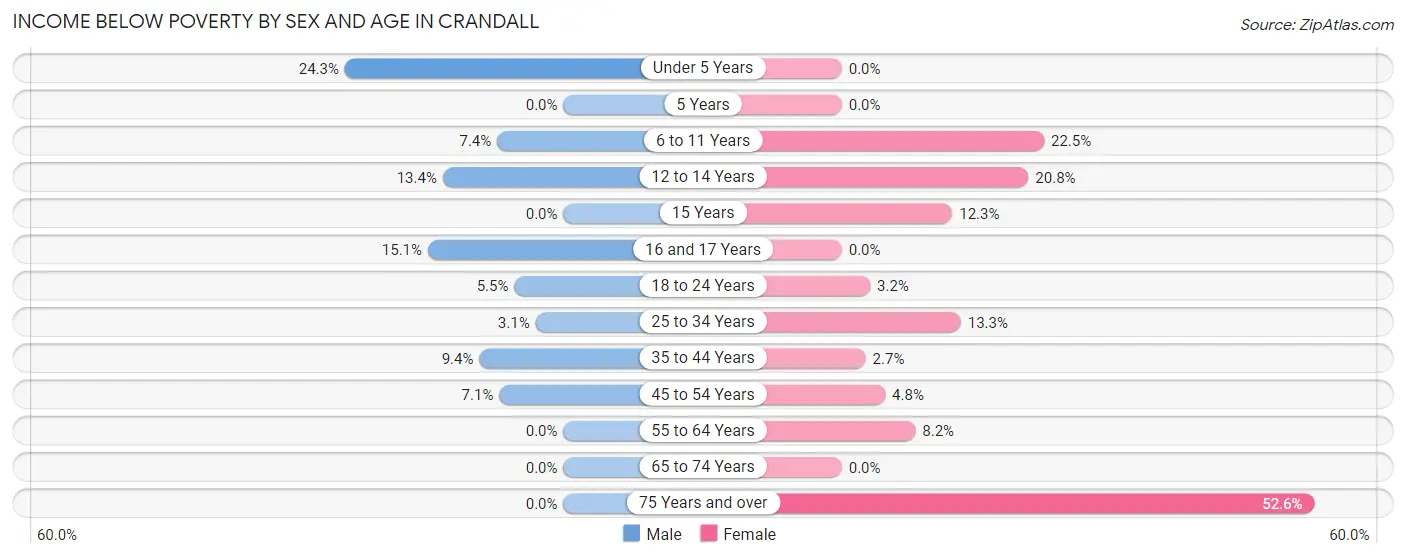
| Age Bracket | Male | Female |
| Under 5 Years | 37 (24.3%) | 0 (0.0%) |
| 5 Years | 0 (0.0%) | 0 (0.0%) |
| 6 to 11 Years | 11 (7.4%) | 25 (22.5%) |
| 12 to 14 Years | 9 (13.4%) | 16 (20.8%) |
| 15 Years | 0 (0.0%) | 8 (12.3%) |
| 16 and 17 Years | 16 (15.1%) | 0 (0.0%) |
| 18 to 24 Years | 13 (5.5%) | 4 (3.2%) |
| 25 to 34 Years | 7 (3.1%) | 22 (13.3%) |
| 35 to 44 Years | 28 (9.4%) | 8 (2.7%) |
| 45 to 54 Years | 27 (7.1%) | 17 (4.8%) |
| 55 to 64 Years | 0 (0.0%) | 14 (8.2%) |
| 65 to 74 Years | 0 (0.0%) | 0 (0.0%) |
| 75 Years and over | 0 (0.0%) | 50 (52.6%) |
| Total | 148 (6.7%) | 164 (9.1%) |
Income Above Poverty by Sex and Age in Crandall
According to the poverty statistics in Crandall, males aged 5 years and females aged under 5 years are the age groups that are most secure financially, with 100.0% of males and 100.0% of females in these age groups living above the poverty line.
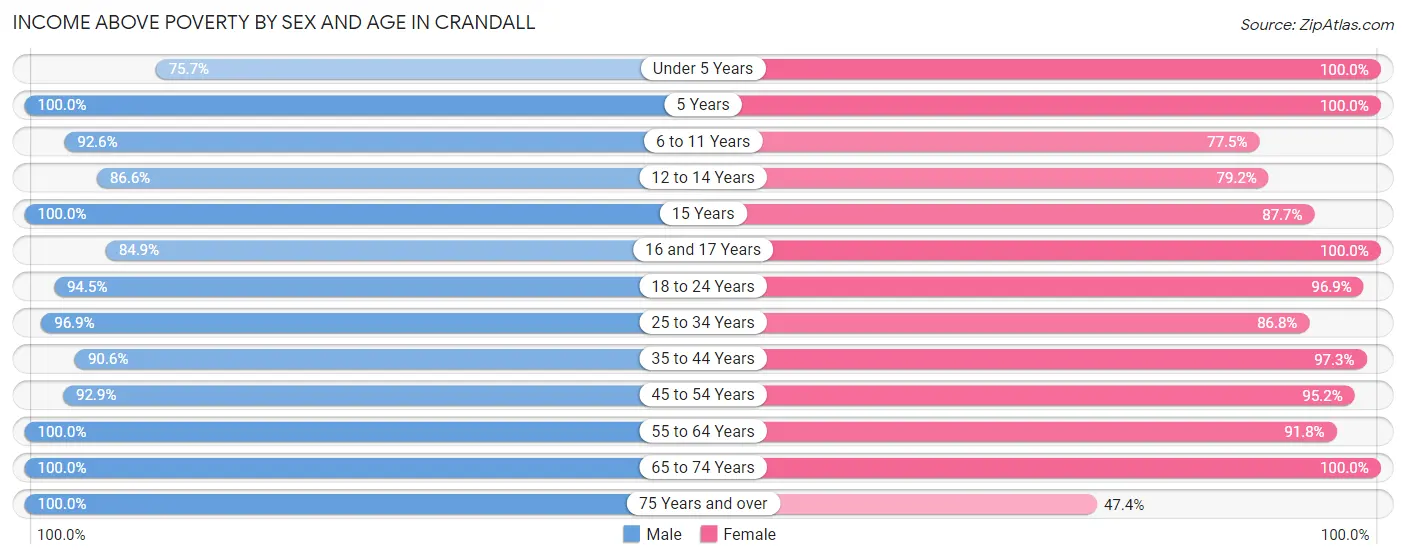
| Age Bracket | Male | Female |
| Under 5 Years | 115 (75.7%) | 137 (100.0%) |
| 5 Years | 19 (100.0%) | 53 (100.0%) |
| 6 to 11 Years | 138 (92.6%) | 86 (77.5%) |
| 12 to 14 Years | 58 (86.6%) | 61 (79.2%) |
| 15 Years | 100 (100.0%) | 57 (87.7%) |
| 16 and 17 Years | 90 (84.9%) | 20 (100.0%) |
| 18 to 24 Years | 225 (94.5%) | 123 (96.9%) |
| 25 to 34 Years | 219 (96.9%) | 144 (86.8%) |
| 35 to 44 Years | 271 (90.6%) | 293 (97.3%) |
| 45 to 54 Years | 351 (92.9%) | 335 (95.2%) |
| 55 to 64 Years | 260 (100.0%) | 157 (91.8%) |
| 65 to 74 Years | 163 (100.0%) | 132 (100.0%) |
| 75 Years and over | 64 (100.0%) | 45 (47.4%) |
| Total | 2,073 (93.3%) | 1,643 (90.9%) |
Income Below Poverty Among Married-Couple Families in Crandall
The poverty statistics for married-couple families in Crandall show that 5.5% or 47 of the total 856 families live below the poverty line. Families with 3 or 4 children have the highest poverty rate of 47.5%, comprising of 28 families. On the other hand, families with 5 or more children have the lowest poverty rate of 0.0%, which includes 0 families.
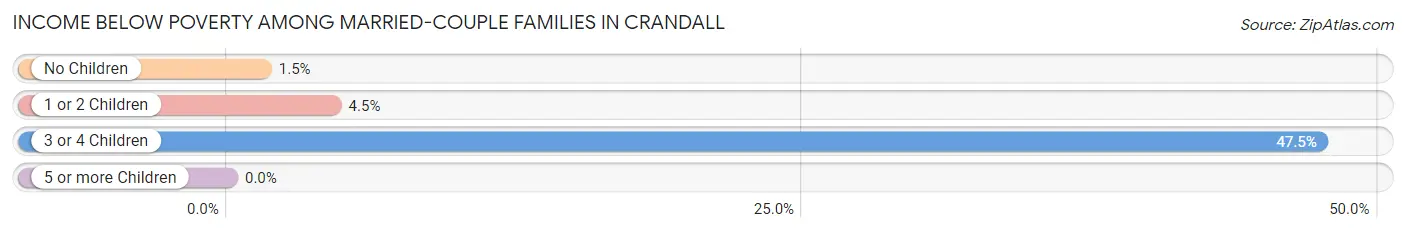
| Children | Above Poverty | Below Poverty |
| No Children | 469 (98.5%) | 7 (1.5%) |
| 1 or 2 Children | 254 (95.5%) | 12 (4.5%) |
| 3 or 4 Children | 31 (52.5%) | 28 (47.5%) |
| 5 or more Children | 55 (100.0%) | 0 (0.0%) |
| Total | 809 (94.5%) | 47 (5.5%) |
Income Below Poverty Among Single-Parent Households in Crandall
According to the poverty data in Crandall, 6.2% or 7 single-father households and 6.4% or 8 single-mother households are living below the poverty line. Among single-father households, those with 1 or 2 children have the highest poverty rate, with 7 households (8.1%) experiencing poverty. Likewise, among single-mother households, those with 3 or 4 children have the highest poverty rate, with 8 households (25.8%) falling below the poverty line.
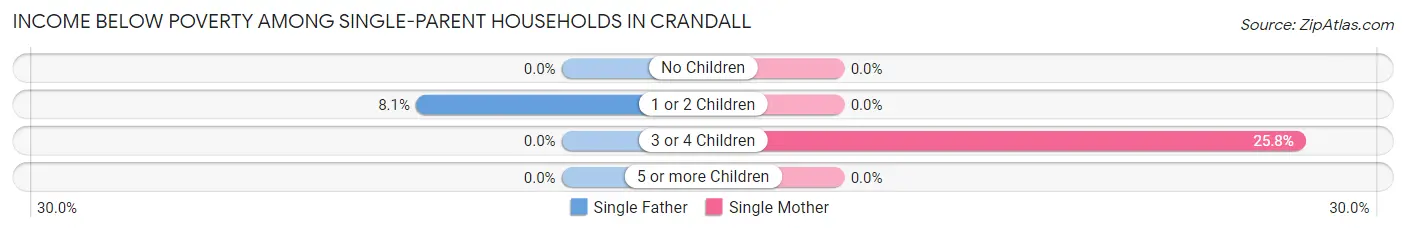
| Children | Single Father | Single Mother |
| No Children | 0 (0.0%) | 0 (0.0%) |
| 1 or 2 Children | 7 (8.1%) | 0 (0.0%) |
| 3 or 4 Children | 0 (0.0%) | 8 (25.8%) |
| 5 or more Children | 0 (0.0%) | 0 (0.0%) |
| Total | 7 (6.2%) | 8 (6.4%) |
Income Below Poverty Among Married-Couple vs Single-Parent Households in Crandall
The poverty data for Crandall shows that 47 of the married-couple family households (5.5%) and 15 of the single-parent households (6.3%) are living below the poverty level. Within the married-couple family households, those with 3 or 4 children have the highest poverty rate, with 28 households (47.5%) falling below the poverty line. Among the single-parent households, those with 3 or 4 children have the highest poverty rate, with 8 household (17.4%) living below poverty.
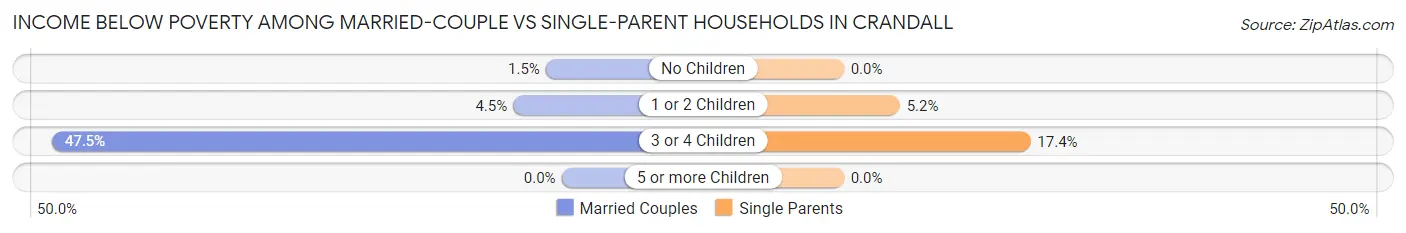
| Children | Married-Couple Families | Single-Parent Households |
| No Children | 7 (1.5%) | 0 (0.0%) |
| 1 or 2 Children | 12 (4.5%) | 7 (5.2%) |
| 3 or 4 Children | 28 (47.5%) | 8 (17.4%) |
| 5 or more Children | 0 (0.0%) | 0 (0.0%) |
| Total | 47 (5.5%) | 15 (6.3%) |
Race in Crandall
The most populous races in Crandall are White / Caucasian (3,373 | 83.7%), Hispanic or Latino (862 | 21.4%), and Some other Race (361 | 9.0%).
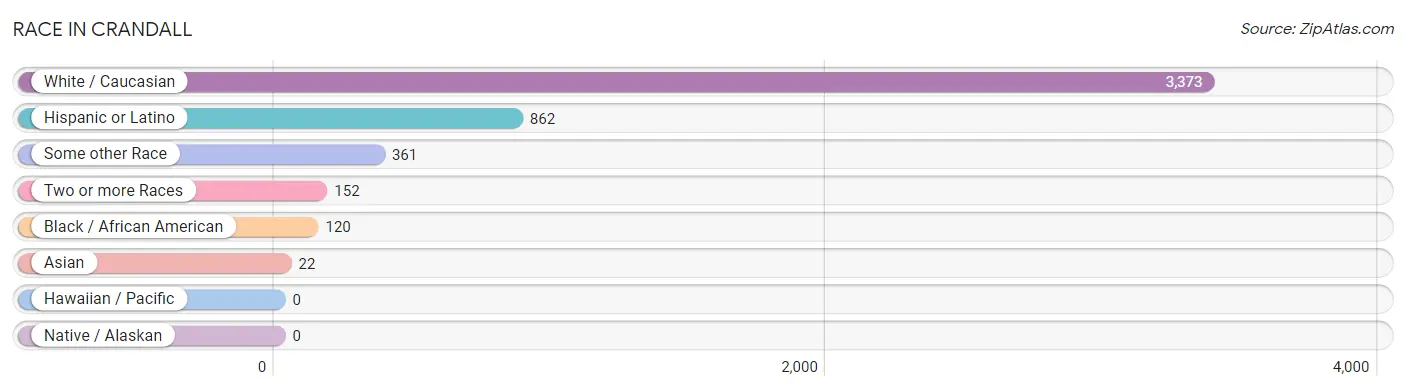
| Race | # Population | % Population |
| Asian | 22 | 0.5% |
| Black / African American | 120 | 3.0% |
| Hawaiian / Pacific | 0 | 0.0% |
| Hispanic or Latino | 862 | 21.4% |
| Native / Alaskan | 0 | 0.0% |
| White / Caucasian | 3,373 | 83.7% |
| Two or more Races | 152 | 3.8% |
| Some other Race | 361 | 9.0% |
| Total | 4,028 | 100.0% |
Ancestry in Crandall
The most populous ancestries reported in Crandall are English (967 | 24.0%), Mexican (833 | 20.7%), German (527 | 13.1%), American (358 | 8.9%), and Irish (295 | 7.3%), together accounting for 74.0% of all Crandall residents.
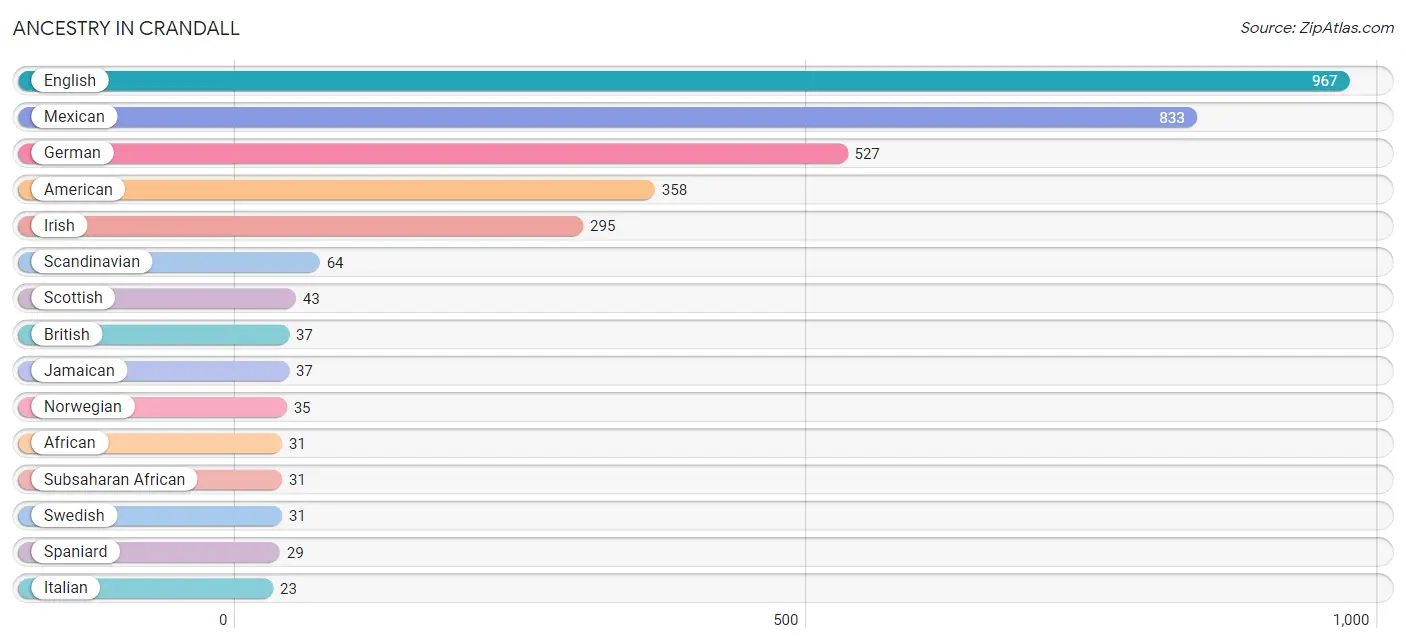
| Ancestry | # Population | % Population |
| African | 31 | 0.8% |
| American | 358 | 8.9% |
| Arab | 11 | 0.3% |
| British | 37 | 0.9% |
| Czech | 13 | 0.3% |
| Czechoslovakian | 14 | 0.4% |
| Danish | 2 | 0.1% |
| English | 967 | 24.0% |
| European | 20 | 0.5% |
| German | 527 | 13.1% |
| Greek | 12 | 0.3% |
| Irish | 295 | 7.3% |
| Italian | 23 | 0.6% |
| Jamaican | 37 | 0.9% |
| Japanese | 8 | 0.2% |
| Korean | 10 | 0.3% |
| Lebanese | 11 | 0.3% |
| Mexican | 833 | 20.7% |
| Norwegian | 35 | 0.9% |
| Pakistani | 8 | 0.2% |
| Pennsylvania German | 5 | 0.1% |
| Polish | 5 | 0.1% |
| Scandinavian | 64 | 1.6% |
| Scotch-Irish | 8 | 0.2% |
| Scottish | 43 | 1.1% |
| Spaniard | 29 | 0.7% |
| Subsaharan African | 31 | 0.8% |
| Swedish | 31 | 0.8% |
| Swiss | 16 | 0.4% |
| Thai | 12 | 0.3% |
| Welsh | 5 | 0.1% |
| Yugoslavian | 14 | 0.4% | View All 32 Rows |
Immigrants in Crandall
The most numerous immigrant groups reported in Crandall came from Latin America (445 | 11.1%), Central America (408 | 10.1%), Mexico (408 | 10.1%), Europe (64 | 1.6%), and Northern Europe (64 | 1.6%), together accounting for 34.5% of all Crandall residents.
| Immigration Origin | # Population | % Population |
| Asia | 22 | 0.5% |
| Caribbean | 37 | 0.9% |
| Central America | 408 | 10.1% |
| England | 11 | 0.3% |
| Europe | 64 | 1.6% |
| India | 12 | 0.3% |
| Jamaica | 37 | 0.9% |
| Latin America | 445 | 11.1% |
| Mexico | 408 | 10.1% |
| Northern Europe | 64 | 1.6% |
| Philippines | 10 | 0.3% |
| South Central Asia | 12 | 0.3% |
| South Eastern Asia | 10 | 0.3% | View All 13 Rows |
Sex and Age in Crandall
Sex and Age in Crandall
The most populous age groups in Crandall are 20 to 24 Years (238 | 10.7%) for men and 35 to 39 Years (206 | 11.4%) for women.
| Age Bracket | Male | Female |
| Under 5 Years | 152 (6.8%) | 137 (7.6%) |
| 5 to 9 Years | 79 (3.6%) | 151 (8.4%) |
| 10 to 14 Years | 156 (7.0%) | 90 (5.0%) |
| 15 to 19 Years | 206 (9.3%) | 93 (5.1%) |
| 20 to 24 Years | 238 (10.7%) | 119 (6.6%) |
| 25 to 29 Years | 135 (6.1%) | 83 (4.6%) |
| 30 to 34 Years | 91 (4.1%) | 83 (4.6%) |
| 35 to 39 Years | 187 (8.4%) | 206 (11.4%) |
| 40 to 44 Years | 112 (5.0%) | 95 (5.3%) |
| 45 to 49 Years | 222 (10.0%) | 196 (10.8%) |
| 50 to 54 Years | 156 (7.0%) | 156 (8.6%) |
| 55 to 59 Years | 118 (5.3%) | 102 (5.6%) |
| 60 to 64 Years | 142 (6.4%) | 69 (3.8%) |
| 65 to 69 Years | 87 (3.9%) | 111 (6.1%) |
| 70 to 74 Years | 76 (3.4%) | 21 (1.2%) |
| 75 to 79 Years | 43 (1.9%) | 90 (5.0%) |
| 80 to 84 Years | 15 (0.7%) | 5 (0.3%) |
| 85 Years and over | 6 (0.3%) | 0 (0.0%) |
| Total | 2,221 (100.0%) | 1,807 (100.0%) |
Families and Households in Crandall
Median Family Size in Crandall
The median family size in Crandall is 3.38 persons per family, with single male/father families (112 | 10.2%) accounting for the largest median family size of 5 persons per family. On the other hand, single female/mother families (125 | 11.4%) represent the smallest median family size with 2.74 persons per family.
| Family Type | # Families | Family Size |
| Married-Couple | 856 (78.3%) | 3.26 |
| Single Male/Father | 112 (10.2%) | 5.00 |
| Single Female/Mother | 125 (11.4%) | 2.74 |
| Total Families | 1,093 (100.0%) | 3.38 |
Median Household Size in Crandall
The median household size in Crandall is 2.96 persons per household, with single male/father households (112 | 8.2%) accounting for the largest median household size of 5.12 persons per household. non-family households (269 | 19.8%) represent the smallest median household size with 1.02 persons per household.
| Household Type | # Households | Household Size |
| Married-Couple | 856 (62.8%) | 3.32 |
| Single Male/Father | 112 (8.2%) | 5.12 |
| Single Female/Mother | 125 (9.2%) | 2.74 |
| Non-family | 269 (19.8%) | 1.02 |
| Total Households | 1,362 (100.0%) | 2.96 |
Household Size by Marriage Status in Crandall
Out of a total of 1,362 households in Crandall, 1,093 (80.2%) are family households, while 269 (19.8%) are nonfamily households. The most numerous type of family households are 2-person households, comprising 486, and the most common type of nonfamily households are 1-person households, comprising 264.
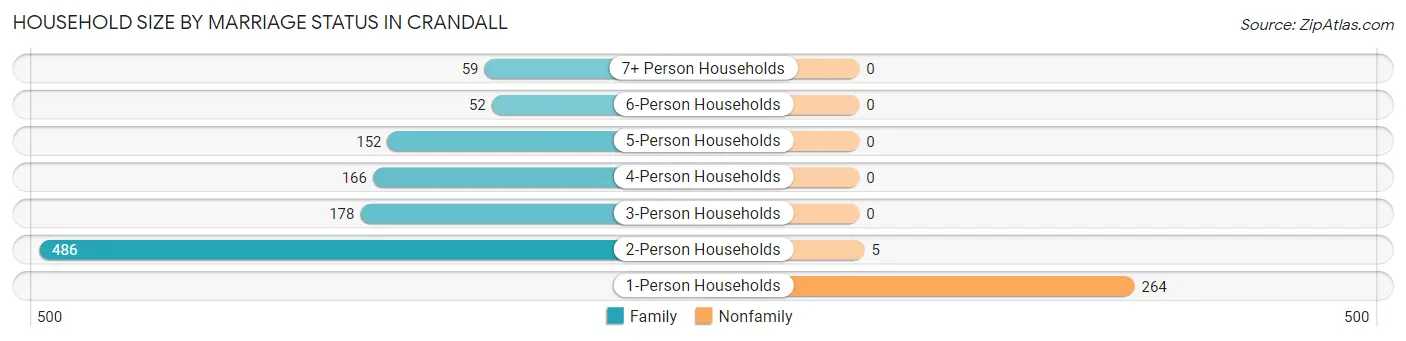
| Household Size | Family Households | Nonfamily Households |
| 1-Person Households | - | 264 (19.4%) |
| 2-Person Households | 486 (35.7%) | 5 (0.4%) |
| 3-Person Households | 178 (13.1%) | 0 (0.0%) |
| 4-Person Households | 166 (12.2%) | 0 (0.0%) |
| 5-Person Households | 152 (11.2%) | 0 (0.0%) |
| 6-Person Households | 52 (3.8%) | 0 (0.0%) |
| 7+ Person Households | 59 (4.3%) | 0 (0.0%) |
| Total | 1,093 (80.2%) | 269 (19.8%) |
Female Fertility in Crandall
Fertility by Age in Crandall
Average fertility rate in Crandall is 40.0 births per 1,000 women. Women in the age bracket of 20 to 34 years have the highest fertility rate with 98.0 births per 1,000 women. Women in the age bracket of 20 to 34 years acount for 77.8% of all women with births.
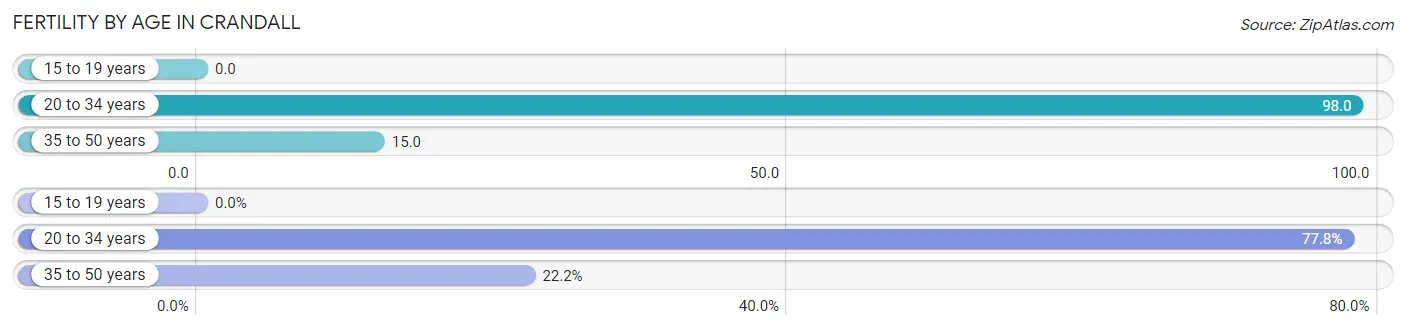
| Age Bracket | Women with Births | Births / 1,000 Women |
| 15 to 19 years | 0 (0.0%) | 0.0 |
| 20 to 34 years | 28 (77.8%) | 98.0 |
| 35 to 50 years | 8 (22.2%) | 15.0 |
| Total | 36 (100.0%) | 40.0 |
Fertility by Age by Marriage Status in Crandall
86.1% of women with births (36) in Crandall are married. The highest percentage of unmarried women with births falls into 20 to 34 years age bracket with 17.9% of them unmarried at the time of birth, while the lowest percentage of unmarried women with births belong to 35 to 50 years age bracket with 0.0% of them unmarried.
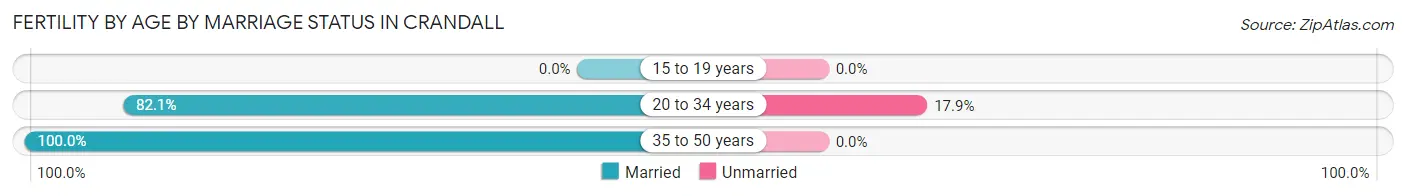
| Age Bracket | Married | Unmarried |
| 15 to 19 years | 0 (0.0%) | 0 (0.0%) |
| 20 to 34 years | 23 (82.1%) | 5 (17.9%) |
| 35 to 50 years | 8 (100.0%) | 0 (0.0%) |
| Total | 31 (86.1%) | 5 (13.9%) |
Fertility by Education in Crandall
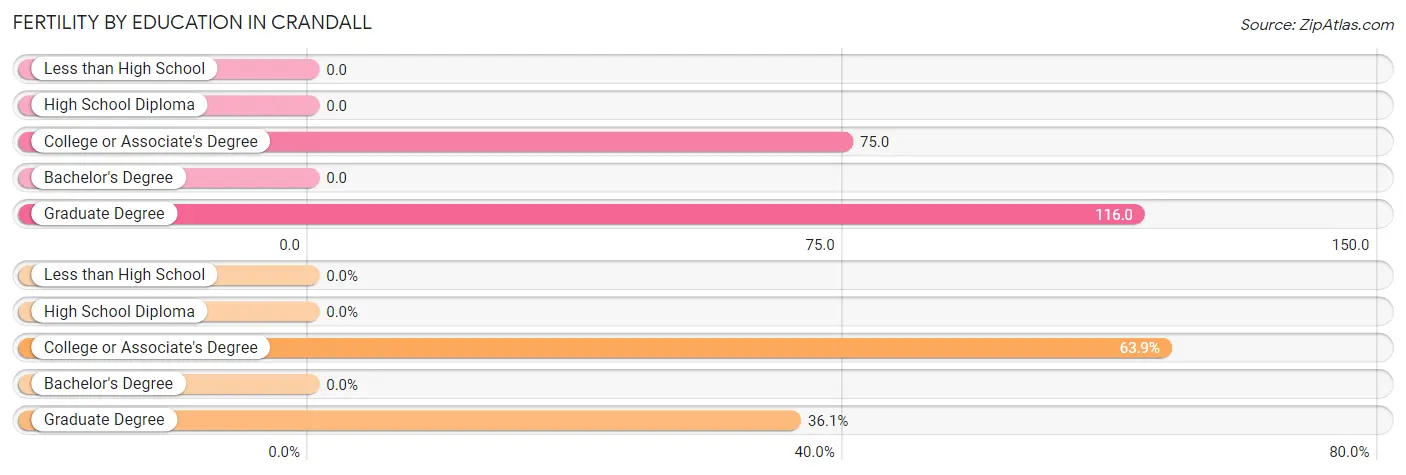
| Educational Attainment | Women with Births | Births / 1,000 Women |
| Less than High School | 0 (0.0%) | 0.0 |
| High School Diploma | 0 (0.0%) | 0.0 |
| College or Associate's Degree | 23 (63.9%) | 75.0 |
| Bachelor's Degree | 0 (0.0%) | 0.0 |
| Graduate Degree | 13 (36.1%) | 116.0 |
| Total | 36 (100.0%) | 40.0 |
Fertility by Education by Marriage Status in Crandall
13.9% of women with births in Crandall are unmarried. Women with the educational attainment of graduate degree are most likely to be married with 100.0% of them married at childbirth, while women with the educational attainment of college or associate's degree are least likely to be married with 21.7% of them unmarried at childbirth.
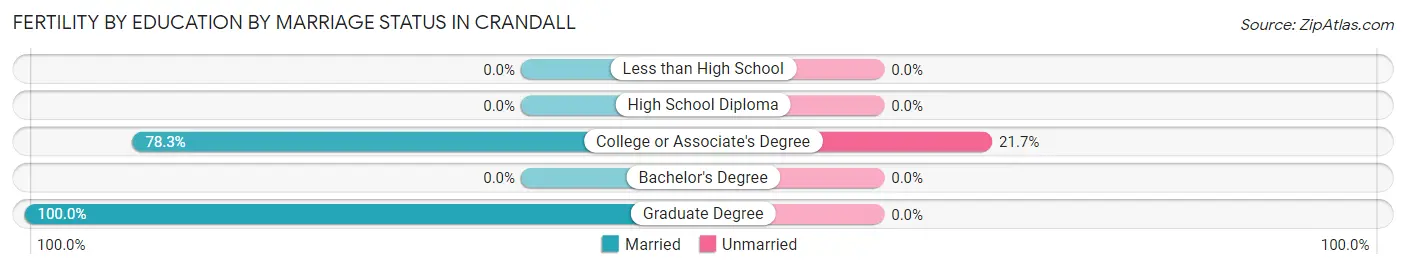
| Educational Attainment | Married | Unmarried |
| Less than High School | 0 (0.0%) | 0 (0.0%) |
| High School Diploma | 0 (0.0%) | 0 (0.0%) |
| College or Associate's Degree | 18 (78.3%) | 5 (21.7%) |
| Bachelor's Degree | 0 (0.0%) | 0 (0.0%) |
| Graduate Degree | 13 (100.0%) | 0 (0.0%) |
| Total | 31 (86.1%) | 5 (13.9%) |
Employment Characteristics in Crandall
Employment by Class of Employer in Crandall
Among the 2,063 employed individuals in Crandall, private company employees (1,347 | 65.3%), local government employees (263 | 12.8%), and not-for-profit organizations (161 | 7.8%) make up the most common classes of employment.
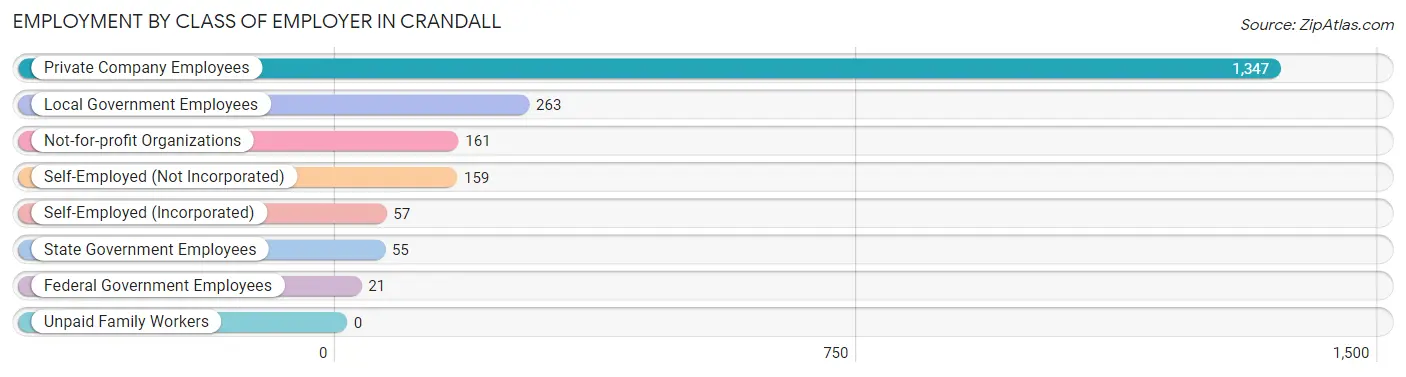
| Employer Class | # Employees | % Employees |
| Private Company Employees | 1,347 | 65.3% |
| Self-Employed (Incorporated) | 57 | 2.8% |
| Self-Employed (Not Incorporated) | 159 | 7.7% |
| Not-for-profit Organizations | 161 | 7.8% |
| Local Government Employees | 263 | 12.8% |
| State Government Employees | 55 | 2.7% |
| Federal Government Employees | 21 | 1.0% |
| Unpaid Family Workers | 0 | 0.0% |
| Total | 2,063 | 100.0% |
Employment Status by Age in Crandall
According to the labor force statistics for Crandall, out of the total population over 16 years of age (3,098), 70.5% or 2,184 individuals are in the labor force, with 5.5% or 120 of them unemployed. The age group with the highest labor force participation rate is 25 to 29 years, with 95.4% or 208 individuals in the labor force. Within the labor force, the 60 to 64 years age range has the highest percentage of unemployed individuals, with 21.4% or 33 of them being unemployed.
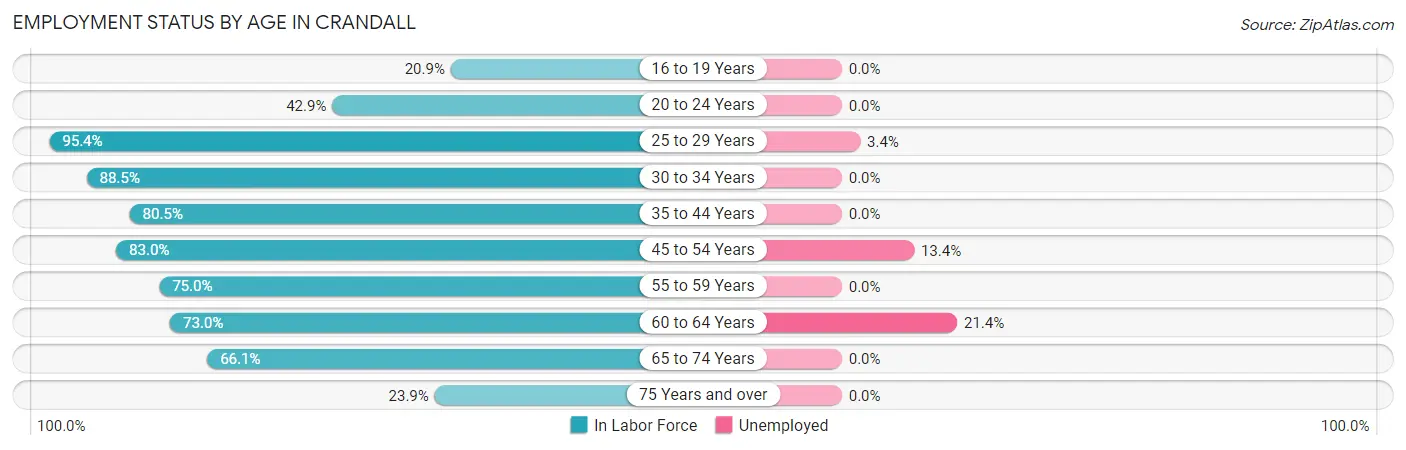
| Age Bracket | In Labor Force | Unemployed |
| 16 to 19 Years | 28 (20.9%) | 0 (0.0%) |
| 20 to 24 Years | 153 (42.9%) | 0 (0.0%) |
| 25 to 29 Years | 208 (95.4%) | 7 (3.4%) |
| 30 to 34 Years | 154 (88.5%) | 0 (0.0%) |
| 35 to 44 Years | 483 (80.5%) | 0 (0.0%) |
| 45 to 54 Years | 606 (83.0%) | 81 (13.4%) |
| 55 to 59 Years | 165 (75.0%) | 0 (0.0%) |
| 60 to 64 Years | 154 (73.0%) | 33 (21.4%) |
| 65 to 74 Years | 195 (66.1%) | 0 (0.0%) |
| 75 Years and over | 38 (23.9%) | 0 (0.0%) |
| Total | 2,184 (70.5%) | 120 (5.5%) |
Employment Status by Educational Attainment in Crandall
According to labor force statistics for Crandall, 82.2% of individuals (1,770) out of the total population between 25 and 64 years of age (2,153) are in the labor force, with 6.8% or 120 of them being unemployed. The group with the highest labor force participation rate are those with the educational attainment of college / associate degree, with 87.0% or 714 individuals in the labor force. Within the labor force, individuals with less than high school education have the highest percentage of unemployment, with 26.3% or 31 of them being unemployed.
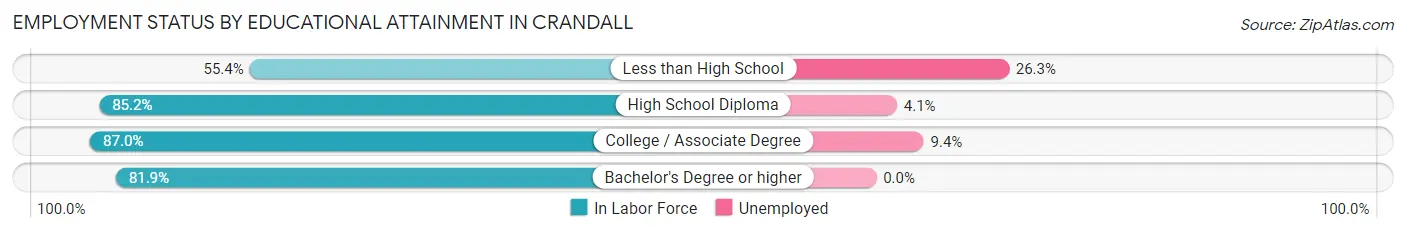
| Educational Attainment | In Labor Force | Unemployed |
| Less than High School | 118 (55.4%) | 56 (26.3%) |
| High School Diploma | 558 (85.2%) | 27 (4.1%) |
| College / Associate Degree | 714 (87.0%) | 77 (9.4%) |
| Bachelor's Degree or higher | 380 (81.9%) | 0 (0.0%) |
| Total | 1,770 (82.2%) | 146 (6.8%) |
Employment Occupations by Sex in Crandall
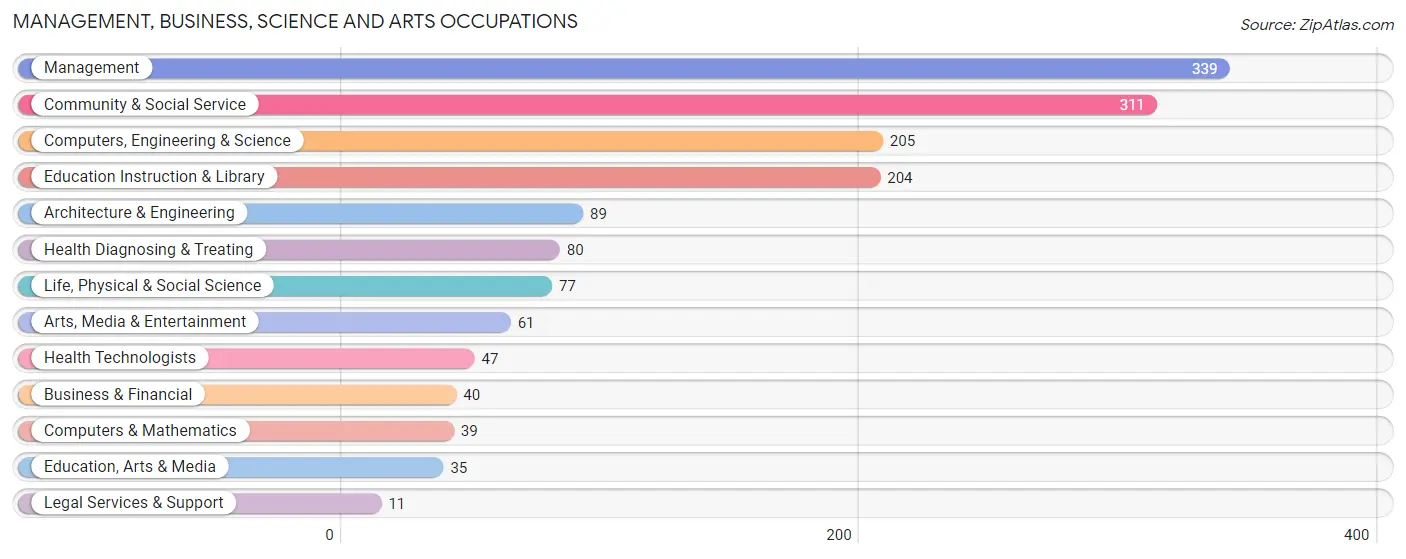
Management, Business, Science and Arts Occupations
The most common Management, Business, Science and Arts occupations in Crandall are Management (339 | 16.4%), Community & Social Service (311 | 15.1%), Computers, Engineering & Science (205 | 9.9%), Education Instruction & Library (204 | 9.9%), and Architecture & Engineering (89 | 4.3%).
Management, Business, Science and Arts Occupations by Sex
Within the Management, Business, Science and Arts occupations in Crandall, the most male-oriented occupations are Architecture & Engineering (100.0%), Life, Physical & Social Science (100.0%), and Education, Arts & Media (100.0%), while the most female-oriented occupations are Education Instruction & Library (97.6%), Health Diagnosing & Treating (92.5%), and Health Technologists (87.2%).
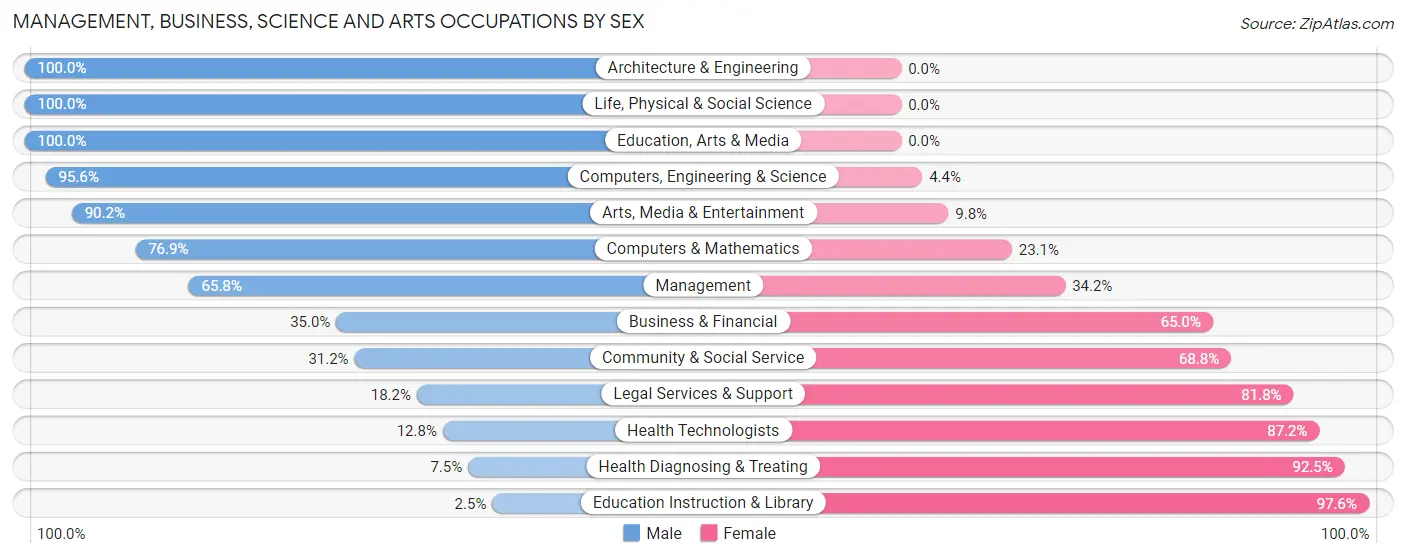
| Occupation | Male | Female |
| Management | 223 (65.8%) | 116 (34.2%) |
| Business & Financial | 14 (35.0%) | 26 (65.0%) |
| Computers, Engineering & Science | 196 (95.6%) | 9 (4.4%) |
| Computers & Mathematics | 30 (76.9%) | 9 (23.1%) |
| Architecture & Engineering | 89 (100.0%) | 0 (0.0%) |
| Life, Physical & Social Science | 77 (100.0%) | 0 (0.0%) |
| Community & Social Service | 97 (31.2%) | 214 (68.8%) |
| Education, Arts & Media | 35 (100.0%) | 0 (0.0%) |
| Legal Services & Support | 2 (18.2%) | 9 (81.8%) |
| Education Instruction & Library | 5 (2.5%) | 199 (97.6%) |
| Arts, Media & Entertainment | 55 (90.2%) | 6 (9.8%) |
| Health Diagnosing & Treating | 6 (7.5%) | 74 (92.5%) |
| Health Technologists | 6 (12.8%) | 41 (87.2%) |
| Total (Category) | 536 (55.0%) | 439 (45.0%) |
| Total (Overall) | 1,278 (62.0%) | 785 (38.1%) |
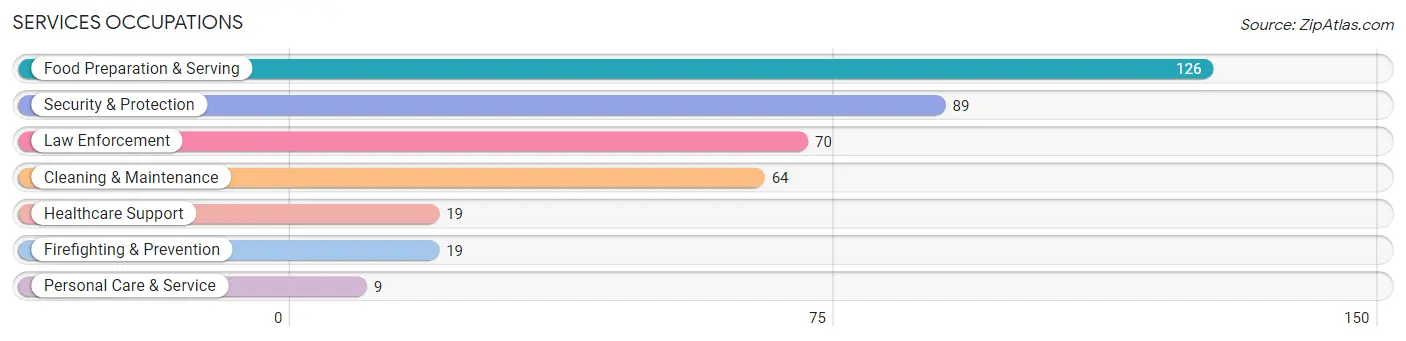
Services Occupations
The most common Services occupations in Crandall are Food Preparation & Serving (126 | 6.1%), Security & Protection (89 | 4.3%), Law Enforcement (70 | 3.4%), Cleaning & Maintenance (64 | 3.1%), and Healthcare Support (19 | 0.9%).
Services Occupations by Sex
Within the Services occupations in Crandall, the most male-oriented occupations are Firefighting & Prevention (100.0%), Food Preparation & Serving (100.0%), and Cleaning & Maintenance (100.0%), while the most female-oriented occupations are Healthcare Support (100.0%), Law Enforcement (64.3%), and Security & Protection (50.6%).
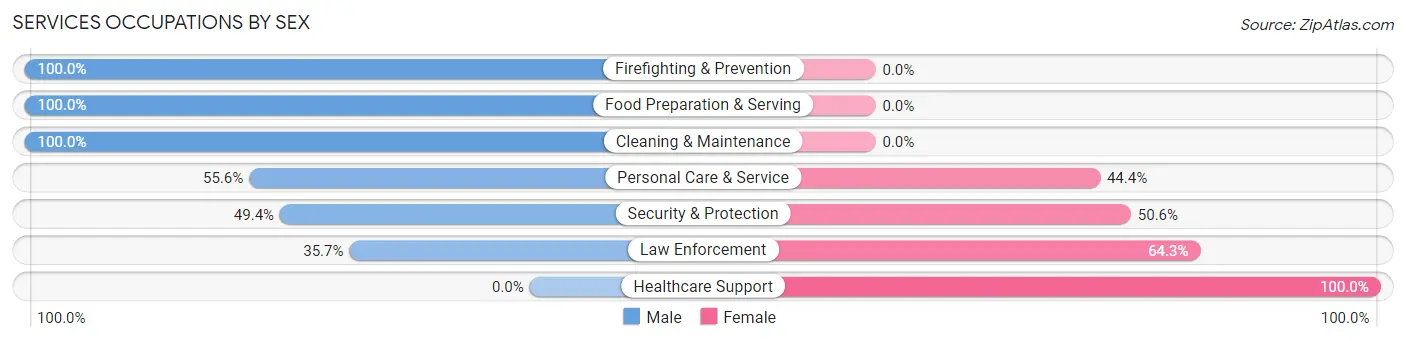
| Occupation | Male | Female |
| Healthcare Support | 0 (0.0%) | 19 (100.0%) |
| Security & Protection | 44 (49.4%) | 45 (50.6%) |
| Firefighting & Prevention | 19 (100.0%) | 0 (0.0%) |
| Law Enforcement | 25 (35.7%) | 45 (64.3%) |
| Food Preparation & Serving | 126 (100.0%) | 0 (0.0%) |
| Cleaning & Maintenance | 64 (100.0%) | 0 (0.0%) |
| Personal Care & Service | 5 (55.6%) | 4 (44.4%) |
| Total (Category) | 239 (77.8%) | 68 (22.2%) |
| Total (Overall) | 1,278 (62.0%) | 785 (38.1%) |
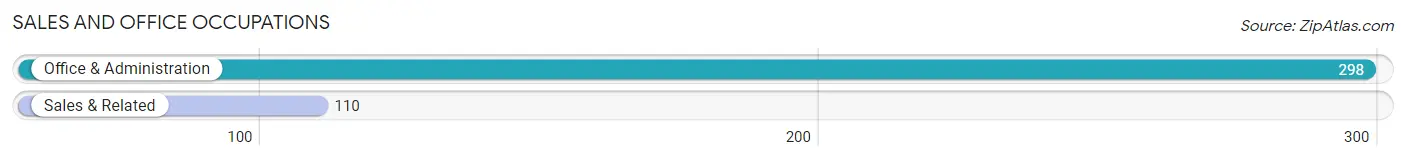
Sales and Office Occupations
The most common Sales and Office occupations in Crandall are Office & Administration (298 | 14.4%), and Sales & Related (110 | 5.3%).
Sales and Office Occupations by Sex
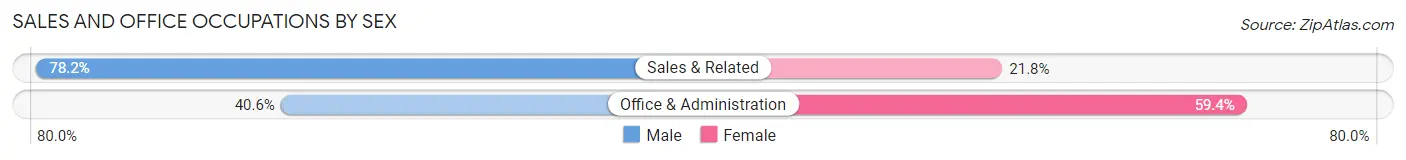
| Occupation | Male | Female |
| Sales & Related | 86 (78.2%) | 24 (21.8%) |
| Office & Administration | 121 (40.6%) | 177 (59.4%) |
| Total (Category) | 207 (50.7%) | 201 (49.3%) |
| Total (Overall) | 1,278 (62.0%) | 785 (38.1%) |
Natural Resources, Construction and Maintenance Occupations
The most common Natural Resources, Construction and Maintenance occupations in Crandall are Installation, Maintenance & Repair (85 | 4.1%), Construction & Extraction (30 | 1.5%), and Farming, Fishing & Forestry (6 | 0.3%).
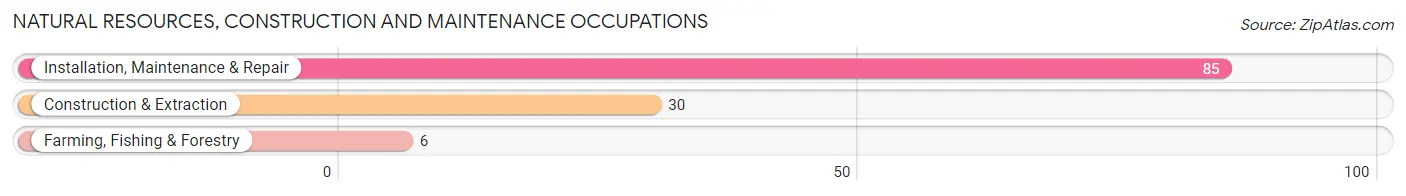
Natural Resources, Construction and Maintenance Occupations by Sex
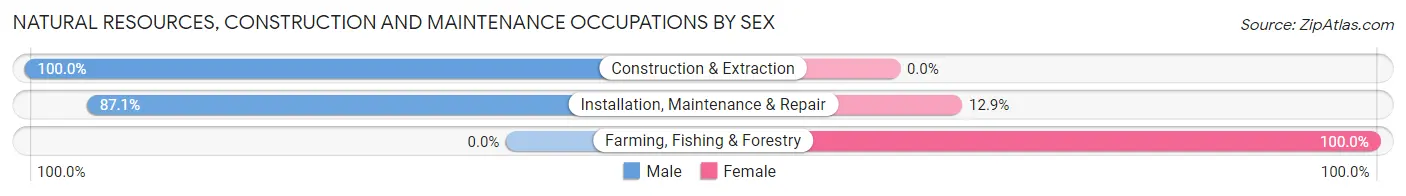
| Occupation | Male | Female |
| Farming, Fishing & Forestry | 0 (0.0%) | 6 (100.0%) |
| Construction & Extraction | 30 (100.0%) | 0 (0.0%) |
| Installation, Maintenance & Repair | 74 (87.1%) | 11 (12.9%) |
| Total (Category) | 104 (86.0%) | 17 (14.1%) |
| Total (Overall) | 1,278 (62.0%) | 785 (38.1%) |
Production, Transportation and Moving Occupations
The most common Production, Transportation and Moving occupations in Crandall are Transportation (101 | 4.9%), Production (86 | 4.2%), and Material Moving (65 | 3.2%).
Production, Transportation and Moving Occupations by Sex
| Occupation | Male | Female |
| Production | 33 (38.4%) | 53 (61.6%) |
| Transportation | 101 (100.0%) | 0 (0.0%) |
| Material Moving | 58 (89.2%) | 7 (10.8%) |
| Total (Category) | 192 (76.2%) | 60 (23.8%) |
| Total (Overall) | 1,278 (62.0%) | 785 (38.1%) |
Employment Industries by Sex in Crandall
Employment Industries in Crandall
The major employment industries in Crandall include Educational Services (246 | 11.9%), Finance & Insurance (173 | 8.4%), Professional & Scientific (173 | 8.4%), Construction (171 | 8.3%), and Accommodation & Food Services (162 | 7.9%).
Employment Industries by Sex in Crandall
The Crandall industries that see more men than women are Real Estate, Rental & Leasing (100.0%), Arts, Entertainment & Recreation (100.0%), and Construction (95.3%), whereas the industries that tend to have a higher number of women are Health Care & Social Assistance (90.1%), Educational Services (86.6%), and Information (80.5%).
| Industry | Male | Female |
| Agriculture, Fishing & Hunting | 53 (91.4%) | 5 (8.6%) |
| Mining, Quarrying, & Extraction | 0 (0.0%) | 0 (0.0%) |
| Construction | 163 (95.3%) | 8 (4.7%) |
| Manufacturing | 124 (78.0%) | 35 (22.0%) |
| Wholesale Trade | 69 (86.3%) | 11 (13.8%) |
| Retail Trade | 94 (60.3%) | 62 (39.7%) |
| Transportation & Warehousing | 135 (87.1%) | 20 (12.9%) |
| Utilities | 12 (63.2%) | 7 (36.8%) |
| Information | 16 (19.5%) | 66 (80.5%) |
| Finance & Insurance | 104 (60.1%) | 69 (39.9%) |
| Real Estate, Rental & Leasing | 9 (100.0%) | 0 (0.0%) |
| Professional & Scientific | 98 (56.7%) | 75 (43.3%) |
| Enterprise Management | 0 (0.0%) | 0 (0.0%) |
| Administrative & Support | 23 (67.6%) | 11 (32.4%) |
| Educational Services | 33 (13.4%) | 213 (86.6%) |
| Health Care & Social Assistance | 14 (9.9%) | 128 (90.1%) |
| Arts, Entertainment & Recreation | 77 (100.0%) | 0 (0.0%) |
| Accommodation & Food Services | 142 (87.6%) | 20 (12.3%) |
| Public Administration | 63 (58.3%) | 45 (41.7%) |
| Total | 1,278 (62.0%) | 785 (38.1%) |
Education in Crandall
School Enrollment in Crandall
The most common levels of schooling among the 1,175 students in Crandall are middle school (254 | 21.6%), high school (248 | 21.1%), and college / undergraduate (239 | 20.3%).
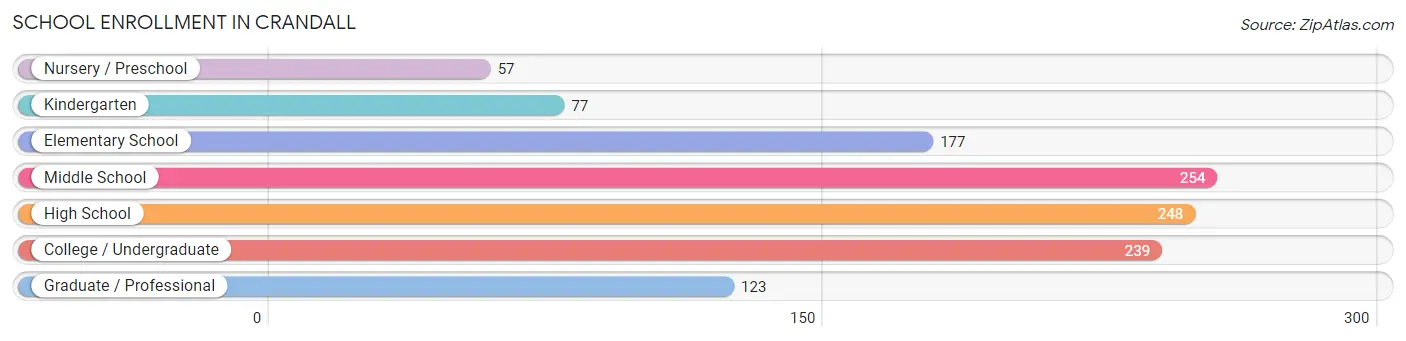
| School Level | # Students | % Students |
| Nursery / Preschool | 57 | 4.9% |
| Kindergarten | 77 | 6.6% |
| Elementary School | 177 | 15.1% |
| Middle School | 254 | 21.6% |
| High School | 248 | 21.1% |
| College / Undergraduate | 239 | 20.3% |
| Graduate / Professional | 123 | 10.5% |
| Total | 1,175 | 100.0% |
School Enrollment by Age by Funding Source in Crandall
Out of a total of 1,175 students who are enrolled in schools in Crandall, 152 (12.9%) attend a private institution, while the remaining 1,023 (87.1%) are enrolled in public schools. The age group of 18 to 19 year olds has the highest likelihood of being enrolled in private schools, with 4 (100.0% in the age bracket) enrolled. Conversely, the age group of 20 to 24 year olds has the lowest likelihood of being enrolled in a private school, with 205 (100.0% in the age bracket) attending a public institution.
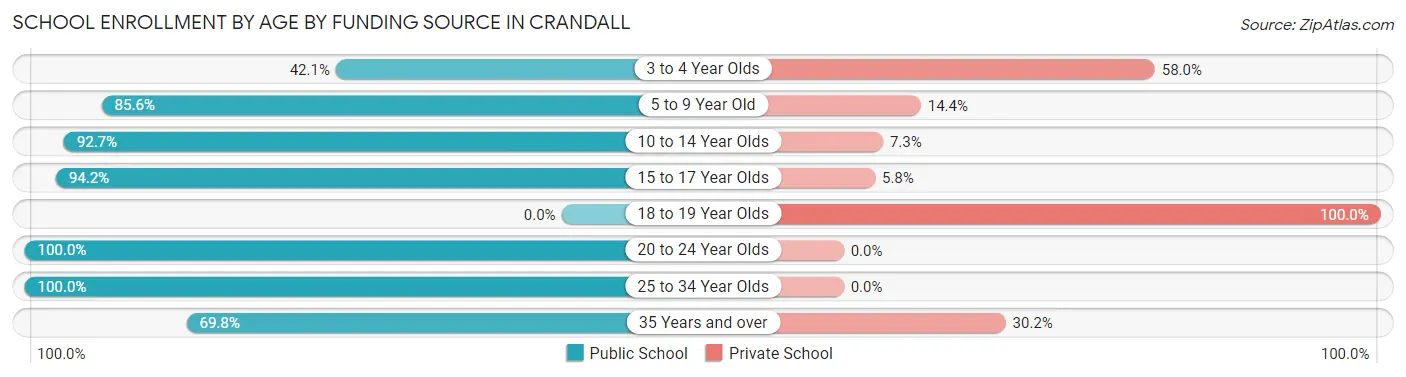
| Age Bracket | Public School | Private School |
| 3 to 4 Year Olds | 37 (42.0%) | 51 (58.0%) |
| 5 to 9 Year Old | 161 (85.6%) | 27 (14.4%) |
| 10 to 14 Year Olds | 228 (92.7%) | 18 (7.3%) |
| 15 to 17 Year Olds | 274 (94.2%) | 17 (5.8%) |
| 18 to 19 Year Olds | 0 (0.0%) | 4 (100.0%) |
| 20 to 24 Year Olds | 205 (100.0%) | 0 (0.0%) |
| 25 to 34 Year Olds | 37 (100.0%) | 0 (0.0%) |
| 35 Years and over | 81 (69.8%) | 35 (30.2%) |
| Total | 1,023 (87.1%) | 152 (12.9%) |
Educational Attainment by Field of Study in Crandall
Education (143 | 23.2%), business (129 | 20.9%), science & technology (54 | 8.8%), liberal arts & history (46 | 7.5%), and visual & performing arts (39 | 6.3%) are the most common fields of study among 616 individuals in Crandall who have obtained a bachelor's degree or higher.
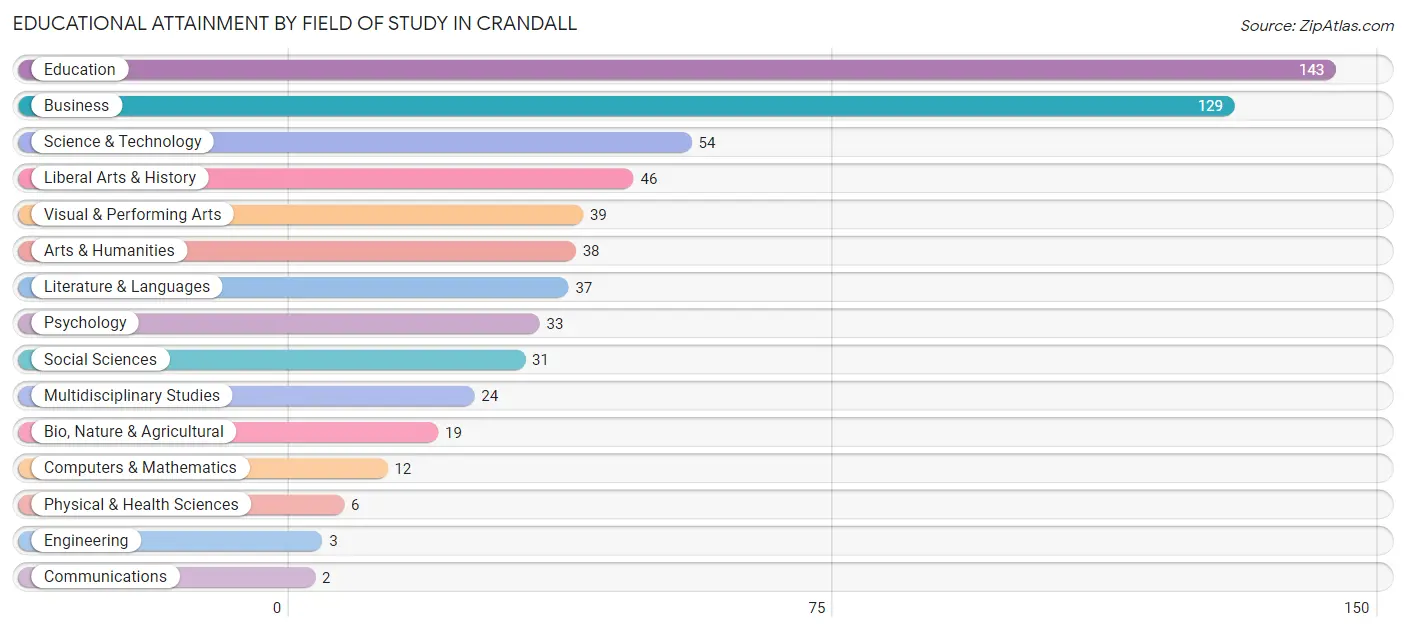
| Field of Study | # Graduates | % Graduates |
| Computers & Mathematics | 12 | 1.9% |
| Bio, Nature & Agricultural | 19 | 3.1% |
| Physical & Health Sciences | 6 | 1.0% |
| Psychology | 33 | 5.4% |
| Social Sciences | 31 | 5.0% |
| Engineering | 3 | 0.5% |
| Multidisciplinary Studies | 24 | 3.9% |
| Science & Technology | 54 | 8.8% |
| Business | 129 | 20.9% |
| Education | 143 | 23.2% |
| Literature & Languages | 37 | 6.0% |
| Liberal Arts & History | 46 | 7.5% |
| Visual & Performing Arts | 39 | 6.3% |
| Communications | 2 | 0.3% |
| Arts & Humanities | 38 | 6.2% |
| Total | 616 | 100.0% |
Transportation & Commute in Crandall
Vehicle Availability by Sex in Crandall
The most prevalent vehicle ownership categories in Crandall are males with 3 vehicles (578, accounting for 45.2%) and females with 3 vehicles (215, making up 73.6%).
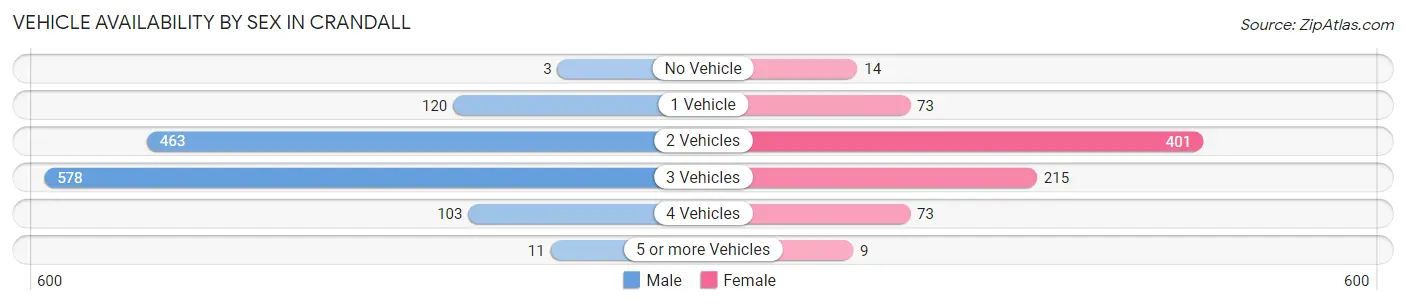
| Vehicles Available | Male | Female |
| No Vehicle | 3 (0.2%) | 14 (1.8%) |
| 1 Vehicle | 120 (9.4%) | 73 (9.3%) |
| 2 Vehicles | 463 (36.2%) | 401 (51.1%) |
| 3 Vehicles | 578 (45.2%) | 215 (27.4%) |
| 4 Vehicles | 103 (8.1%) | 73 (9.3%) |
| 5 or more Vehicles | 11 (0.9%) | 9 (1.1%) |
| Total | 1,278 (100.0%) | 785 (100.0%) |
Commute Time in Crandall
The most frequently occuring commute durations in Crandall are 60 to 89 minutes (250 commuters, 14.0%), 45 to 59 minutes (244 commuters, 13.7%), and 30 to 34 minutes (230 commuters, 12.9%).
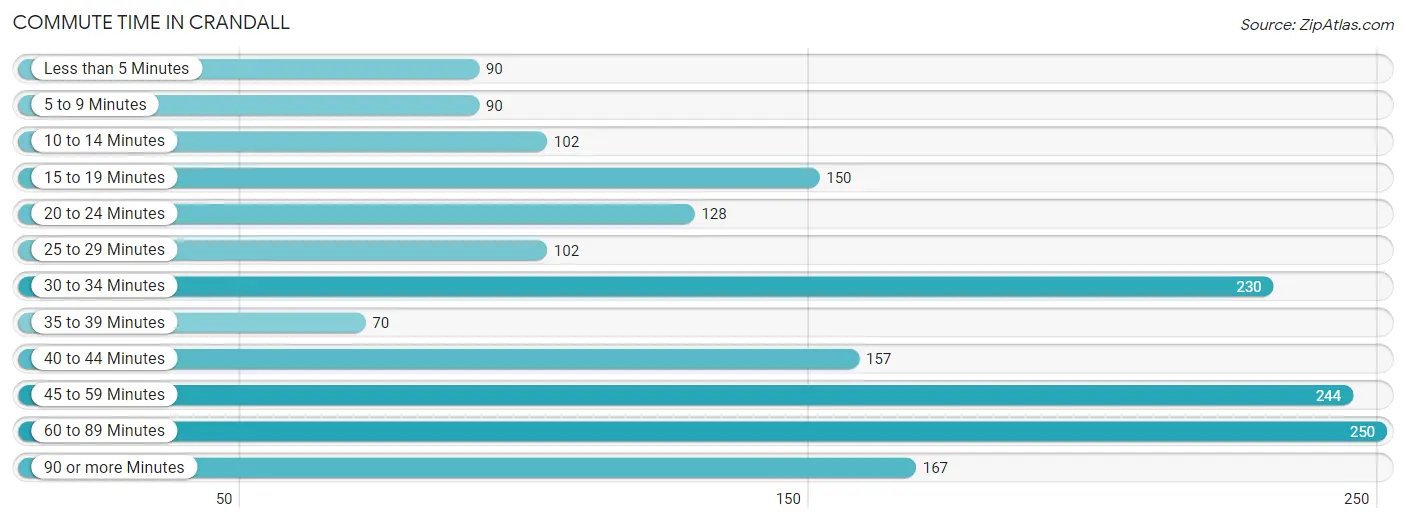
| Commute Time | # Commuters | % Commuters |
| Less than 5 Minutes | 90 | 5.1% |
| 5 to 9 Minutes | 90 | 5.1% |
| 10 to 14 Minutes | 102 | 5.7% |
| 15 to 19 Minutes | 150 | 8.4% |
| 20 to 24 Minutes | 128 | 7.2% |
| 25 to 29 Minutes | 102 | 5.7% |
| 30 to 34 Minutes | 230 | 12.9% |
| 35 to 39 Minutes | 70 | 3.9% |
| 40 to 44 Minutes | 157 | 8.8% |
| 45 to 59 Minutes | 244 | 13.7% |
| 60 to 89 Minutes | 250 | 14.0% |
| 90 or more Minutes | 167 | 9.4% |
Commute Time by Sex in Crandall
The most common commute times in Crandall are 45 to 59 minutes (163 commuters, 14.5%) for males and 15 to 19 minutes (99 commuters, 15.1%) for females.
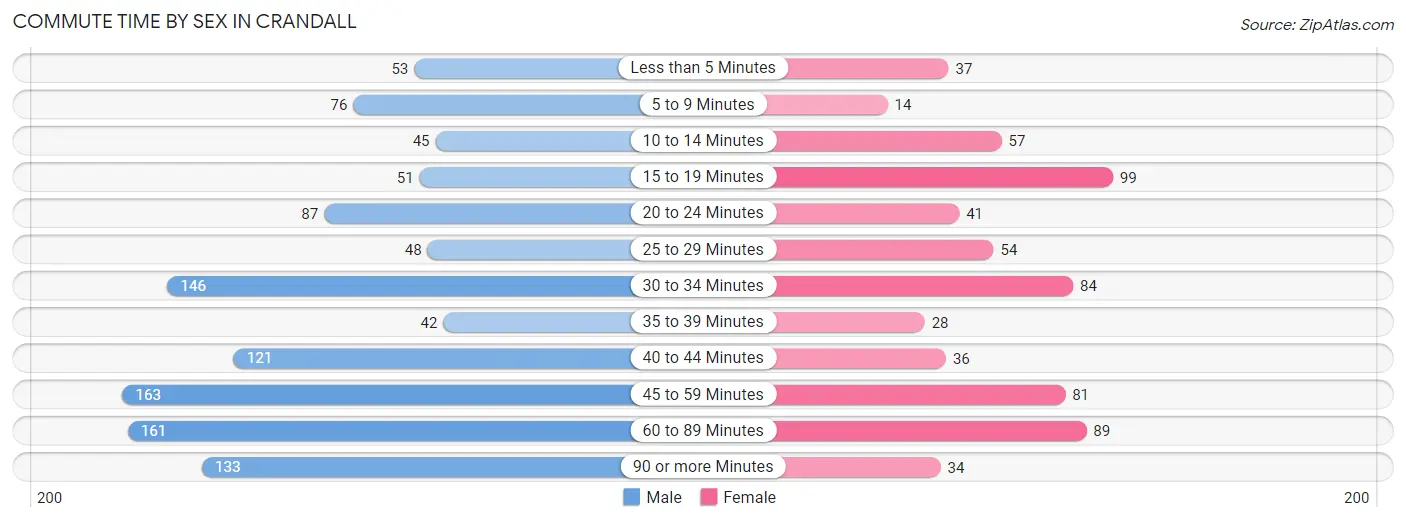
| Commute Time | Male | Female |
| Less than 5 Minutes | 53 (4.7%) | 37 (5.7%) |
| 5 to 9 Minutes | 76 (6.8%) | 14 (2.1%) |
| 10 to 14 Minutes | 45 (4.0%) | 57 (8.7%) |
| 15 to 19 Minutes | 51 (4.5%) | 99 (15.1%) |
| 20 to 24 Minutes | 87 (7.7%) | 41 (6.3%) |
| 25 to 29 Minutes | 48 (4.3%) | 54 (8.3%) |
| 30 to 34 Minutes | 146 (13.0%) | 84 (12.8%) |
| 35 to 39 Minutes | 42 (3.7%) | 28 (4.3%) |
| 40 to 44 Minutes | 121 (10.7%) | 36 (5.5%) |
| 45 to 59 Minutes | 163 (14.5%) | 81 (12.4%) |
| 60 to 89 Minutes | 161 (14.3%) | 89 (13.6%) |
| 90 or more Minutes | 133 (11.8%) | 34 (5.2%) |
Time of Departure to Work by Sex in Crandall
The most frequent times of departure to work in Crandall are 6:30 AM to 6:59 AM (205, 18.2%) for males and 7:00 AM to 7:29 AM (211, 32.3%) for females.
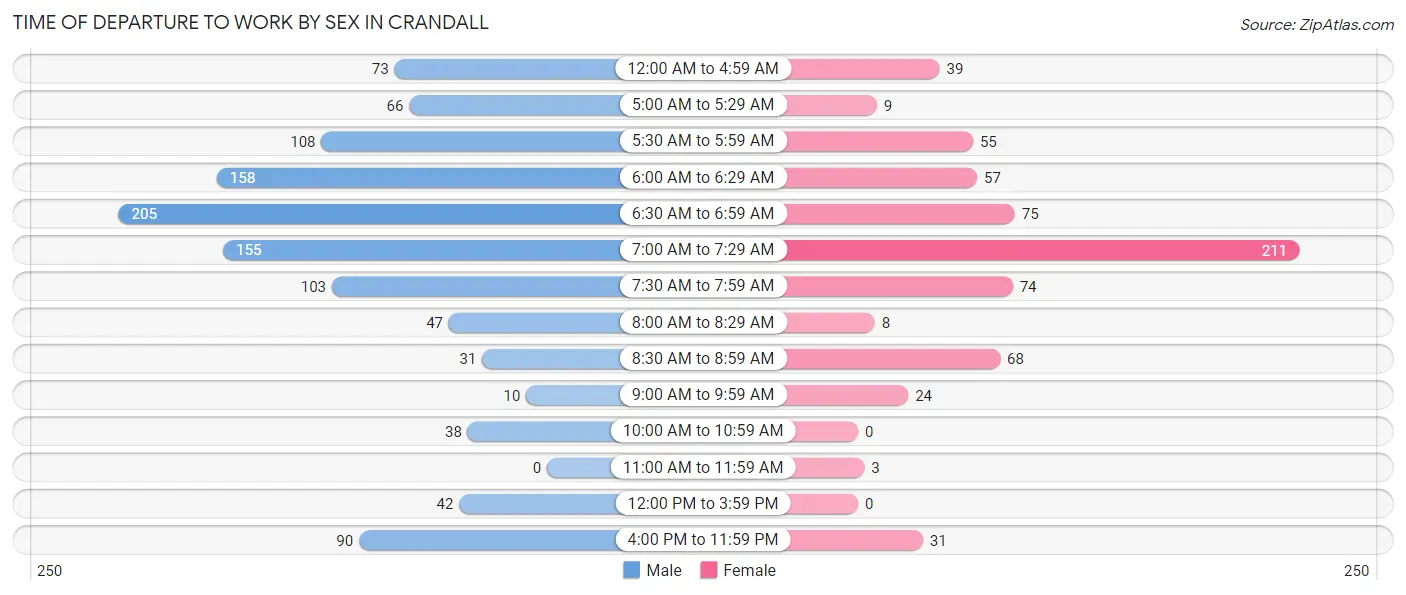
| Time of Departure | Male | Female |
| 12:00 AM to 4:59 AM | 73 (6.5%) | 39 (6.0%) |
| 5:00 AM to 5:29 AM | 66 (5.9%) | 9 (1.4%) |
| 5:30 AM to 5:59 AM | 108 (9.6%) | 55 (8.4%) |
| 6:00 AM to 6:29 AM | 158 (14.0%) | 57 (8.7%) |
| 6:30 AM to 6:59 AM | 205 (18.2%) | 75 (11.5%) |
| 7:00 AM to 7:29 AM | 155 (13.8%) | 211 (32.3%) |
| 7:30 AM to 7:59 AM | 103 (9.1%) | 74 (11.3%) |
| 8:00 AM to 8:29 AM | 47 (4.2%) | 8 (1.2%) |
| 8:30 AM to 8:59 AM | 31 (2.8%) | 68 (10.4%) |
| 9:00 AM to 9:59 AM | 10 (0.9%) | 24 (3.7%) |
| 10:00 AM to 10:59 AM | 38 (3.4%) | 0 (0.0%) |
| 11:00 AM to 11:59 AM | 0 (0.0%) | 3 (0.5%) |
| 12:00 PM to 3:59 PM | 42 (3.7%) | 0 (0.0%) |
| 4:00 PM to 11:59 PM | 90 (8.0%) | 31 (4.7%) |
| Total | 1,126 (100.0%) | 654 (100.0%) |
Housing Occupancy in Crandall
Occupancy by Ownership in Crandall
Of the total 1,362 dwellings in Crandall, owner-occupied units account for 1,204 (88.4%), while renter-occupied units make up 158 (11.6%).
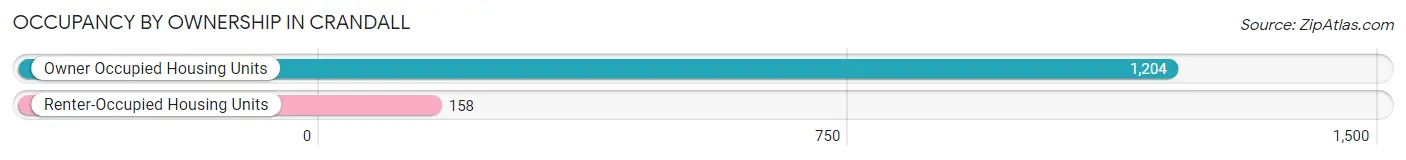
| Occupancy | # Housing Units | % Housing Units |
| Owner Occupied Housing Units | 1,204 | 88.4% |
| Renter-Occupied Housing Units | 158 | 11.6% |
| Total Occupied Housing Units | 1,362 | 100.0% |
Occupancy by Household Size in Crandall
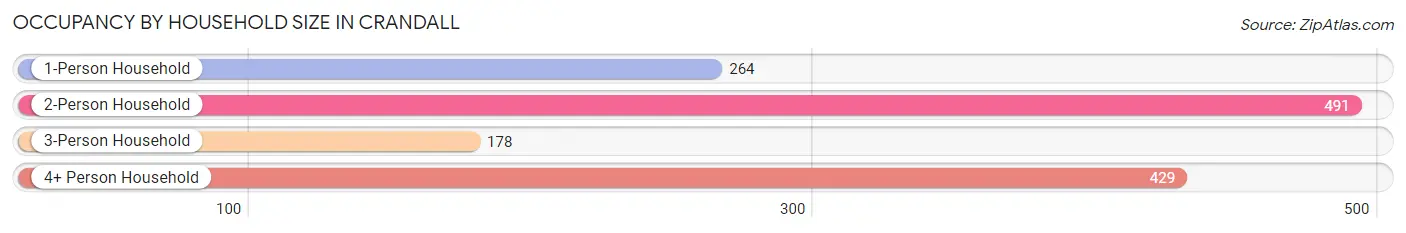
| Household Size | # Housing Units | % Housing Units |
| 1-Person Household | 264 | 19.4% |
| 2-Person Household | 491 | 36.0% |
| 3-Person Household | 178 | 13.1% |
| 4+ Person Household | 429 | 31.5% |
| Total Housing Units | 1,362 | 100.0% |
Occupancy by Ownership by Household Size in Crandall
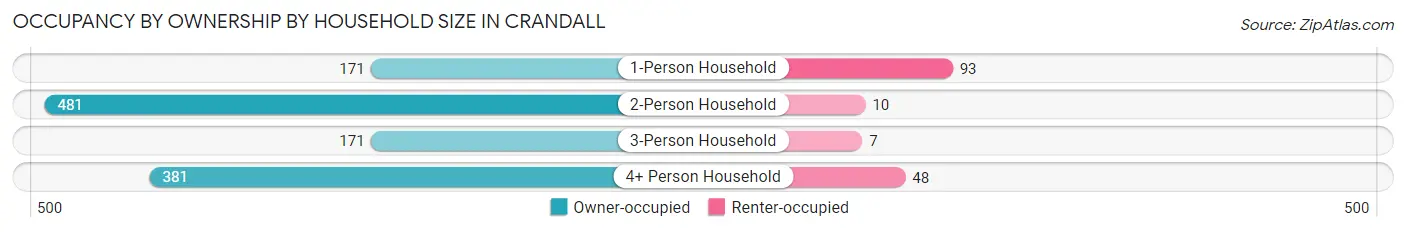
| Household Size | Owner-occupied | Renter-occupied |
| 1-Person Household | 171 (64.8%) | 93 (35.2%) |
| 2-Person Household | 481 (98.0%) | 10 (2.0%) |
| 3-Person Household | 171 (96.1%) | 7 (3.9%) |
| 4+ Person Household | 381 (88.8%) | 48 (11.2%) |
| Total Housing Units | 1,204 (88.4%) | 158 (11.6%) |
Occupancy by Educational Attainment in Crandall
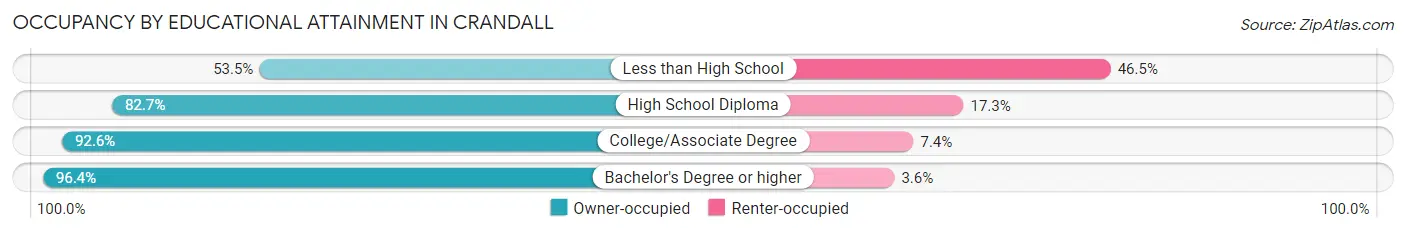
| Household Size | Owner-occupied | Renter-occupied |
| Less than High School | 46 (53.5%) | 40 (46.5%) |
| High School Diploma | 291 (82.7%) | 61 (17.3%) |
| College/Associate Degree | 575 (92.6%) | 46 (7.4%) |
| Bachelor's Degree or higher | 292 (96.4%) | 11 (3.6%) |
Occupancy by Age of Householder in Crandall
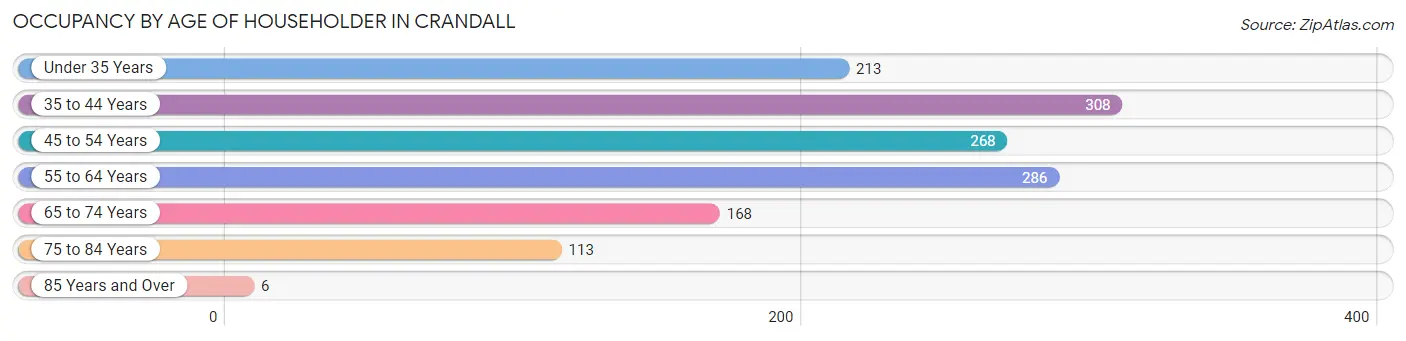
| Age Bracket | # Households | % Households |
| Under 35 Years | 213 | 15.6% |
| 35 to 44 Years | 308 | 22.6% |
| 45 to 54 Years | 268 | 19.7% |
| 55 to 64 Years | 286 | 21.0% |
| 65 to 74 Years | 168 | 12.3% |
| 75 to 84 Years | 113 | 8.3% |
| 85 Years and Over | 6 | 0.4% |
| Total | 1,362 | 100.0% |
Housing Finances in Crandall
Median Income by Occupancy in Crandall
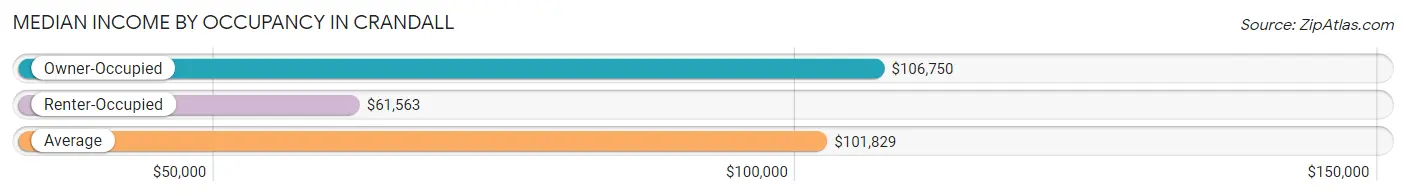
| Occupancy Type | # Households | Median Income |
| Owner-Occupied | 1,204 (88.4%) | $106,750 |
| Renter-Occupied | 158 (11.6%) | $61,563 |
| Average | 1,362 (100.0%) | $101,829 |
Occupancy by Householder Income Bracket in Crandall
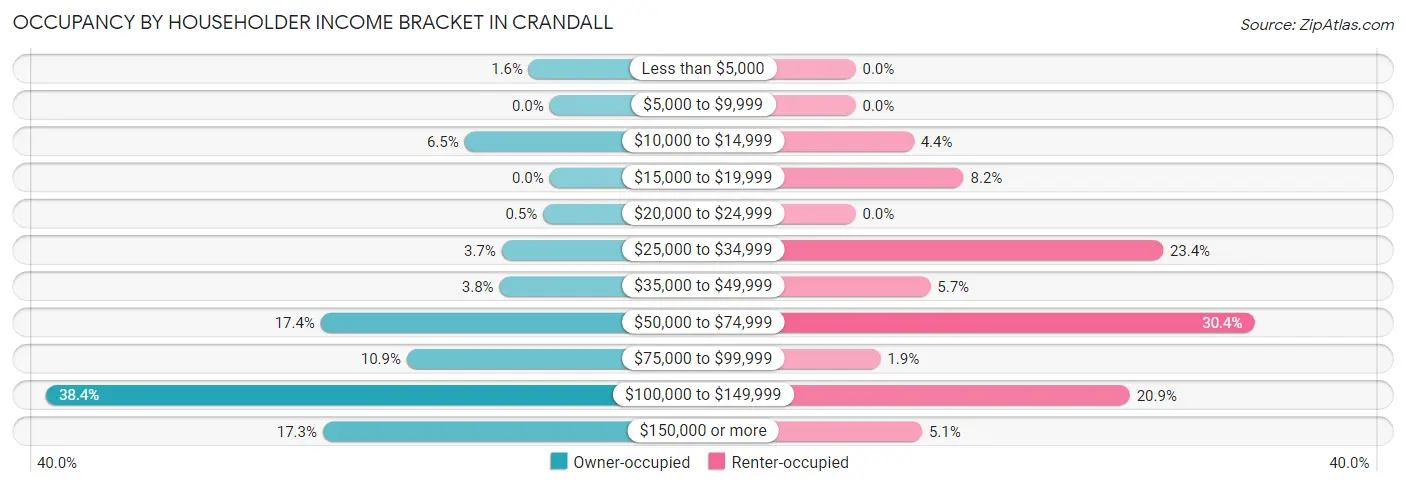
| Income Bracket | Owner-occupied | Renter-occupied |
| Less than $5,000 | 19 (1.6%) | 0 (0.0%) |
| $5,000 to $9,999 | 0 (0.0%) | 0 (0.0%) |
| $10,000 to $14,999 | 78 (6.5%) | 7 (4.4%) |
| $15,000 to $19,999 | 0 (0.0%) | 13 (8.2%) |
| $20,000 to $24,999 | 6 (0.5%) | 0 (0.0%) |
| $25,000 to $34,999 | 44 (3.6%) | 37 (23.4%) |
| $35,000 to $49,999 | 46 (3.8%) | 9 (5.7%) |
| $50,000 to $74,999 | 210 (17.4%) | 48 (30.4%) |
| $75,000 to $99,999 | 131 (10.9%) | 3 (1.9%) |
| $100,000 to $149,999 | 462 (38.4%) | 33 (20.9%) |
| $150,000 or more | 208 (17.3%) | 8 (5.1%) |
| Total | 1,204 (100.0%) | 158 (100.0%) |
Monthly Housing Cost Tiers in Crandall
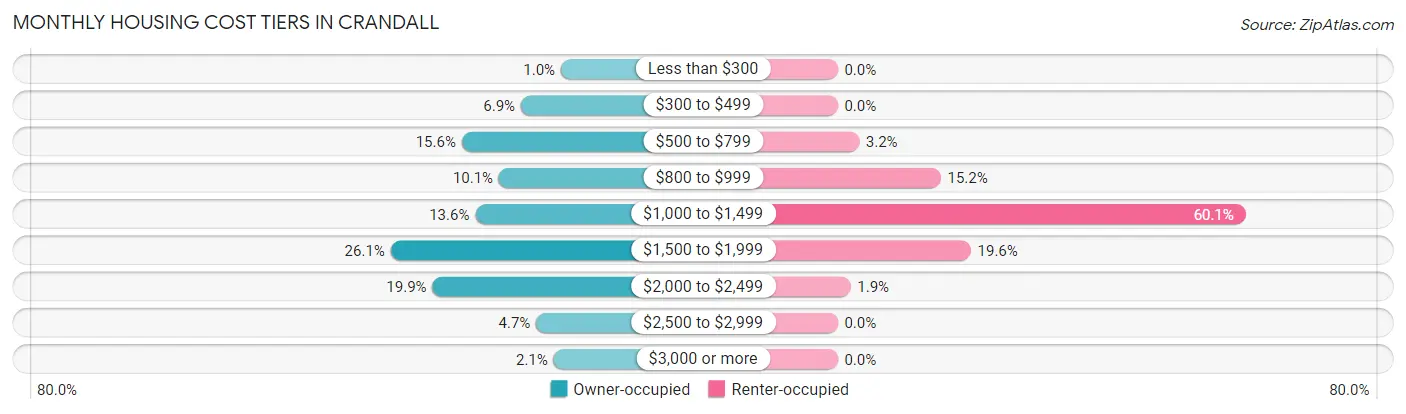
| Monthly Cost | Owner-occupied | Renter-occupied |
| Less than $300 | 12 (1.0%) | 0 (0.0%) |
| $300 to $499 | 83 (6.9%) | 0 (0.0%) |
| $500 to $799 | 188 (15.6%) | 5 (3.2%) |
| $800 to $999 | 122 (10.1%) | 24 (15.2%) |
| $1,000 to $1,499 | 164 (13.6%) | 95 (60.1%) |
| $1,500 to $1,999 | 314 (26.1%) | 31 (19.6%) |
| $2,000 to $2,499 | 240 (19.9%) | 3 (1.9%) |
| $2,500 to $2,999 | 56 (4.6%) | 0 (0.0%) |
| $3,000 or more | 25 (2.1%) | 0 (0.0%) |
| Total | 1,204 (100.0%) | 158 (100.0%) |
Physical Housing Characteristics in Crandall
Housing Structures in Crandall
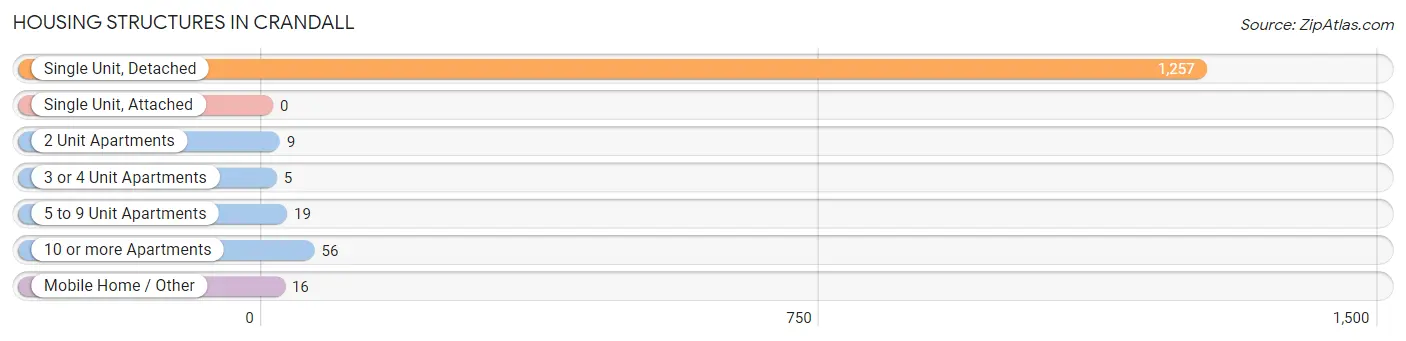
| Structure Type | # Housing Units | % Housing Units |
| Single Unit, Detached | 1,257 | 92.3% |
| Single Unit, Attached | 0 | 0.0% |
| 2 Unit Apartments | 9 | 0.7% |
| 3 or 4 Unit Apartments | 5 | 0.4% |
| 5 to 9 Unit Apartments | 19 | 1.4% |
| 10 or more Apartments | 56 | 4.1% |
| Mobile Home / Other | 16 | 1.2% |
| Total | 1,362 | 100.0% |
Housing Structures by Occupancy in Crandall
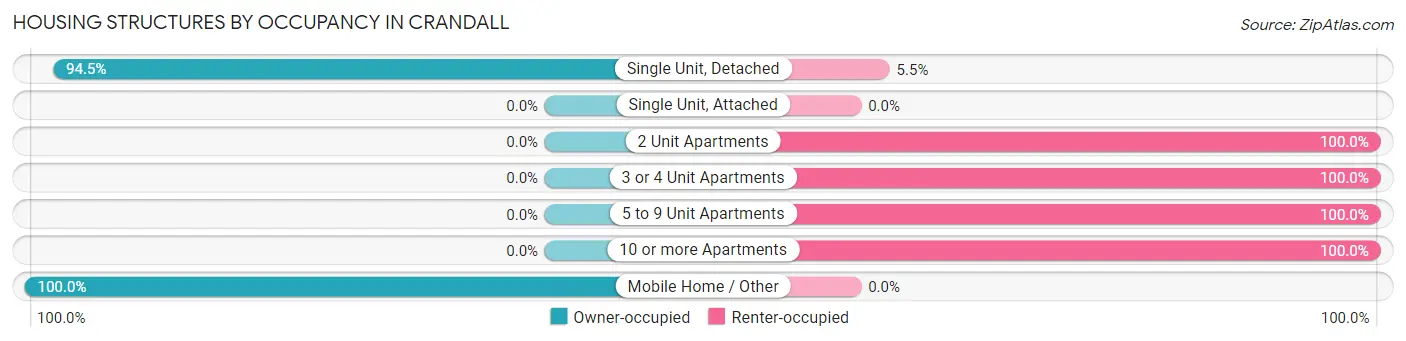
| Structure Type | Owner-occupied | Renter-occupied |
| Single Unit, Detached | 1,188 (94.5%) | 69 (5.5%) |
| Single Unit, Attached | 0 (0.0%) | 0 (0.0%) |
| 2 Unit Apartments | 0 (0.0%) | 9 (100.0%) |
| 3 or 4 Unit Apartments | 0 (0.0%) | 5 (100.0%) |
| 5 to 9 Unit Apartments | 0 (0.0%) | 19 (100.0%) |
| 10 or more Apartments | 0 (0.0%) | 56 (100.0%) |
| Mobile Home / Other | 16 (100.0%) | 0 (0.0%) |
| Total | 1,204 (88.4%) | 158 (11.6%) |
Housing Structures by Number of Rooms in Crandall
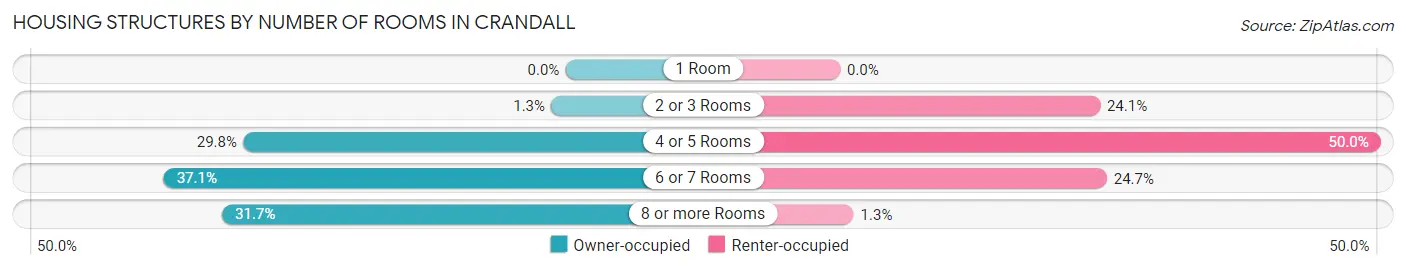
| Number of Rooms | Owner-occupied | Renter-occupied |
| 1 Room | 0 (0.0%) | 0 (0.0%) |
| 2 or 3 Rooms | 16 (1.3%) | 38 (24.0%) |
| 4 or 5 Rooms | 359 (29.8%) | 79 (50.0%) |
| 6 or 7 Rooms | 447 (37.1%) | 39 (24.7%) |
| 8 or more Rooms | 382 (31.7%) | 2 (1.3%) |
| Total | 1,204 (100.0%) | 158 (100.0%) |
Housing Structure by Heating Type in Crandall
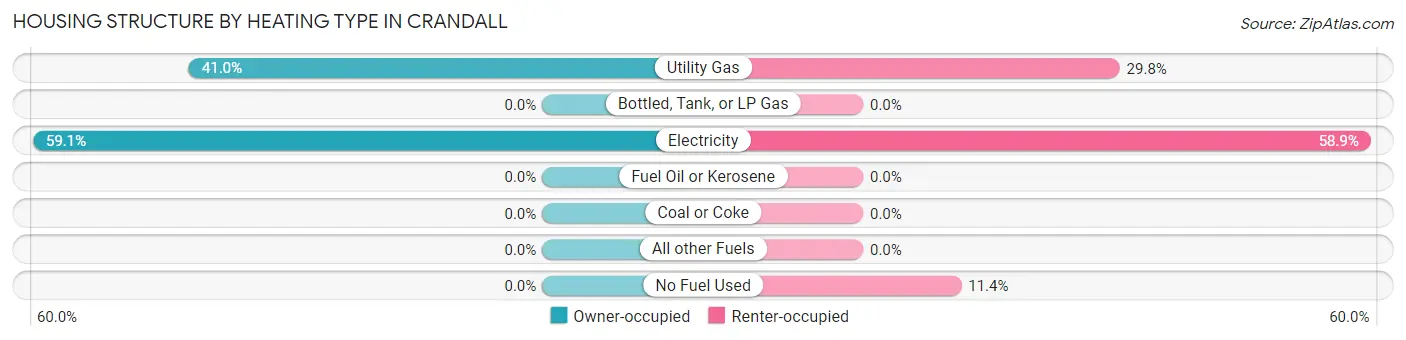
| Heating Type | Owner-occupied | Renter-occupied |
| Utility Gas | 493 (40.9%) | 47 (29.7%) |
| Bottled, Tank, or LP Gas | 0 (0.0%) | 0 (0.0%) |
| Electricity | 711 (59.1%) | 93 (58.9%) |
| Fuel Oil or Kerosene | 0 (0.0%) | 0 (0.0%) |
| Coal or Coke | 0 (0.0%) | 0 (0.0%) |
| All other Fuels | 0 (0.0%) | 0 (0.0%) |
| No Fuel Used | 0 (0.0%) | 18 (11.4%) |
| Total | 1,204 (100.0%) | 158 (100.0%) |
Household Vehicle Usage in Crandall
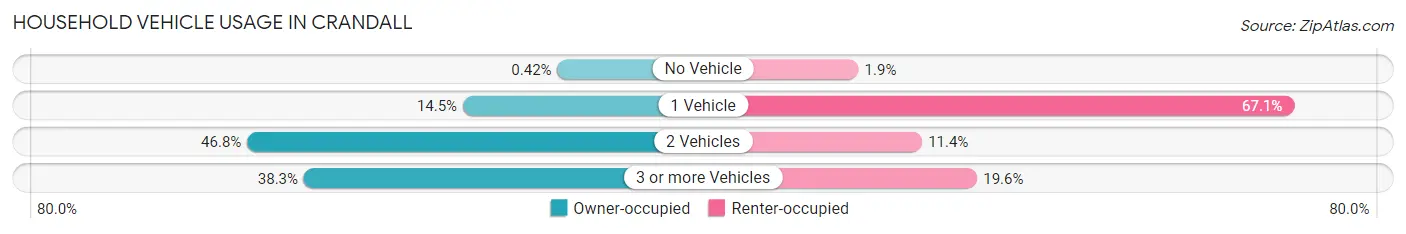
| Vehicles per Household | Owner-occupied | Renter-occupied |
| No Vehicle | 5 (0.4%) | 3 (1.9%) |
| 1 Vehicle | 175 (14.5%) | 106 (67.1%) |
| 2 Vehicles | 563 (46.8%) | 18 (11.4%) |
| 3 or more Vehicles | 461 (38.3%) | 31 (19.6%) |
| Total | 1,204 (100.0%) | 158 (100.0%) |
Real Estate & Mortgages in Crandall
Real Estate and Mortgage Overview in Crandall
| Characteristic | Without Mortgage | With Mortgage |
| Housing Units | 491 | 713 |
| Median Property Value | $200,800 | $257,400 |
| Median Household Income | $105,625 | $123 |
| Monthly Housing Costs | $759 | $25 |
| Real Estate Taxes | $3,446 | $4 |
Property Value by Mortgage Status in Crandall
| Property Value | Without Mortgage | With Mortgage |
| Less than $50,000 | 0 (0.0%) | 4 (0.6%) |
| $50,000 to $99,999 | 58 (11.8%) | 13 (1.8%) |
| $100,000 to $299,999 | 329 (67.0%) | 498 (69.9%) |
| $300,000 to $499,999 | 85 (17.3%) | 198 (27.8%) |
| $500,000 to $749,999 | 19 (3.9%) | 0 (0.0%) |
| $750,000 to $999,999 | 0 (0.0%) | 0 (0.0%) |
| $1,000,000 or more | 0 (0.0%) | 0 (0.0%) |
| Total | 491 (100.0%) | 713 (100.0%) |
Household Income by Mortgage Status in Crandall
| Household Income | Without Mortgage | With Mortgage |
| Less than $10,000 | 12 (2.4%) | 0 (0.0%) |
| $10,000 to $24,999 | 78 (15.9%) | 7 (1.0%) |
| $25,000 to $34,999 | 44 (9.0%) | 6 (0.8%) |
| $35,000 to $49,999 | 31 (6.3%) | 0 (0.0%) |
| $50,000 to $74,999 | 54 (11.0%) | 15 (2.1%) |
| $75,000 to $99,999 | 0 (0.0%) | 156 (21.9%) |
| $100,000 to $149,999 | 187 (38.1%) | 131 (18.4%) |
| $150,000 or more | 85 (17.3%) | 275 (38.6%) |
| Total | 491 (100.0%) | 713 (100.0%) |
Property Value to Household Income Ratio in Crandall
| Value-to-Income Ratio | Without Mortgage | With Mortgage |
| Less than 2.0x | 186 (37.9%) | 108,203 (15,175.7%) |
| 2.0x to 2.9x | 91 (18.5%) | 242 (33.9%) |
| 3.0x to 3.9x | 24 (4.9%) | 175 (24.5%) |
| 4.0x or more | 178 (36.2%) | 161 (22.6%) |
| Total | 491 (100.0%) | 713 (100.0%) |
Real Estate Taxes by Mortgage Status in Crandall
| Property Taxes | Without Mortgage | With Mortgage |
| Less than $800 | 5 (1.0%) | 7 (1.0%) |
| $800 to $1,499 | 103 (21.0%) | 5 (0.7%) |
| $800 to $1,499 | 371 (75.6%) | 10 (1.4%) |
| Total | 491 (100.0%) | 713 (100.0%) |
Health & Disability in Crandall
Health Insurance Coverage by Age in Crandall
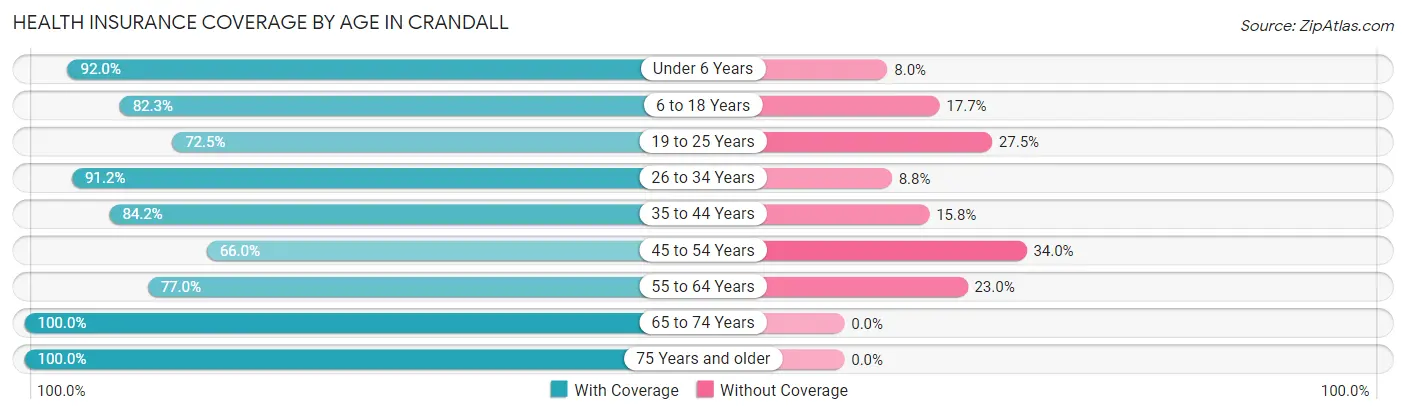
| Age Bracket | With Coverage | Without Coverage |
| Under 6 Years | 332 (92.0%) | 29 (8.0%) |
| 6 to 18 Years | 575 (82.3%) | 124 (17.7%) |
| 19 to 25 Years | 308 (72.5%) | 117 (27.5%) |
| 26 to 34 Years | 299 (91.2%) | 29 (8.8%) |
| 35 to 44 Years | 505 (84.2%) | 95 (15.8%) |
| 45 to 54 Years | 482 (66.0%) | 248 (34.0%) |
| 55 to 64 Years | 332 (77.0%) | 99 (23.0%) |
| 65 to 74 Years | 295 (100.0%) | 0 (0.0%) |
| 75 Years and older | 159 (100.0%) | 0 (0.0%) |
| Total | 3,287 (81.6%) | 741 (18.4%) |
Health Insurance Coverage by Citizenship Status in Crandall
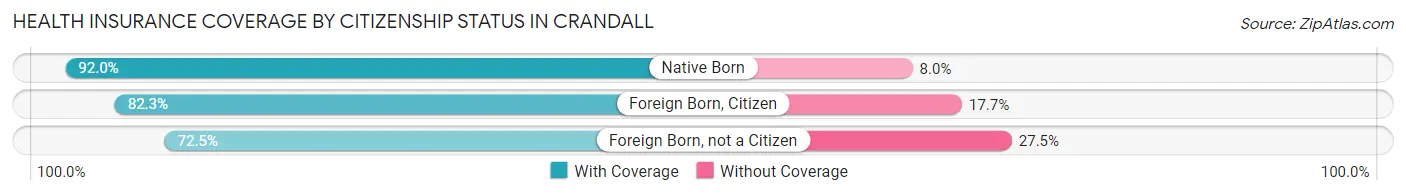
| Citizenship Status | With Coverage | Without Coverage |
| Native Born | 332 (92.0%) | 29 (8.0%) |
| Foreign Born, Citizen | 575 (82.3%) | 124 (17.7%) |
| Foreign Born, not a Citizen | 308 (72.5%) | 117 (27.5%) |
Health Insurance Coverage by Household Income in Crandall
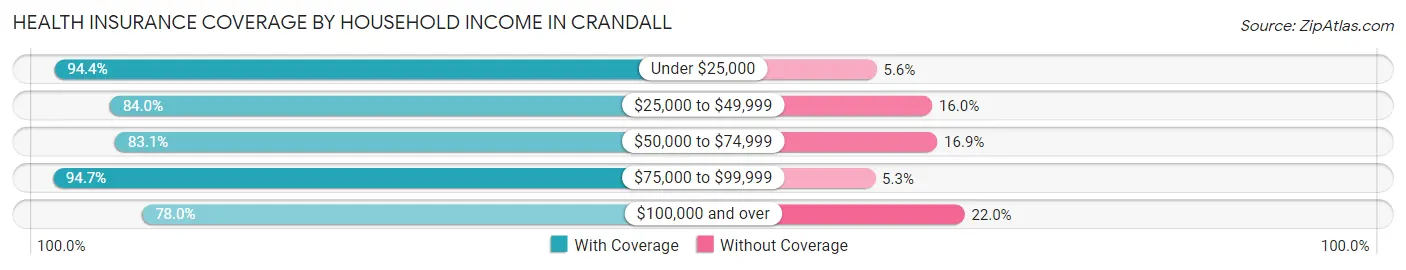
| Household Income | With Coverage | Without Coverage |
| Under $25,000 | 288 (94.4%) | 17 (5.6%) |
| $25,000 to $49,999 | 237 (84.0%) | 45 (16.0%) |
| $50,000 to $74,999 | 422 (83.1%) | 86 (16.9%) |
| $75,000 to $99,999 | 303 (94.7%) | 17 (5.3%) |
| $100,000 and over | 2,037 (78.0%) | 576 (22.0%) |
Public vs Private Health Insurance Coverage by Age in Crandall
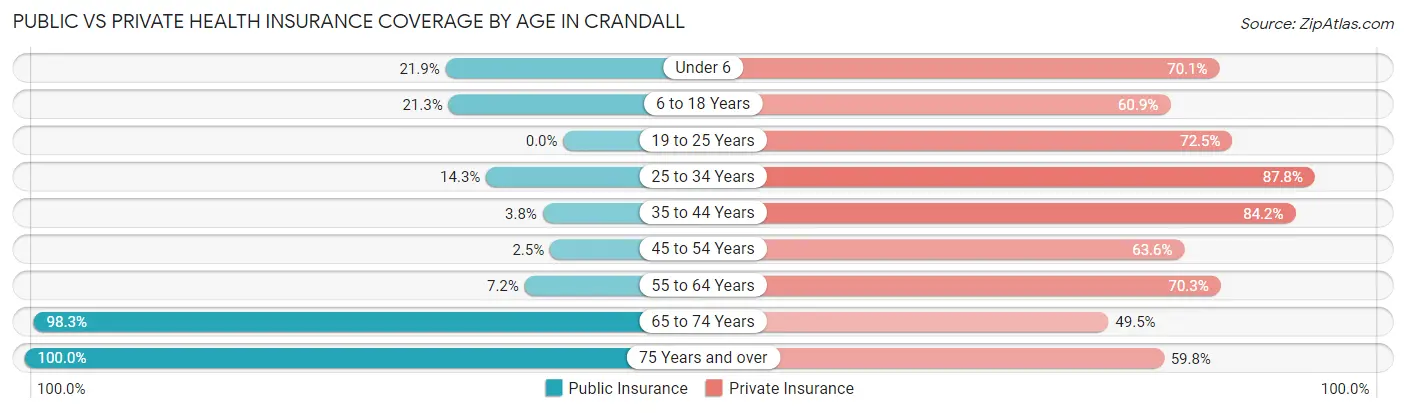
| Age Bracket | Public Insurance | Private Insurance |
| Under 6 | 79 (21.9%) | 253 (70.1%) |
| 6 to 18 Years | 149 (21.3%) | 426 (60.9%) |
| 19 to 25 Years | 0 (0.0%) | 308 (72.5%) |
| 25 to 34 Years | 47 (14.3%) | 288 (87.8%) |
| 35 to 44 Years | 23 (3.8%) | 505 (84.2%) |
| 45 to 54 Years | 18 (2.5%) | 464 (63.6%) |
| 55 to 64 Years | 31 (7.2%) | 303 (70.3%) |
| 65 to 74 Years | 290 (98.3%) | 146 (49.5%) |
| 75 Years and over | 159 (100.0%) | 95 (59.8%) |
| Total | 796 (19.8%) | 2,788 (69.2%) |
Disability Status by Sex by Age in Crandall
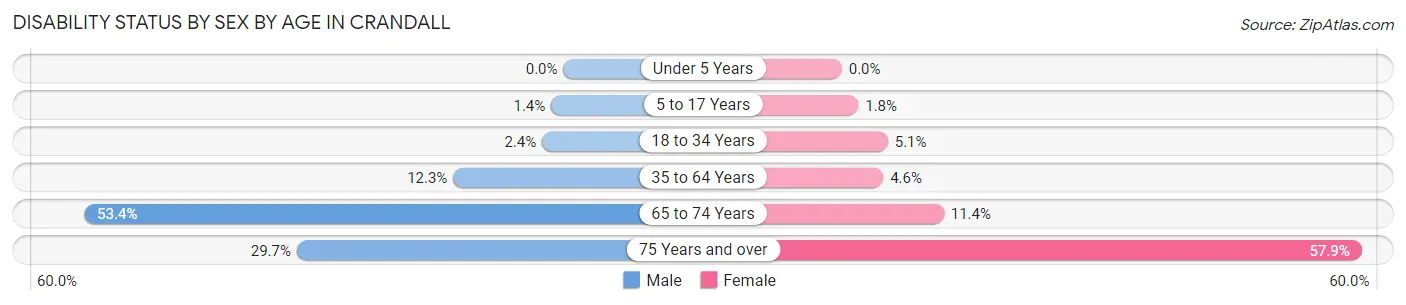
| Age Bracket | Male | Female |
| Under 5 Years | 0 (0.0%) | 0 (0.0%) |
| 5 to 17 Years | 6 (1.4%) | 6 (1.8%) |
| 18 to 34 Years | 11 (2.4%) | 15 (5.1%) |
| 35 to 64 Years | 115 (12.3%) | 38 (4.6%) |
| 65 to 74 Years | 87 (53.4%) | 15 (11.4%) |
| 75 Years and over | 19 (29.7%) | 55 (57.9%) |
Disability Class by Sex by Age in Crandall
Disability Class: Hearing Difficulty
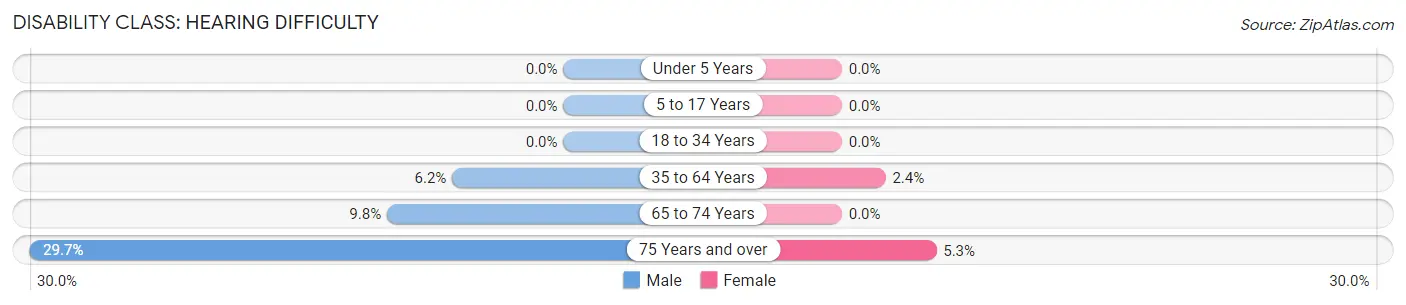
| Age Bracket | Male | Female |
| Under 5 Years | 0 (0.0%) | 0 (0.0%) |
| 5 to 17 Years | 0 (0.0%) | 0 (0.0%) |
| 18 to 34 Years | 0 (0.0%) | 0 (0.0%) |
| 35 to 64 Years | 58 (6.2%) | 20 (2.4%) |
| 65 to 74 Years | 16 (9.8%) | 0 (0.0%) |
| 75 Years and over | 19 (29.7%) | 5 (5.3%) |
Disability Class: Vision Difficulty
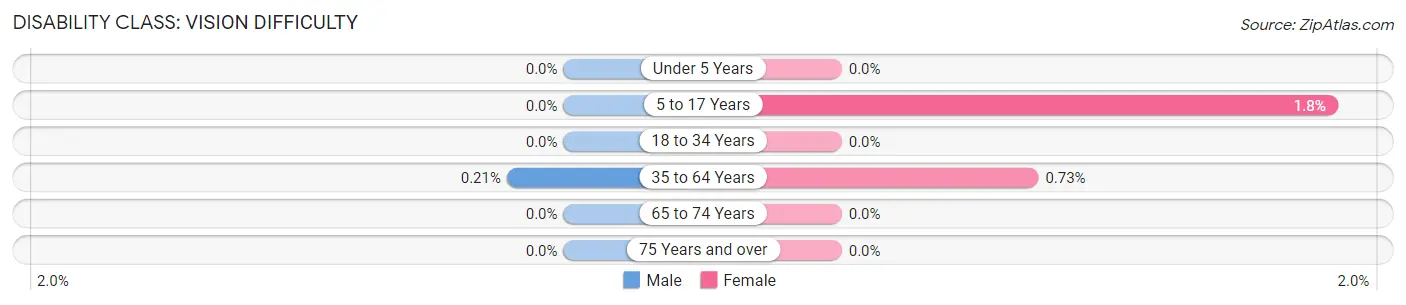
| Age Bracket | Male | Female |
| Under 5 Years | 0 (0.0%) | 0 (0.0%) |
| 5 to 17 Years | 0 (0.0%) | 6 (1.8%) |
| 18 to 34 Years | 0 (0.0%) | 0 (0.0%) |
| 35 to 64 Years | 2 (0.2%) | 6 (0.7%) |
| 65 to 74 Years | 0 (0.0%) | 0 (0.0%) |
| 75 Years and over | 0 (0.0%) | 0 (0.0%) |
Disability Class: Cognitive Difficulty
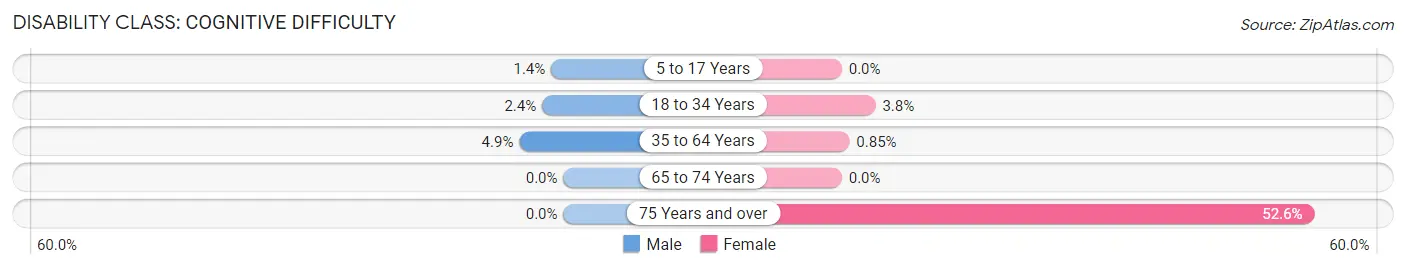
| Age Bracket | Male | Female |
| 5 to 17 Years | 6 (1.4%) | 0 (0.0%) |
| 18 to 34 Years | 11 (2.4%) | 11 (3.7%) |
| 35 to 64 Years | 46 (4.9%) | 7 (0.9%) |
| 65 to 74 Years | 0 (0.0%) | 0 (0.0%) |
| 75 Years and over | 0 (0.0%) | 50 (52.6%) |
Disability Class: Ambulatory Difficulty
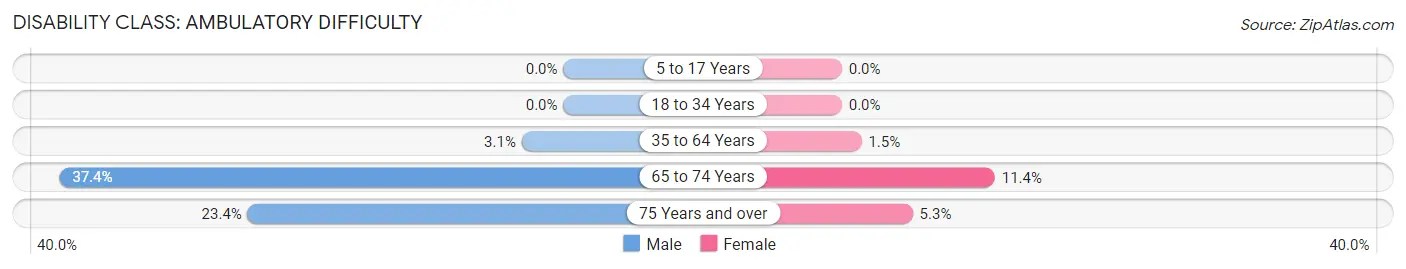
| Age Bracket | Male | Female |
| 5 to 17 Years | 0 (0.0%) | 0 (0.0%) |
| 18 to 34 Years | 0 (0.0%) | 0 (0.0%) |
| 35 to 64 Years | 29 (3.1%) | 12 (1.5%) |
| 65 to 74 Years | 61 (37.4%) | 15 (11.4%) |
| 75 Years and over | 15 (23.4%) | 5 (5.3%) |
Disability Class: Self-Care Difficulty
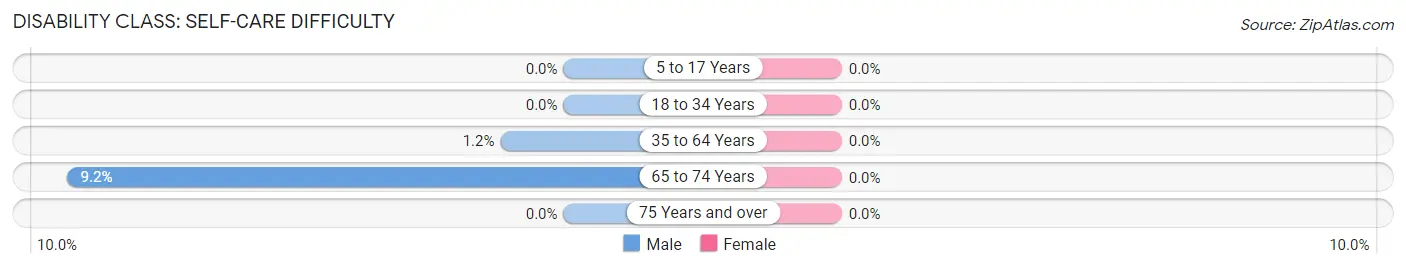
| Age Bracket | Male | Female |
| 5 to 17 Years | 0 (0.0%) | 0 (0.0%) |
| 18 to 34 Years | 0 (0.0%) | 0 (0.0%) |
| 35 to 64 Years | 11 (1.2%) | 0 (0.0%) |
| 65 to 74 Years | 15 (9.2%) | 0 (0.0%) |
| 75 Years and over | 0 (0.0%) | 0 (0.0%) |
Technology Access in Crandall
Computing Device Access in Crandall
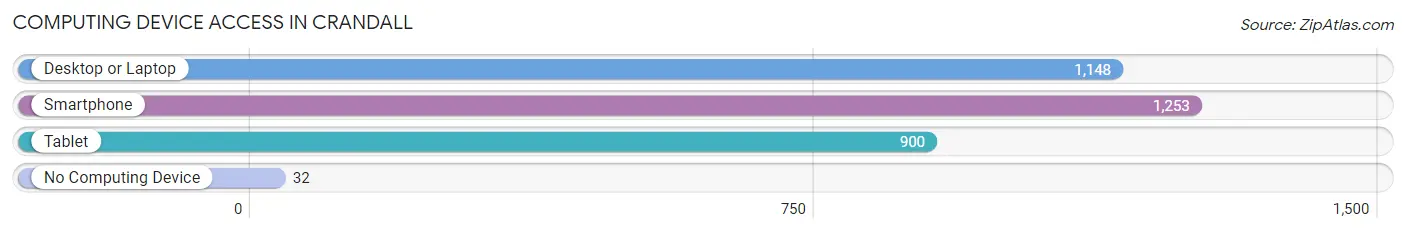
| Device Type | # Households | % Households |
| Desktop or Laptop | 1,148 | 84.3% |
| Smartphone | 1,253 | 92.0% |
| Tablet | 900 | 66.1% |
| No Computing Device | 32 | 2.4% |
| Total | 1,362 | 100.0% |
Internet Access in Crandall
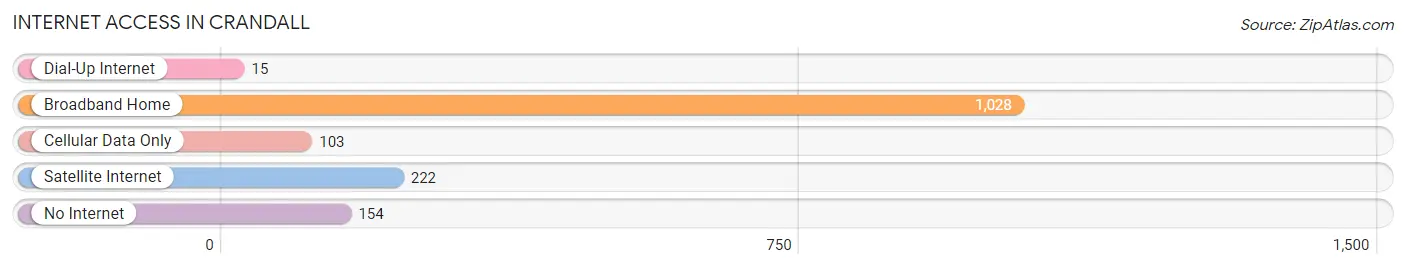
| Internet Type | # Households | % Households |
| Dial-Up Internet | 15 | 1.1% |
| Broadband Home | 1,028 | 75.5% |
| Cellular Data Only | 103 | 7.6% |
| Satellite Internet | 222 | 16.3% |
| No Internet | 154 | 11.3% |
| Total | 1,362 | 100.0% |
Crandall Summary
Crandall, Texas is a small town located in Kaufman County, Texas, about 30 miles east of Dallas. The town was founded in 1872 and named after a local rancher, William Crandall. The population of Crandall was 2,945 in the 2010 census.
Geography
Crandall is located at 32°45'25" North, 96°25'45" West (32.756944, -96.429167). It is situated in the Blackland Prairie region of North Central Texas. The town is located on the banks of the East Fork Trinity River, which flows through the town. The terrain is mostly flat, with some rolling hills in the area. The climate is humid subtropical, with hot summers and mild winters.
Economy
Crandall’s economy is largely based on agriculture and light manufacturing. The town is home to several small businesses, including a feed store, a hardware store, a grocery store, and a few restaurants. The town also has a few small industrial parks, which provide employment for many of the town’s residents.
Demographics
As of the 2010 census, the population of Crandall was 2,945. The racial makeup of the town was 79.3% White, 15.2% Hispanic or Latino, 2.2% African American, 0.7% Native American, 0.3% Asian, and 2.5% from other races. The median household income was $41,944, and the median family income was $50,944. The per capita income was $19,944.
Education
Crandall is served by the Crandall Independent School District. The district has three elementary schools, one middle school, and one high school. The district also has a vocational-technical school, which offers courses in automotive technology, welding, and other trades.
Conclusion
Crandall, Texas is a small town located in Kaufman County, Texas, about 30 miles east of Dallas. The town was founded in 1872 and named after a local rancher, William Crandall. The population of Crandall was 2,945 in the 2010 census. The town’s economy is largely based on agriculture and light manufacturing, and the town is served by the Crandall Independent School District. The racial makeup of the town was 79.3% White, 15.2% Hispanic or Latino, 2.2% African American, 0.7% Native American, 0.3% Asian, and 2.5% from other races. The median household income was $41,944, and the median family income was $50,944. The per capita income was $19,944. Crandall is a small town with a rich history and a bright future.
Common Questions
What is Per Capita Income in Crandall?
Per Capita income in Crandall is $37,248.
What is the Median Family Income in Crandall?
Median Family Income in Crandall is $109,798.
What is the Median Household income in Crandall?
Median Household Income in Crandall is $101,829.
What is Income or Wage Gap in Crandall?
Income or Wage Gap in Crandall is 8.8%.
Women in Crandall earn 91.2 cents for every dollar earned by a man.
What is Inequality or Gini Index in Crandall?
Inequality or Gini Index in Crandall is 0.32.
What is the Total Population of Crandall?
Total Population of Crandall is 4,028.
What is the Total Male Population of Crandall?
Total Male Population of Crandall is 2,221.
What is the Total Female Population of Crandall?
Total Female Population of Crandall is 1,807.
What is the Ratio of Males per 100 Females in Crandall?
There are 122.91 Males per 100 Females in Crandall.
What is the Ratio of Females per 100 Males in Crandall?
There are 81.36 Females per 100 Males in Crandall.
What is the Median Population Age in Crandall?
Median Population Age in Crandall is 37.3 Years.
What is the Average Family Size in Crandall
Average Family Size in Crandall is 3.4 People.
What is the Average Household Size in Crandall
Average Household Size in Crandall is 3.0 People.
How Large is the Labor Force in Crandall?
There are 2,184 People in the Labor Forcein in Crandall.
What is the Percentage of People in the Labor Force in Crandall?
70.5% of People are in the Labor Force in Crandall.
What is the Unemployment Rate in Crandall?
Unemployment Rate in Crandall is 5.5%.