Bridge City, TX Map & Demographics
Bridge City Map
Bridge City Overview
$40,633
PER CAPITA INCOME
$103,462
AVG FAMILY INCOME
$95,688
AVG HOUSEHOLD INCOME
44.6%
WAGE / INCOME GAP [ % ]
55.4¢/ $1
WAGE / INCOME GAP [ $ ]
0.43
INEQUALITY / GINI INDEX
9,461
TOTAL POPULATION
4,839
MALE POPULATION
4,622
FEMALE POPULATION
104.69
MALES / 100 FEMALES
95.52
FEMALES / 100 MALES
36.7
MEDIAN AGE
3.3
AVG FAMILY SIZE
2.9
AVG HOUSEHOLD SIZE
4,779
LABOR FORCE [ PEOPLE ]
66.6%
PERCENT IN LABOR FORCE
1.8%
UNEMPLOYMENT RATE
Bridge City Zip Codes
Bridge City Area Codes
Income in Bridge City
Income Overview in Bridge City
Per Capita Income in Bridge City is $40,633, while median incomes of families and households are $103,462 and $95,688 respectively.
| Characteristic | Number | Measure |
| Per Capita Income | 9,461 | $40,633 |
| Median Family Income | 2,518 | $103,462 |
| Mean Family Income | 2,518 | $131,717 |
| Median Household Income | 3,259 | $95,688 |
| Mean Household Income | 3,259 | $116,880 |
| Income Deficit | 2,518 | $0 |
| Wage / Income Gap (%) | 9,461 | 44.61% |
| Wage / Income Gap ($) | 9,461 | 55.39¢ per $1 |
| Gini / Inequality Index | 9,461 | 0.43 |
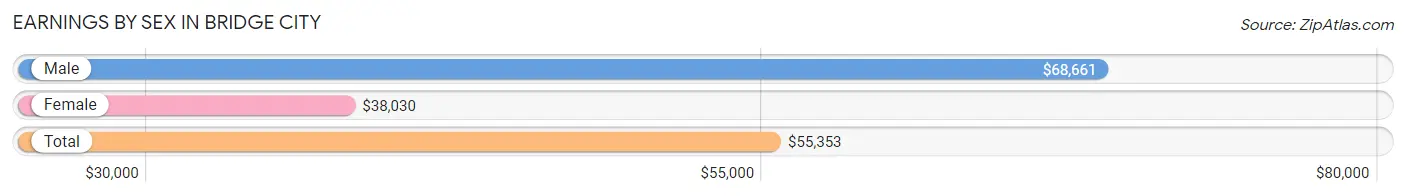
Earnings by Sex in Bridge City
Average Earnings in Bridge City are $55,353, $68,661 for men and $38,030 for women, a difference of 44.6%.
| Sex | Number | Average Earnings |
| Male | 2,880 (58.1%) | $68,661 |
| Female | 2,080 (41.9%) | $38,030 |
| Total | 4,960 (100.0%) | $55,353 |
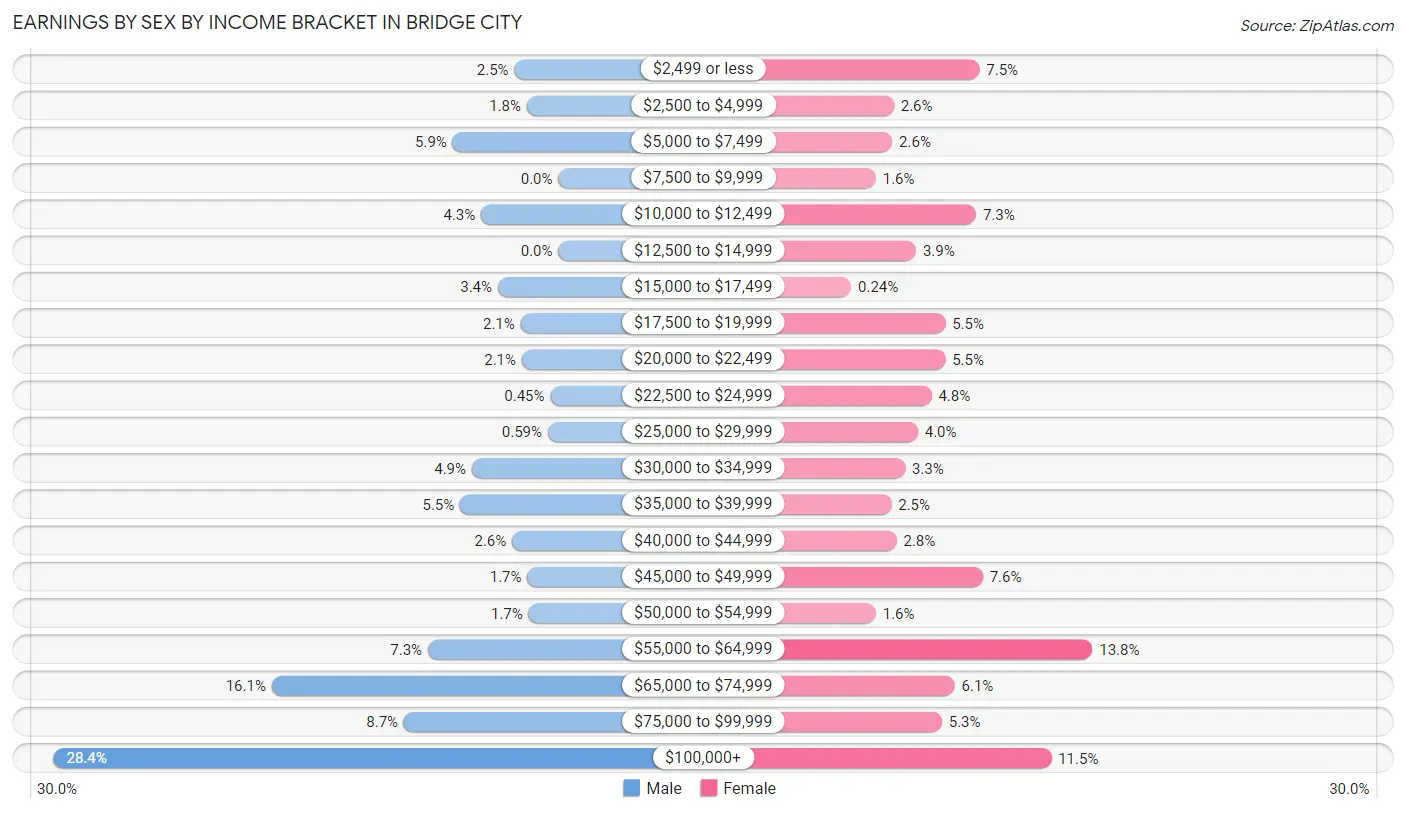
Earnings by Sex by Income Bracket in Bridge City
The most common earnings brackets in Bridge City are $100,000+ for men (817 | 28.4%) and $55,000 to $64,999 for women (287 | 13.8%).
| Income | Male | Female |
| $2,499 or less | 71 (2.5%) | 155 (7.4%) |
| $2,500 to $4,999 | 51 (1.8%) | 55 (2.6%) |
| $5,000 to $7,499 | 171 (5.9%) | 53 (2.5%) |
| $7,500 to $9,999 | 0 (0.0%) | 34 (1.6%) |
| $10,000 to $12,499 | 125 (4.3%) | 151 (7.3%) |
| $12,500 to $14,999 | 0 (0.0%) | 81 (3.9%) |
| $15,000 to $17,499 | 98 (3.4%) | 5 (0.2%) |
| $17,500 to $19,999 | 61 (2.1%) | 115 (5.5%) |
| $20,000 to $22,499 | 59 (2.1%) | 115 (5.5%) |
| $22,500 to $24,999 | 13 (0.4%) | 99 (4.8%) |
| $25,000 to $29,999 | 17 (0.6%) | 83 (4.0%) |
| $30,000 to $34,999 | 140 (4.9%) | 68 (3.3%) |
| $35,000 to $39,999 | 159 (5.5%) | 52 (2.5%) |
| $40,000 to $44,999 | 75 (2.6%) | 58 (2.8%) |
| $45,000 to $49,999 | 50 (1.7%) | 159 (7.6%) |
| $50,000 to $54,999 | 48 (1.7%) | 34 (1.6%) |
| $55,000 to $64,999 | 211 (7.3%) | 287 (13.8%) |
| $65,000 to $74,999 | 464 (16.1%) | 126 (6.1%) |
| $75,000 to $99,999 | 250 (8.7%) | 111 (5.3%) |
| $100,000+ | 817 (28.4%) | 239 (11.5%) |
| Total | 2,880 (100.0%) | 2,080 (100.0%) |
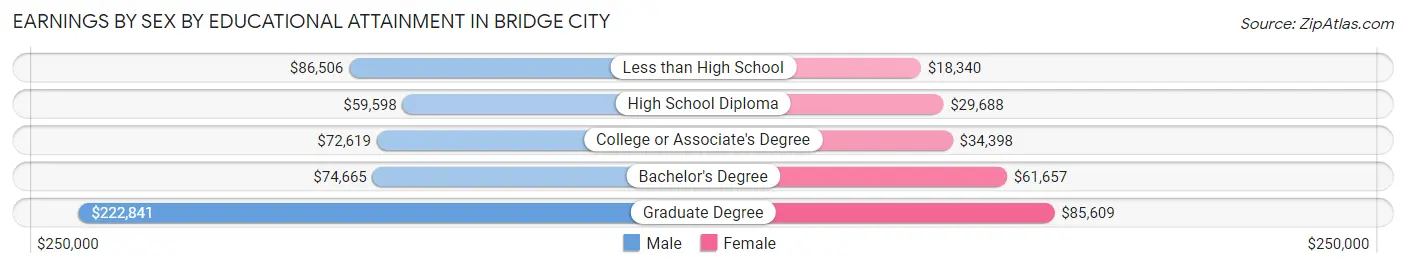
Earnings by Sex by Educational Attainment in Bridge City
Average earnings in Bridge City are $73,893 for men and $47,894 for women, a difference of 35.2%. Men with an educational attainment of graduate degree enjoy the highest average annual earnings of $222,841, while those with high school diploma education earn the least with $59,598. Women with an educational attainment of graduate degree earn the most with the average annual earnings of $85,609, while those with less than high school education have the smallest earnings of $18,340.
| Educational Attainment | Male Income | Female Income |
| Less than High School | $86,506 | $18,340 |
| High School Diploma | $59,598 | $29,688 |
| College or Associate's Degree | $72,619 | $34,398 |
| Bachelor's Degree | $74,665 | $61,657 |
| Graduate Degree | $222,841 | $85,609 |
| Total | $73,893 | $47,894 |
Family Income in Bridge City
Family Income Brackets in Bridge City
According to the Bridge City family income data, there are 675 families falling into the $100,000 to $149,999 income range, which is the most common income bracket and makes up 26.8% of all families.
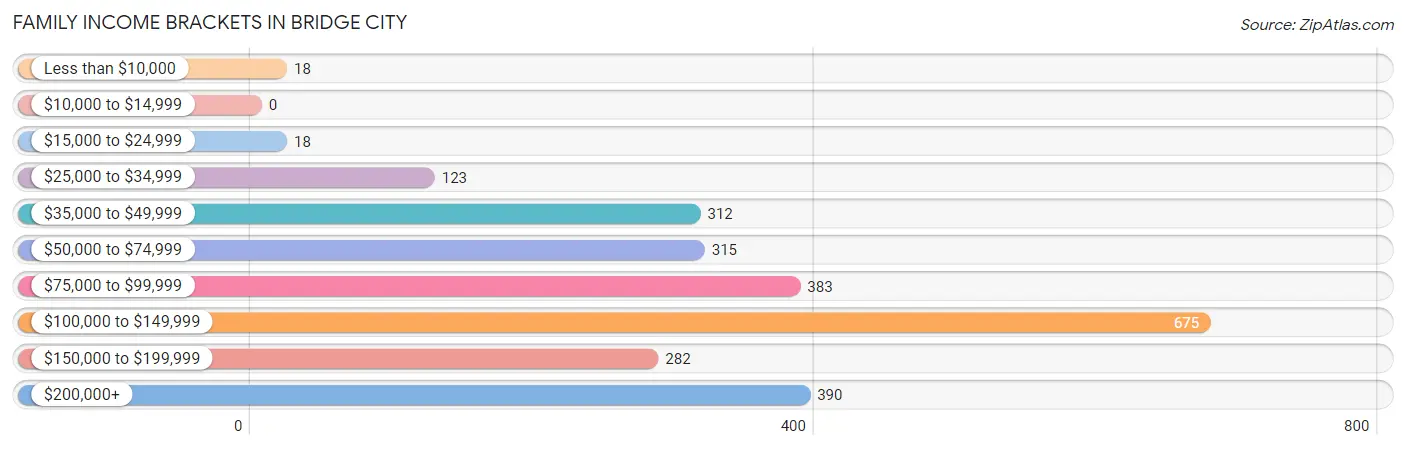
| Income Bracket | # Families | % Families |
| Less than $10,000 | 18 | 0.7% |
| $10,000 to $14,999 | 0 | 0.0% |
| $15,000 to $24,999 | 18 | 0.7% |
| $25,000 to $34,999 | 123 | 4.9% |
| $35,000 to $49,999 | 312 | 12.4% |
| $50,000 to $74,999 | 315 | 12.5% |
| $75,000 to $99,999 | 383 | 15.2% |
| $100,000 to $149,999 | 675 | 26.8% |
| $150,000 to $199,999 | 282 | 11.2% |
| $200,000+ | 390 | 15.5% |
Family Income by Famaliy Size in Bridge City
5-person families (279 | 11.1%) account for the highest median family income in Bridge City with $190,375 per family, while 3-person families (548 | 21.8%) have the highest median income of $45,972 per family member.
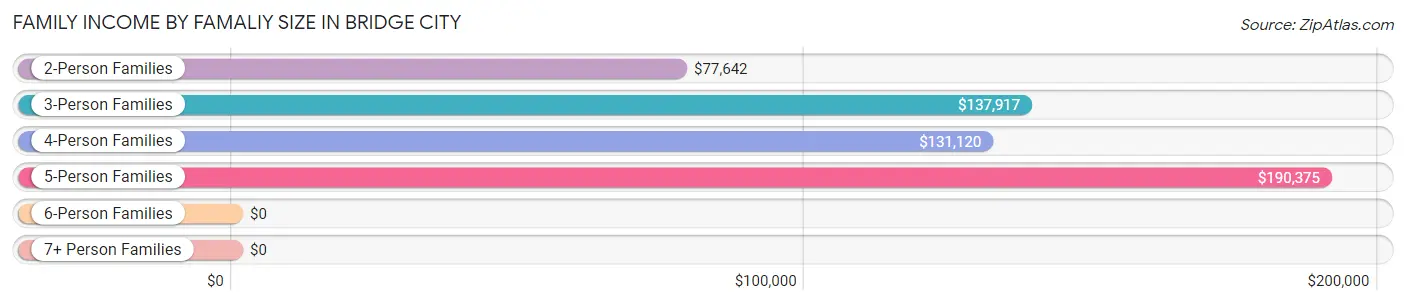
| Income Bracket | # Families | Median Income |
| 2-Person Families | 1,044 (41.5%) | $77,642 |
| 3-Person Families | 548 (21.8%) | $137,917 |
| 4-Person Families | 466 (18.5%) | $131,120 |
| 5-Person Families | 279 (11.1%) | $190,375 |
| 6-Person Families | 135 (5.4%) | $0 |
| 7+ Person Families | 46 (1.8%) | $0 |
| Total | 2,518 (100.0%) | $103,462 |
Family Income by Number of Earners in Bridge City
The median family income in Bridge City is $103,462, with families comprising 3+ earners (207) having the highest median family income of $191,984, while families with no earners (259) have the lowest median family income of $61,442, accounting for 8.2% and 10.3% of families, respectively.
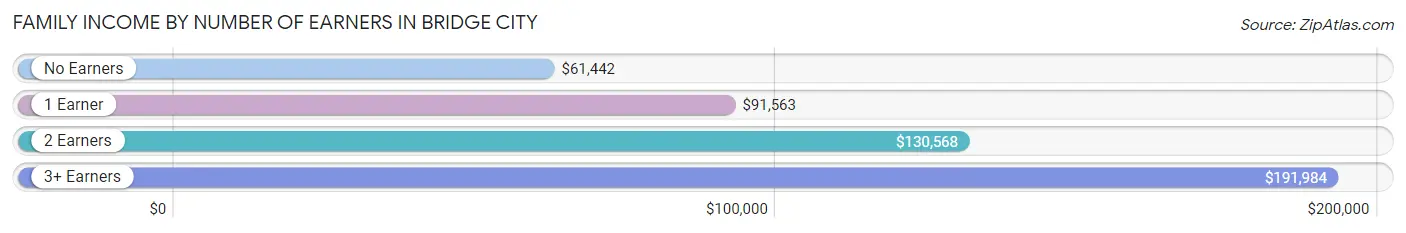
| Number of Earners | # Families | Median Income |
| No Earners | 259 (10.3%) | $61,442 |
| 1 Earner | 857 (34.0%) | $91,563 |
| 2 Earners | 1,195 (47.5%) | $130,568 |
| 3+ Earners | 207 (8.2%) | $191,984 |
| Total | 2,518 (100.0%) | $103,462 |
Household Income in Bridge City
Household Income Brackets in Bridge City
With 854 households falling in the category, the $100,000 to $149,999 income range is the most frequent in Bridge City, accounting for 26.2% of all households.
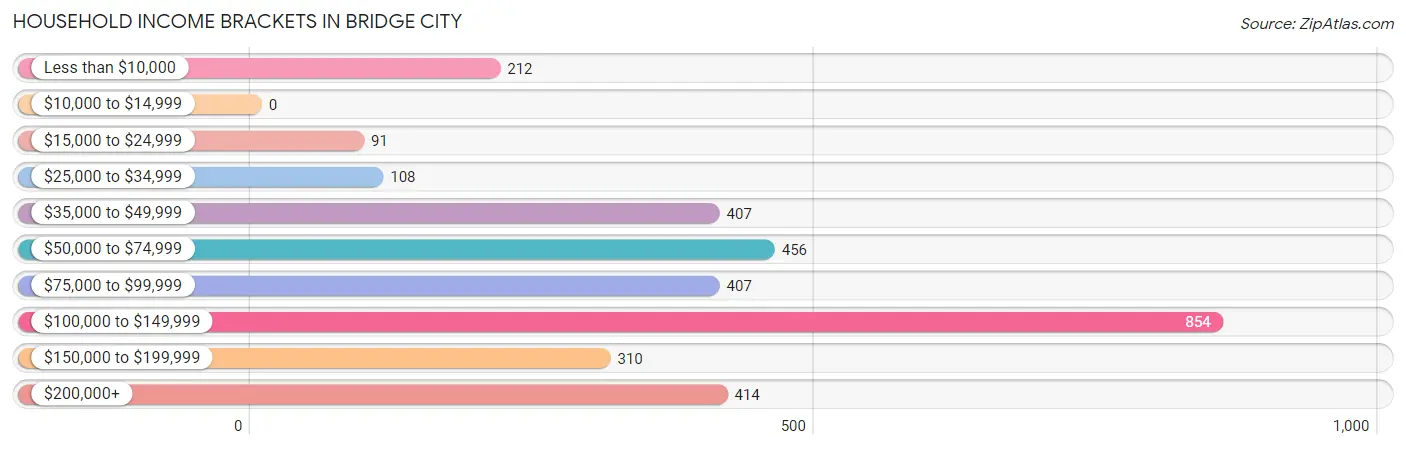
| Income Bracket | # Households | % Households |
| Less than $10,000 | 212 | 6.5% |
| $10,000 to $14,999 | 0 | 0.0% |
| $15,000 to $24,999 | 91 | 2.8% |
| $25,000 to $34,999 | 108 | 3.3% |
| $35,000 to $49,999 | 407 | 12.5% |
| $50,000 to $74,999 | 456 | 14.0% |
| $75,000 to $99,999 | 407 | 12.5% |
| $100,000 to $149,999 | 854 | 26.2% |
| $150,000 to $199,999 | 310 | 9.5% |
| $200,000+ | 414 | 12.7% |
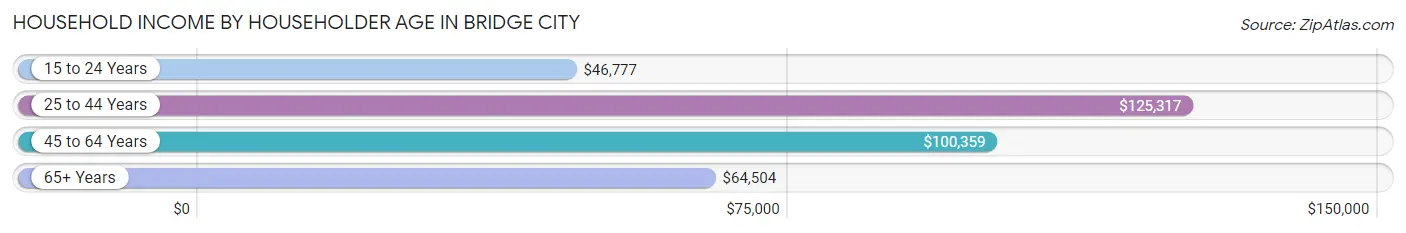
Household Income by Householder Age in Bridge City
The median household income in Bridge City is $95,688, with the highest median household income of $125,317 found in the 25 to 44 years age bracket for the primary householder. A total of 1,239 households (38.0%) fall into this category. Meanwhile, the 15 to 24 years age bracket for the primary householder has the lowest median household income of $46,777, with 133 households (4.1%) in this group.
| Income Bracket | # Households | Median Income |
| 15 to 24 Years | 133 (4.1%) | $46,777 |
| 25 to 44 Years | 1,239 (38.0%) | $125,317 |
| 45 to 64 Years | 1,199 (36.8%) | $100,359 |
| 65+ Years | 688 (21.1%) | $64,504 |
| Total | 3,259 (100.0%) | $95,688 |
Poverty in Bridge City
Income Below Poverty by Sex and Age in Bridge City
With 7.5% poverty level for males and 9.7% for females among the residents of Bridge City, 12 to 14 year old males and 16 and 17 year old females are the most vulnerable to poverty, with 71 males (23.9%) and 74 females (27.5%) in their respective age groups living below the poverty level.
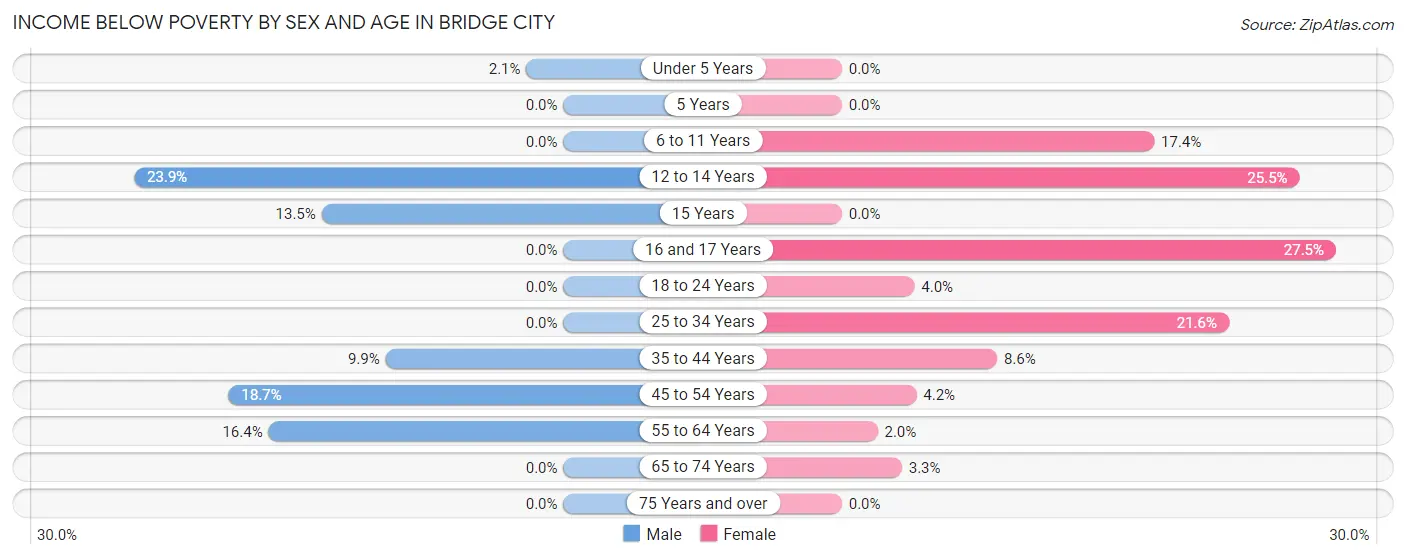
| Age Bracket | Male | Female |
| Under 5 Years | 8 (2.1%) | 0 (0.0%) |
| 5 Years | 0 (0.0%) | 0 (0.0%) |
| 6 to 11 Years | 0 (0.0%) | 68 (17.4%) |
| 12 to 14 Years | 71 (23.9%) | 67 (25.5%) |
| 15 Years | 7 (13.5%) | 0 (0.0%) |
| 16 and 17 Years | 0 (0.0%) | 74 (27.5%) |
| 18 to 24 Years | 0 (0.0%) | 15 (4.0%) |
| 25 to 34 Years | 0 (0.0%) | 128 (21.5%) |
| 35 to 44 Years | 79 (9.9%) | 54 (8.6%) |
| 45 to 54 Years | 108 (18.6%) | 23 (4.2%) |
| 55 to 64 Years | 89 (16.4%) | 11 (2.0%) |
| 65 to 74 Years | 0 (0.0%) | 10 (3.3%) |
| 75 Years and over | 0 (0.0%) | 0 (0.0%) |
| Total | 362 (7.5%) | 450 (9.7%) |
Income Above Poverty by Sex and Age in Bridge City
According to the poverty statistics in Bridge City, males aged 5 years and females aged under 5 years are the age groups that are most secure financially, with 100.0% of males and 100.0% of females in these age groups living above the poverty line.
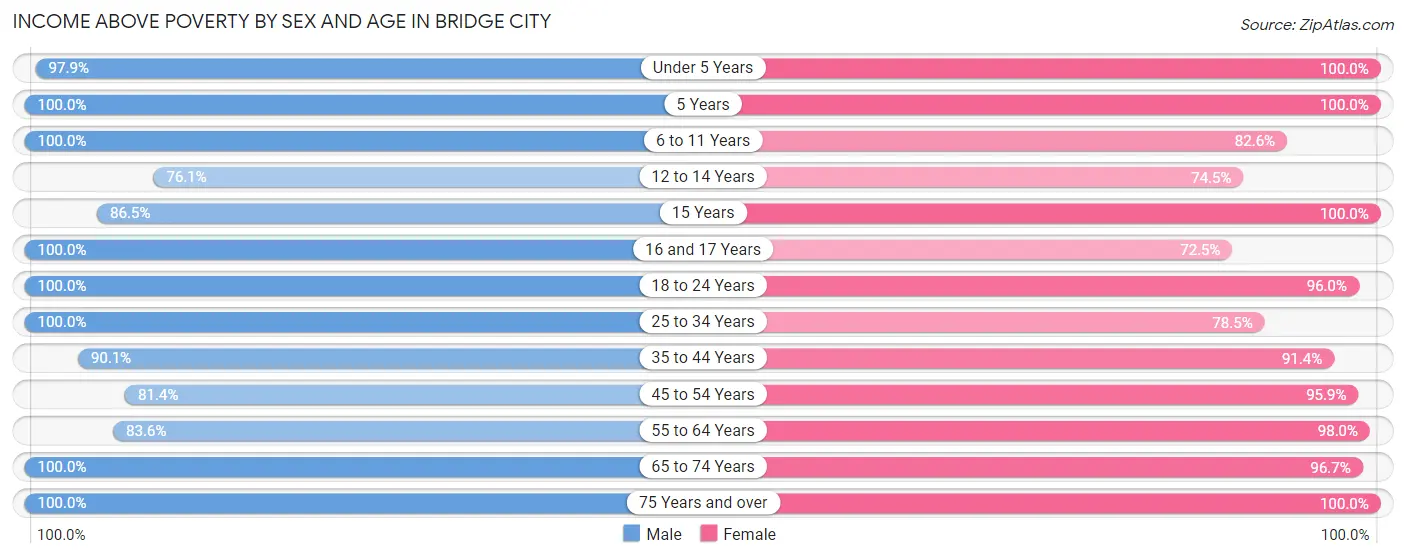
| Age Bracket | Male | Female |
| Under 5 Years | 381 (97.9%) | 142 (100.0%) |
| 5 Years | 20 (100.0%) | 259 (100.0%) |
| 6 to 11 Years | 432 (100.0%) | 323 (82.6%) |
| 12 to 14 Years | 226 (76.1%) | 196 (74.5%) |
| 15 Years | 45 (86.5%) | 40 (100.0%) |
| 16 and 17 Years | 152 (100.0%) | 195 (72.5%) |
| 18 to 24 Years | 445 (100.0%) | 356 (96.0%) |
| 25 to 34 Years | 502 (100.0%) | 466 (78.4%) |
| 35 to 44 Years | 719 (90.1%) | 571 (91.4%) |
| 45 to 54 Years | 471 (81.4%) | 531 (95.9%) |
| 55 to 64 Years | 453 (83.6%) | 541 (98.0%) |
| 65 to 74 Years | 409 (100.0%) | 289 (96.7%) |
| 75 Years and over | 222 (100.0%) | 263 (100.0%) |
| Total | 4,477 (92.5%) | 4,172 (90.3%) |
Income Below Poverty Among Married-Couple Families in Bridge City
The poverty statistics for married-couple families in Bridge City show that 4.0% or 91 of the total 2,299 families live below the poverty line. Families with 3 or 4 children have the highest poverty rate of 14.0%, comprising of 61 families. On the other hand, families with 1 or 2 children have the lowest poverty rate of 0.0%, which includes 0 families.
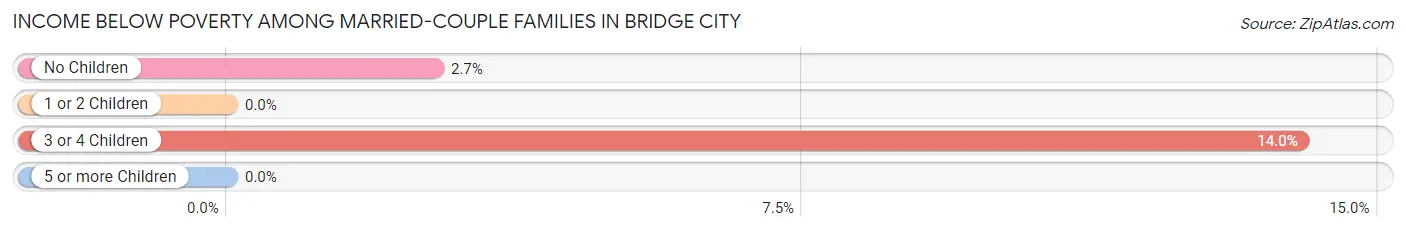
| Children | Above Poverty | Below Poverty |
| No Children | 1,087 (97.3%) | 30 (2.7%) |
| 1 or 2 Children | 746 (100.0%) | 0 (0.0%) |
| 3 or 4 Children | 375 (86.0%) | 61 (14.0%) |
| 5 or more Children | 0 (0.0%) | 0 (0.0%) |
| Total | 2,208 (96.0%) | 91 (4.0%) |
Income Below Poverty Among Single-Parent Households in Bridge City
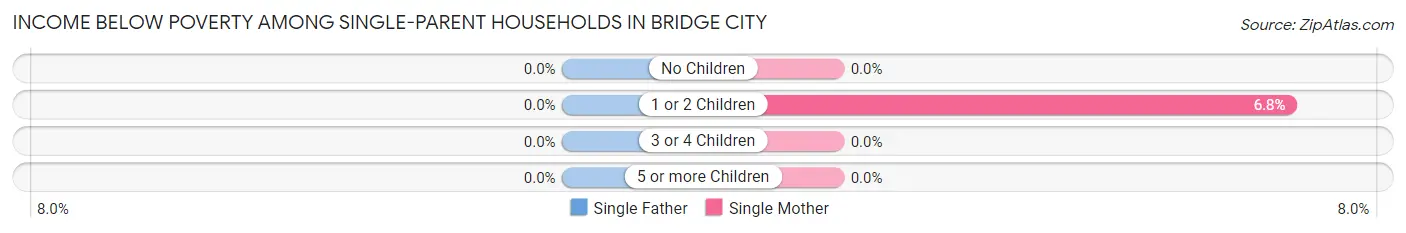
| Children | Single Father | Single Mother |
| No Children | 0 (0.0%) | 0 (0.0%) |
| 1 or 2 Children | 0 (0.0%) | 5 (6.8%) |
| 3 or 4 Children | 0 (0.0%) | 0 (0.0%) |
| 5 or more Children | 0 (0.0%) | 0 (0.0%) |
| Total | 0 (0.0%) | 5 (3.0%) |
Income Below Poverty Among Married-Couple vs Single-Parent Households in Bridge City
The poverty data for Bridge City shows that 91 of the married-couple family households (4.0%) and 5 of the single-parent households (2.3%) are living below the poverty level. Within the married-couple family households, those with 3 or 4 children have the highest poverty rate, with 61 households (14.0%) falling below the poverty line. Among the single-parent households, those with 1 or 2 children have the highest poverty rate, with 5 household (5.5%) living below poverty.
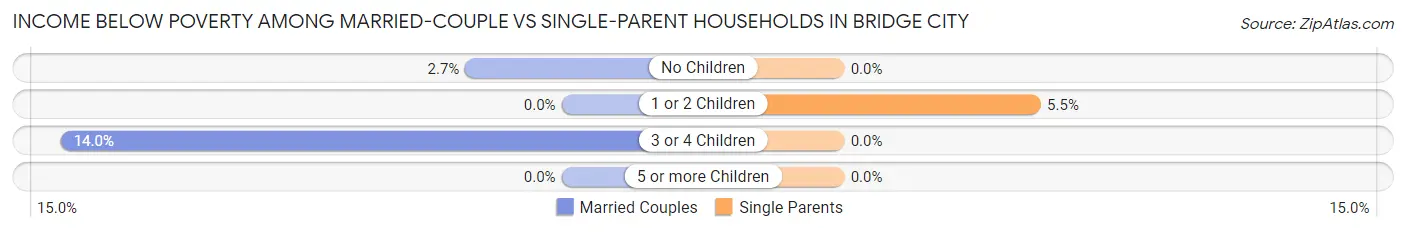
| Children | Married-Couple Families | Single-Parent Households |
| No Children | 30 (2.7%) | 0 (0.0%) |
| 1 or 2 Children | 0 (0.0%) | 5 (5.5%) |
| 3 or 4 Children | 61 (14.0%) | 0 (0.0%) |
| 5 or more Children | 0 (0.0%) | 0 (0.0%) |
| Total | 91 (4.0%) | 5 (2.3%) |
Race in Bridge City
The most populous races in Bridge City are White / Caucasian (8,247 | 87.2%), Hispanic or Latino (1,229 | 13.0%), and Two or more Races (891 | 9.4%).
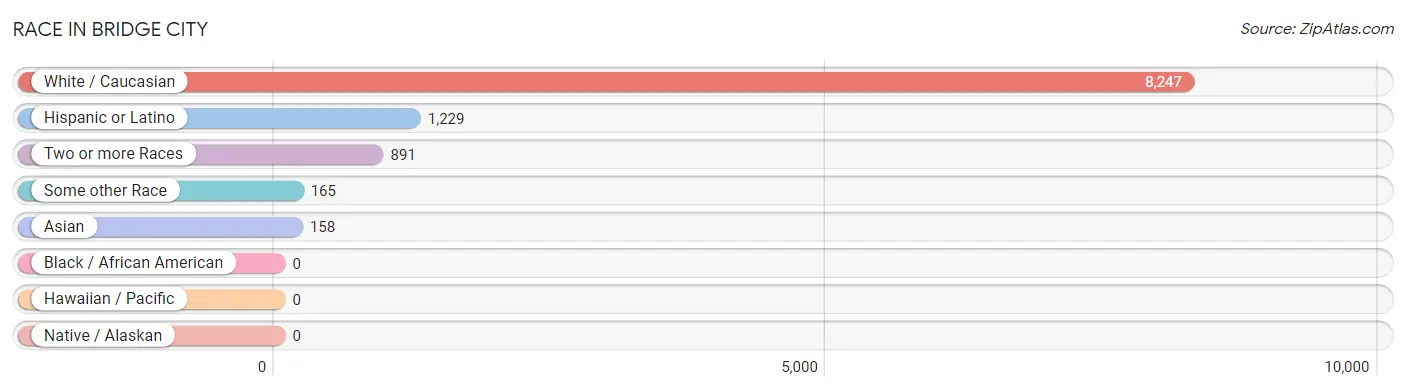
| Race | # Population | % Population |
| Asian | 158 | 1.7% |
| Black / African American | 0 | 0.0% |
| Hawaiian / Pacific | 0 | 0.0% |
| Hispanic or Latino | 1,229 | 13.0% |
| Native / Alaskan | 0 | 0.0% |
| White / Caucasian | 8,247 | 87.2% |
| Two or more Races | 891 | 9.4% |
| Some other Race | 165 | 1.7% |
| Total | 9,461 | 100.0% |
Ancestry in Bridge City
The most populous ancestries reported in Bridge City are French (1,225 | 13.0%), German (1,112 | 11.7%), Mexican (1,065 | 11.3%), Irish (716 | 7.6%), and English (641 | 6.8%), together accounting for 50.3% of all Bridge City residents.
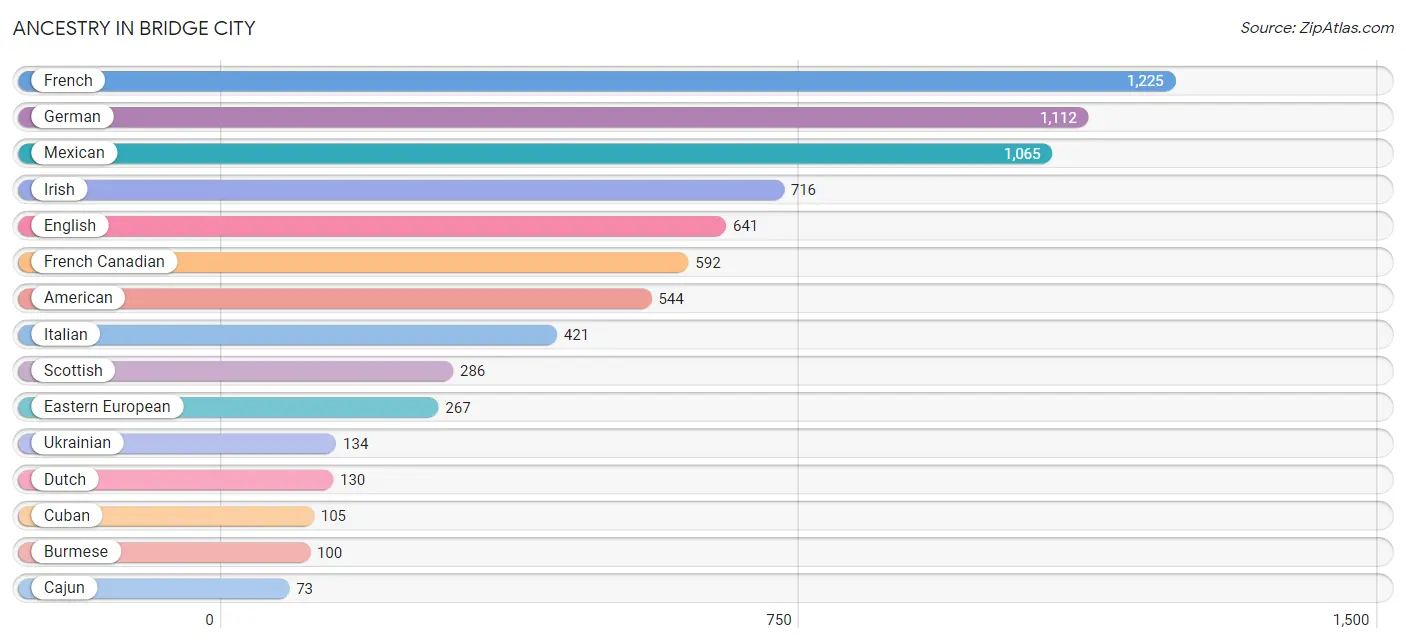
| Ancestry | # Population | % Population |
| American | 544 | 5.8% |
| Arab | 20 | 0.2% |
| Burmese | 100 | 1.1% |
| Cajun | 73 | 0.8% |
| Cherokee | 9 | 0.1% |
| Cuban | 105 | 1.1% |
| Czech | 55 | 0.6% |
| Dominican | 32 | 0.3% |
| Dutch | 130 | 1.4% |
| Eastern European | 267 | 2.8% |
| English | 641 | 6.8% |
| European | 35 | 0.4% |
| Filipino | 25 | 0.3% |
| French | 1,225 | 13.0% |
| French Canadian | 592 | 6.3% |
| German | 1,112 | 11.7% |
| Irish | 716 | 7.6% |
| Italian | 421 | 4.4% |
| Mexican | 1,065 | 11.3% |
| Osage | 18 | 0.2% |
| Puerto Rican | 16 | 0.2% |
| Scotch-Irish | 43 | 0.4% |
| Scottish | 286 | 3.0% |
| Spanish | 11 | 0.1% |
| Sri Lankan | 33 | 0.4% |
| Ukrainian | 134 | 1.4% | View All 26 Rows |
Immigrants in Bridge City
The most numerous immigrant groups reported in Bridge City came from Latin America (177 | 1.9%), Caribbean (137 | 1.5%), Cuba (105 | 1.1%), Asia (91 | 1.0%), and Saudi Arabia (79 | 0.8%), together accounting for 6.2% of all Bridge City residents.
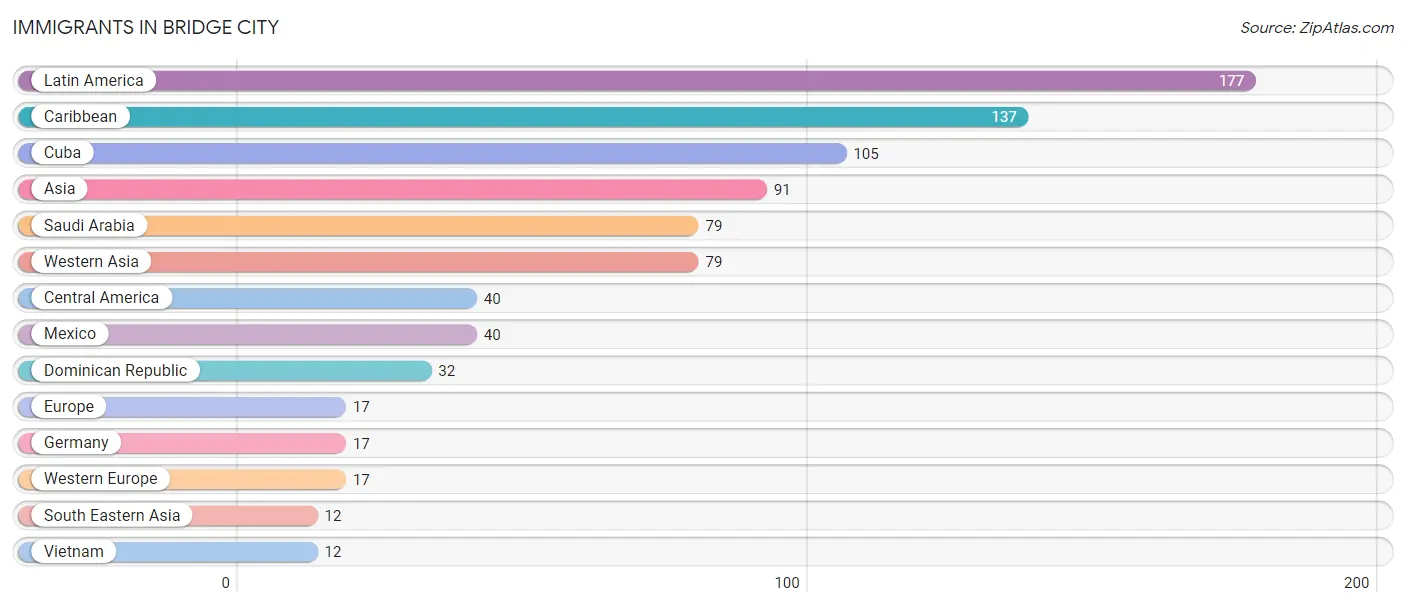
| Immigration Origin | # Population | % Population |
| Asia | 91 | 1.0% |
| Caribbean | 137 | 1.5% |
| Central America | 40 | 0.4% |
| Cuba | 105 | 1.1% |
| Dominican Republic | 32 | 0.3% |
| Europe | 17 | 0.2% |
| Germany | 17 | 0.2% |
| Latin America | 177 | 1.9% |
| Mexico | 40 | 0.4% |
| Saudi Arabia | 79 | 0.8% |
| South Eastern Asia | 12 | 0.1% |
| Vietnam | 12 | 0.1% |
| Western Asia | 79 | 0.8% |
| Western Europe | 17 | 0.2% | View All 14 Rows |
Sex and Age in Bridge City
Sex and Age in Bridge City
The most populous age groups in Bridge City are 35 to 39 Years (484 | 10.0%) for men and 5 to 9 Years (650 | 14.1%) for women.
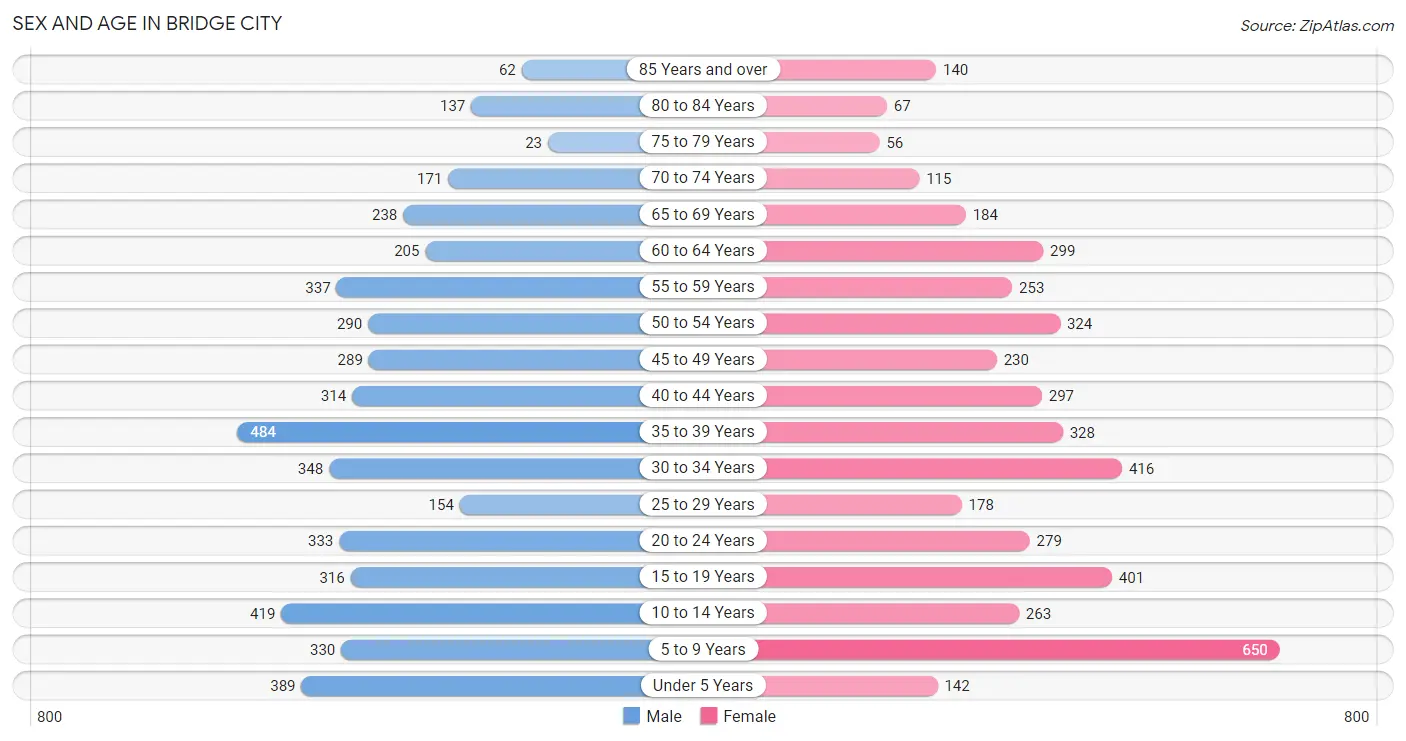
| Age Bracket | Male | Female |
| Under 5 Years | 389 (8.0%) | 142 (3.1%) |
| 5 to 9 Years | 330 (6.8%) | 650 (14.1%) |
| 10 to 14 Years | 419 (8.7%) | 263 (5.7%) |
| 15 to 19 Years | 316 (6.5%) | 401 (8.7%) |
| 20 to 24 Years | 333 (6.9%) | 279 (6.0%) |
| 25 to 29 Years | 154 (3.2%) | 178 (3.8%) |
| 30 to 34 Years | 348 (7.2%) | 416 (9.0%) |
| 35 to 39 Years | 484 (10.0%) | 328 (7.1%) |
| 40 to 44 Years | 314 (6.5%) | 297 (6.4%) |
| 45 to 49 Years | 289 (6.0%) | 230 (5.0%) |
| 50 to 54 Years | 290 (6.0%) | 324 (7.0%) |
| 55 to 59 Years | 337 (7.0%) | 253 (5.5%) |
| 60 to 64 Years | 205 (4.2%) | 299 (6.5%) |
| 65 to 69 Years | 238 (4.9%) | 184 (4.0%) |
| 70 to 74 Years | 171 (3.5%) | 115 (2.5%) |
| 75 to 79 Years | 23 (0.5%) | 56 (1.2%) |
| 80 to 84 Years | 137 (2.8%) | 67 (1.5%) |
| 85 Years and over | 62 (1.3%) | 140 (3.0%) |
| Total | 4,839 (100.0%) | 4,622 (100.0%) |
Families and Households in Bridge City
Median Family Size in Bridge City
The median family size in Bridge City is 3.33 persons per family, with married-couple families (2,299 | 91.3%) accounting for the largest median family size of 3.42 persons per family. On the other hand, single female/mother families (169 | 6.7%) represent the smallest median family size with 2.30 persons per family.
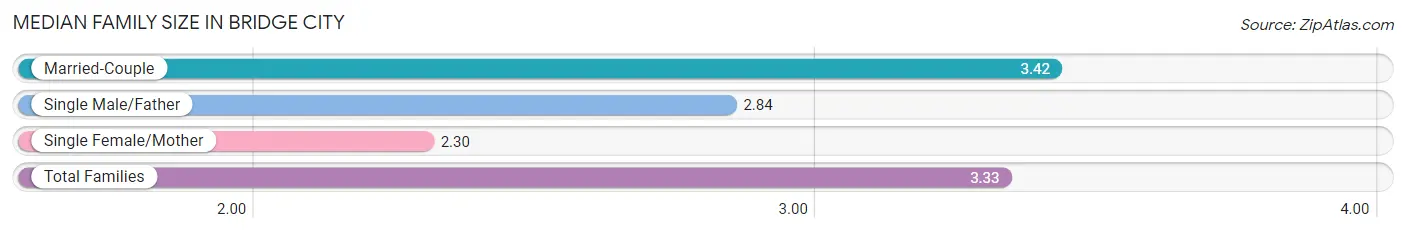
| Family Type | # Families | Family Size |
| Married-Couple | 2,299 (91.3%) | 3.42 |
| Single Male/Father | 50 (2.0%) | 2.84 |
| Single Female/Mother | 169 (6.7%) | 2.30 |
| Total Families | 2,518 (100.0%) | 3.33 |
Median Household Size in Bridge City
The median household size in Bridge City is 2.90 persons per household, with single male/father households (50 | 1.5%) accounting for the largest median household size of 3.64 persons per household. non-family households (741 | 22.7%) represent the smallest median household size with 1.20 persons per household.
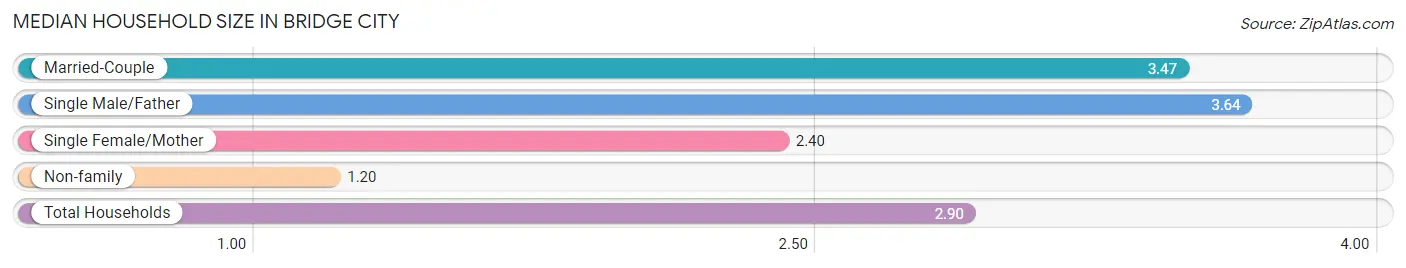
| Household Type | # Households | Household Size |
| Married-Couple | 2,299 (70.5%) | 3.47 |
| Single Male/Father | 50 (1.5%) | 3.64 |
| Single Female/Mother | 169 (5.2%) | 2.40 |
| Non-family | 741 (22.7%) | 1.20 |
| Total Households | 3,259 (100.0%) | 2.90 |
Household Size by Marriage Status in Bridge City
Out of a total of 3,259 households in Bridge City, 2,518 (77.3%) are family households, while 741 (22.7%) are nonfamily households. The most numerous type of family households are 2-person households, comprising 995, and the most common type of nonfamily households are 1-person households, comprising 605.
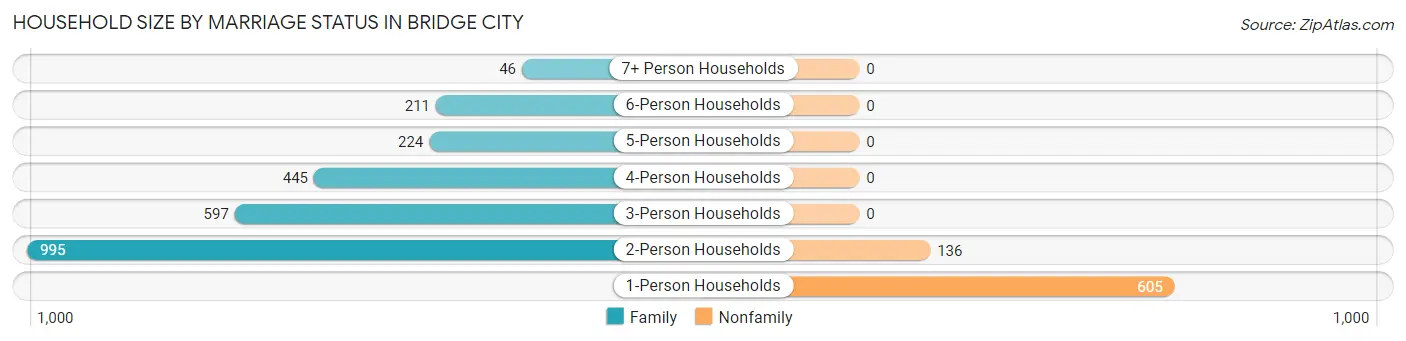
| Household Size | Family Households | Nonfamily Households |
| 1-Person Households | - | 605 (18.6%) |
| 2-Person Households | 995 (30.5%) | 136 (4.2%) |
| 3-Person Households | 597 (18.3%) | 0 (0.0%) |
| 4-Person Households | 445 (13.7%) | 0 (0.0%) |
| 5-Person Households | 224 (6.9%) | 0 (0.0%) |
| 6-Person Households | 211 (6.5%) | 0 (0.0%) |
| 7+ Person Households | 46 (1.4%) | 0 (0.0%) |
| Total | 2,518 (77.3%) | 741 (22.7%) |
Female Fertility in Bridge City
Fertility by Age in Bridge City
Average fertility rate in Bridge City is 77.0 births per 1,000 women. Women in the age bracket of 20 to 34 years have the highest fertility rate with 196.0 births per 1,000 women. Women in the age bracket of 20 to 34 years acount for 100.0% of all women with births.
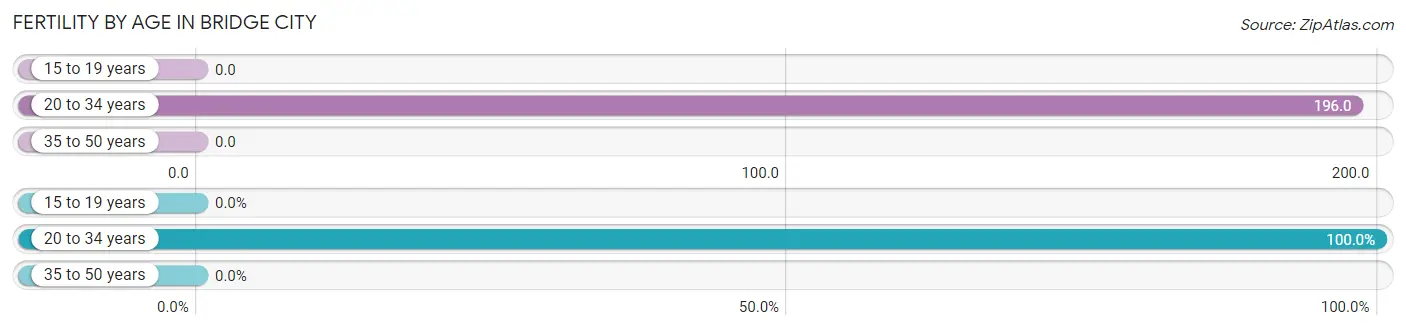
| Age Bracket | Women with Births | Births / 1,000 Women |
| 15 to 19 years | 0 (0.0%) | 0.0 |
| 20 to 34 years | 171 (100.0%) | 196.0 |
| 35 to 50 years | 0 (0.0%) | 0.0 |
| Total | 171 (100.0%) | 77.0 |
Fertility by Age by Marriage Status in Bridge City
86.0% of women with births (171) in Bridge City are married. The highest percentage of unmarried women with births falls into 20 to 34 years age bracket with 14.0% of them unmarried at the time of birth, while the lowest percentage of unmarried women with births belong to 20 to 34 years age bracket with 14.0% of them unmarried.
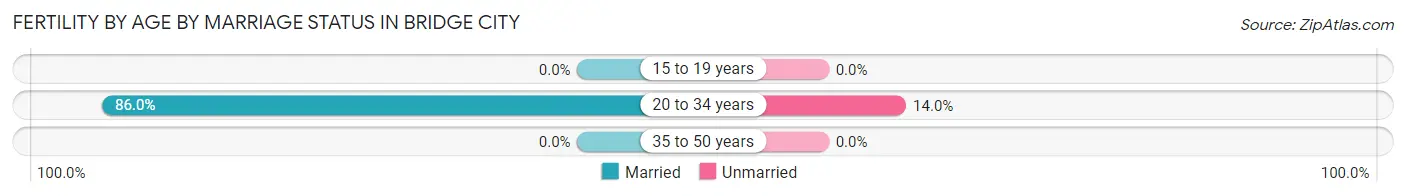
| Age Bracket | Married | Unmarried |
| 15 to 19 years | 0 (0.0%) | 0 (0.0%) |
| 20 to 34 years | 147 (86.0%) | 24 (14.0%) |
| 35 to 50 years | 0 (0.0%) | 0 (0.0%) |
| Total | 147 (86.0%) | 24 (14.0%) |
Fertility by Education in Bridge City
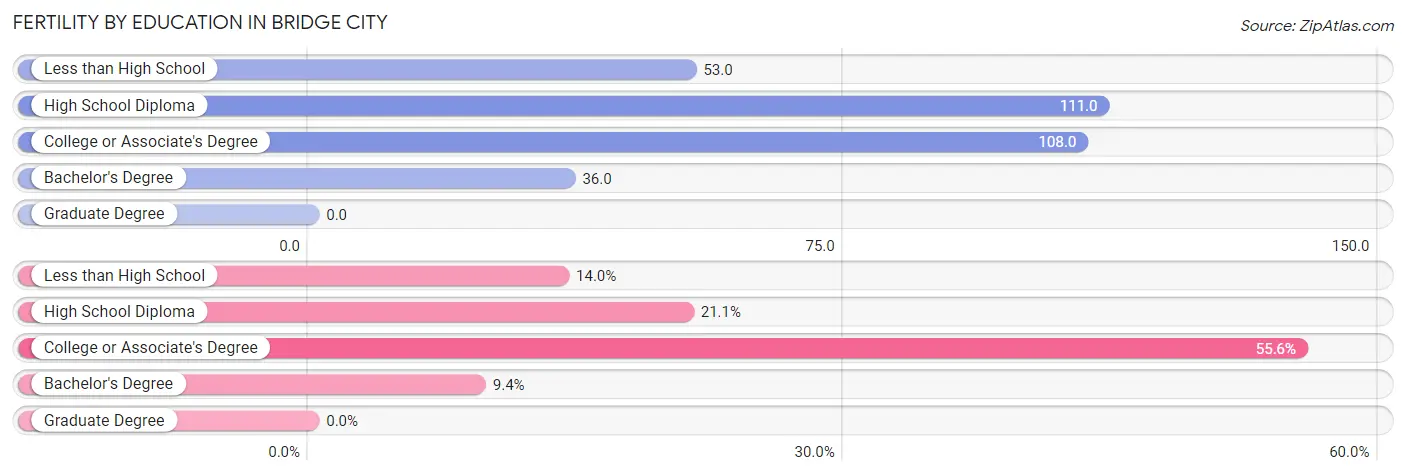
| Educational Attainment | Women with Births | Births / 1,000 Women |
| Less than High School | 24 (14.0%) | 53.0 |
| High School Diploma | 36 (21.0%) | 111.0 |
| College or Associate's Degree | 95 (55.6%) | 108.0 |
| Bachelor's Degree | 16 (9.4%) | 36.0 |
| Graduate Degree | 0 (0.0%) | 0.0 |
| Total | 171 (100.0%) | 77.0 |
Fertility by Education by Marriage Status in Bridge City
14.0% of women with births in Bridge City are unmarried. Women with the educational attainment of high school diploma are most likely to be married with 100.0% of them married at childbirth, while women with the educational attainment of less than high school are least likely to be married with 100.0% of them unmarried at childbirth.
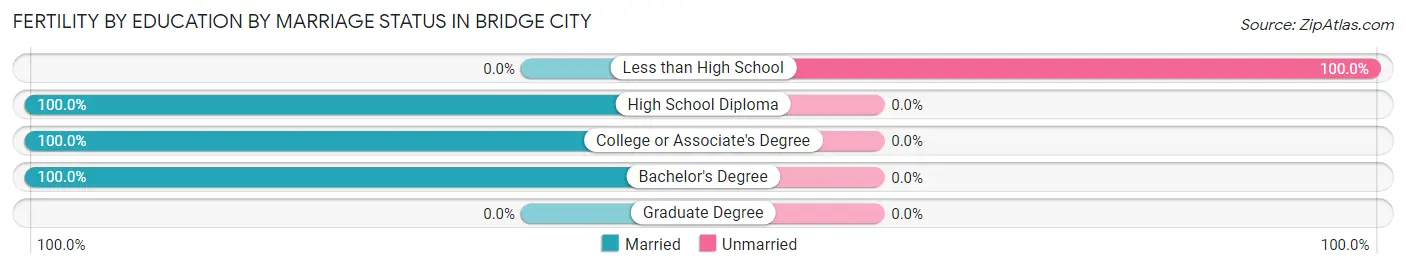
| Educational Attainment | Married | Unmarried |
| Less than High School | 0 (0.0%) | 24 (100.0%) |
| High School Diploma | 36 (100.0%) | 0 (0.0%) |
| College or Associate's Degree | 95 (100.0%) | 0 (0.0%) |
| Bachelor's Degree | 16 (100.0%) | 0 (0.0%) |
| Graduate Degree | 0 (0.0%) | 0 (0.0%) |
| Total | 147 (86.0%) | 24 (14.0%) |
Employment Characteristics in Bridge City
Employment by Class of Employer in Bridge City
Among the 4,552 employed individuals in Bridge City, private company employees (3,403 | 74.8%), local government employees (647 | 14.2%), and not-for-profit organizations (129 | 2.8%) make up the most common classes of employment.
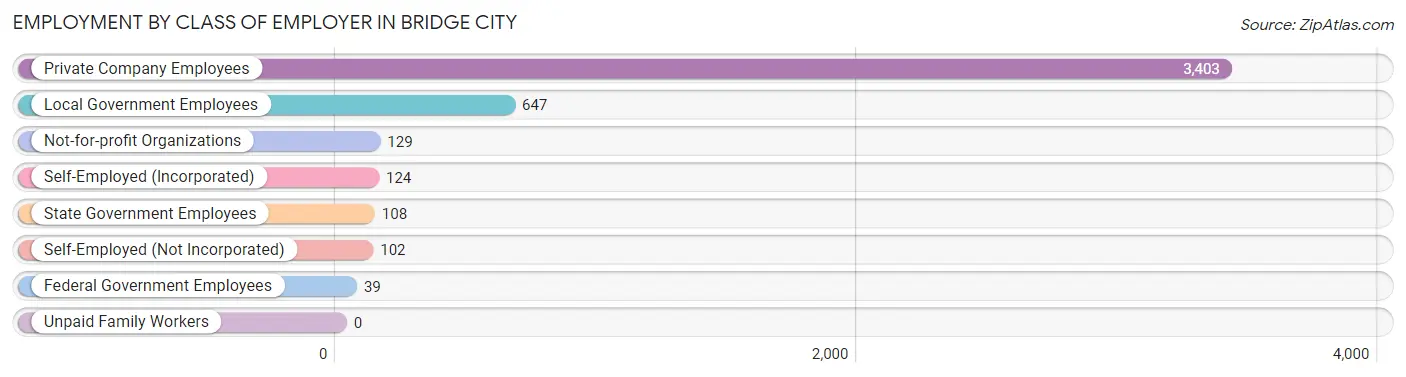
| Employer Class | # Employees | % Employees |
| Private Company Employees | 3,403 | 74.8% |
| Self-Employed (Incorporated) | 124 | 2.7% |
| Self-Employed (Not Incorporated) | 102 | 2.2% |
| Not-for-profit Organizations | 129 | 2.8% |
| Local Government Employees | 647 | 14.2% |
| State Government Employees | 108 | 2.4% |
| Federal Government Employees | 39 | 0.9% |
| Unpaid Family Workers | 0 | 0.0% |
| Total | 4,552 | 100.0% |
Employment Status by Age in Bridge City
According to the labor force statistics for Bridge City, out of the total population over 16 years of age (7,176), 66.6% or 4,779 individuals are in the labor force, with 1.8% or 86 of them unemployed. The age group with the highest labor force participation rate is 20 to 24 years, with 96.4% or 590 individuals in the labor force. Within the labor force, the 65 to 74 years age range has the highest percentage of unemployed individuals, with 7.8% or 19 of them being unemployed.
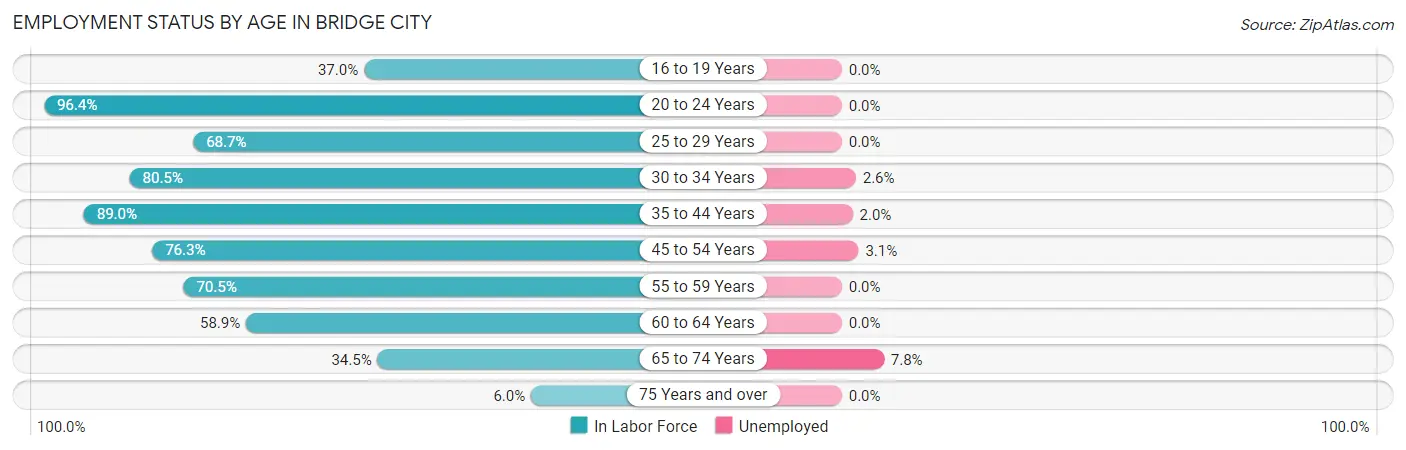
| Age Bracket | In Labor Force | Unemployed |
| 16 to 19 Years | 231 (37.0%) | 0 (0.0%) |
| 20 to 24 Years | 590 (96.4%) | 0 (0.0%) |
| 25 to 29 Years | 228 (68.7%) | 0 (0.0%) |
| 30 to 34 Years | 615 (80.5%) | 16 (2.6%) |
| 35 to 44 Years | 1,266 (89.0%) | 25 (2.0%) |
| 45 to 54 Years | 864 (76.3%) | 27 (3.1%) |
| 55 to 59 Years | 416 (70.5%) | 0 (0.0%) |
| 60 to 64 Years | 297 (58.9%) | 0 (0.0%) |
| 65 to 74 Years | 244 (34.5%) | 19 (7.8%) |
| 75 Years and over | 29 (6.0%) | 0 (0.0%) |
| Total | 4,779 (66.6%) | 86 (1.8%) |
Employment Status by Educational Attainment in Bridge City
According to labor force statistics for Bridge City, 77.7% of individuals (3,688) out of the total population between 25 and 64 years of age (4,746) are in the labor force, with 1.8% or 66 of them being unemployed. The group with the highest labor force participation rate are those with the educational attainment of bachelor's degree or higher, with 91.7% or 1,196 individuals in the labor force. Within the labor force, individuals with less than high school education have the highest percentage of unemployment, with 5.7% or 16 of them being unemployed.
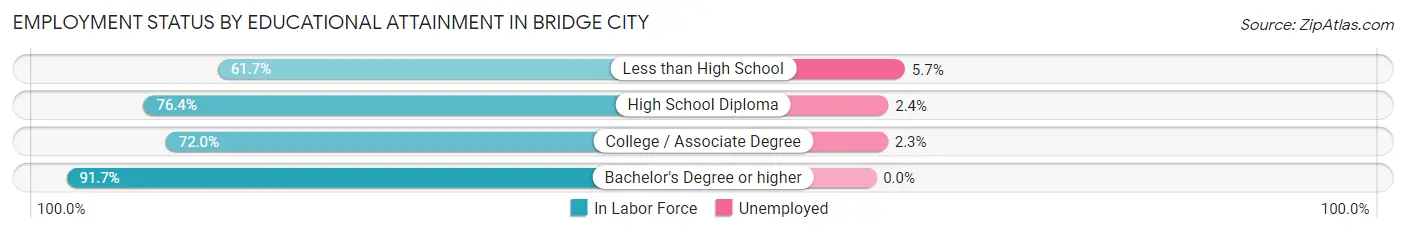
| Educational Attainment | In Labor Force | Unemployed |
| Less than High School | 282 (61.7%) | 26 (5.7%) |
| High School Diploma | 1,031 (76.4%) | 32 (2.4%) |
| College / Associate Degree | 1,178 (72.0%) | 38 (2.3%) |
| Bachelor's Degree or higher | 1,196 (91.7%) | 0 (0.0%) |
| Total | 3,688 (77.7%) | 85 (1.8%) |
Employment Occupations by Sex in Bridge City
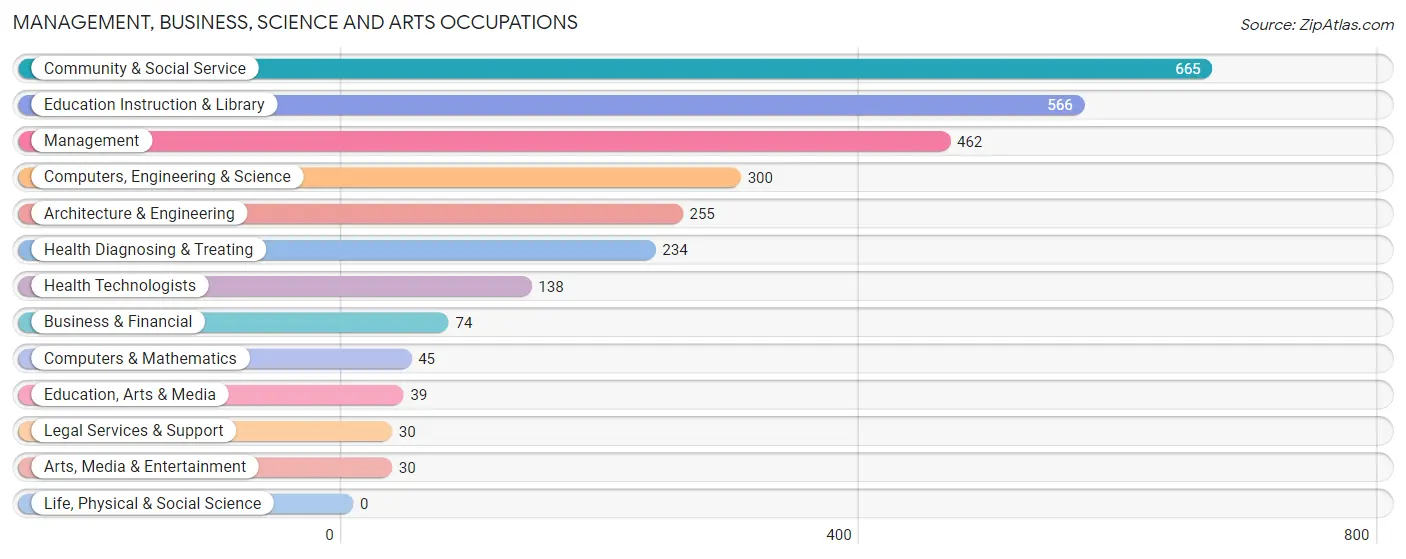
Management, Business, Science and Arts Occupations
The most common Management, Business, Science and Arts occupations in Bridge City are Community & Social Service (665 | 14.2%), Education Instruction & Library (566 | 12.1%), Management (462 | 9.8%), Computers, Engineering & Science (300 | 6.4%), and Architecture & Engineering (255 | 5.4%).
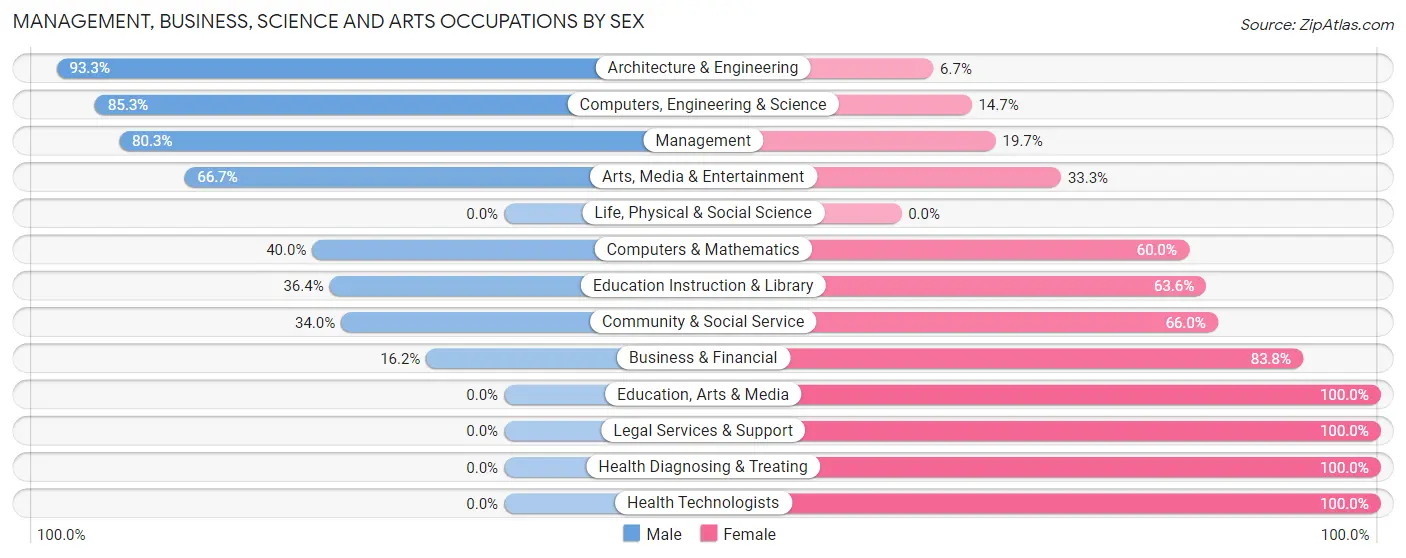
Management, Business, Science and Arts Occupations by Sex
Within the Management, Business, Science and Arts occupations in Bridge City, the most male-oriented occupations are Architecture & Engineering (93.3%), Computers, Engineering & Science (85.3%), and Management (80.3%), while the most female-oriented occupations are Education, Arts & Media (100.0%), Legal Services & Support (100.0%), and Health Diagnosing & Treating (100.0%).
| Occupation | Male | Female |
| Management | 371 (80.3%) | 91 (19.7%) |
| Business & Financial | 12 (16.2%) | 62 (83.8%) |
| Computers, Engineering & Science | 256 (85.3%) | 44 (14.7%) |
| Computers & Mathematics | 18 (40.0%) | 27 (60.0%) |
| Architecture & Engineering | 238 (93.3%) | 17 (6.7%) |
| Life, Physical & Social Science | 0 (0.0%) | 0 (0.0%) |
| Community & Social Service | 226 (34.0%) | 439 (66.0%) |
| Education, Arts & Media | 0 (0.0%) | 39 (100.0%) |
| Legal Services & Support | 0 (0.0%) | 30 (100.0%) |
| Education Instruction & Library | 206 (36.4%) | 360 (63.6%) |
| Arts, Media & Entertainment | 20 (66.7%) | 10 (33.3%) |
| Health Diagnosing & Treating | 0 (0.0%) | 234 (100.0%) |
| Health Technologists | 0 (0.0%) | 138 (100.0%) |
| Total (Category) | 865 (49.9%) | 870 (50.1%) |
| Total (Overall) | 2,708 (57.7%) | 1,985 (42.3%) |
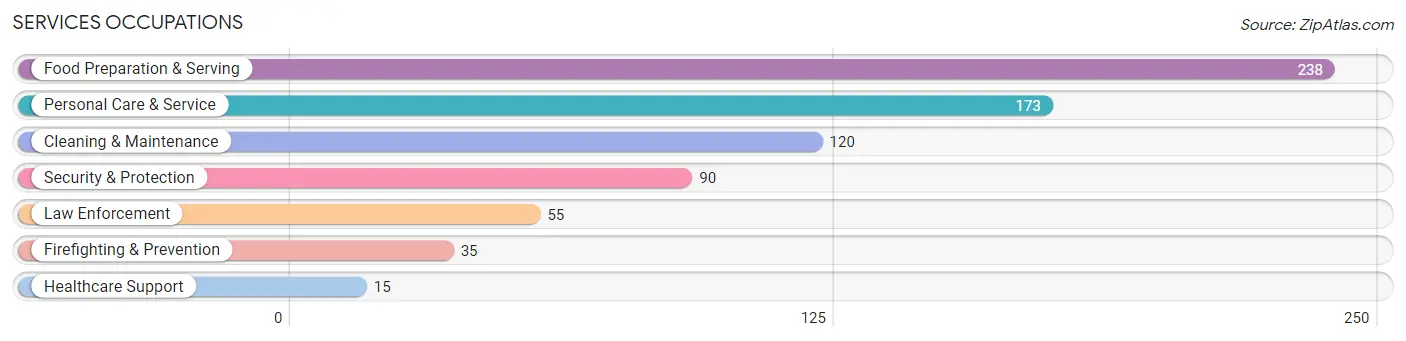
Services Occupations
The most common Services occupations in Bridge City are Food Preparation & Serving (238 | 5.1%), Personal Care & Service (173 | 3.7%), Cleaning & Maintenance (120 | 2.6%), Security & Protection (90 | 1.9%), and Law Enforcement (55 | 1.2%).
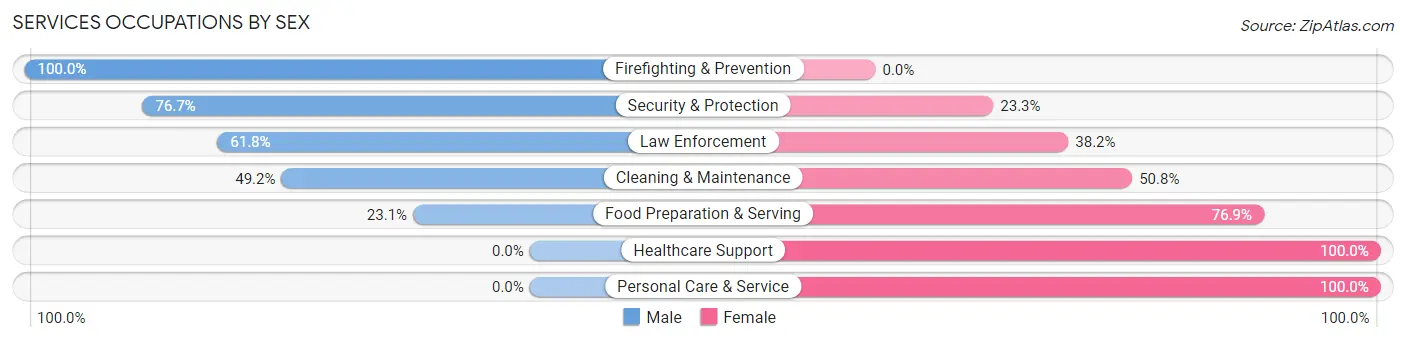
Services Occupations by Sex
Within the Services occupations in Bridge City, the most male-oriented occupations are Firefighting & Prevention (100.0%), Security & Protection (76.7%), and Law Enforcement (61.8%), while the most female-oriented occupations are Healthcare Support (100.0%), Personal Care & Service (100.0%), and Food Preparation & Serving (76.9%).
| Occupation | Male | Female |
| Healthcare Support | 0 (0.0%) | 15 (100.0%) |
| Security & Protection | 69 (76.7%) | 21 (23.3%) |
| Firefighting & Prevention | 35 (100.0%) | 0 (0.0%) |
| Law Enforcement | 34 (61.8%) | 21 (38.2%) |
| Food Preparation & Serving | 55 (23.1%) | 183 (76.9%) |
| Cleaning & Maintenance | 59 (49.2%) | 61 (50.8%) |
| Personal Care & Service | 0 (0.0%) | 173 (100.0%) |
| Total (Category) | 183 (28.8%) | 453 (71.2%) |
| Total (Overall) | 2,708 (57.7%) | 1,985 (42.3%) |
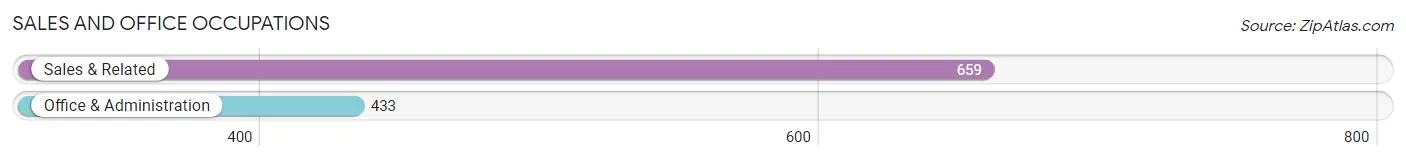
Sales and Office Occupations
The most common Sales and Office occupations in Bridge City are Sales & Related (659 | 14.0%), and Office & Administration (433 | 9.2%).
Sales and Office Occupations by Sex
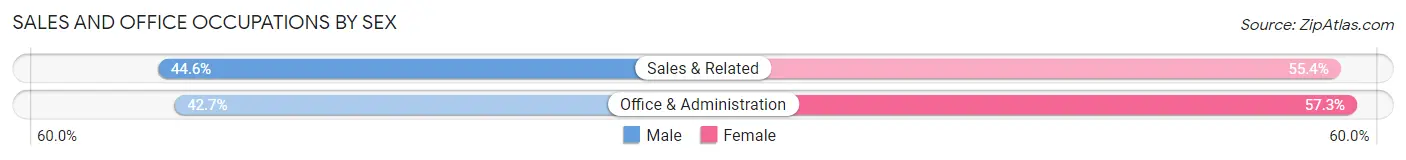
| Occupation | Male | Female |
| Sales & Related | 294 (44.6%) | 365 (55.4%) |
| Office & Administration | 185 (42.7%) | 248 (57.3%) |
| Total (Category) | 479 (43.9%) | 613 (56.1%) |
| Total (Overall) | 2,708 (57.7%) | 1,985 (42.3%) |
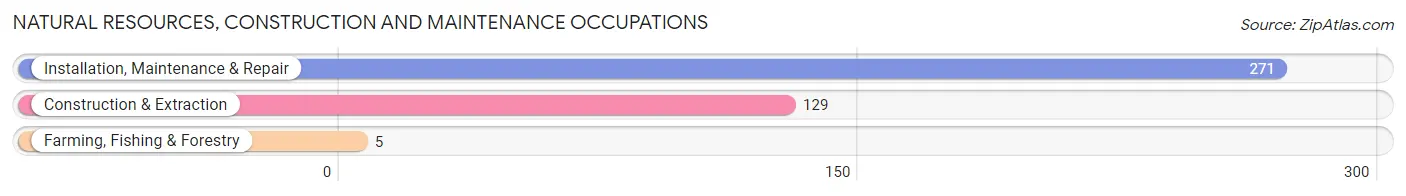
Natural Resources, Construction and Maintenance Occupations
The most common Natural Resources, Construction and Maintenance occupations in Bridge City are Installation, Maintenance & Repair (271 | 5.8%), Construction & Extraction (129 | 2.8%), and Farming, Fishing & Forestry (5 | 0.1%).
Natural Resources, Construction and Maintenance Occupations by Sex
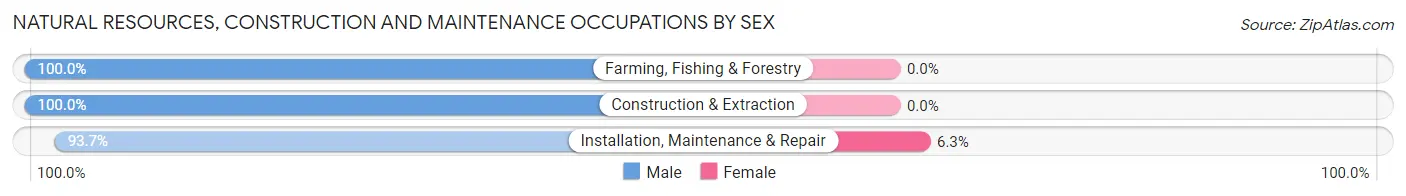
| Occupation | Male | Female |
| Farming, Fishing & Forestry | 5 (100.0%) | 0 (0.0%) |
| Construction & Extraction | 129 (100.0%) | 0 (0.0%) |
| Installation, Maintenance & Repair | 254 (93.7%) | 17 (6.3%) |
| Total (Category) | 388 (95.8%) | 17 (4.2%) |
| Total (Overall) | 2,708 (57.7%) | 1,985 (42.3%) |
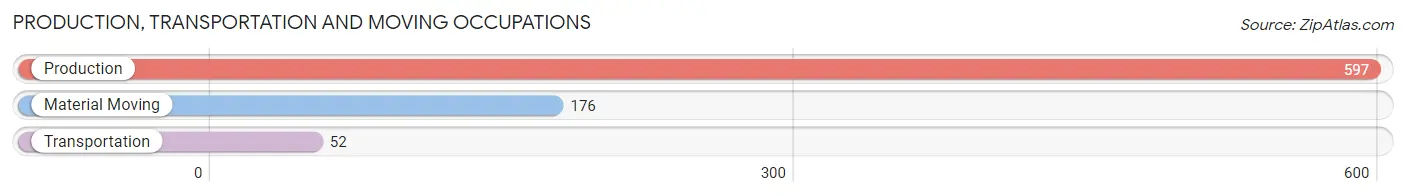
Production, Transportation and Moving Occupations
The most common Production, Transportation and Moving occupations in Bridge City are Production (597 | 12.7%), Material Moving (176 | 3.7%), and Transportation (52 | 1.1%).
Production, Transportation and Moving Occupations by Sex
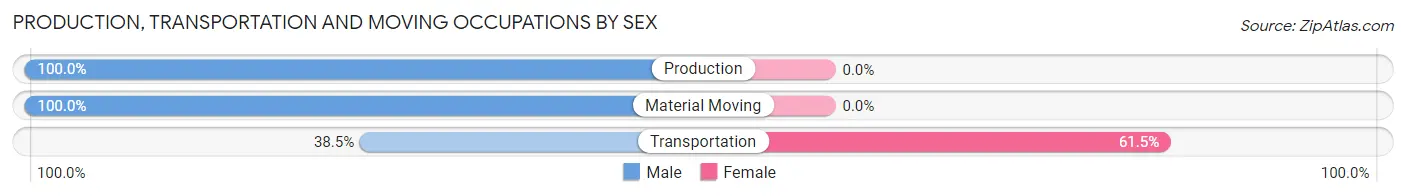
| Occupation | Male | Female |
| Production | 597 (100.0%) | 0 (0.0%) |
| Transportation | 20 (38.5%) | 32 (61.5%) |
| Material Moving | 176 (100.0%) | 0 (0.0%) |
| Total (Category) | 793 (96.1%) | 32 (3.9%) |
| Total (Overall) | 2,708 (57.7%) | 1,985 (42.3%) |
Employment Industries by Sex in Bridge City
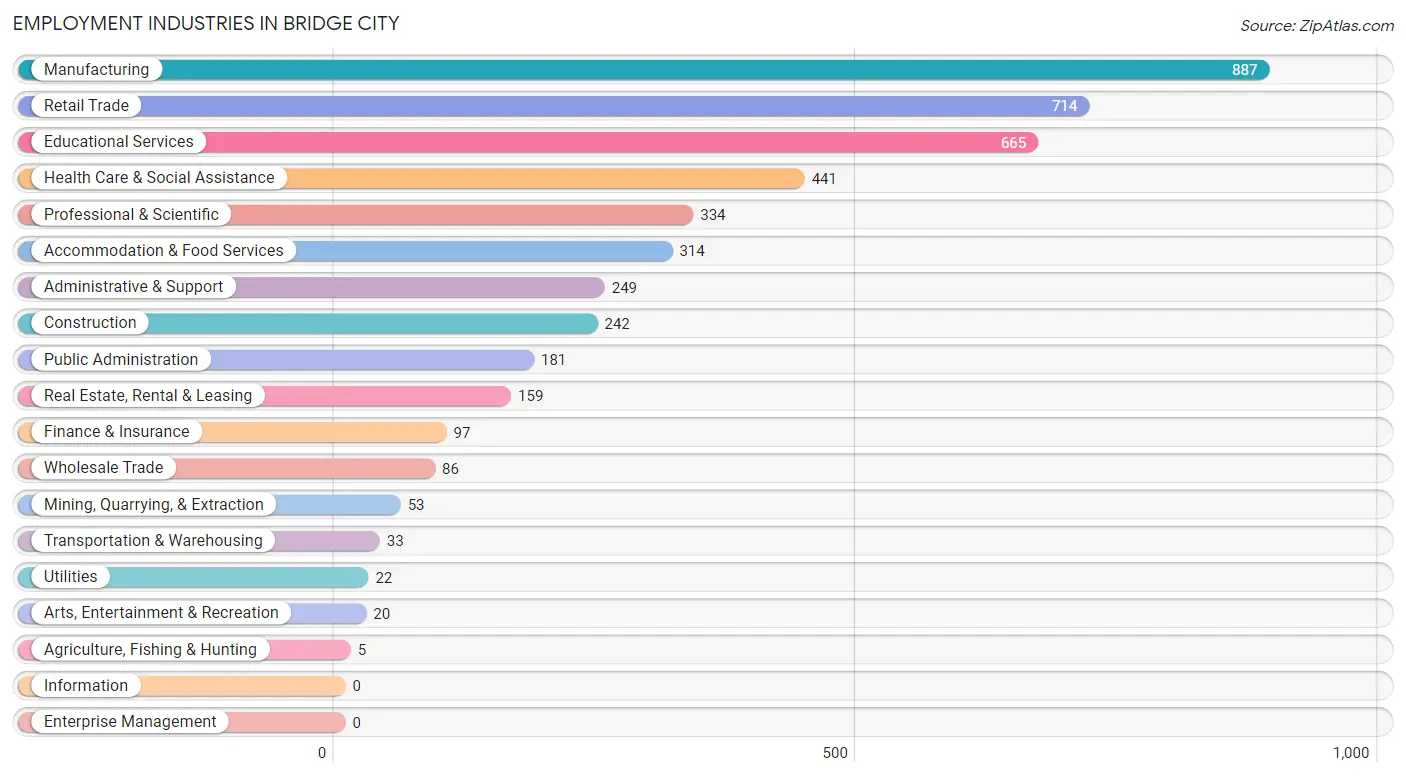
Employment Industries in Bridge City
The major employment industries in Bridge City include Manufacturing (887 | 18.9%), Retail Trade (714 | 15.2%), Educational Services (665 | 14.2%), Health Care & Social Assistance (441 | 9.4%), and Professional & Scientific (334 | 7.1%).
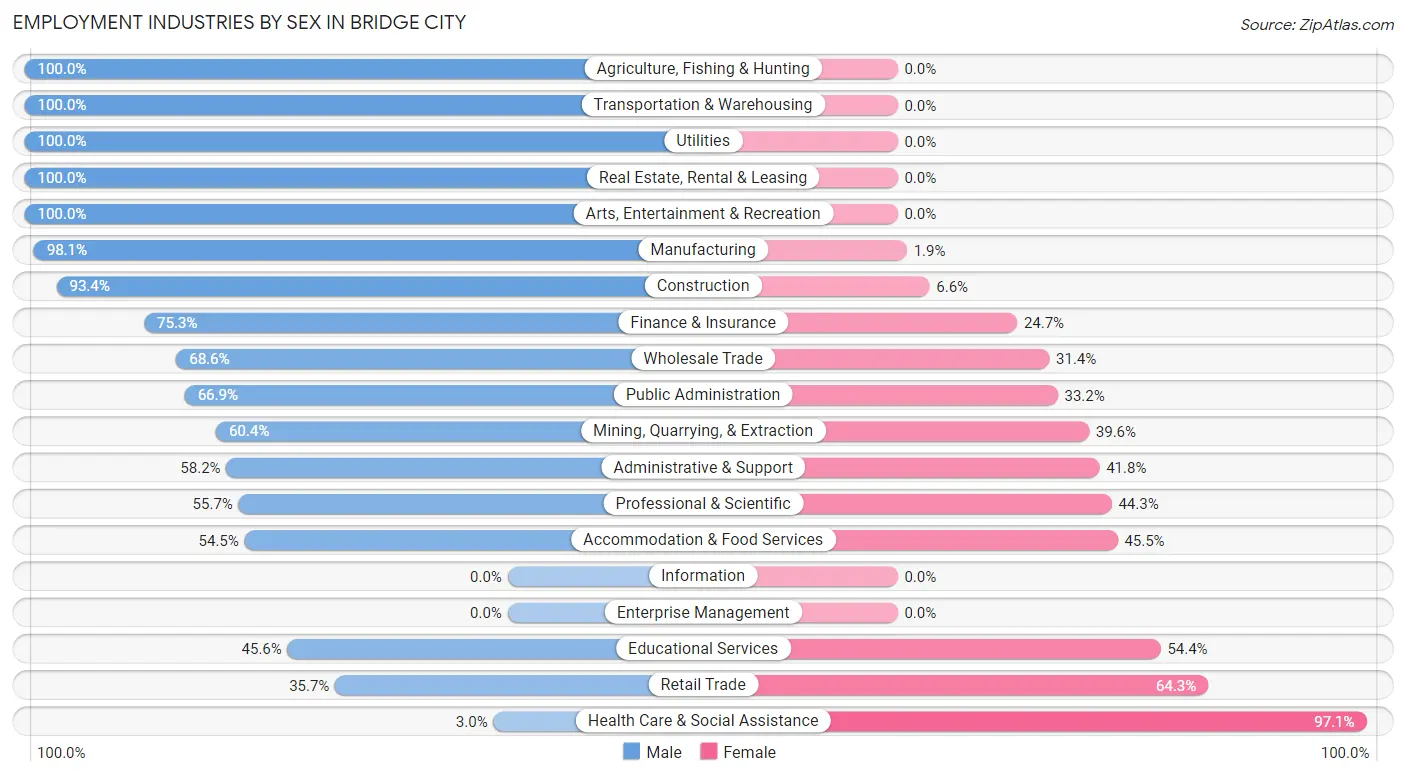
Employment Industries by Sex in Bridge City
The Bridge City industries that see more men than women are Agriculture, Fishing & Hunting (100.0%), Transportation & Warehousing (100.0%), and Utilities (100.0%), whereas the industries that tend to have a higher number of women are Health Care & Social Assistance (97.1%), Retail Trade (64.3%), and Educational Services (54.4%).
| Industry | Male | Female |
| Agriculture, Fishing & Hunting | 5 (100.0%) | 0 (0.0%) |
| Mining, Quarrying, & Extraction | 32 (60.4%) | 21 (39.6%) |
| Construction | 226 (93.4%) | 16 (6.6%) |
| Manufacturing | 870 (98.1%) | 17 (1.9%) |
| Wholesale Trade | 59 (68.6%) | 27 (31.4%) |
| Retail Trade | 255 (35.7%) | 459 (64.3%) |
| Transportation & Warehousing | 33 (100.0%) | 0 (0.0%) |
| Utilities | 22 (100.0%) | 0 (0.0%) |
| Information | 0 (0.0%) | 0 (0.0%) |
| Finance & Insurance | 73 (75.3%) | 24 (24.7%) |
| Real Estate, Rental & Leasing | 159 (100.0%) | 0 (0.0%) |
| Professional & Scientific | 186 (55.7%) | 148 (44.3%) |
| Enterprise Management | 0 (0.0%) | 0 (0.0%) |
| Administrative & Support | 145 (58.2%) | 104 (41.8%) |
| Educational Services | 303 (45.6%) | 362 (54.4%) |
| Health Care & Social Assistance | 13 (2.9%) | 428 (97.1%) |
| Arts, Entertainment & Recreation | 20 (100.0%) | 0 (0.0%) |
| Accommodation & Food Services | 171 (54.5%) | 143 (45.5%) |
| Public Administration | 121 (66.8%) | 60 (33.2%) |
| Total | 2,708 (57.7%) | 1,985 (42.3%) |
Education in Bridge City
School Enrollment in Bridge City
The most common levels of schooling among the 2,612 students in Bridge City are elementary school (680 | 26.0%), high school (659 | 25.2%), and middle school (559 | 21.4%).
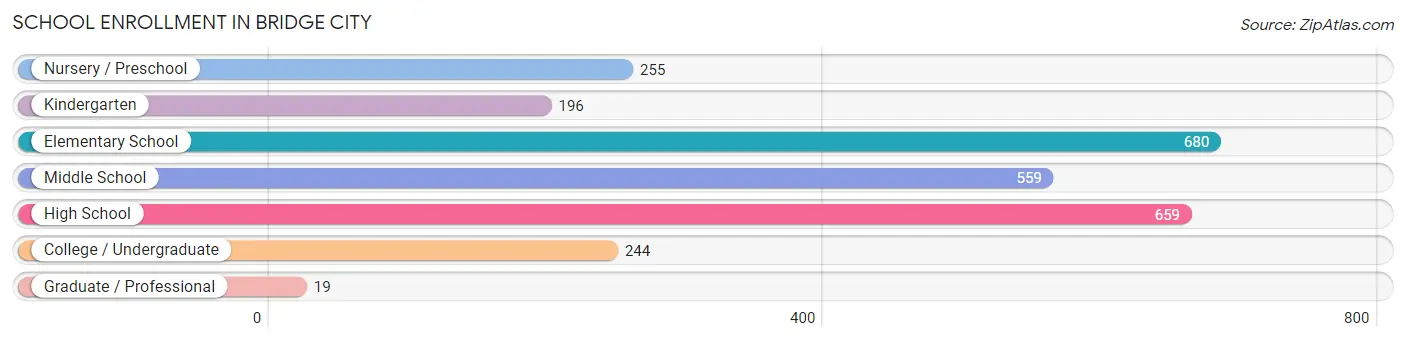
| School Level | # Students | % Students |
| Nursery / Preschool | 255 | 9.8% |
| Kindergarten | 196 | 7.5% |
| Elementary School | 680 | 26.0% |
| Middle School | 559 | 21.4% |
| High School | 659 | 25.2% |
| College / Undergraduate | 244 | 9.3% |
| Graduate / Professional | 19 | 0.7% |
| Total | 2,612 | 100.0% |
School Enrollment by Age by Funding Source in Bridge City
Out of a total of 2,612 students who are enrolled in schools in Bridge City, 413 (15.8%) attend a private institution, while the remaining 2,199 (84.2%) are enrolled in public schools. The age group of 3 to 4 year olds has the highest likelihood of being enrolled in private schools, with 107 (79.3% in the age bracket) enrolled. Conversely, the age group of 15 to 17 year olds has the lowest likelihood of being enrolled in a private school, with 513 (100.0% in the age bracket) attending a public institution.
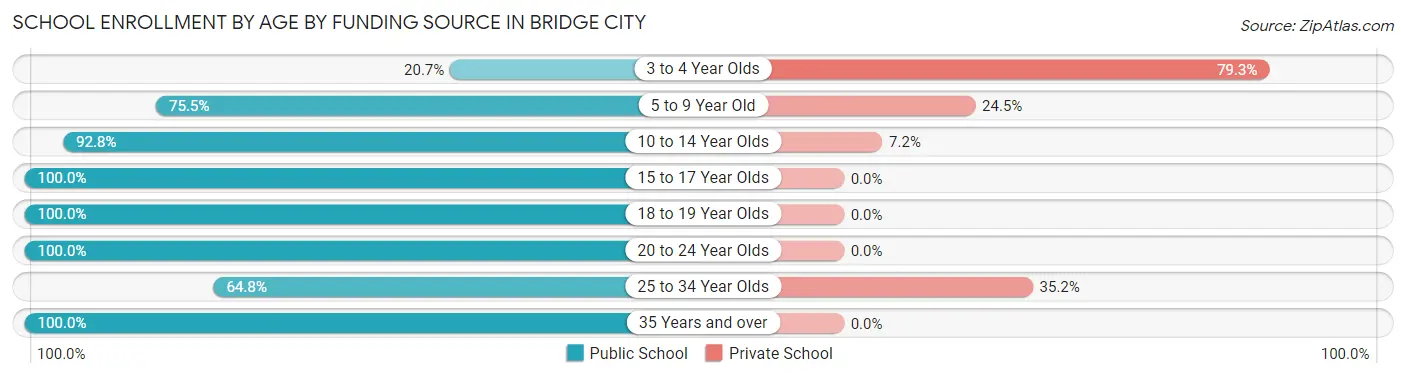
| Age Bracket | Public School | Private School |
| 3 to 4 Year Olds | 28 (20.7%) | 107 (79.3%) |
| 5 to 9 Year Old | 740 (75.5%) | 240 (24.5%) |
| 10 to 14 Year Olds | 596 (92.8%) | 46 (7.2%) |
| 15 to 17 Year Olds | 513 (100.0%) | 0 (0.0%) |
| 18 to 19 Year Olds | 93 (100.0%) | 0 (0.0%) |
| 20 to 24 Year Olds | 178 (100.0%) | 0 (0.0%) |
| 25 to 34 Year Olds | 35 (64.8%) | 19 (35.2%) |
| 35 Years and over | 17 (100.0%) | 0 (0.0%) |
| Total | 2,199 (84.2%) | 413 (15.8%) |
Educational Attainment by Field of Study in Bridge City
Education (294 | 17.4%), business (268 | 15.9%), liberal arts & history (225 | 13.4%), engineering (202 | 12.0%), and science & technology (138 | 8.2%) are the most common fields of study among 1,686 individuals in Bridge City who have obtained a bachelor's degree or higher.
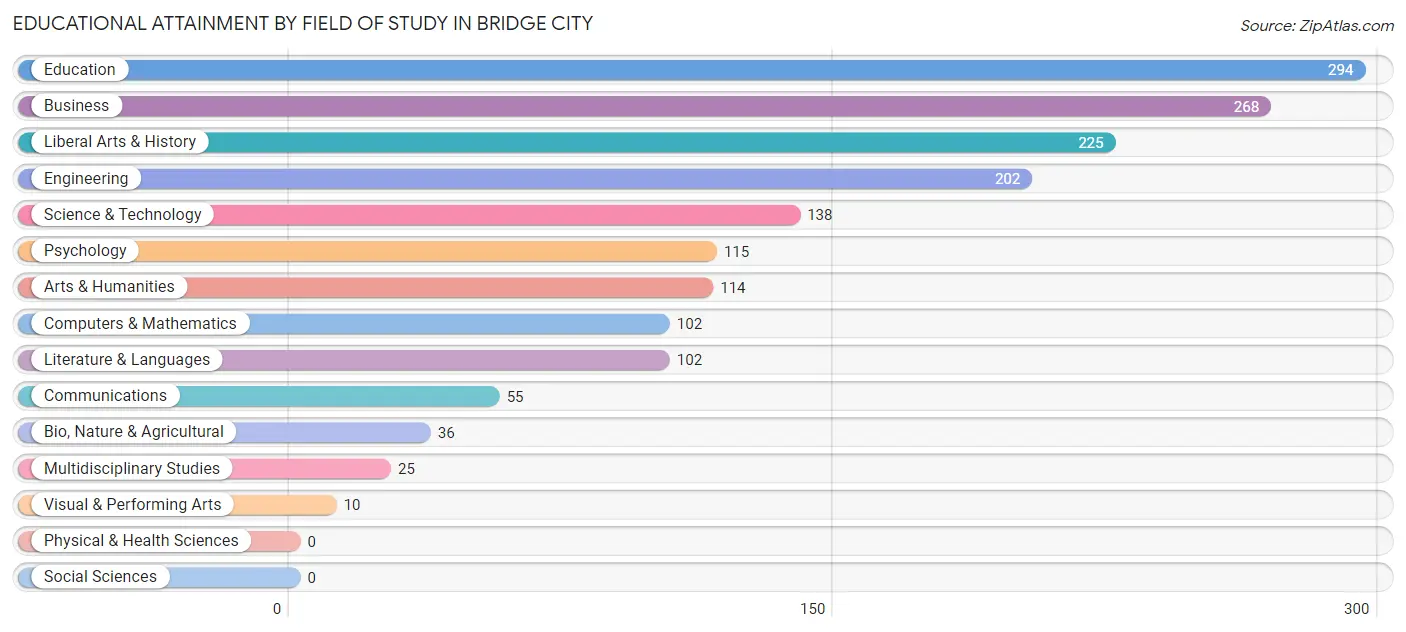
| Field of Study | # Graduates | % Graduates |
| Computers & Mathematics | 102 | 6.0% |
| Bio, Nature & Agricultural | 36 | 2.1% |
| Physical & Health Sciences | 0 | 0.0% |
| Psychology | 115 | 6.8% |
| Social Sciences | 0 | 0.0% |
| Engineering | 202 | 12.0% |
| Multidisciplinary Studies | 25 | 1.5% |
| Science & Technology | 138 | 8.2% |
| Business | 268 | 15.9% |
| Education | 294 | 17.4% |
| Literature & Languages | 102 | 6.0% |
| Liberal Arts & History | 225 | 13.4% |
| Visual & Performing Arts | 10 | 0.6% |
| Communications | 55 | 3.3% |
| Arts & Humanities | 114 | 6.8% |
| Total | 1,686 | 100.0% |
Transportation & Commute in Bridge City
Vehicle Availability by Sex in Bridge City
The most prevalent vehicle ownership categories in Bridge City are males with 2 vehicles (1,265, accounting for 49.1%) and females with 2 vehicles (1,087, making up 64.0%).
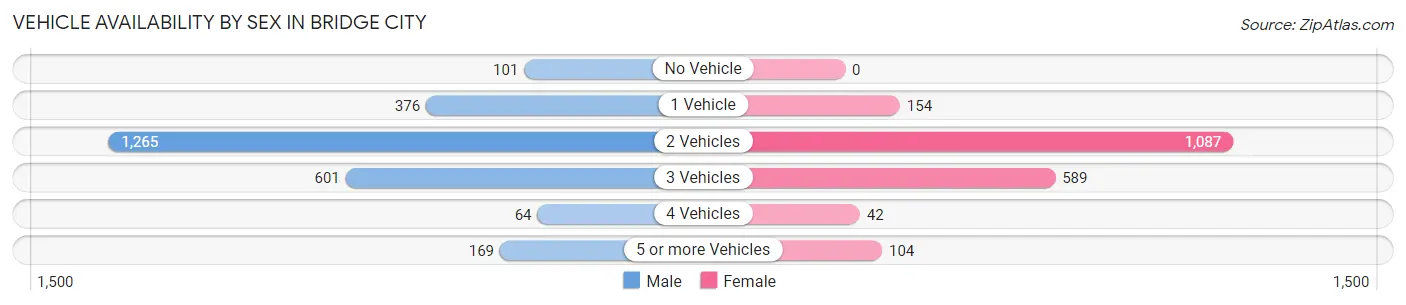
| Vehicles Available | Male | Female |
| No Vehicle | 101 (3.9%) | 0 (0.0%) |
| 1 Vehicle | 376 (14.6%) | 154 (7.8%) |
| 2 Vehicles | 1,265 (49.1%) | 1,087 (55.0%) |
| 3 Vehicles | 601 (23.3%) | 589 (29.8%) |
| 4 Vehicles | 64 (2.5%) | 42 (2.1%) |
| 5 or more Vehicles | 169 (6.6%) | 104 (5.3%) |
| Total | 2,576 (100.0%) | 1,976 (100.0%) |
Commute Time in Bridge City
The most frequently occuring commute durations in Bridge City are 20 to 24 minutes (1,070 commuters, 23.8%), 15 to 19 minutes (831 commuters, 18.5%), and 5 to 9 minutes (662 commuters, 14.7%).
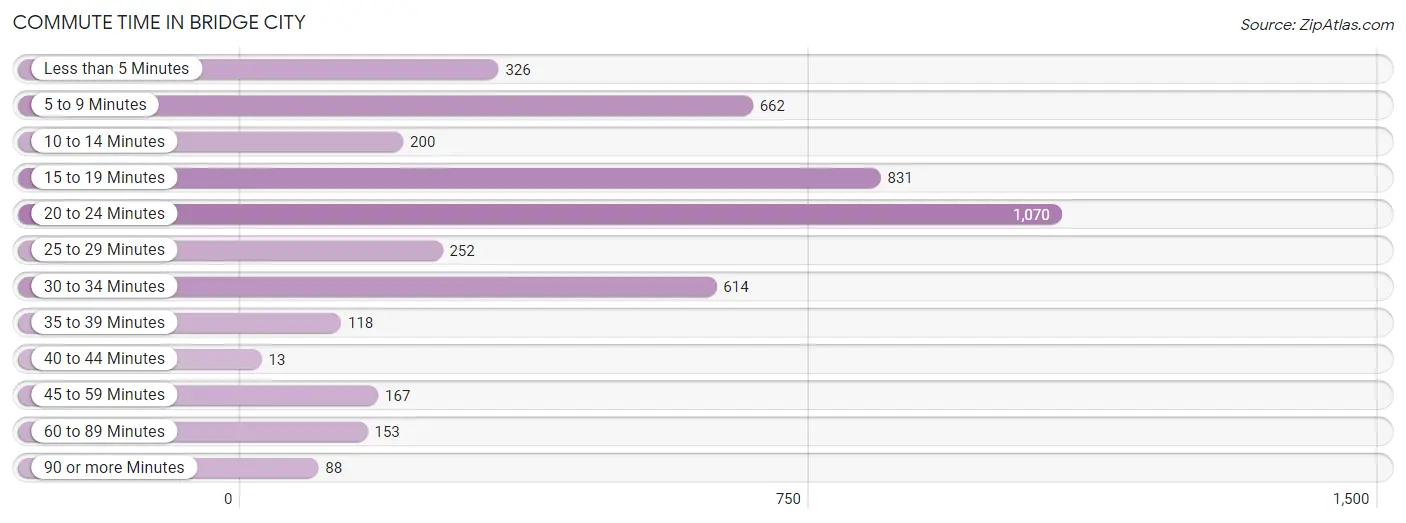
| Commute Time | # Commuters | % Commuters |
| Less than 5 Minutes | 326 | 7.2% |
| 5 to 9 Minutes | 662 | 14.7% |
| 10 to 14 Minutes | 200 | 4.4% |
| 15 to 19 Minutes | 831 | 18.5% |
| 20 to 24 Minutes | 1,070 | 23.8% |
| 25 to 29 Minutes | 252 | 5.6% |
| 30 to 34 Minutes | 614 | 13.7% |
| 35 to 39 Minutes | 118 | 2.6% |
| 40 to 44 Minutes | 13 | 0.3% |
| 45 to 59 Minutes | 167 | 3.7% |
| 60 to 89 Minutes | 153 | 3.4% |
| 90 or more Minutes | 88 | 2.0% |
Commute Time by Sex in Bridge City
The most common commute times in Bridge City are 20 to 24 minutes (610 commuters, 23.7%) for males and 20 to 24 minutes (460 commuters, 24.0%) for females.
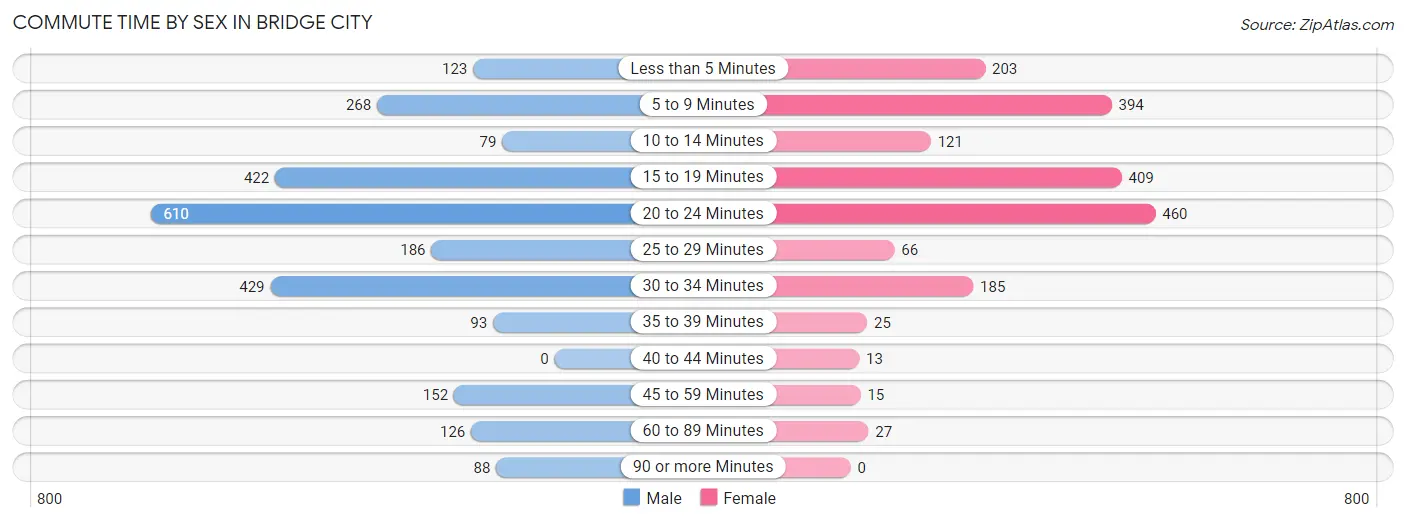
| Commute Time | Male | Female |
| Less than 5 Minutes | 123 (4.8%) | 203 (10.6%) |
| 5 to 9 Minutes | 268 (10.4%) | 394 (20.5%) |
| 10 to 14 Minutes | 79 (3.1%) | 121 (6.3%) |
| 15 to 19 Minutes | 422 (16.4%) | 409 (21.3%) |
| 20 to 24 Minutes | 610 (23.7%) | 460 (24.0%) |
| 25 to 29 Minutes | 186 (7.2%) | 66 (3.4%) |
| 30 to 34 Minutes | 429 (16.7%) | 185 (9.7%) |
| 35 to 39 Minutes | 93 (3.6%) | 25 (1.3%) |
| 40 to 44 Minutes | 0 (0.0%) | 13 (0.7%) |
| 45 to 59 Minutes | 152 (5.9%) | 15 (0.8%) |
| 60 to 89 Minutes | 126 (4.9%) | 27 (1.4%) |
| 90 or more Minutes | 88 (3.4%) | 0 (0.0%) |
Time of Departure to Work by Sex in Bridge City
The most frequent times of departure to work in Bridge City are 7:00 AM to 7:29 AM (533, 20.7%) for males and 7:00 AM to 7:29 AM (646, 33.7%) for females.
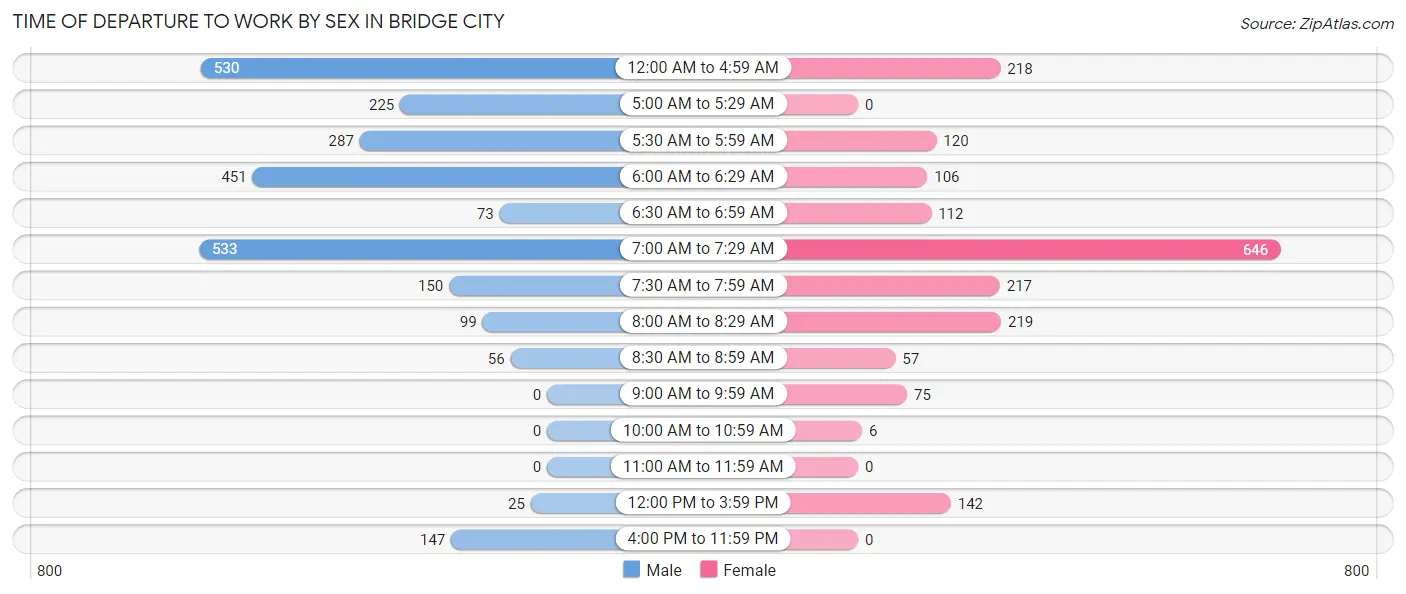
| Time of Departure | Male | Female |
| 12:00 AM to 4:59 AM | 530 (20.6%) | 218 (11.4%) |
| 5:00 AM to 5:29 AM | 225 (8.7%) | 0 (0.0%) |
| 5:30 AM to 5:59 AM | 287 (11.1%) | 120 (6.3%) |
| 6:00 AM to 6:29 AM | 451 (17.5%) | 106 (5.5%) |
| 6:30 AM to 6:59 AM | 73 (2.8%) | 112 (5.8%) |
| 7:00 AM to 7:29 AM | 533 (20.7%) | 646 (33.7%) |
| 7:30 AM to 7:59 AM | 150 (5.8%) | 217 (11.3%) |
| 8:00 AM to 8:29 AM | 99 (3.8%) | 219 (11.4%) |
| 8:30 AM to 8:59 AM | 56 (2.2%) | 57 (3.0%) |
| 9:00 AM to 9:59 AM | 0 (0.0%) | 75 (3.9%) |
| 10:00 AM to 10:59 AM | 0 (0.0%) | 6 (0.3%) |
| 11:00 AM to 11:59 AM | 0 (0.0%) | 0 (0.0%) |
| 12:00 PM to 3:59 PM | 25 (1.0%) | 142 (7.4%) |
| 4:00 PM to 11:59 PM | 147 (5.7%) | 0 (0.0%) |
| Total | 2,576 (100.0%) | 1,918 (100.0%) |
Housing Occupancy in Bridge City
Occupancy by Ownership in Bridge City
Of the total 3,259 dwellings in Bridge City, owner-occupied units account for 2,524 (77.4%), while renter-occupied units make up 735 (22.6%).
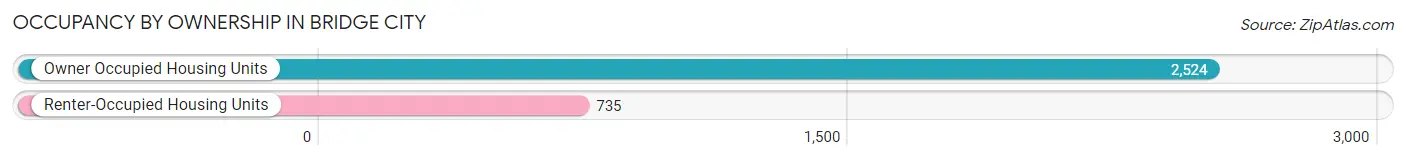
| Occupancy | # Housing Units | % Housing Units |
| Owner Occupied Housing Units | 2,524 | 77.4% |
| Renter-Occupied Housing Units | 735 | 22.6% |
| Total Occupied Housing Units | 3,259 | 100.0% |
Occupancy by Household Size in Bridge City
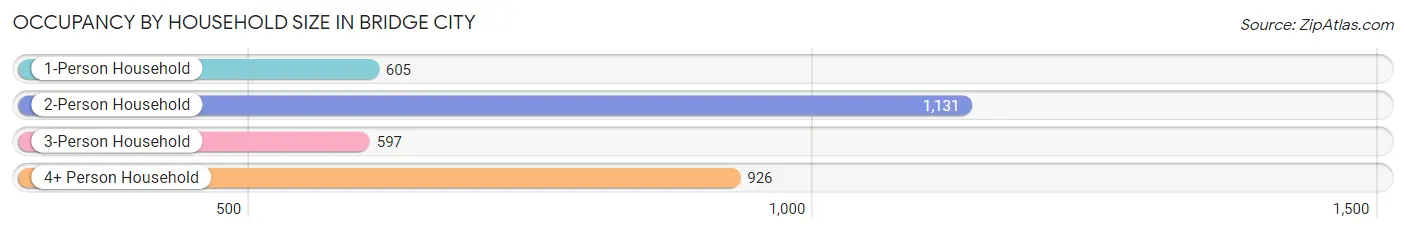
| Household Size | # Housing Units | % Housing Units |
| 1-Person Household | 605 | 18.6% |
| 2-Person Household | 1,131 | 34.7% |
| 3-Person Household | 597 | 18.3% |
| 4+ Person Household | 926 | 28.4% |
| Total Housing Units | 3,259 | 100.0% |
Occupancy by Ownership by Household Size in Bridge City
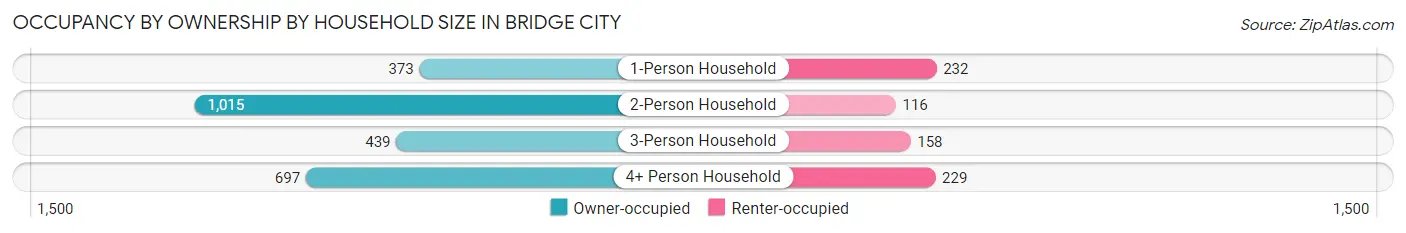
| Household Size | Owner-occupied | Renter-occupied |
| 1-Person Household | 373 (61.7%) | 232 (38.4%) |
| 2-Person Household | 1,015 (89.7%) | 116 (10.3%) |
| 3-Person Household | 439 (73.5%) | 158 (26.5%) |
| 4+ Person Household | 697 (75.3%) | 229 (24.7%) |
| Total Housing Units | 2,524 (77.4%) | 735 (22.6%) |
Occupancy by Educational Attainment in Bridge City
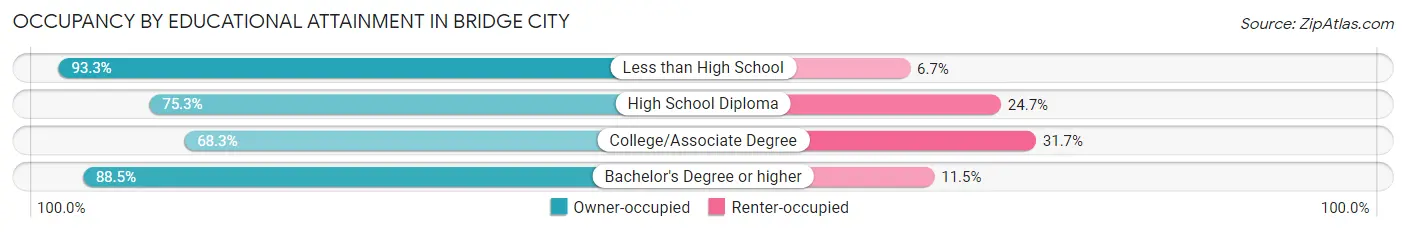
| Household Size | Owner-occupied | Renter-occupied |
| Less than High School | 222 (93.3%) | 16 (6.7%) |
| High School Diploma | 834 (75.3%) | 274 (24.7%) |
| College/Associate Degree | 762 (68.3%) | 353 (31.7%) |
| Bachelor's Degree or higher | 706 (88.5%) | 92 (11.5%) |
Occupancy by Age of Householder in Bridge City
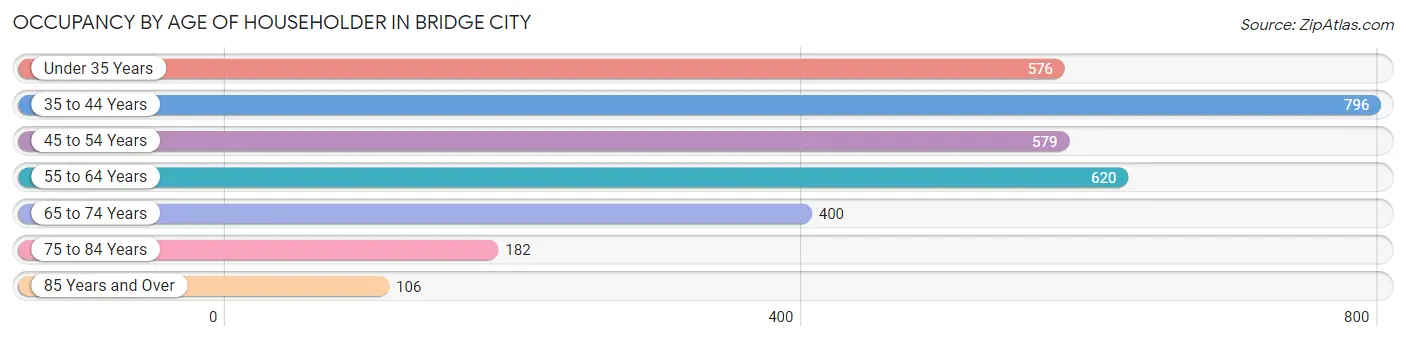
| Age Bracket | # Households | % Households |
| Under 35 Years | 576 | 17.7% |
| 35 to 44 Years | 796 | 24.4% |
| 45 to 54 Years | 579 | 17.8% |
| 55 to 64 Years | 620 | 19.0% |
| 65 to 74 Years | 400 | 12.3% |
| 75 to 84 Years | 182 | 5.6% |
| 85 Years and Over | 106 | 3.3% |
| Total | 3,259 | 100.0% |
Housing Finances in Bridge City
Median Income by Occupancy in Bridge City
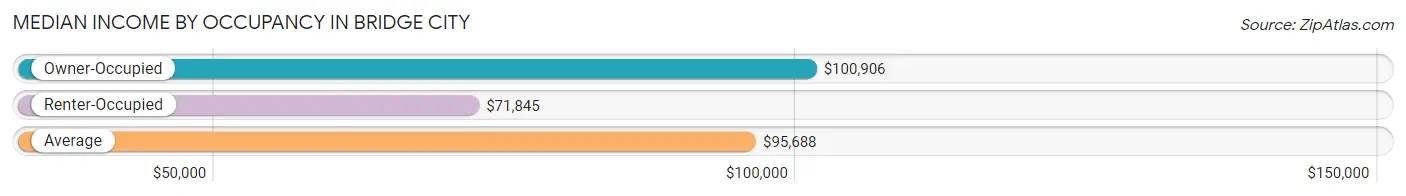
| Occupancy Type | # Households | Median Income |
| Owner-Occupied | 2,524 (77.4%) | $100,906 |
| Renter-Occupied | 735 (22.6%) | $71,845 |
| Average | 3,259 (100.0%) | $95,688 |
Occupancy by Householder Income Bracket in Bridge City
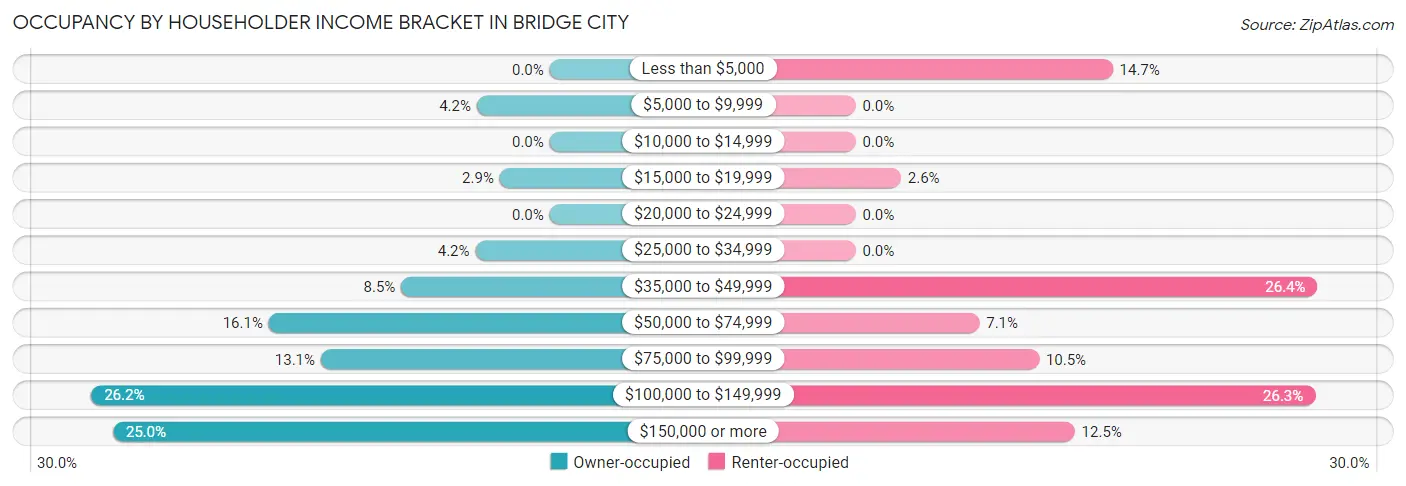
| Income Bracket | Owner-occupied | Renter-occupied |
| Less than $5,000 | 0 (0.0%) | 108 (14.7%) |
| $5,000 to $9,999 | 105 (4.2%) | 0 (0.0%) |
| $10,000 to $14,999 | 0 (0.0%) | 0 (0.0%) |
| $15,000 to $19,999 | 72 (2.9%) | 19 (2.6%) |
| $20,000 to $24,999 | 0 (0.0%) | 0 (0.0%) |
| $25,000 to $34,999 | 107 (4.2%) | 0 (0.0%) |
| $35,000 to $49,999 | 214 (8.5%) | 194 (26.4%) |
| $50,000 to $74,999 | 405 (16.1%) | 52 (7.1%) |
| $75,000 to $99,999 | 330 (13.1%) | 77 (10.5%) |
| $100,000 to $149,999 | 661 (26.2%) | 193 (26.3%) |
| $150,000 or more | 630 (25.0%) | 92 (12.5%) |
| Total | 2,524 (100.0%) | 735 (100.0%) |
Monthly Housing Cost Tiers in Bridge City
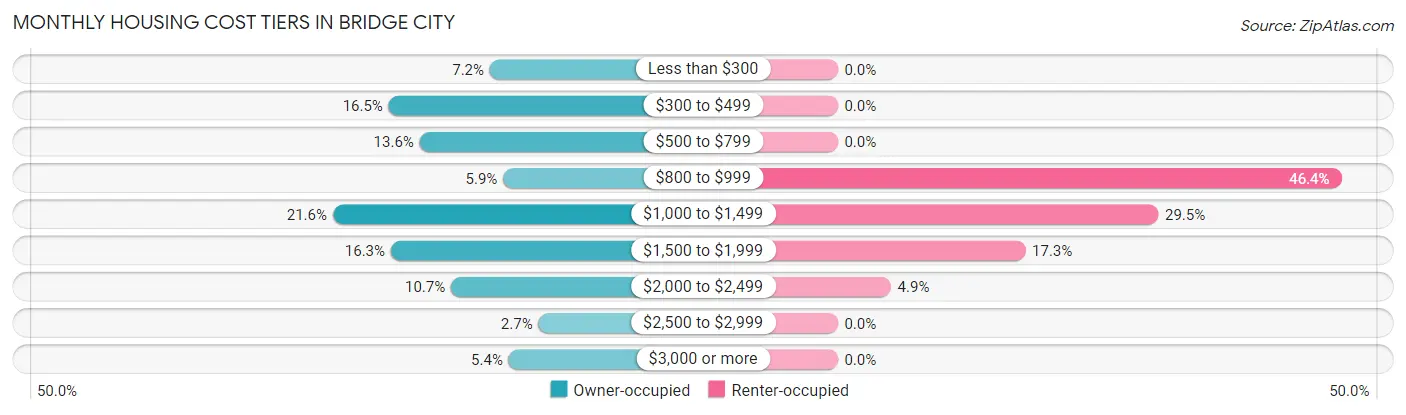
| Monthly Cost | Owner-occupied | Renter-occupied |
| Less than $300 | 181 (7.2%) | 0 (0.0%) |
| $300 to $499 | 416 (16.5%) | 0 (0.0%) |
| $500 to $799 | 344 (13.6%) | 0 (0.0%) |
| $800 to $999 | 150 (5.9%) | 341 (46.4%) |
| $1,000 to $1,499 | 546 (21.6%) | 217 (29.5%) |
| $1,500 to $1,999 | 411 (16.3%) | 127 (17.3%) |
| $2,000 to $2,499 | 271 (10.7%) | 36 (4.9%) |
| $2,500 to $2,999 | 68 (2.7%) | 0 (0.0%) |
| $3,000 or more | 137 (5.4%) | 0 (0.0%) |
| Total | 2,524 (100.0%) | 735 (100.0%) |
Physical Housing Characteristics in Bridge City
Housing Structures in Bridge City
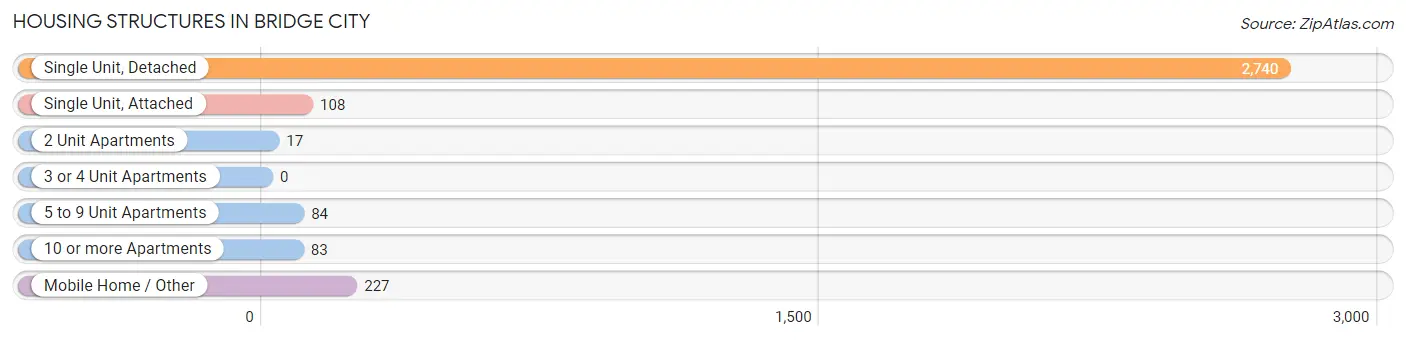
| Structure Type | # Housing Units | % Housing Units |
| Single Unit, Detached | 2,740 | 84.1% |
| Single Unit, Attached | 108 | 3.3% |
| 2 Unit Apartments | 17 | 0.5% |
| 3 or 4 Unit Apartments | 0 | 0.0% |
| 5 to 9 Unit Apartments | 84 | 2.6% |
| 10 or more Apartments | 83 | 2.5% |
| Mobile Home / Other | 227 | 7.0% |
| Total | 3,259 | 100.0% |
Housing Structures by Occupancy in Bridge City
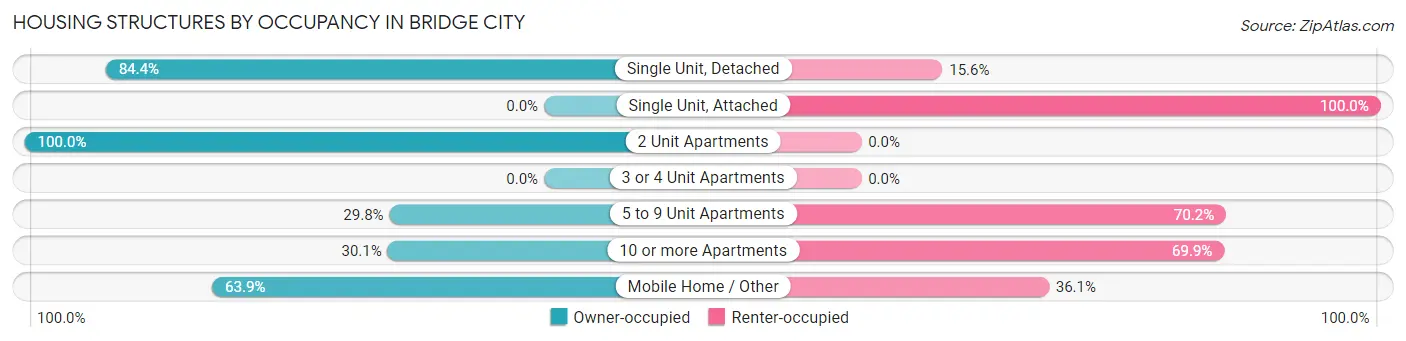
| Structure Type | Owner-occupied | Renter-occupied |
| Single Unit, Detached | 2,312 (84.4%) | 428 (15.6%) |
| Single Unit, Attached | 0 (0.0%) | 108 (100.0%) |
| 2 Unit Apartments | 17 (100.0%) | 0 (0.0%) |
| 3 or 4 Unit Apartments | 0 (0.0%) | 0 (0.0%) |
| 5 to 9 Unit Apartments | 25 (29.8%) | 59 (70.2%) |
| 10 or more Apartments | 25 (30.1%) | 58 (69.9%) |
| Mobile Home / Other | 145 (63.9%) | 82 (36.1%) |
| Total | 2,524 (77.4%) | 735 (22.6%) |
Housing Structures by Number of Rooms in Bridge City
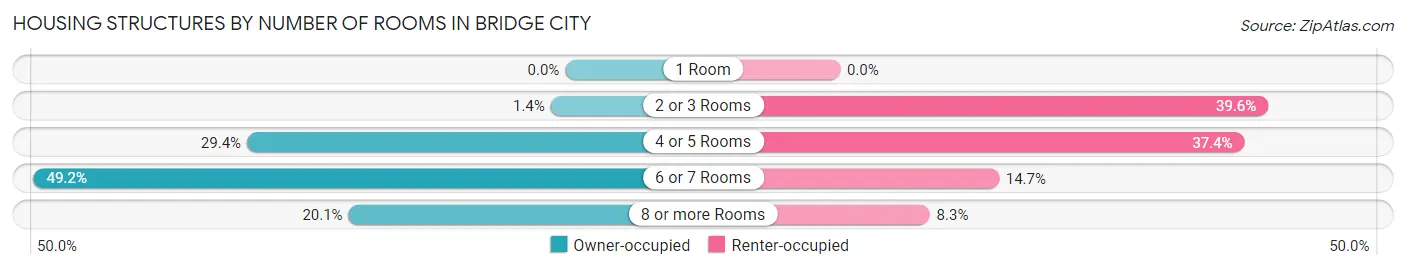
| Number of Rooms | Owner-occupied | Renter-occupied |
| 1 Room | 0 (0.0%) | 0 (0.0%) |
| 2 or 3 Rooms | 34 (1.3%) | 291 (39.6%) |
| 4 or 5 Rooms | 743 (29.4%) | 275 (37.4%) |
| 6 or 7 Rooms | 1,241 (49.2%) | 108 (14.7%) |
| 8 or more Rooms | 506 (20.1%) | 61 (8.3%) |
| Total | 2,524 (100.0%) | 735 (100.0%) |
Housing Structure by Heating Type in Bridge City
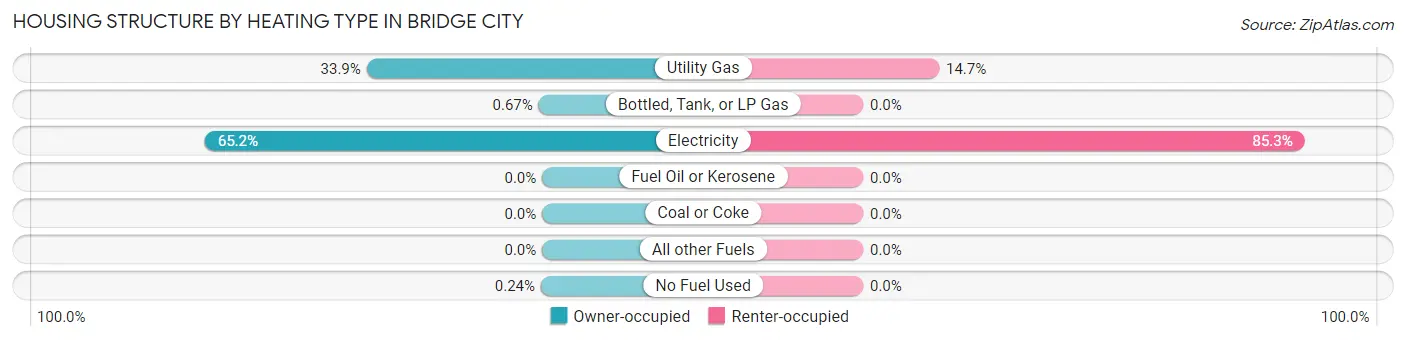
| Heating Type | Owner-occupied | Renter-occupied |
| Utility Gas | 856 (33.9%) | 108 (14.7%) |
| Bottled, Tank, or LP Gas | 17 (0.7%) | 0 (0.0%) |
| Electricity | 1,645 (65.2%) | 627 (85.3%) |
| Fuel Oil or Kerosene | 0 (0.0%) | 0 (0.0%) |
| Coal or Coke | 0 (0.0%) | 0 (0.0%) |
| All other Fuels | 0 (0.0%) | 0 (0.0%) |
| No Fuel Used | 6 (0.2%) | 0 (0.0%) |
| Total | 2,524 (100.0%) | 735 (100.0%) |
Household Vehicle Usage in Bridge City
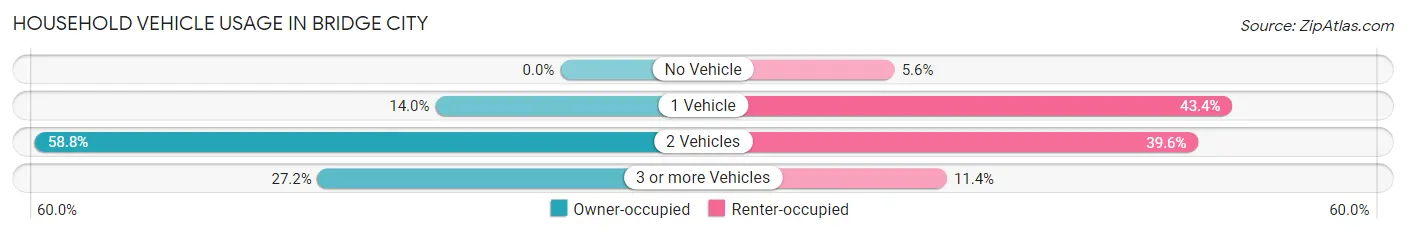
| Vehicles per Household | Owner-occupied | Renter-occupied |
| No Vehicle | 0 (0.0%) | 41 (5.6%) |
| 1 Vehicle | 353 (14.0%) | 319 (43.4%) |
| 2 Vehicles | 1,485 (58.8%) | 291 (39.6%) |
| 3 or more Vehicles | 686 (27.2%) | 84 (11.4%) |
| Total | 2,524 (100.0%) | 735 (100.0%) |
Real Estate & Mortgages in Bridge City
Real Estate and Mortgage Overview in Bridge City
| Characteristic | Without Mortgage | With Mortgage |
| Housing Units | 1,078 | 1,446 |
| Median Property Value | $127,000 | $205,100 |
| Median Household Income | $63,462 | $546 |
| Monthly Housing Costs | $476 | $137 |
| Real Estate Taxes | $1,454 | $21 |
Property Value by Mortgage Status in Bridge City
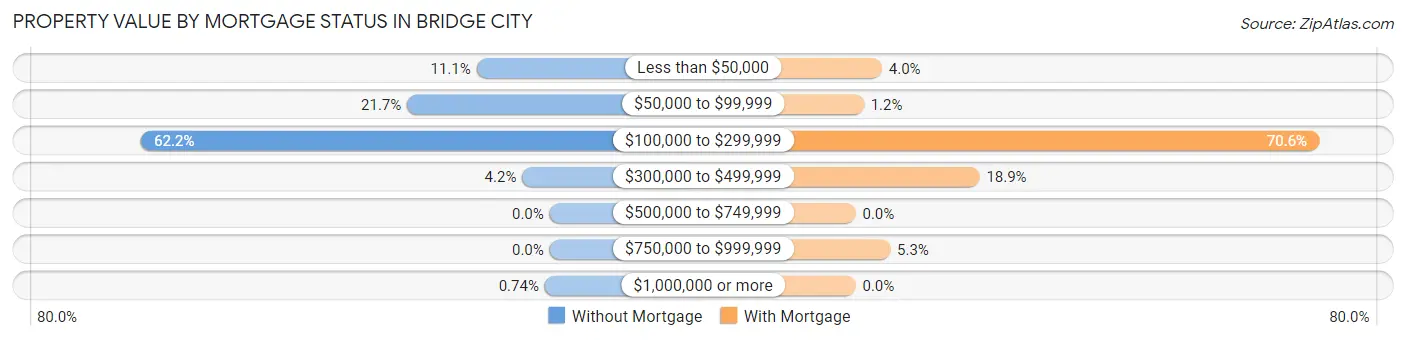
| Property Value | Without Mortgage | With Mortgage |
| Less than $50,000 | 120 (11.1%) | 58 (4.0%) |
| $50,000 to $99,999 | 234 (21.7%) | 18 (1.2%) |
| $100,000 to $299,999 | 671 (62.2%) | 1,021 (70.6%) |
| $300,000 to $499,999 | 45 (4.2%) | 273 (18.9%) |
| $500,000 to $749,999 | 0 (0.0%) | 0 (0.0%) |
| $750,000 to $999,999 | 0 (0.0%) | 76 (5.3%) |
| $1,000,000 or more | 8 (0.7%) | 0 (0.0%) |
| Total | 1,078 (100.0%) | 1,446 (100.0%) |
Household Income by Mortgage Status in Bridge City
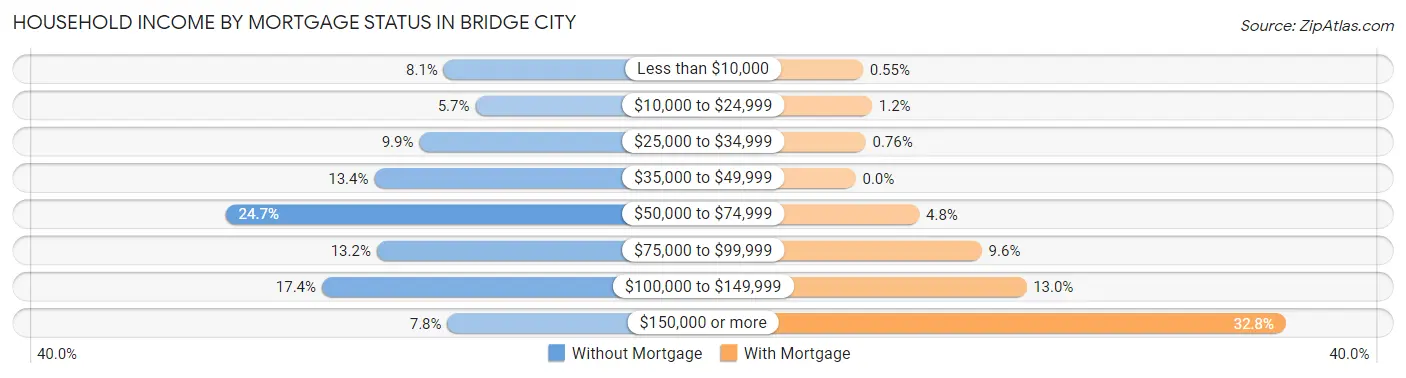
| Household Income | Without Mortgage | With Mortgage |
| Less than $10,000 | 87 (8.1%) | 8 (0.5%) |
| $10,000 to $24,999 | 61 (5.7%) | 18 (1.2%) |
| $25,000 to $34,999 | 107 (9.9%) | 11 (0.8%) |
| $35,000 to $49,999 | 144 (13.4%) | 0 (0.0%) |
| $50,000 to $74,999 | 266 (24.7%) | 70 (4.8%) |
| $75,000 to $99,999 | 142 (13.2%) | 139 (9.6%) |
| $100,000 to $149,999 | 187 (17.3%) | 188 (13.0%) |
| $150,000 or more | 84 (7.8%) | 474 (32.8%) |
| Total | 1,078 (100.0%) | 1,446 (100.0%) |
Property Value to Household Income Ratio in Bridge City
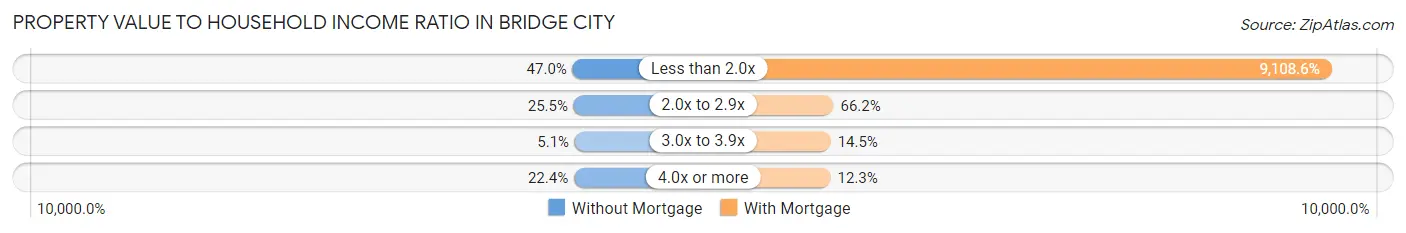
| Value-to-Income Ratio | Without Mortgage | With Mortgage |
| Less than 2.0x | 507 (47.0%) | 131,710 (9,108.6%) |
| 2.0x to 2.9x | 275 (25.5%) | 957 (66.2%) |
| 3.0x to 3.9x | 55 (5.1%) | 209 (14.4%) |
| 4.0x or more | 241 (22.4%) | 178 (12.3%) |
| Total | 1,078 (100.0%) | 1,446 (100.0%) |
Real Estate Taxes by Mortgage Status in Bridge City
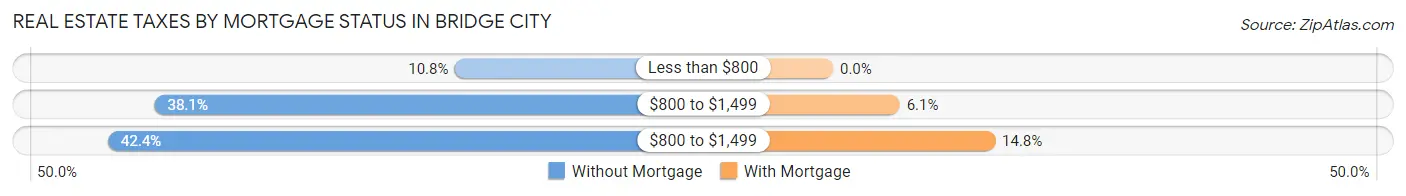
| Property Taxes | Without Mortgage | With Mortgage |
| Less than $800 | 116 (10.8%) | 0 (0.0%) |
| $800 to $1,499 | 411 (38.1%) | 88 (6.1%) |
| $800 to $1,499 | 457 (42.4%) | 214 (14.8%) |
| Total | 1,078 (100.0%) | 1,446 (100.0%) |
Health & Disability in Bridge City
Health Insurance Coverage by Age in Bridge City
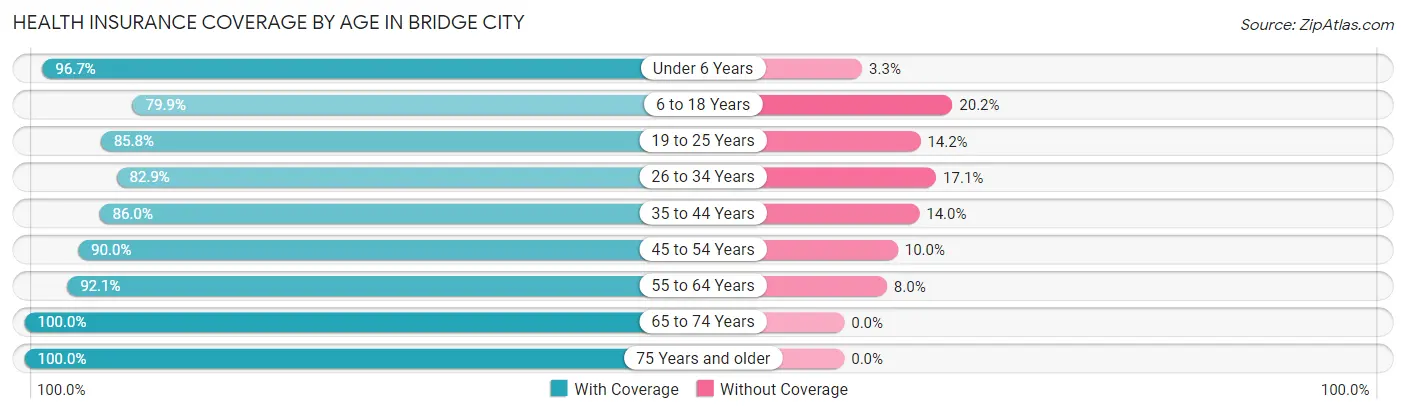
| Age Bracket | With Coverage | Without Coverage |
| Under 6 Years | 783 (96.7%) | 27 (3.3%) |
| 6 to 18 Years | 1,660 (79.8%) | 419 (20.2%) |
| 19 to 25 Years | 562 (85.8%) | 93 (14.2%) |
| 26 to 34 Years | 890 (82.9%) | 184 (17.1%) |
| 35 to 44 Years | 1,224 (86.0%) | 199 (14.0%) |
| 45 to 54 Years | 1,020 (90.0%) | 113 (10.0%) |
| 55 to 64 Years | 1,007 (92.0%) | 87 (8.0%) |
| 65 to 74 Years | 708 (100.0%) | 0 (0.0%) |
| 75 Years and older | 485 (100.0%) | 0 (0.0%) |
| Total | 8,339 (88.1%) | 1,122 (11.9%) |
Health Insurance Coverage by Citizenship Status in Bridge City
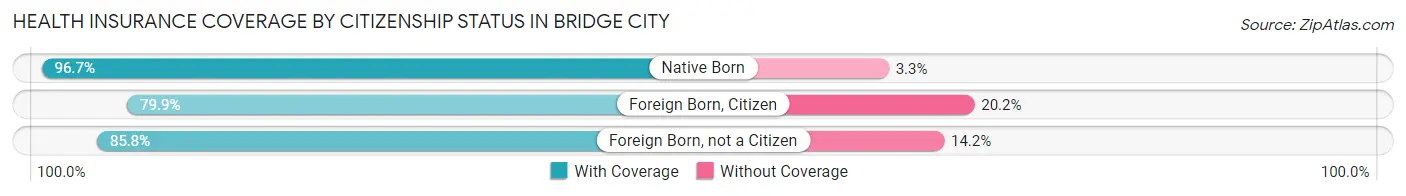
| Citizenship Status | With Coverage | Without Coverage |
| Native Born | 783 (96.7%) | 27 (3.3%) |
| Foreign Born, Citizen | 1,660 (79.8%) | 419 (20.2%) |
| Foreign Born, not a Citizen | 562 (85.8%) | 93 (14.2%) |
Health Insurance Coverage by Household Income in Bridge City
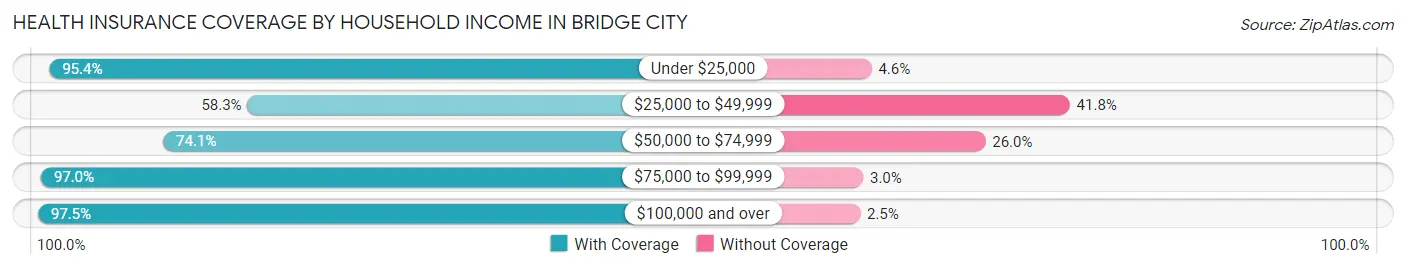
| Household Income | With Coverage | Without Coverage |
| Under $25,000 | 351 (95.4%) | 17 (4.6%) |
| $25,000 to $49,999 | 939 (58.3%) | 673 (41.7%) |
| $50,000 to $74,999 | 756 (74.1%) | 265 (26.0%) |
| $75,000 to $99,999 | 1,149 (97.0%) | 36 (3.0%) |
| $100,000 and over | 5,144 (97.5%) | 131 (2.5%) |
Public vs Private Health Insurance Coverage by Age in Bridge City
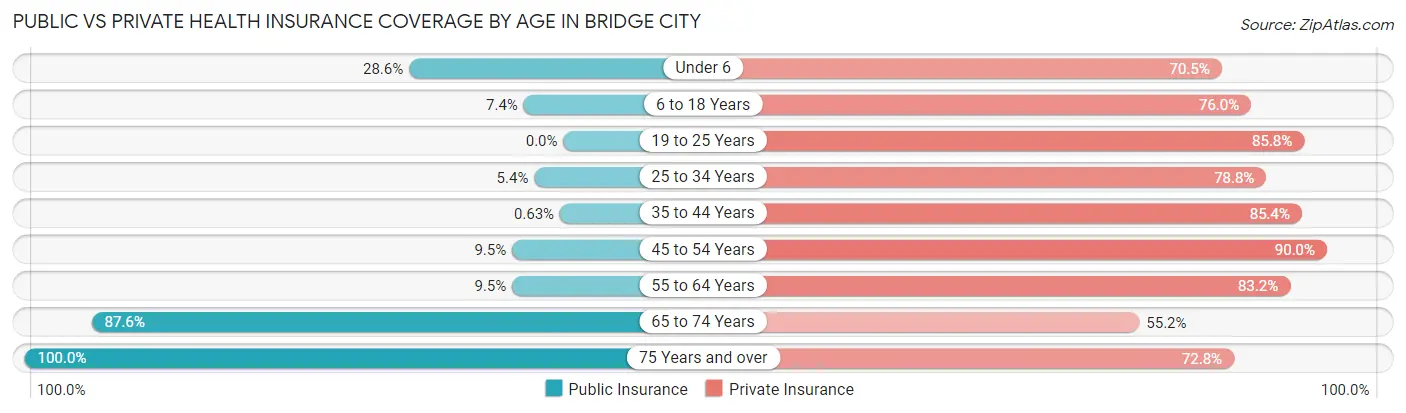
| Age Bracket | Public Insurance | Private Insurance |
| Under 6 | 232 (28.6%) | 571 (70.5%) |
| 6 to 18 Years | 153 (7.4%) | 1,579 (75.9%) |
| 19 to 25 Years | 0 (0.0%) | 562 (85.8%) |
| 25 to 34 Years | 58 (5.4%) | 846 (78.8%) |
| 35 to 44 Years | 9 (0.6%) | 1,215 (85.4%) |
| 45 to 54 Years | 108 (9.5%) | 1,020 (90.0%) |
| 55 to 64 Years | 104 (9.5%) | 910 (83.2%) |
| 65 to 74 Years | 620 (87.6%) | 391 (55.2%) |
| 75 Years and over | 485 (100.0%) | 353 (72.8%) |
| Total | 1,769 (18.7%) | 7,447 (78.7%) |
Disability Status by Sex by Age in Bridge City
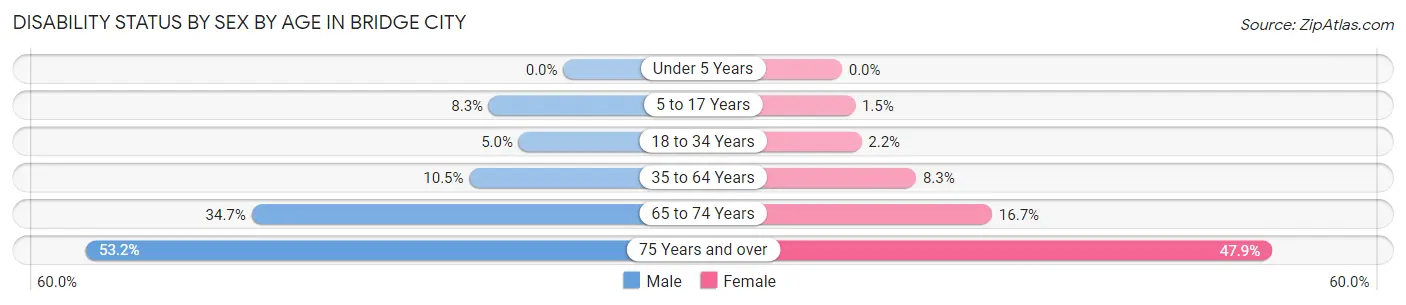
| Age Bracket | Male | Female |
| Under 5 Years | 0 (0.0%) | 0 (0.0%) |
| 5 to 17 Years | 79 (8.3%) | 18 (1.5%) |
| 18 to 34 Years | 47 (5.0%) | 21 (2.2%) |
| 35 to 64 Years | 201 (10.5%) | 143 (8.3%) |
| 65 to 74 Years | 142 (34.7%) | 50 (16.7%) |
| 75 Years and over | 118 (53.1%) | 126 (47.9%) |
Disability Class by Sex by Age in Bridge City
Disability Class: Hearing Difficulty
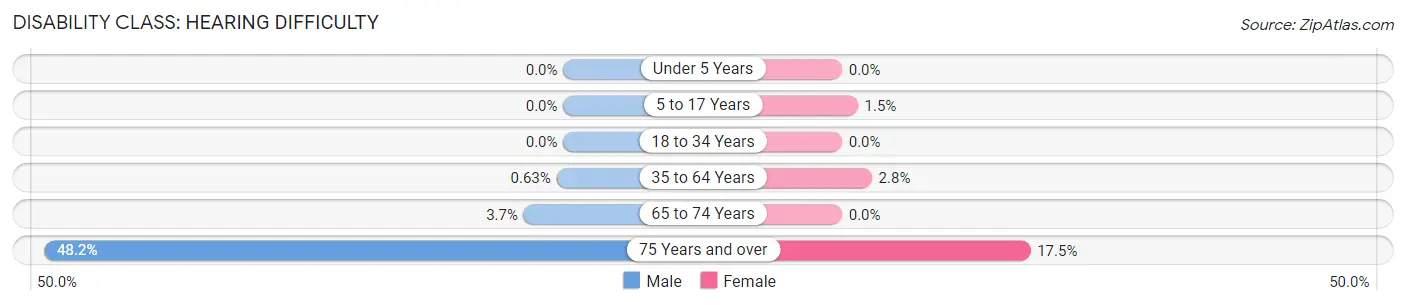
| Age Bracket | Male | Female |
| Under 5 Years | 0 (0.0%) | 0 (0.0%) |
| 5 to 17 Years | 0 (0.0%) | 18 (1.5%) |
| 18 to 34 Years | 0 (0.0%) | 0 (0.0%) |
| 35 to 64 Years | 12 (0.6%) | 48 (2.8%) |
| 65 to 74 Years | 15 (3.7%) | 0 (0.0%) |
| 75 Years and over | 107 (48.2%) | 46 (17.5%) |
Disability Class: Vision Difficulty
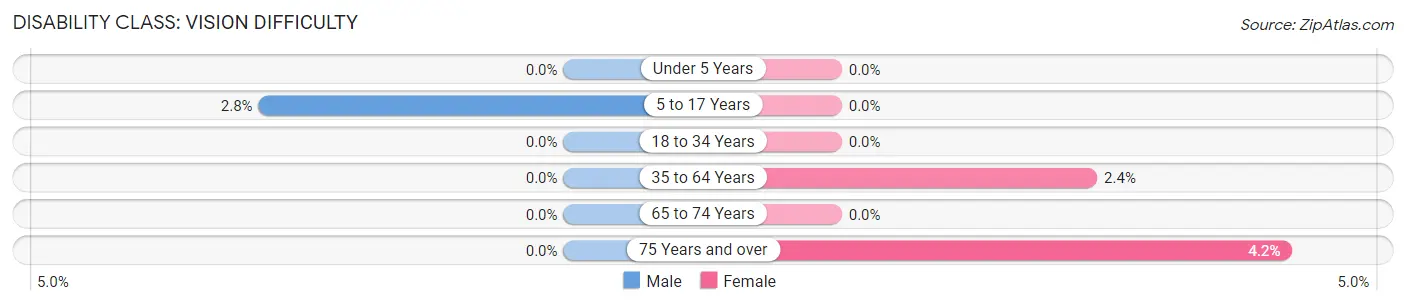
| Age Bracket | Male | Female |
| Under 5 Years | 0 (0.0%) | 0 (0.0%) |
| 5 to 17 Years | 27 (2.8%) | 0 (0.0%) |
| 18 to 34 Years | 0 (0.0%) | 0 (0.0%) |
| 35 to 64 Years | 0 (0.0%) | 41 (2.4%) |
| 65 to 74 Years | 0 (0.0%) | 0 (0.0%) |
| 75 Years and over | 0 (0.0%) | 11 (4.2%) |
Disability Class: Cognitive Difficulty
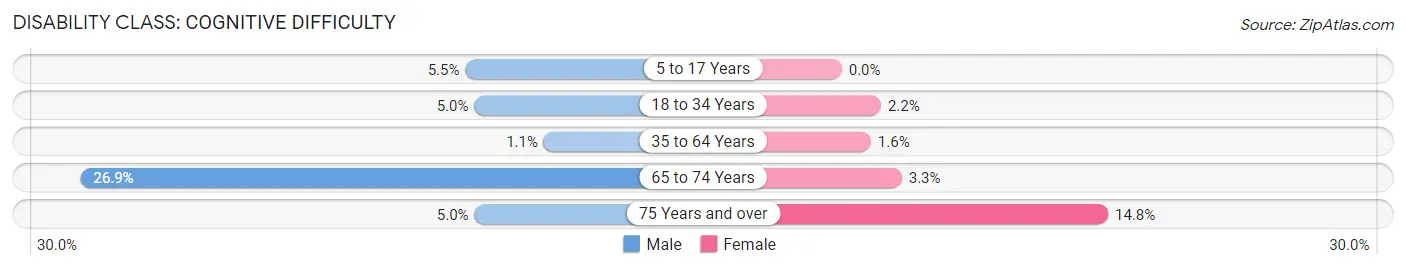
| Age Bracket | Male | Female |
| 5 to 17 Years | 52 (5.5%) | 0 (0.0%) |
| 18 to 34 Years | 47 (5.0%) | 21 (2.2%) |
| 35 to 64 Years | 21 (1.1%) | 28 (1.6%) |
| 65 to 74 Years | 110 (26.9%) | 10 (3.3%) |
| 75 Years and over | 11 (5.0%) | 39 (14.8%) |
Disability Class: Ambulatory Difficulty
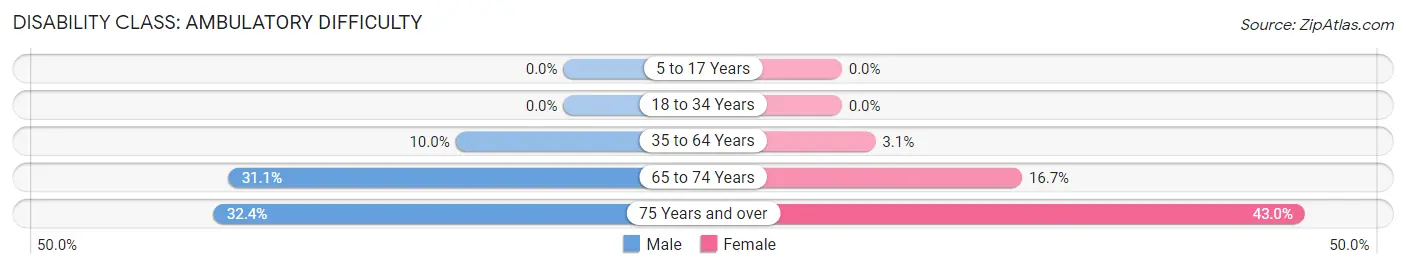
| Age Bracket | Male | Female |
| 5 to 17 Years | 0 (0.0%) | 0 (0.0%) |
| 18 to 34 Years | 0 (0.0%) | 0 (0.0%) |
| 35 to 64 Years | 192 (10.0%) | 54 (3.1%) |
| 65 to 74 Years | 127 (31.0%) | 50 (16.7%) |
| 75 Years and over | 72 (32.4%) | 113 (43.0%) |
Disability Class: Self-Care Difficulty
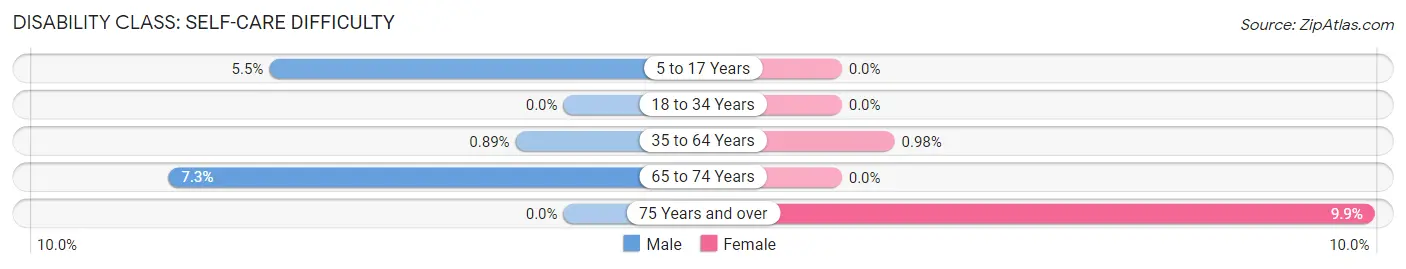
| Age Bracket | Male | Female |
| 5 to 17 Years | 52 (5.5%) | 0 (0.0%) |
| 18 to 34 Years | 0 (0.0%) | 0 (0.0%) |
| 35 to 64 Years | 17 (0.9%) | 17 (1.0%) |
| 65 to 74 Years | 30 (7.3%) | 0 (0.0%) |
| 75 Years and over | 0 (0.0%) | 26 (9.9%) |
Technology Access in Bridge City
Computing Device Access in Bridge City
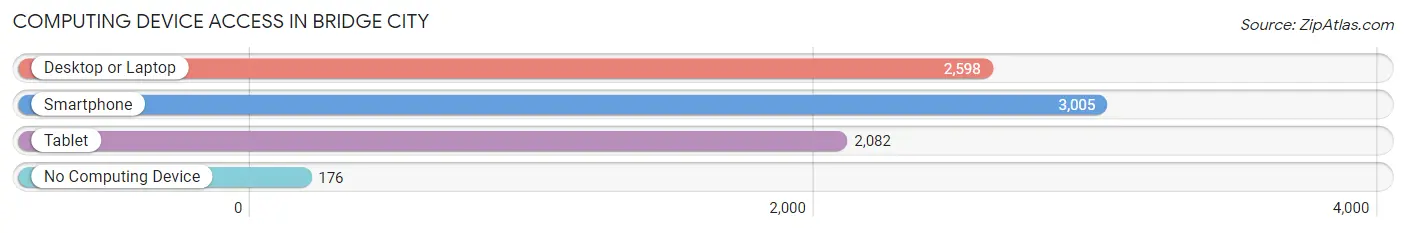
| Device Type | # Households | % Households |
| Desktop or Laptop | 2,598 | 79.7% |
| Smartphone | 3,005 | 92.2% |
| Tablet | 2,082 | 63.9% |
| No Computing Device | 176 | 5.4% |
| Total | 3,259 | 100.0% |
Internet Access in Bridge City
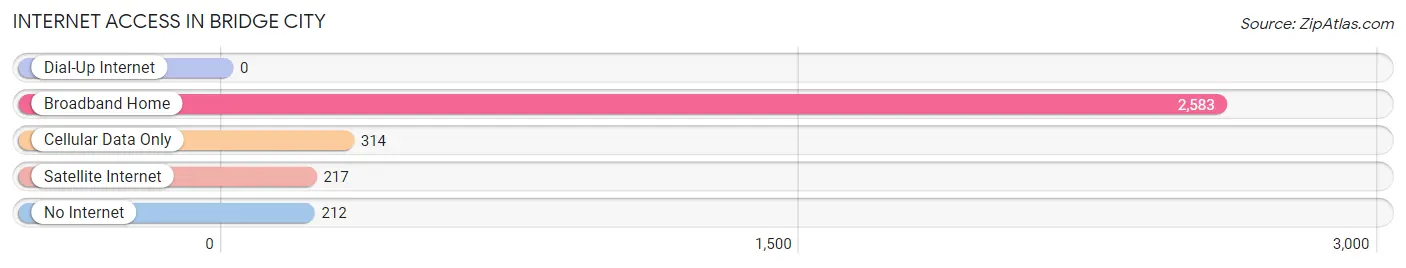
| Internet Type | # Households | % Households |
| Dial-Up Internet | 0 | 0.0% |
| Broadband Home | 2,583 | 79.3% |
| Cellular Data Only | 314 | 9.6% |
| Satellite Internet | 217 | 6.7% |
| No Internet | 212 | 6.5% |
| Total | 3,259 | 100.0% |
Bridge City Summary
City of Bridge City Texas
Bridge City is a city located in Orange County, Texas, United States. The population was 7,840 at the 2010 census. It is part of the Beaumont–Port Arthur Metropolitan Statistical Area.
History
The area that is now Bridge City was first settled in the late 1800s by a group of settlers from Louisiana. The settlement was originally known as Prairie View, but was later renamed Bridge City in the early 1900s when a bridge was built across the Neches River. The bridge was built to connect the area to the nearby city of Orange.
The city was officially incorporated in 1948 and has since grown to become a thriving community. The city is home to a variety of businesses, including a number of oil and gas companies, as well as a variety of retail stores and restaurants.
Geography
Bridge City is located at 30°3′25″N 93°54′17″W (30.056944, -93.904722). According to the United States Census Bureau, the city has a total area of 4.2 square miles (10.9 km2), of which 4.1 square miles (10.6 km2) is land and 0.1 square miles (0.3 km2) (2.37%) is water.
Economy
Bridge City is home to a variety of businesses, including a number of oil and gas companies, as well as a variety of retail stores and restaurants. The city is also home to a number of industrial and manufacturing companies, including a paper mill and a chemical plant.
Demographics
As of the census of 2010, there were 7,840 people, 2,945 households, and 2,092 families residing in the city. The population density was 1,912.2 people per square mile (737.2/km2). There were 3,093 housing units at an average density of 756.3 per square mile (292.2/km2). The racial makeup of the city was 79.2% White, 14.2% African American, 0.5% Native American, 0.7% Asian, 0.1% Pacific Islander, 3.3% from other races, and 2.0% from two or more races. Hispanic or Latino of any race were 8.2% of the population.
There were 2,945 households, out of which 33.2% had children under the age of 18 living with them, 51.2% were married couples living together, 14.2% had a female householder with no husband present, and 29.2% were non-families. 24.2% of all households were made up of individuals, and 10.2% had someone living alone who was 65 years of age or older. The average household size was 2.63 and the average family size was 3.12.
In the city, the population was spread out, with 26.2% under the age of 18, 8.7% from 18 to 24, 27.2% from 25 to 44, 24.2% from 45 to 64, and 13.7% who were 65 years of age or older. The median age was 36 years. For every 100 females, there were 93.2 males. For every 100 females age 18 and over, there were 89.3 males.
The median income for a household in the city was $37,917, and the median income for a family was $45,938. Males had a median income of $37,917 versus $25,938 for females. The per capita income for the city was $17,917. About 11.2% of families and 14.2% of the population were below the poverty line, including 19.2% of those under age 18 and 10.2% of those age 65 or over.
Common Questions
What is Per Capita Income in Bridge City?
Per Capita income in Bridge City is $40,633.
What is the Median Family Income in Bridge City?
Median Family Income in Bridge City is $103,462.
What is the Median Household income in Bridge City?
Median Household Income in Bridge City is $95,688.
What is Income or Wage Gap in Bridge City?
Income or Wage Gap in Bridge City is 44.6%.
Women in Bridge City earn 55.4 cents for every dollar earned by a man.
What is Inequality or Gini Index in Bridge City?
Inequality or Gini Index in Bridge City is 0.43.
What is the Total Population of Bridge City?
Total Population of Bridge City is 9,461.
What is the Total Male Population of Bridge City?
Total Male Population of Bridge City is 4,839.
What is the Total Female Population of Bridge City?
Total Female Population of Bridge City is 4,622.
What is the Ratio of Males per 100 Females in Bridge City?
There are 104.69 Males per 100 Females in Bridge City.
What is the Ratio of Females per 100 Males in Bridge City?
There are 95.52 Females per 100 Males in Bridge City.
What is the Median Population Age in Bridge City?
Median Population Age in Bridge City is 36.7 Years.
What is the Average Family Size in Bridge City
Average Family Size in Bridge City is 3.3 People.
What is the Average Household Size in Bridge City
Average Household Size in Bridge City is 2.9 People.
How Large is the Labor Force in Bridge City?
There are 4,779 People in the Labor Forcein in Bridge City.
What is the Percentage of People in the Labor Force in Bridge City?
66.6% of People are in the Labor Force in Bridge City.
What is the Unemployment Rate in Bridge City?
Unemployment Rate in Bridge City is 1.8%.