Keller, TX Map & Demographics
Keller Map
Keller Overview
$72,994
PER CAPITA INCOME
$184,459
AVG FAMILY INCOME
$162,094
AVG HOUSEHOLD INCOME
54.5%
WAGE / INCOME GAP [ % ]
45.5¢/ $1
WAGE / INCOME GAP [ $ ]
$6,944
FAMILY INCOME DEFICIT
0.42
INEQUALITY / GINI INDEX
45,320
TOTAL POPULATION
22,576
MALE POPULATION
22,744
FEMALE POPULATION
99.26
MALES / 100 FEMALES
100.74
FEMALES / 100 MALES
43.3
MEDIAN AGE
3.2
AVG FAMILY SIZE
2.8
AVG HOUSEHOLD SIZE
23,336
LABOR FORCE [ PEOPLE ]
66.5%
PERCENT IN LABOR FORCE
3.0%
UNEMPLOYMENT RATE
Income in Keller
Income Overview in Keller
Per Capita Income in Keller is $72,994, while median incomes of families and households are $184,459 and $162,094 respectively.
| Characteristic | Number | Measure |
| Per Capita Income | 45,320 | $72,994 |
| Median Family Income | 12,805 | $184,459 |
| Mean Family Income | 12,805 | $227,629 |
| Median Household Income | 16,052 | $162,094 |
| Mean Household Income | 16,052 | $204,680 |
| Income Deficit | 12,805 | $6,944 |
| Wage / Income Gap (%) | 45,320 | 54.48% |
| Wage / Income Gap ($) | 45,320 | 45.52¢ per $1 |
| Gini / Inequality Index | 45,320 | 0.42 |
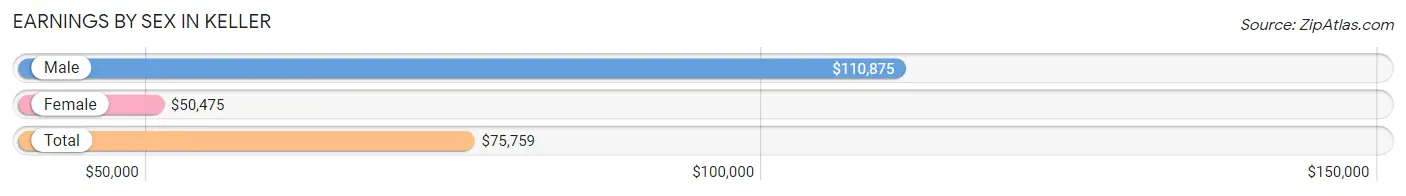
Earnings by Sex in Keller
Average Earnings in Keller are $75,759, $110,875 for men and $50,475 for women, a difference of 54.5%.
| Sex | Number | Average Earnings |
| Male | 13,968 (56.3%) | $110,875 |
| Female | 10,854 (43.7%) | $50,475 |
| Total | 24,822 (100.0%) | $75,759 |
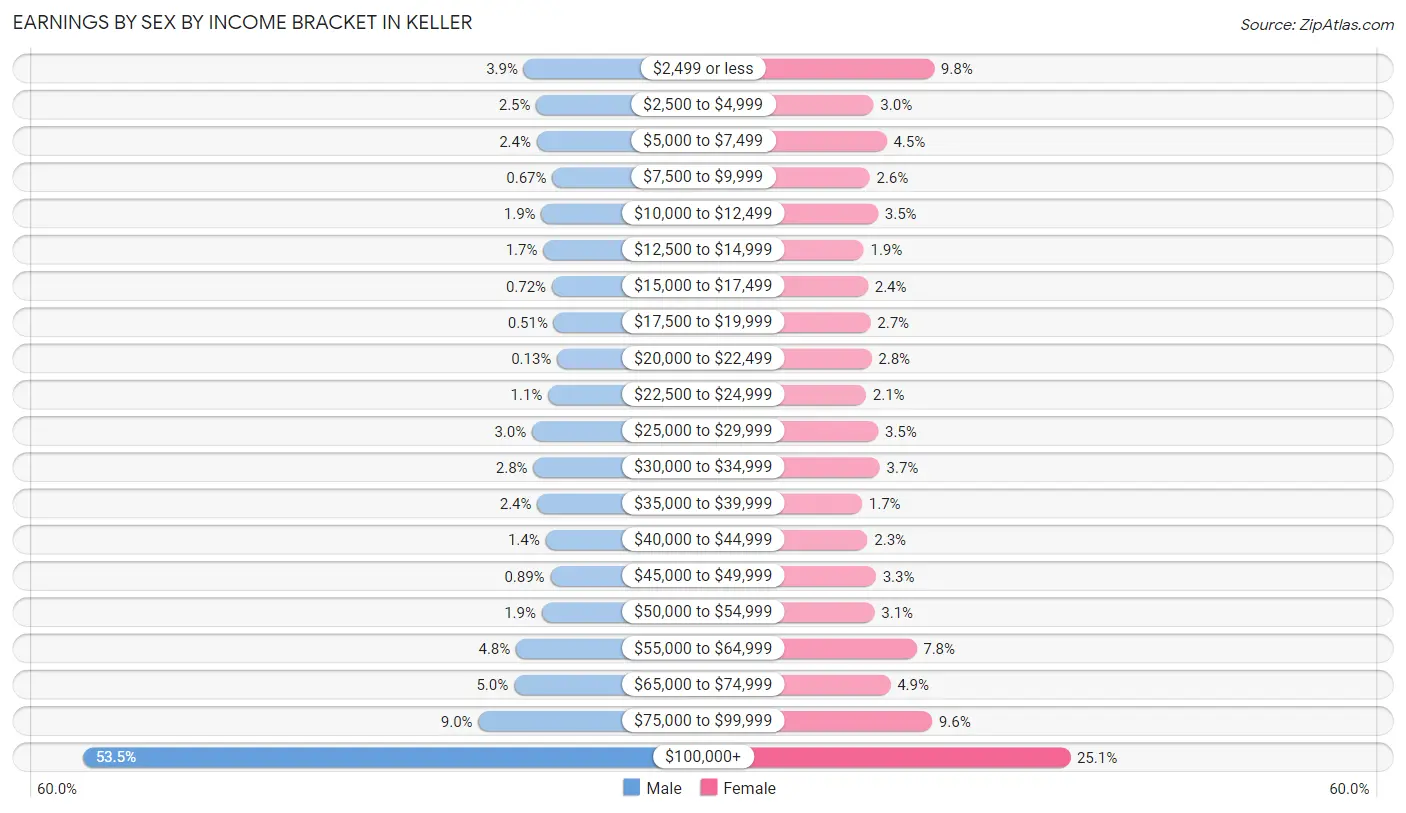
Earnings by Sex by Income Bracket in Keller
The most common earnings brackets in Keller are $100,000+ for men (7,467 | 53.5%) and $100,000+ for women (2,723 | 25.1%).
| Income | Male | Female |
| $2,499 or less | 542 (3.9%) | 1,063 (9.8%) |
| $2,500 to $4,999 | 345 (2.5%) | 324 (3.0%) |
| $5,000 to $7,499 | 338 (2.4%) | 484 (4.5%) |
| $7,500 to $9,999 | 94 (0.7%) | 278 (2.6%) |
| $10,000 to $12,499 | 265 (1.9%) | 379 (3.5%) |
| $12,500 to $14,999 | 236 (1.7%) | 204 (1.9%) |
| $15,000 to $17,499 | 101 (0.7%) | 256 (2.4%) |
| $17,500 to $19,999 | 71 (0.5%) | 288 (2.6%) |
| $20,000 to $22,499 | 18 (0.1%) | 300 (2.8%) |
| $22,500 to $24,999 | 159 (1.1%) | 232 (2.1%) |
| $25,000 to $29,999 | 413 (3.0%) | 381 (3.5%) |
| $30,000 to $34,999 | 391 (2.8%) | 401 (3.7%) |
| $35,000 to $39,999 | 330 (2.4%) | 183 (1.7%) |
| $40,000 to $44,999 | 201 (1.4%) | 251 (2.3%) |
| $45,000 to $49,999 | 124 (0.9%) | 353 (3.3%) |
| $50,000 to $54,999 | 260 (1.9%) | 337 (3.1%) |
| $55,000 to $64,999 | 663 (4.8%) | 848 (7.8%) |
| $65,000 to $74,999 | 696 (5.0%) | 530 (4.9%) |
| $75,000 to $99,999 | 1,254 (9.0%) | 1,039 (9.6%) |
| $100,000+ | 7,467 (53.5%) | 2,723 (25.1%) |
| Total | 13,968 (100.0%) | 10,854 (100.0%) |
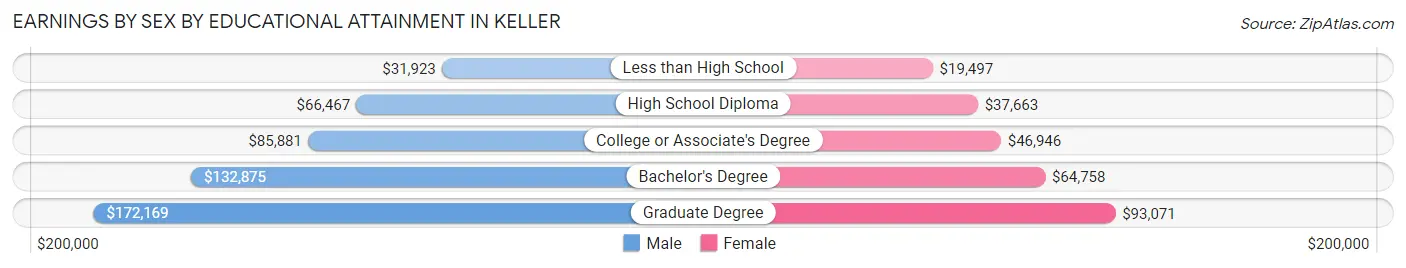
Earnings by Sex by Educational Attainment in Keller
Average earnings in Keller are $119,940 for men and $59,168 for women, a difference of 50.7%. Men with an educational attainment of graduate degree enjoy the highest average annual earnings of $172,169, while those with less than high school education earn the least with $31,923. Women with an educational attainment of graduate degree earn the most with the average annual earnings of $93,071, while those with less than high school education have the smallest earnings of $19,497.
| Educational Attainment | Male Income | Female Income |
| Less than High School | $31,923 | $19,497 |
| High School Diploma | $66,467 | $37,663 |
| College or Associate's Degree | $85,881 | $46,946 |
| Bachelor's Degree | $132,875 | $64,758 |
| Graduate Degree | $172,169 | $93,071 |
| Total | $119,940 | $59,168 |
Family Income in Keller
Family Income Brackets in Keller
According to the Keller family income data, there are 5,801 families falling into the $200,000+ income range, which is the most common income bracket and makes up 45.3% of all families.
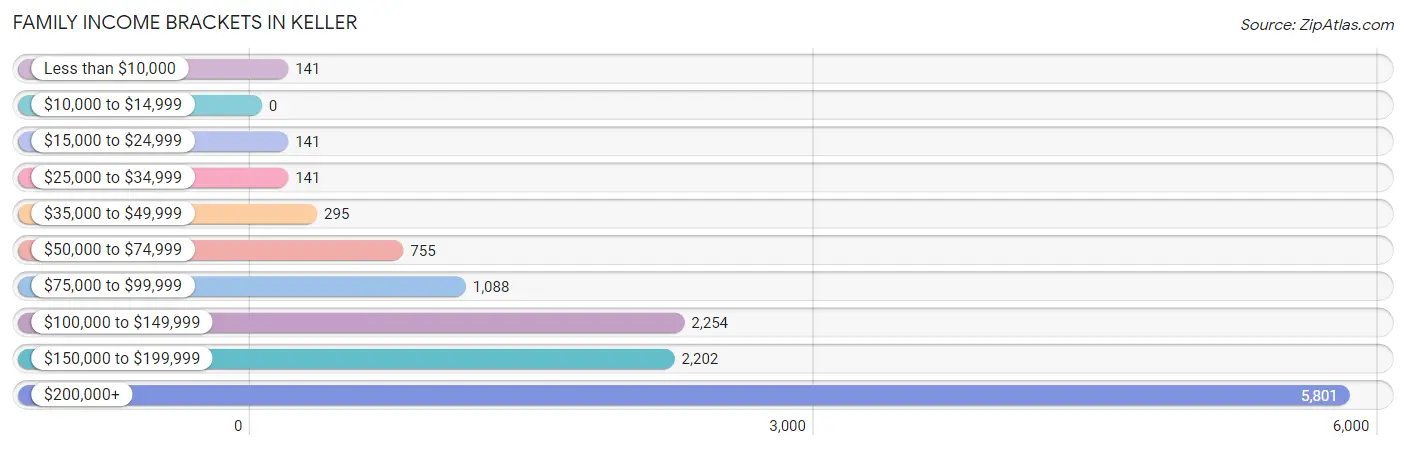
| Income Bracket | # Families | % Families |
| Less than $10,000 | 141 | 1.1% |
| $10,000 to $14,999 | 0 | 0.0% |
| $15,000 to $24,999 | 141 | 1.1% |
| $25,000 to $34,999 | 141 | 1.1% |
| $35,000 to $49,999 | 295 | 2.3% |
| $50,000 to $74,999 | 755 | 5.9% |
| $75,000 to $99,999 | 1,088 | 8.5% |
| $100,000 to $149,999 | 2,254 | 17.6% |
| $150,000 to $199,999 | 2,202 | 17.2% |
| $200,000+ | 5,801 | 45.3% |
Family Income by Famaliy Size in Keller
6-person families (197 | 1.5%) account for the highest median family income in Keller with $236,125 per family, while 2-person families (4,909 | 38.3%) have the highest median income of $72,580 per family member.
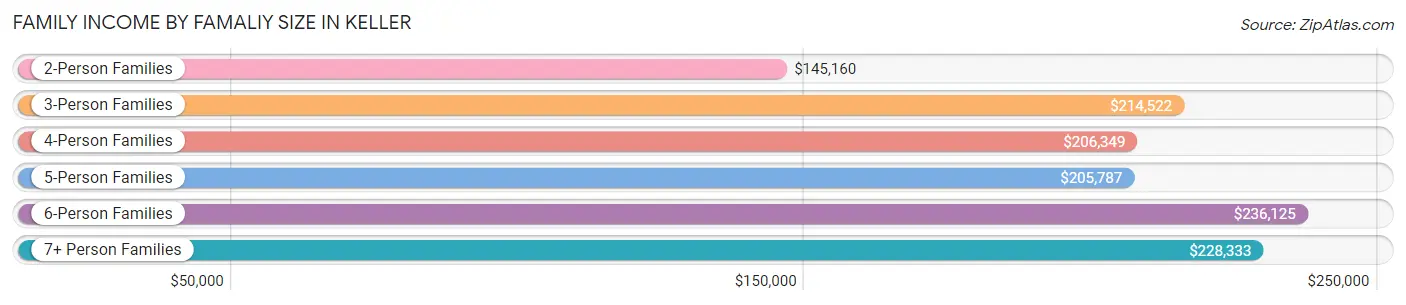
| Income Bracket | # Families | Median Income |
| 2-Person Families | 4,909 (38.3%) | $145,160 |
| 3-Person Families | 3,269 (25.5%) | $214,522 |
| 4-Person Families | 3,188 (24.9%) | $206,349 |
| 5-Person Families | 1,164 (9.1%) | $205,787 |
| 6-Person Families | 197 (1.5%) | $236,125 |
| 7+ Person Families | 78 (0.6%) | $228,333 |
| Total | 12,805 (100.0%) | $184,459 |
Family Income by Number of Earners in Keller
The median family income in Keller is $184,459, with families comprising 3+ earners (1,917) having the highest median family income of $239,063, while families with no earners (1,314) have the lowest median family income of $96,667, accounting for 15.0% and 10.3% of families, respectively.
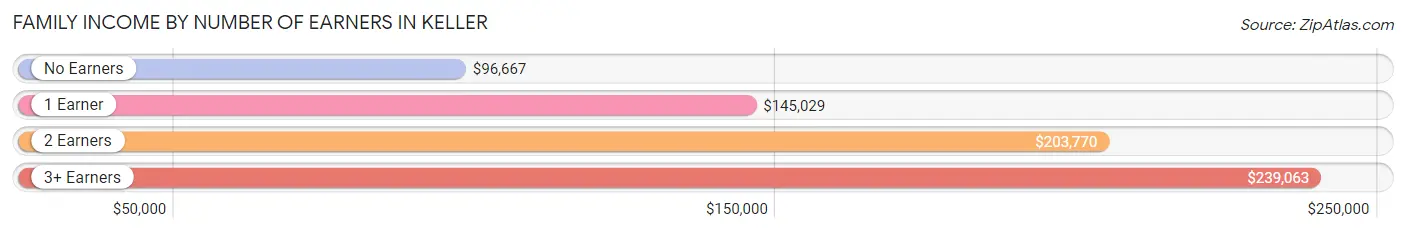
| Number of Earners | # Families | Median Income |
| No Earners | 1,314 (10.3%) | $96,667 |
| 1 Earner | 3,271 (25.5%) | $145,029 |
| 2 Earners | 6,303 (49.2%) | $203,770 |
| 3+ Earners | 1,917 (15.0%) | $239,063 |
| Total | 12,805 (100.0%) | $184,459 |
Household Income in Keller
Household Income Brackets in Keller
With 6,405 households falling in the category, the $200,000+ income range is the most frequent in Keller, accounting for 39.9% of all households. In contrast, only 128 households (0.8%) fall into the $10,000 to $14,999 income bracket, making it the least populous group.
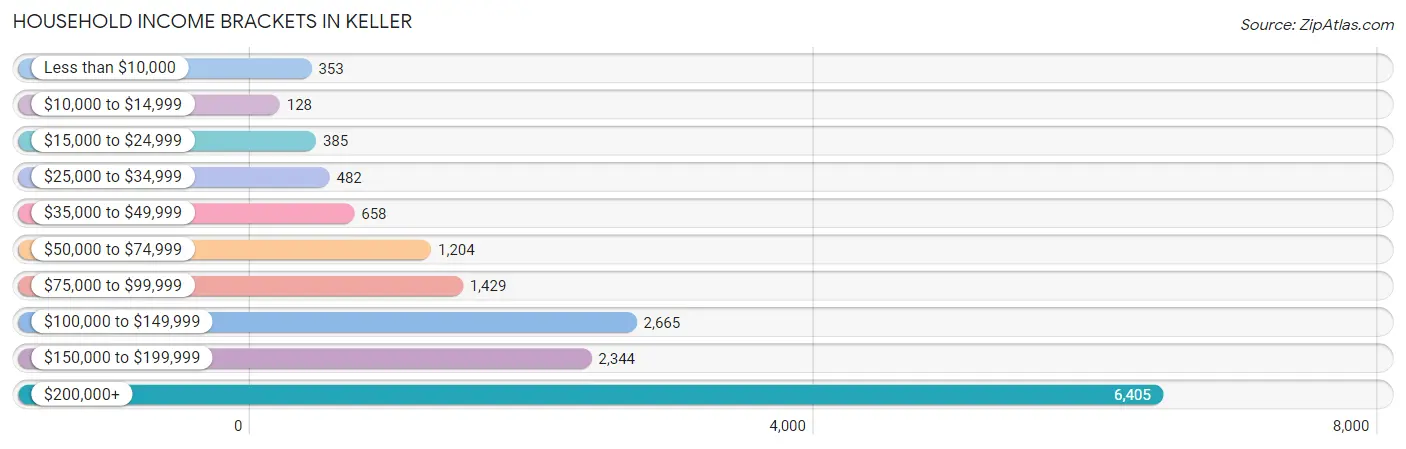
| Income Bracket | # Households | % Households |
| Less than $10,000 | 353 | 2.2% |
| $10,000 to $14,999 | 128 | 0.8% |
| $15,000 to $24,999 | 385 | 2.4% |
| $25,000 to $34,999 | 482 | 3.0% |
| $35,000 to $49,999 | 658 | 4.1% |
| $50,000 to $74,999 | 1,204 | 7.5% |
| $75,000 to $99,999 | 1,429 | 8.9% |
| $100,000 to $149,999 | 2,665 | 16.6% |
| $150,000 to $199,999 | 2,344 | 14.6% |
| $200,000+ | 6,405 | 39.9% |
Household Income by Householder Age in Keller
The median household income in Keller is $162,094, with the highest median household income of $202,717 found in the 45 to 64 years age bracket for the primary householder. A total of 7,827 households (48.8%) fall into this category. Meanwhile, the 15 to 24 years age bracket for the primary householder has the lowest median household income of $0, with 29 households (0.2%) in this group.
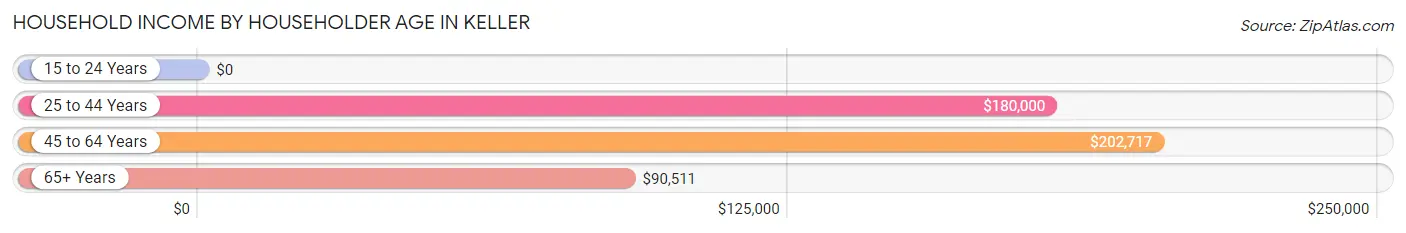
| Income Bracket | # Households | Median Income |
| 15 to 24 Years | 29 (0.2%) | $0 |
| 25 to 44 Years | 4,048 (25.2%) | $180,000 |
| 45 to 64 Years | 7,827 (48.8%) | $202,717 |
| 65+ Years | 4,148 (25.8%) | $90,511 |
| Total | 16,052 (100.0%) | $162,094 |
Poverty in Keller
Income Below Poverty by Sex and Age in Keller
With 2.6% poverty level for males and 3.6% for females among the residents of Keller, 5 year old males and 25 to 34 year old females are the most vulnerable to poverty, with 49 males (19.5%) and 135 females (8.4%) in their respective age groups living below the poverty level.
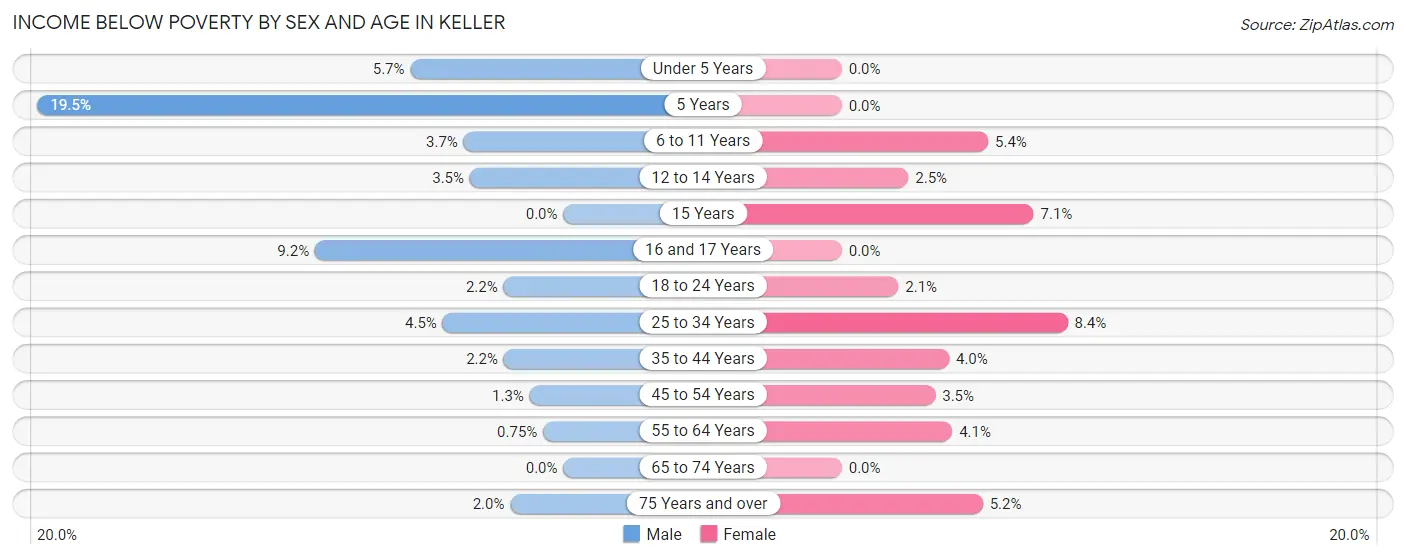
| Age Bracket | Male | Female |
| Under 5 Years | 62 (5.7%) | 0 (0.0%) |
| 5 Years | 49 (19.5%) | 0 (0.0%) |
| 6 to 11 Years | 88 (3.7%) | 107 (5.4%) |
| 12 to 14 Years | 36 (3.5%) | 22 (2.5%) |
| 15 Years | 0 (0.0%) | 46 (7.1%) |
| 16 and 17 Years | 86 (9.2%) | 0 (0.0%) |
| 18 to 24 Years | 32 (2.2%) | 26 (2.1%) |
| 25 to 34 Years | 77 (4.5%) | 135 (8.4%) |
| 35 to 44 Years | 62 (2.2%) | 111 (4.0%) |
| 45 to 54 Years | 47 (1.3%) | 138 (3.5%) |
| 55 to 64 Years | 26 (0.7%) | 141 (4.1%) |
| 65 to 74 Years | 0 (0.0%) | 0 (0.0%) |
| 75 Years and over | 24 (2.0%) | 83 (5.2%) |
| Total | 589 (2.6%) | 809 (3.6%) |
Income Above Poverty by Sex and Age in Keller
According to the poverty statistics in Keller, males aged 15 years and females aged under 5 years are the age groups that are most secure financially, with 100.0% of males and 100.0% of females in these age groups living above the poverty line.
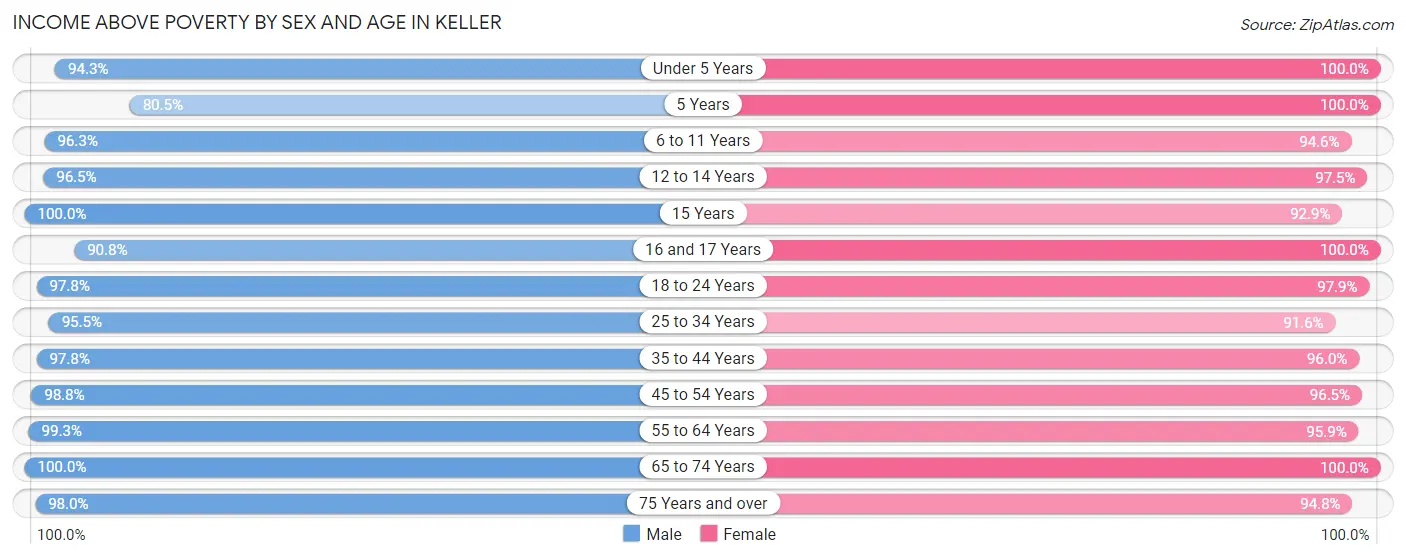
| Age Bracket | Male | Female |
| Under 5 Years | 1,030 (94.3%) | 1,123 (100.0%) |
| 5 Years | 202 (80.5%) | 270 (100.0%) |
| 6 to 11 Years | 2,291 (96.3%) | 1,863 (94.6%) |
| 12 to 14 Years | 1,001 (96.5%) | 867 (97.5%) |
| 15 Years | 433 (100.0%) | 600 (92.9%) |
| 16 and 17 Years | 847 (90.8%) | 896 (100.0%) |
| 18 to 24 Years | 1,407 (97.8%) | 1,214 (97.9%) |
| 25 to 34 Years | 1,640 (95.5%) | 1,476 (91.6%) |
| 35 to 44 Years | 2,742 (97.8%) | 2,678 (96.0%) |
| 45 to 54 Years | 3,722 (98.8%) | 3,835 (96.5%) |
| 55 to 64 Years | 3,440 (99.3%) | 3,301 (95.9%) |
| 65 to 74 Years | 1,941 (100.0%) | 1,993 (100.0%) |
| 75 Years and over | 1,192 (98.0%) | 1,505 (94.8%) |
| Total | 21,888 (97.4%) | 21,621 (96.4%) |
Income Below Poverty Among Married-Couple Families in Keller
The poverty statistics for married-couple families in Keller show that 0.7% or 86 of the total 11,606 families live below the poverty line. Families with 3 or 4 children have the highest poverty rate of 3.9%, comprising of 34 families. On the other hand, families with 5 or more children have the lowest poverty rate of 0.0%, which includes 0 families.
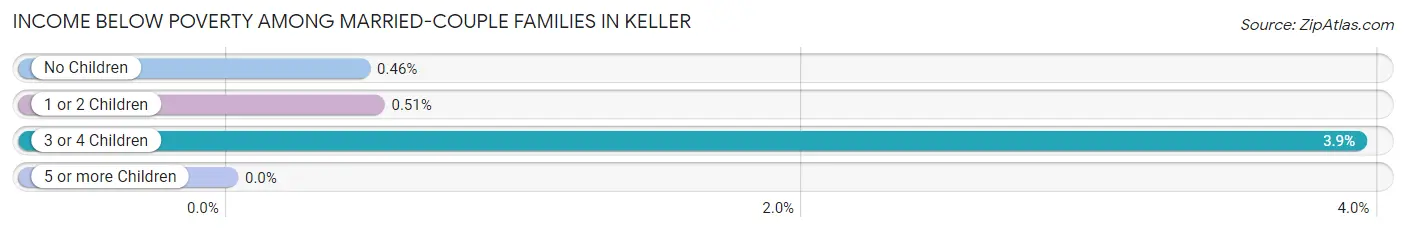
| Children | Above Poverty | Below Poverty |
| No Children | 6,000 (99.5%) | 28 (0.5%) |
| 1 or 2 Children | 4,652 (99.5%) | 24 (0.5%) |
| 3 or 4 Children | 832 (96.1%) | 34 (3.9%) |
| 5 or more Children | 36 (100.0%) | 0 (0.0%) |
| Total | 11,520 (99.3%) | 86 (0.7%) |
Income Below Poverty Among Single-Parent Households in Keller
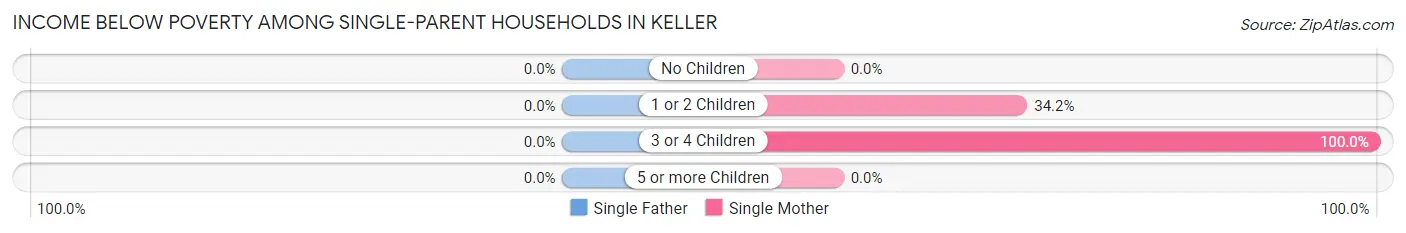
| Children | Single Father | Single Mother |
| No Children | 0 (0.0%) | 0 (0.0%) |
| 1 or 2 Children | 0 (0.0%) | 183 (34.2%) |
| 3 or 4 Children | 0 (0.0%) | 34 (100.0%) |
| 5 or more Children | 0 (0.0%) | 0 (0.0%) |
| Total | 0 (0.0%) | 217 (26.1%) |
Income Below Poverty Among Married-Couple vs Single-Parent Households in Keller
The poverty data for Keller shows that 86 of the married-couple family households (0.7%) and 217 of the single-parent households (18.1%) are living below the poverty level. Within the married-couple family households, those with 3 or 4 children have the highest poverty rate, with 34 households (3.9%) falling below the poverty line. Among the single-parent households, those with 3 or 4 children have the highest poverty rate, with 34 household (25.8%) living below poverty.
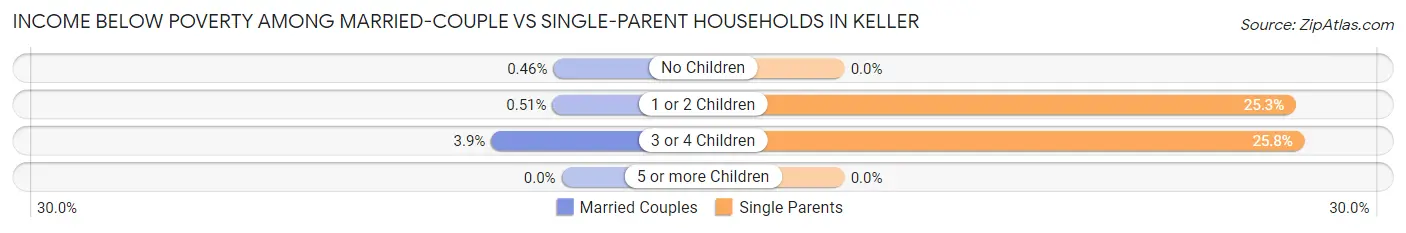
| Children | Married-Couple Families | Single-Parent Households |
| No Children | 28 (0.5%) | 0 (0.0%) |
| 1 or 2 Children | 24 (0.5%) | 183 (25.3%) |
| 3 or 4 Children | 34 (3.9%) | 34 (25.8%) |
| 5 or more Children | 0 (0.0%) | 0 (0.0%) |
| Total | 86 (0.7%) | 217 (18.1%) |
Race in Keller
The most populous races in Keller are White / Caucasian (38,215 | 84.3%), Hispanic or Latino (4,530 | 10.0%), and Two or more Races (2,683 | 5.9%).
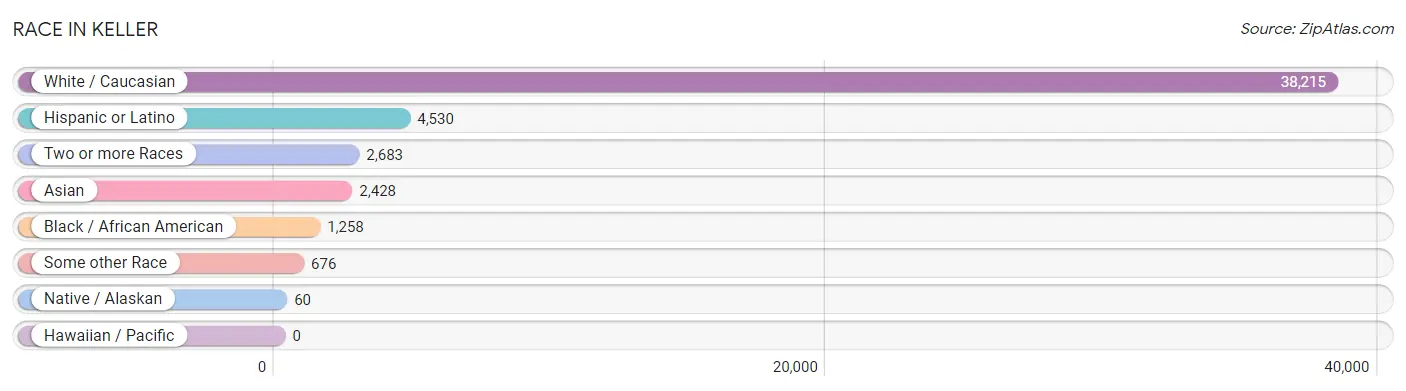
| Race | # Population | % Population |
| Asian | 2,428 | 5.4% |
| Black / African American | 1,258 | 2.8% |
| Hawaiian / Pacific | 0 | 0.0% |
| Hispanic or Latino | 4,530 | 10.0% |
| Native / Alaskan | 60 | 0.1% |
| White / Caucasian | 38,215 | 84.3% |
| Two or more Races | 2,683 | 5.9% |
| Some other Race | 676 | 1.5% |
| Total | 45,320 | 100.0% |
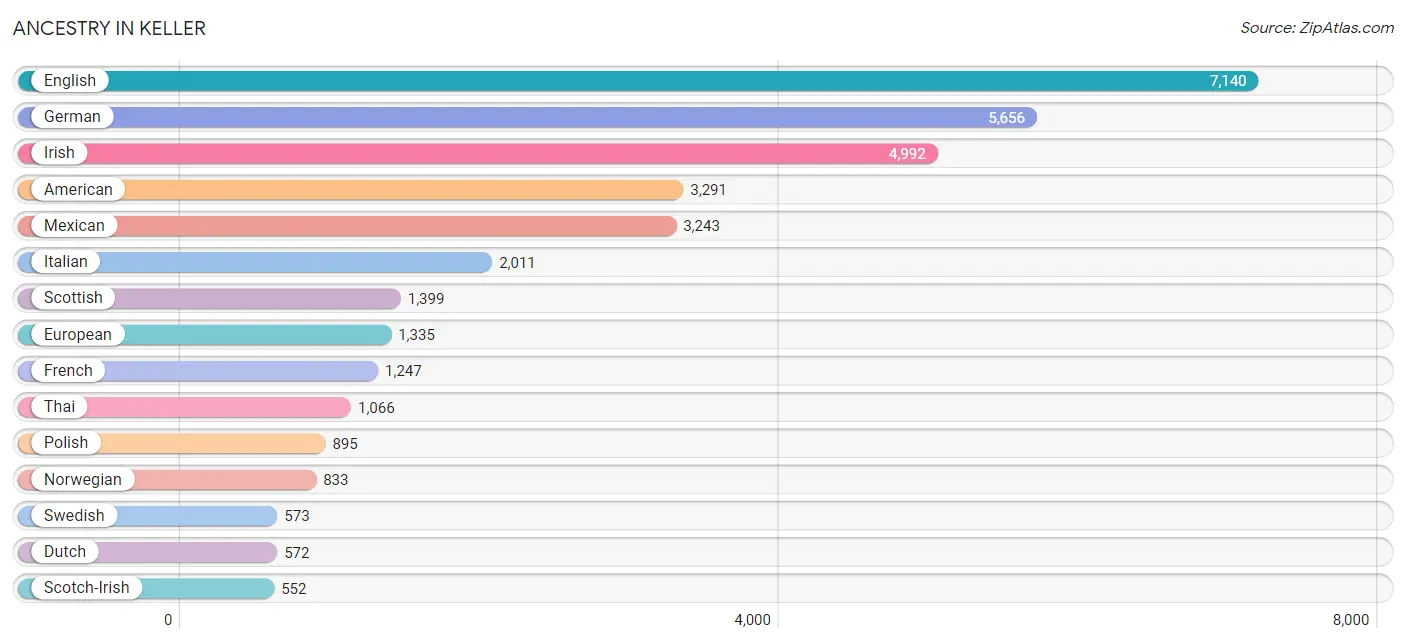
Ancestry in Keller
The most populous ancestries reported in Keller are English (7,140 | 15.8%), German (5,656 | 12.5%), Irish (4,992 | 11.0%), American (3,291 | 7.3%), and Mexican (3,243 | 7.2%), together accounting for 53.7% of all Keller residents.
| Ancestry | # Population | % Population |
| African | 48 | 0.1% |
| Albanian | 244 | 0.5% |
| American | 3,291 | 7.3% |
| Arab | 441 | 1.0% |
| Argentinean | 41 | 0.1% |
| Armenian | 29 | 0.1% |
| Austrian | 90 | 0.2% |
| Basque | 31 | 0.1% |
| Belgian | 62 | 0.1% |
| Bhutanese | 89 | 0.2% |
| Blackfeet | 40 | 0.1% |
| Brazilian | 108 | 0.2% |
| British | 445 | 1.0% |
| Burmese | 314 | 0.7% |
| Cajun | 31 | 0.1% |
| Canadian | 188 | 0.4% |
| Central American | 279 | 0.6% |
| Central American Indian | 21 | 0.1% |
| Cherokee | 147 | 0.3% |
| Chilean | 8 | 0.0% |
| Choctaw | 20 | 0.0% |
| Colombian | 22 | 0.1% |
| Creek | 6 | 0.0% |
| Croatian | 103 | 0.2% |
| Crow | 6 | 0.0% |
| Cuban | 368 | 0.8% |
| Czech | 340 | 0.7% |
| Czechoslovakian | 8 | 0.0% |
| Danish | 195 | 0.4% |
| Delaware | 56 | 0.1% |
| Dutch | 572 | 1.3% |
| Dutch West Indian | 18 | 0.0% |
| Eastern European | 36 | 0.1% |
| Ecuadorian | 51 | 0.1% |
| Egyptian | 24 | 0.1% |
| English | 7,140 | 15.8% |
| Ethiopian | 15 | 0.0% |
| European | 1,335 | 2.9% |
| Finnish | 98 | 0.2% |
| French | 1,247 | 2.8% |
| French Canadian | 281 | 0.6% |
| German | 5,656 | 12.5% |
| Greek | 85 | 0.2% |
| Guamanian / Chamorro | 8 | 0.0% |
| Guatemalan | 113 | 0.3% |
| Hungarian | 80 | 0.2% |
| Indian (Asian) | 402 | 0.9% |
| Iranian | 284 | 0.6% |
| Irish | 4,992 | 11.0% |
| Italian | 2,011 | 4.4% |
| Jamaican | 60 | 0.1% |
| Jordanian | 25 | 0.1% |
| Kenyan | 104 | 0.2% |
| Korean | 362 | 0.8% |
| Laotian | 23 | 0.1% |
| Latvian | 35 | 0.1% |
| Lebanese | 141 | 0.3% |
| Lithuanian | 56 | 0.1% |
| Malaysian | 39 | 0.1% |
| Maltese | 15 | 0.0% |
| Mexican | 3,243 | 7.2% |
| Mexican American Indian | 21 | 0.1% |
| Moroccan | 42 | 0.1% |
| Nigerian | 9 | 0.0% |
| Northern European | 67 | 0.2% |
| Norwegian | 833 | 1.8% |
| Osage | 10 | 0.0% |
| Pakistani | 41 | 0.1% |
| Palestinian | 43 | 0.1% |
| Panamanian | 33 | 0.1% |
| Peruvian | 80 | 0.2% |
| Polish | 895 | 2.0% |
| Portuguese | 129 | 0.3% |
| Puerto Rican | 135 | 0.3% |
| Romanian | 61 | 0.1% |
| Russian | 238 | 0.5% |
| Salvadoran | 133 | 0.3% |
| Scandinavian | 219 | 0.5% |
| Scotch-Irish | 552 | 1.2% |
| Scottish | 1,399 | 3.1% |
| Seminole | 4 | 0.0% |
| Slavic | 14 | 0.0% |
| Slovak | 11 | 0.0% |
| Slovene | 36 | 0.1% |
| South American | 202 | 0.4% |
| Spaniard | 196 | 0.4% |
| Spanish | 62 | 0.1% |
| Sri Lankan | 423 | 0.9% |
| Subsaharan African | 470 | 1.0% |
| Swedish | 573 | 1.3% |
| Swiss | 140 | 0.3% |
| Thai | 1,066 | 2.4% |
| Turkish | 21 | 0.1% |
| Ukrainian | 201 | 0.4% |
| Welsh | 143 | 0.3% | View All 95 Rows |
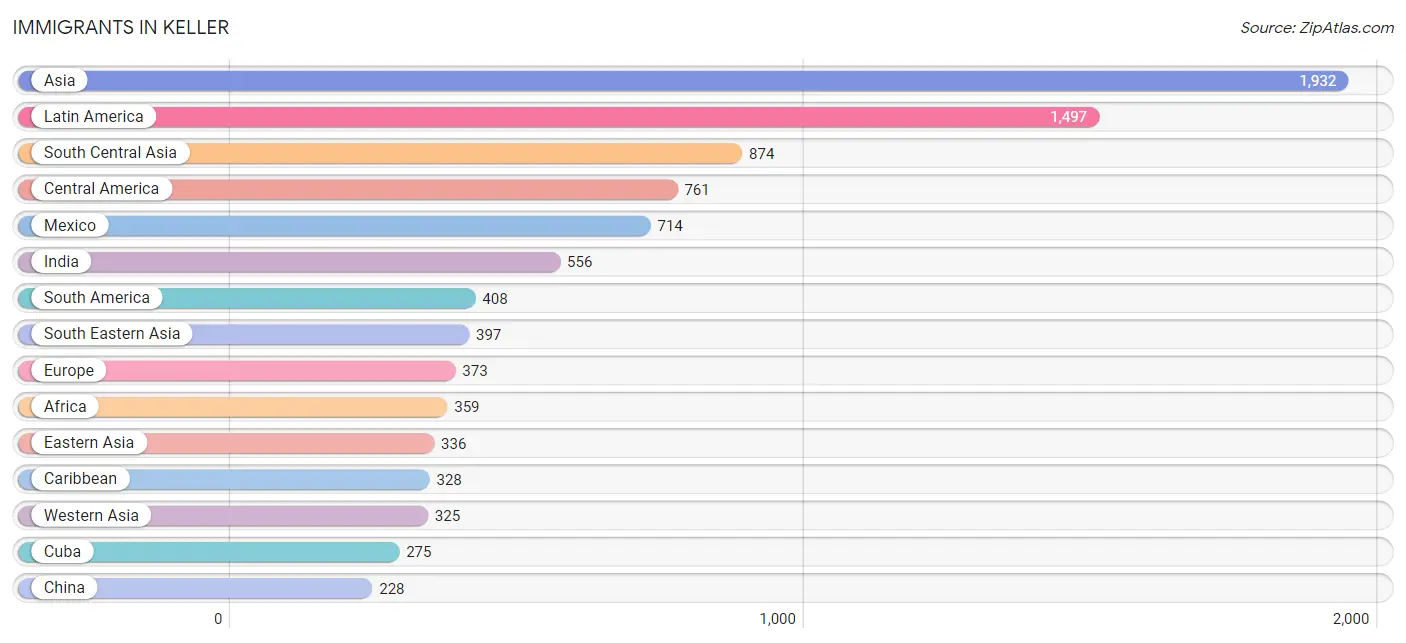
Immigrants in Keller
The most numerous immigrant groups reported in Keller came from Asia (1,932 | 4.3%), Latin America (1,497 | 3.3%), South Central Asia (874 | 1.9%), Central America (761 | 1.7%), and Mexico (714 | 1.6%), together accounting for 12.8% of all Keller residents.
| Immigration Origin | # Population | % Population |
| Africa | 359 | 0.8% |
| Argentina | 10 | 0.0% |
| Asia | 1,932 | 4.3% |
| Brazil | 212 | 0.5% |
| Cameroon | 54 | 0.1% |
| Canada | 198 | 0.4% |
| Caribbean | 328 | 0.7% |
| Central America | 761 | 1.7% |
| Chile | 8 | 0.0% |
| China | 228 | 0.5% |
| Colombia | 22 | 0.1% |
| Congo | 11 | 0.0% |
| Cuba | 275 | 0.6% |
| Eastern Africa | 180 | 0.4% |
| Eastern Asia | 336 | 0.7% |
| Eastern Europe | 75 | 0.2% |
| Ecuador | 40 | 0.1% |
| Egypt | 45 | 0.1% |
| El Salvador | 29 | 0.1% |
| Eritrea | 15 | 0.0% |
| Europe | 373 | 0.8% |
| France | 22 | 0.1% |
| Germany | 32 | 0.1% |
| Greece | 19 | 0.0% |
| Guatemala | 12 | 0.0% |
| Guyana | 36 | 0.1% |
| India | 556 | 1.2% |
| Indonesia | 15 | 0.0% |
| Iran | 188 | 0.4% |
| Israel | 123 | 0.3% |
| Italy | 8 | 0.0% |
| Jamaica | 53 | 0.1% |
| Japan | 55 | 0.1% |
| Jordan | 25 | 0.1% |
| Kenya | 78 | 0.2% |
| Korea | 53 | 0.1% |
| Laos | 23 | 0.1% |
| Latin America | 1,497 | 3.3% |
| Latvia | 55 | 0.1% |
| Lebanon | 16 | 0.0% |
| Mexico | 714 | 1.6% |
| Middle Africa | 65 | 0.1% |
| Morocco | 13 | 0.0% |
| Nepal | 37 | 0.1% |
| Netherlands | 41 | 0.1% |
| Nigeria | 20 | 0.0% |
| Northern Africa | 58 | 0.1% |
| Northern Europe | 176 | 0.4% |
| Oceania | 18 | 0.0% |
| Pakistan | 93 | 0.2% |
| Panama | 6 | 0.0% |
| Peru | 80 | 0.2% |
| Philippines | 123 | 0.3% |
| Romania | 9 | 0.0% |
| Russia | 11 | 0.0% |
| South Africa | 36 | 0.1% |
| South America | 408 | 0.9% |
| South Central Asia | 874 | 1.9% |
| South Eastern Asia | 397 | 0.9% |
| Southern Europe | 27 | 0.1% |
| Sweden | 40 | 0.1% |
| Syria | 127 | 0.3% |
| Taiwan | 51 | 0.1% |
| Thailand | 41 | 0.1% |
| Turkey | 16 | 0.0% |
| Vietnam | 195 | 0.4% |
| Western Africa | 20 | 0.0% |
| Western Asia | 325 | 0.7% |
| Western Europe | 95 | 0.2% |
| Zimbabwe | 13 | 0.0% | View All 70 Rows |
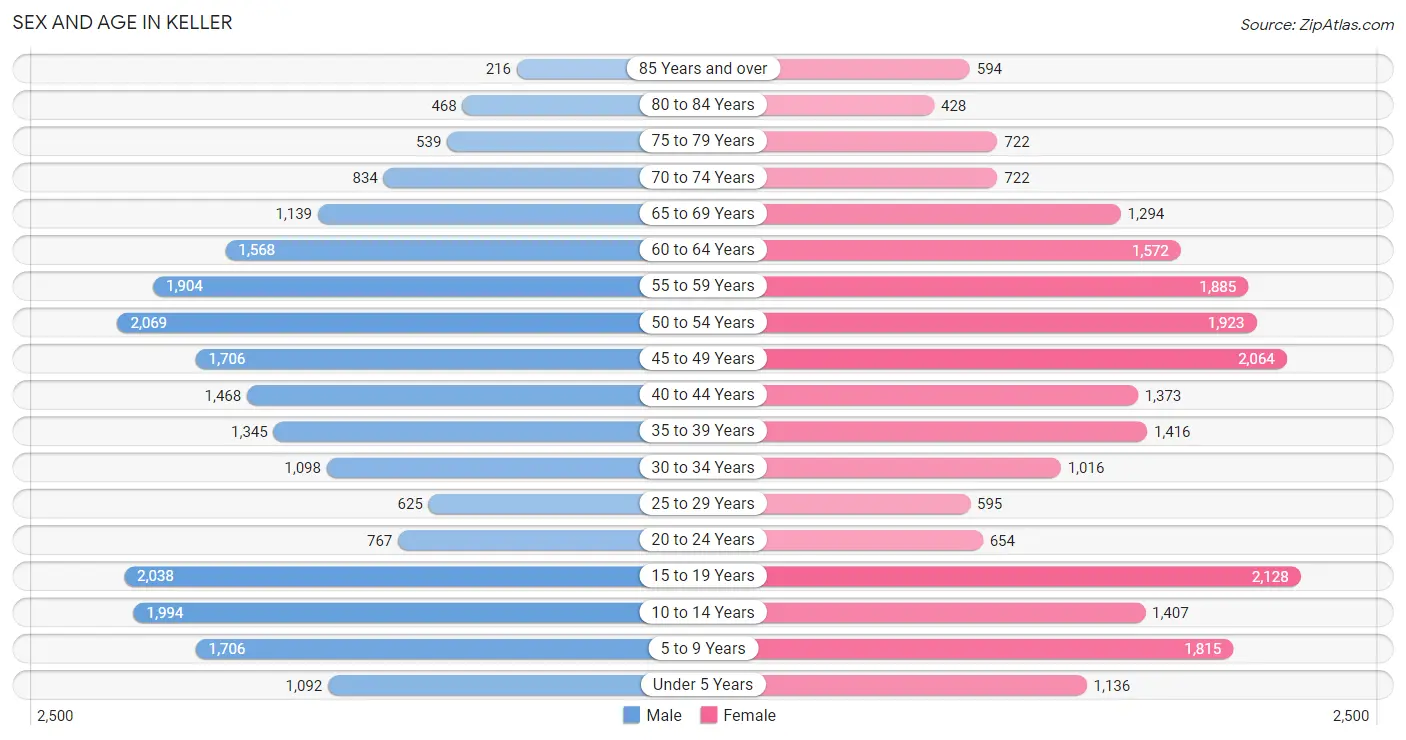
Sex and Age in Keller
Sex and Age in Keller
The most populous age groups in Keller are 50 to 54 Years (2,069 | 9.2%) for men and 15 to 19 Years (2,128 | 9.4%) for women.
| Age Bracket | Male | Female |
| Under 5 Years | 1,092 (4.8%) | 1,136 (5.0%) |
| 5 to 9 Years | 1,706 (7.6%) | 1,815 (8.0%) |
| 10 to 14 Years | 1,994 (8.8%) | 1,407 (6.2%) |
| 15 to 19 Years | 2,038 (9.0%) | 2,128 (9.4%) |
| 20 to 24 Years | 767 (3.4%) | 654 (2.9%) |
| 25 to 29 Years | 625 (2.8%) | 595 (2.6%) |
| 30 to 34 Years | 1,098 (4.9%) | 1,016 (4.5%) |
| 35 to 39 Years | 1,345 (6.0%) | 1,416 (6.2%) |
| 40 to 44 Years | 1,468 (6.5%) | 1,373 (6.0%) |
| 45 to 49 Years | 1,706 (7.6%) | 2,064 (9.1%) |
| 50 to 54 Years | 2,069 (9.2%) | 1,923 (8.5%) |
| 55 to 59 Years | 1,904 (8.4%) | 1,885 (8.3%) |
| 60 to 64 Years | 1,568 (7.0%) | 1,572 (6.9%) |
| 65 to 69 Years | 1,139 (5.1%) | 1,294 (5.7%) |
| 70 to 74 Years | 834 (3.7%) | 722 (3.2%) |
| 75 to 79 Years | 539 (2.4%) | 722 (3.2%) |
| 80 to 84 Years | 468 (2.1%) | 428 (1.9%) |
| 85 Years and over | 216 (1.0%) | 594 (2.6%) |
| Total | 22,576 (100.0%) | 22,744 (100.0%) |
Families and Households in Keller
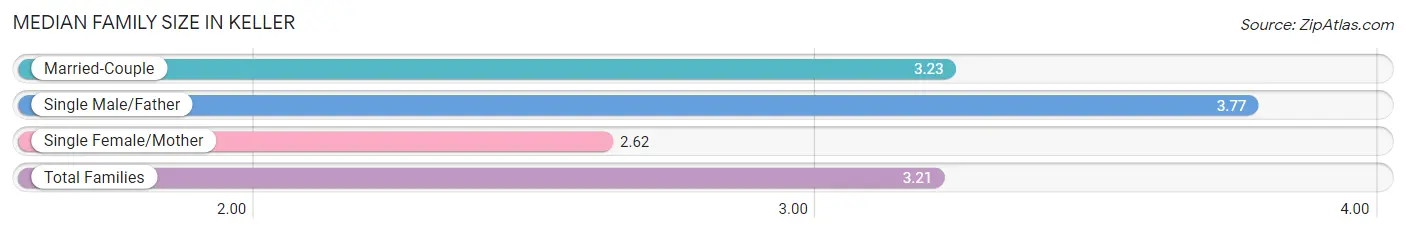
Median Family Size in Keller
The median family size in Keller is 3.21 persons per family, with single male/father families (366 | 2.9%) accounting for the largest median family size of 3.77 persons per family. On the other hand, single female/mother families (833 | 6.5%) represent the smallest median family size with 2.62 persons per family.
| Family Type | # Families | Family Size |
| Married-Couple | 11,606 (90.6%) | 3.23 |
| Single Male/Father | 366 (2.9%) | 3.77 |
| Single Female/Mother | 833 (6.5%) | 2.62 |
| Total Families | 12,805 (100.0%) | 3.21 |
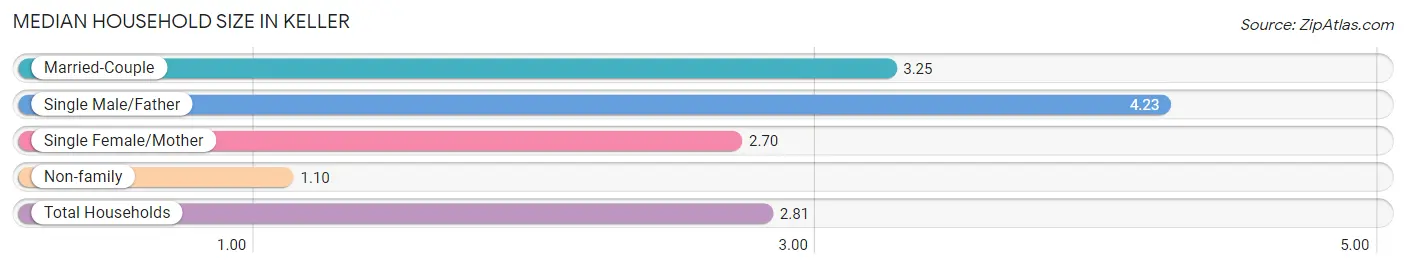
Median Household Size in Keller
The median household size in Keller is 2.81 persons per household, with single male/father households (366 | 2.3%) accounting for the largest median household size of 4.23 persons per household. non-family households (3,247 | 20.2%) represent the smallest median household size with 1.10 persons per household.
| Household Type | # Households | Household Size |
| Married-Couple | 11,606 (72.3%) | 3.25 |
| Single Male/Father | 366 (2.3%) | 4.23 |
| Single Female/Mother | 833 (5.2%) | 2.70 |
| Non-family | 3,247 (20.2%) | 1.10 |
| Total Households | 16,052 (100.0%) | 2.81 |
Household Size by Marriage Status in Keller
Out of a total of 16,052 households in Keller, 12,805 (79.8%) are family households, while 3,247 (20.2%) are nonfamily households. The most numerous type of family households are 2-person households, comprising 4,853, and the most common type of nonfamily households are 1-person households, comprising 3,046.
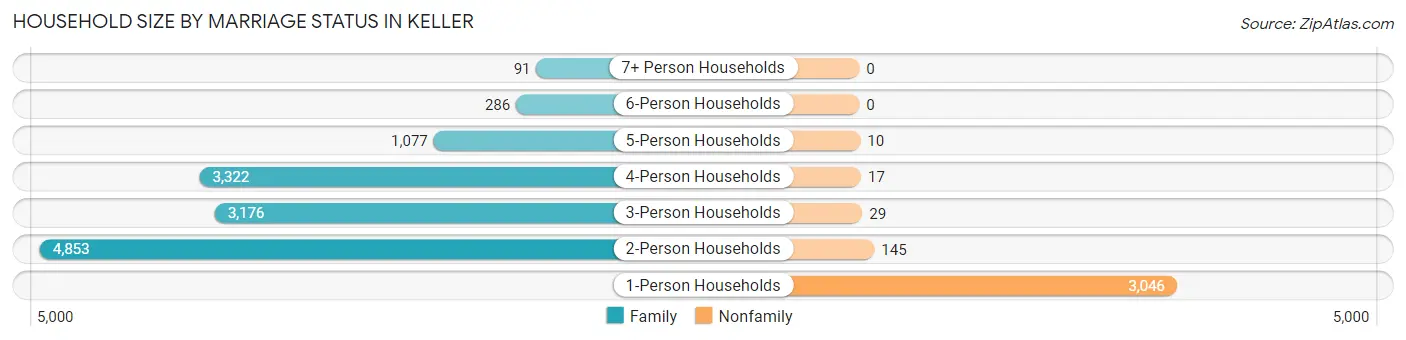
| Household Size | Family Households | Nonfamily Households |
| 1-Person Households | - | 3,046 (19.0%) |
| 2-Person Households | 4,853 (30.2%) | 145 (0.9%) |
| 3-Person Households | 3,176 (19.8%) | 29 (0.2%) |
| 4-Person Households | 3,322 (20.7%) | 17 (0.1%) |
| 5-Person Households | 1,077 (6.7%) | 10 (0.1%) |
| 6-Person Households | 286 (1.8%) | 0 (0.0%) |
| 7+ Person Households | 91 (0.6%) | 0 (0.0%) |
| Total | 12,805 (79.8%) | 3,247 (20.2%) |
Female Fertility in Keller
Fertility by Age in Keller
Average fertility rate in Keller is 47.0 births per 1,000 women. Women in the age bracket of 20 to 34 years have the highest fertility rate with 77.0 births per 1,000 women. Women in the age bracket of 35 to 50 years acount for 52.3% of all women with births.
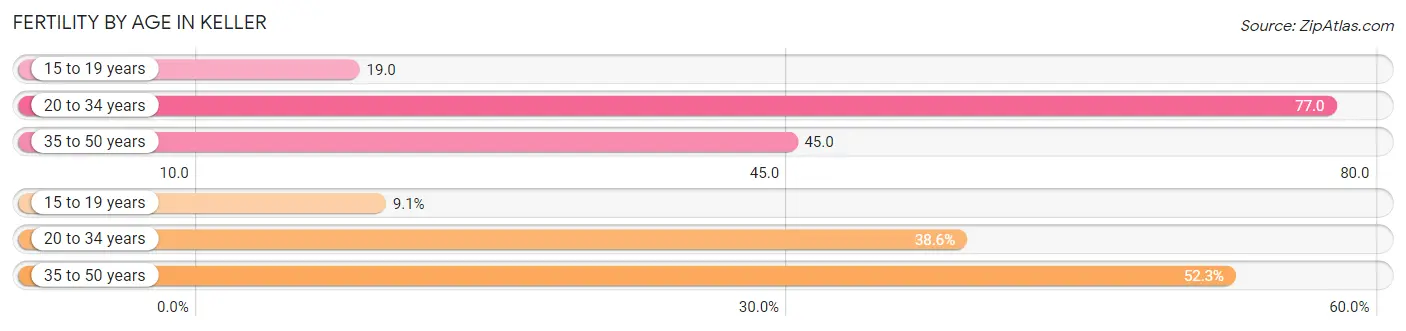
| Age Bracket | Women with Births | Births / 1,000 Women |
| 15 to 19 years | 41 (9.0%) | 19.0 |
| 20 to 34 years | 175 (38.6%) | 77.0 |
| 35 to 50 years | 237 (52.3%) | 45.0 |
| Total | 453 (100.0%) | 47.0 |
Fertility by Age by Marriage Status in Keller
74.6% of women with births (453) in Keller are married. The highest percentage of unmarried women with births falls into 15 to 19 years age bracket with 100.0% of them unmarried at the time of birth, while the lowest percentage of unmarried women with births belong to 20 to 34 years age bracket with 0.0% of them unmarried.
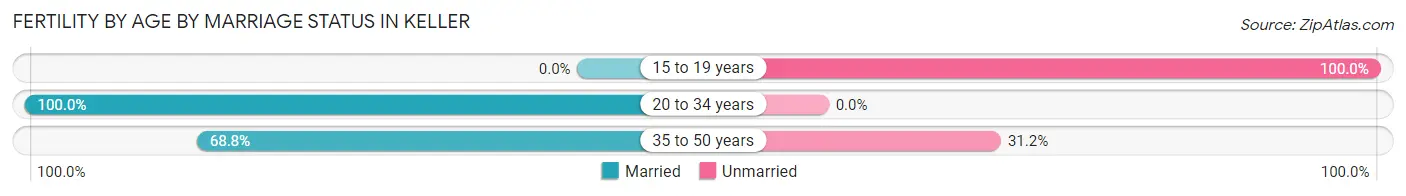
| Age Bracket | Married | Unmarried |
| 15 to 19 years | 0 (0.0%) | 41 (100.0%) |
| 20 to 34 years | 175 (100.0%) | 0 (0.0%) |
| 35 to 50 years | 163 (68.8%) | 74 (31.2%) |
| Total | 338 (74.6%) | 115 (25.4%) |
Fertility by Education in Keller
Average fertility rate in Keller is 47.0 births per 1,000 women. Women with the education attainment of high school diploma have the highest fertility rate of 100.0 births per 1,000 women, while women with the education attainment of less than high school have the lowest fertility at 21.0 births per 1,000 women. Women with the education attainment of bachelor's degree represent 47.5% of all women with births.
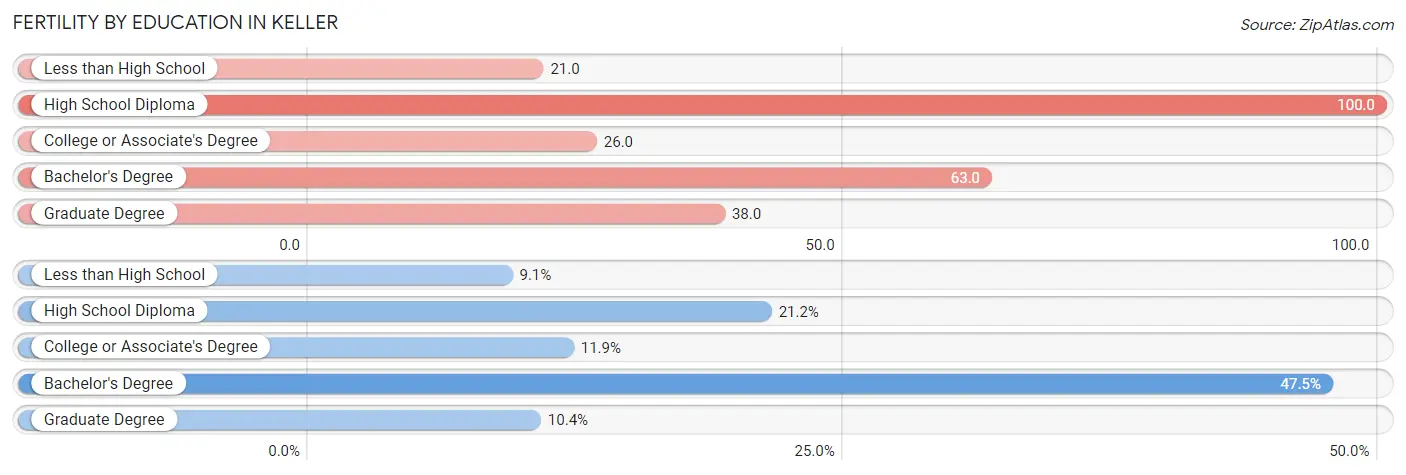
| Educational Attainment | Women with Births | Births / 1,000 Women |
| Less than High School | 41 (9.0%) | 21.0 |
| High School Diploma | 96 (21.2%) | 100.0 |
| College or Associate's Degree | 54 (11.9%) | 26.0 |
| Bachelor's Degree | 215 (47.5%) | 63.0 |
| Graduate Degree | 47 (10.4%) | 38.0 |
| Total | 453 (100.0%) | 47.0 |
Fertility by Education by Marriage Status in Keller
25.4% of women with births in Keller are unmarried. Women with the educational attainment of college or associate's degree are most likely to be married with 100.0% of them married at childbirth, while women with the educational attainment of less than high school are least likely to be married with 100.0% of them unmarried at childbirth.
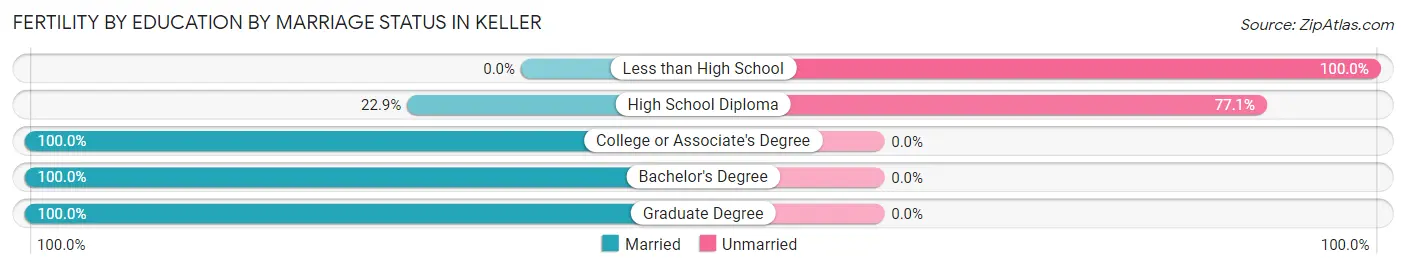
| Educational Attainment | Married | Unmarried |
| Less than High School | 0 (0.0%) | 41 (100.0%) |
| High School Diploma | 22 (22.9%) | 74 (77.1%) |
| College or Associate's Degree | 54 (100.0%) | 0 (0.0%) |
| Bachelor's Degree | 215 (100.0%) | 0 (0.0%) |
| Graduate Degree | 47 (100.0%) | 0 (0.0%) |
| Total | 338 (74.6%) | 115 (25.4%) |
Employment Characteristics in Keller
Employment by Class of Employer in Keller
Among the 22,447 employed individuals in Keller, private company employees (16,192 | 72.1%), self-employed (incorporated) (1,560 | 7.0%), and local government employees (1,529 | 6.8%) make up the most common classes of employment.
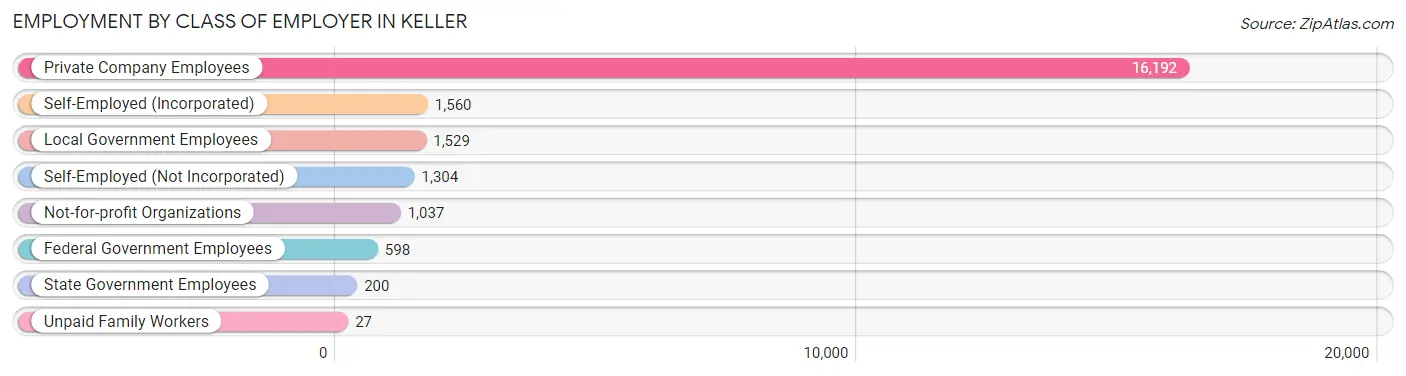
| Employer Class | # Employees | % Employees |
| Private Company Employees | 16,192 | 72.1% |
| Self-Employed (Incorporated) | 1,560 | 7.0% |
| Self-Employed (Not Incorporated) | 1,304 | 5.8% |
| Not-for-profit Organizations | 1,037 | 4.6% |
| Local Government Employees | 1,529 | 6.8% |
| State Government Employees | 200 | 0.9% |
| Federal Government Employees | 598 | 2.7% |
| Unpaid Family Workers | 27 | 0.1% |
| Total | 22,447 | 100.0% |
Employment Status by Age in Keller
According to the labor force statistics for Keller, out of the total population over 16 years of age (35,091), 66.5% or 23,336 individuals are in the labor force, with 3.0% or 700 of them unemployed. The age group with the highest labor force participation rate is 45 to 54 years, with 86.3% or 6,699 individuals in the labor force. Within the labor force, the 20 to 24 years age range has the highest percentage of unemployed individuals, with 11.1% or 107 of them being unemployed.
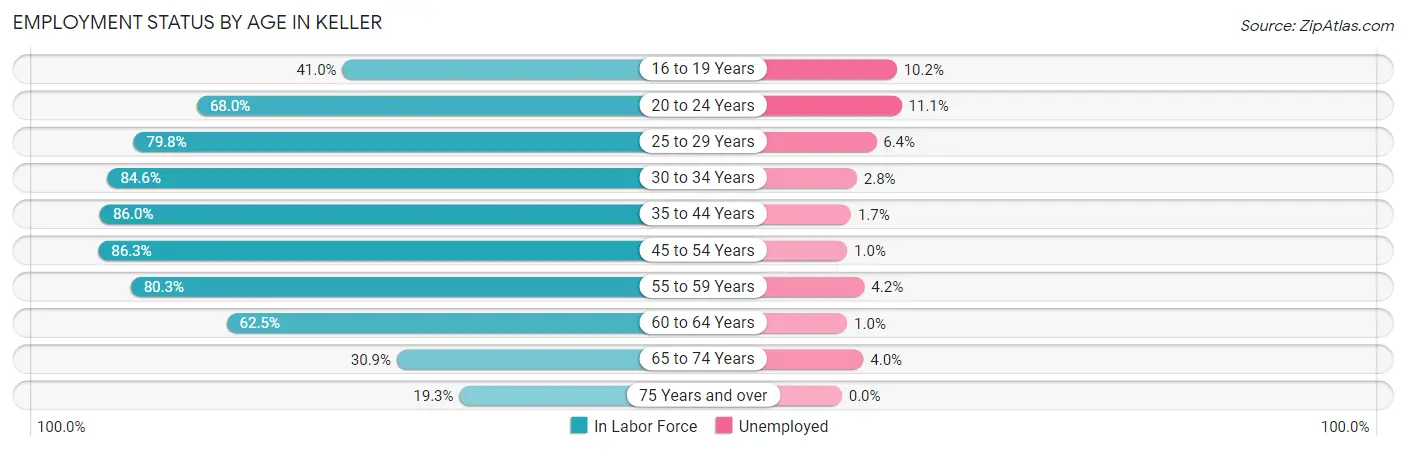
| Age Bracket | In Labor Force | Unemployed |
| 16 to 19 Years | 1,266 (41.0%) | 129 (10.2%) |
| 20 to 24 Years | 966 (68.0%) | 107 (11.1%) |
| 25 to 29 Years | 974 (79.8%) | 62 (6.4%) |
| 30 to 34 Years | 1,788 (84.6%) | 50 (2.8%) |
| 35 to 44 Years | 4,818 (86.0%) | 82 (1.7%) |
| 45 to 54 Years | 6,699 (86.3%) | 67 (1.0%) |
| 55 to 59 Years | 3,043 (80.3%) | 128 (4.2%) |
| 60 to 64 Years | 1,962 (62.5%) | 20 (1.0%) |
| 65 to 74 Years | 1,233 (30.9%) | 49 (4.0%) |
| 75 Years and over | 573 (19.3%) | 0 (0.0%) |
| Total | 23,336 (66.5%) | 700 (3.0%) |
Employment Status by Educational Attainment in Keller
According to labor force statistics for Keller, 81.6% of individuals (19,280) out of the total population between 25 and 64 years of age (23,627) are in the labor force, with 2.1% or 405 of them being unemployed. The group with the highest labor force participation rate are those with the educational attainment of bachelor's degree or higher, with 84.9% or 12,787 individuals in the labor force. Within the labor force, individuals with high school diploma education have the highest percentage of unemployment, with 2.9% or 52 of them being unemployed.
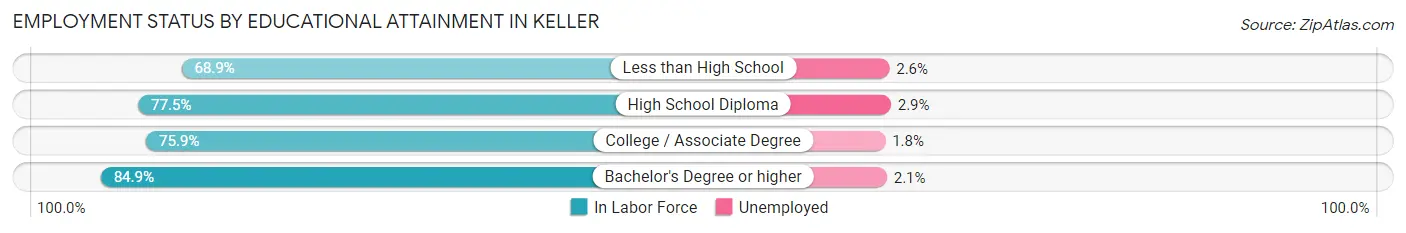
| Educational Attainment | In Labor Force | Unemployed |
| Less than High School | 341 (68.9%) | 13 (2.6%) |
| High School Diploma | 1,787 (77.5%) | 67 (2.9%) |
| College / Associate Degree | 4,376 (75.9%) | 104 (1.8%) |
| Bachelor's Degree or higher | 12,787 (84.9%) | 316 (2.1%) |
| Total | 19,280 (81.6%) | 496 (2.1%) |
Employment Occupations by Sex in Keller
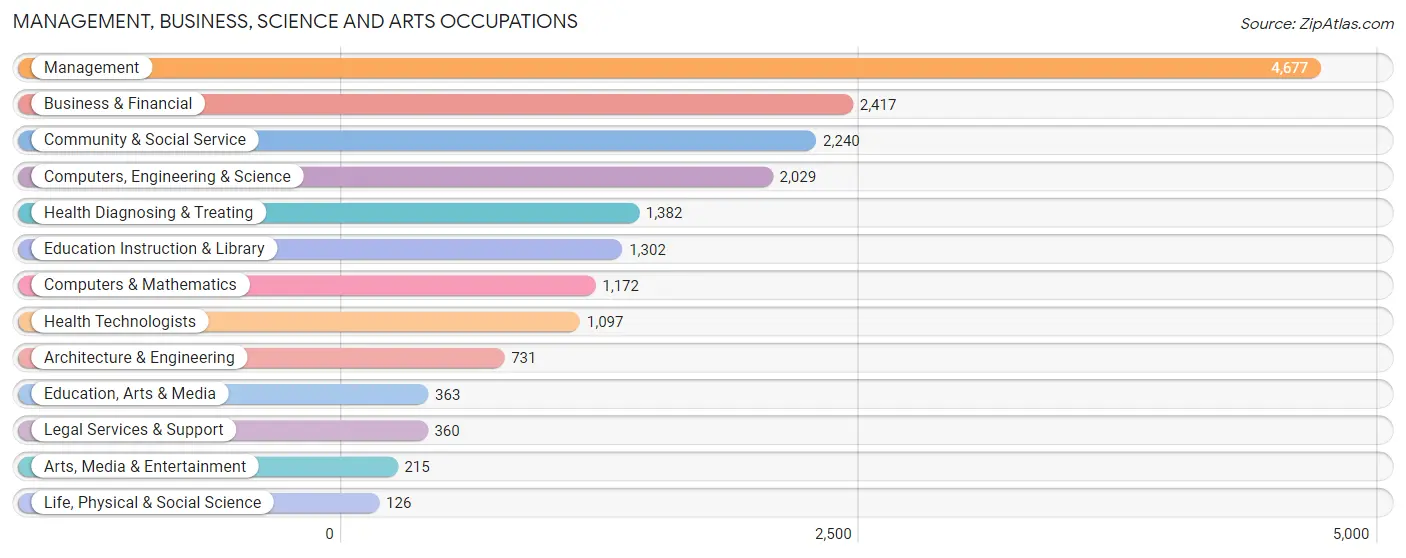
Management, Business, Science and Arts Occupations
The most common Management, Business, Science and Arts occupations in Keller are Management (4,677 | 20.8%), Business & Financial (2,417 | 10.7%), Community & Social Service (2,240 | 9.9%), Computers, Engineering & Science (2,029 | 9.0%), and Health Diagnosing & Treating (1,382 | 6.1%).
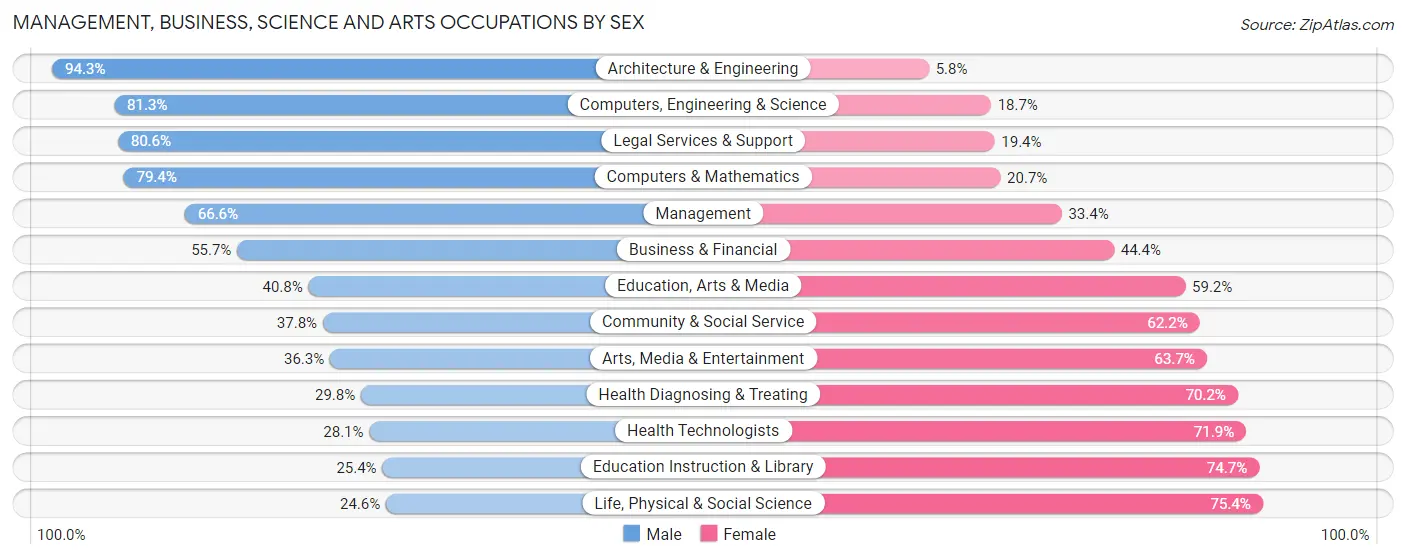
Management, Business, Science and Arts Occupations by Sex
Within the Management, Business, Science and Arts occupations in Keller, the most male-oriented occupations are Architecture & Engineering (94.3%), Computers, Engineering & Science (81.3%), and Legal Services & Support (80.6%), while the most female-oriented occupations are Life, Physical & Social Science (75.4%), Education Instruction & Library (74.7%), and Health Technologists (71.9%).
| Occupation | Male | Female |
| Management | 3,113 (66.6%) | 1,564 (33.4%) |
| Business & Financial | 1,345 (55.6%) | 1,072 (44.4%) |
| Computers, Engineering & Science | 1,650 (81.3%) | 379 (18.7%) |
| Computers & Mathematics | 930 (79.3%) | 242 (20.6%) |
| Architecture & Engineering | 689 (94.3%) | 42 (5.8%) |
| Life, Physical & Social Science | 31 (24.6%) | 95 (75.4%) |
| Community & Social Service | 846 (37.8%) | 1,394 (62.2%) |
| Education, Arts & Media | 148 (40.8%) | 215 (59.2%) |
| Legal Services & Support | 290 (80.6%) | 70 (19.4%) |
| Education Instruction & Library | 330 (25.4%) | 972 (74.7%) |
| Arts, Media & Entertainment | 78 (36.3%) | 137 (63.7%) |
| Health Diagnosing & Treating | 412 (29.8%) | 970 (70.2%) |
| Health Technologists | 308 (28.1%) | 789 (71.9%) |
| Total (Category) | 7,366 (57.8%) | 5,379 (42.2%) |
| Total (Overall) | 13,014 (57.8%) | 9,518 (42.2%) |
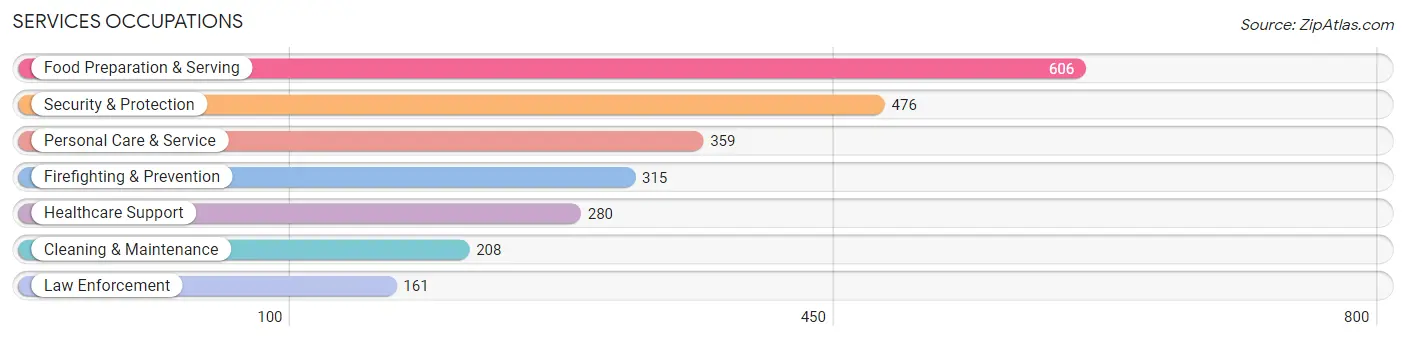
Services Occupations
The most common Services occupations in Keller are Food Preparation & Serving (606 | 2.7%), Security & Protection (476 | 2.1%), Personal Care & Service (359 | 1.6%), Firefighting & Prevention (315 | 1.4%), and Healthcare Support (280 | 1.2%).
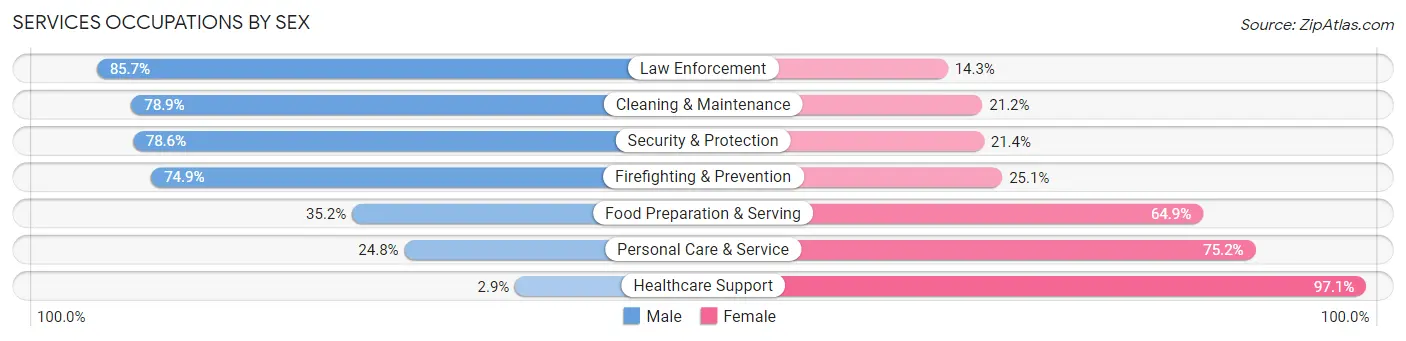
Services Occupations by Sex
Within the Services occupations in Keller, the most male-oriented occupations are Law Enforcement (85.7%), Cleaning & Maintenance (78.8%), and Security & Protection (78.6%), while the most female-oriented occupations are Healthcare Support (97.1%), Personal Care & Service (75.2%), and Food Preparation & Serving (64.8%).
| Occupation | Male | Female |
| Healthcare Support | 8 (2.9%) | 272 (97.1%) |
| Security & Protection | 374 (78.6%) | 102 (21.4%) |
| Firefighting & Prevention | 236 (74.9%) | 79 (25.1%) |
| Law Enforcement | 138 (85.7%) | 23 (14.3%) |
| Food Preparation & Serving | 213 (35.1%) | 393 (64.8%) |
| Cleaning & Maintenance | 164 (78.8%) | 44 (21.1%) |
| Personal Care & Service | 89 (24.8%) | 270 (75.2%) |
| Total (Category) | 848 (44.0%) | 1,081 (56.0%) |
| Total (Overall) | 13,014 (57.8%) | 9,518 (42.2%) |
Sales and Office Occupations
The most common Sales and Office occupations in Keller are Sales & Related (3,068 | 13.6%), and Office & Administration (2,040 | 9.0%).
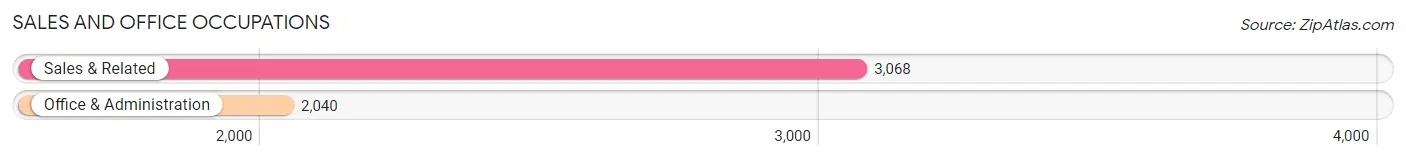
Sales and Office Occupations by Sex

| Occupation | Male | Female |
| Sales & Related | 1,927 (62.8%) | 1,141 (37.2%) |
| Office & Administration | 565 (27.7%) | 1,475 (72.3%) |
| Total (Category) | 2,492 (48.8%) | 2,616 (51.2%) |
| Total (Overall) | 13,014 (57.8%) | 9,518 (42.2%) |
Natural Resources, Construction and Maintenance Occupations
The most common Natural Resources, Construction and Maintenance occupations in Keller are Installation, Maintenance & Repair (460 | 2.0%), Construction & Extraction (323 | 1.4%), and Farming, Fishing & Forestry (10 | 0.0%).
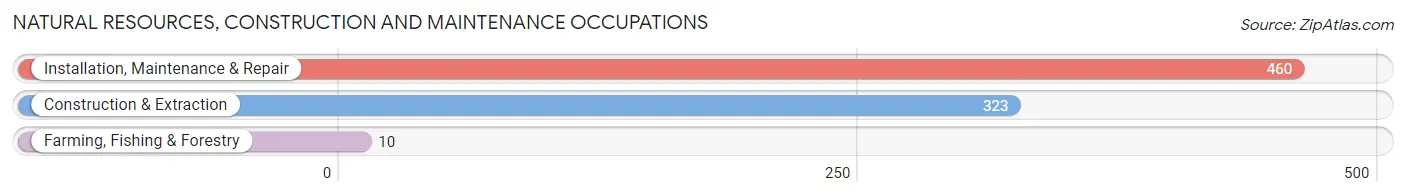
Natural Resources, Construction and Maintenance Occupations by Sex
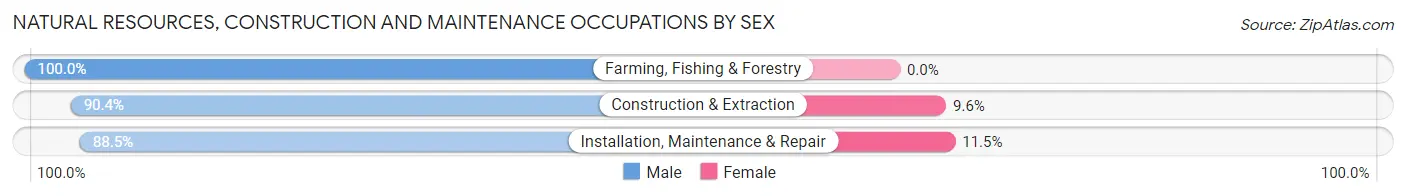
| Occupation | Male | Female |
| Farming, Fishing & Forestry | 10 (100.0%) | 0 (0.0%) |
| Construction & Extraction | 292 (90.4%) | 31 (9.6%) |
| Installation, Maintenance & Repair | 407 (88.5%) | 53 (11.5%) |
| Total (Category) | 709 (89.4%) | 84 (10.6%) |
| Total (Overall) | 13,014 (57.8%) | 9,518 (42.2%) |
Production, Transportation and Moving Occupations
The most common Production, Transportation and Moving occupations in Keller are Transportation (897 | 4.0%), Production (584 | 2.6%), and Material Moving (476 | 2.1%).
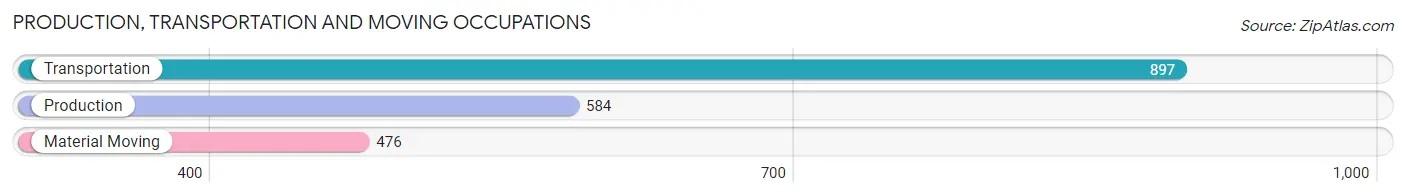
Production, Transportation and Moving Occupations by Sex
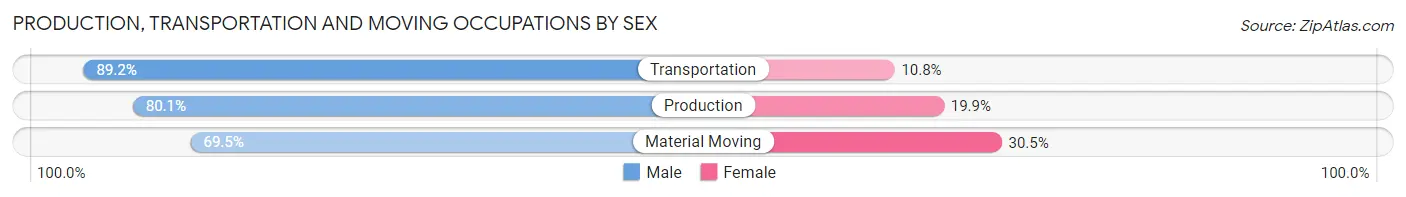
| Occupation | Male | Female |
| Production | 468 (80.1%) | 116 (19.9%) |
| Transportation | 800 (89.2%) | 97 (10.8%) |
| Material Moving | 331 (69.5%) | 145 (30.5%) |
| Total (Category) | 1,599 (81.7%) | 358 (18.3%) |
| Total (Overall) | 13,014 (57.8%) | 9,518 (42.2%) |
Employment Industries by Sex in Keller
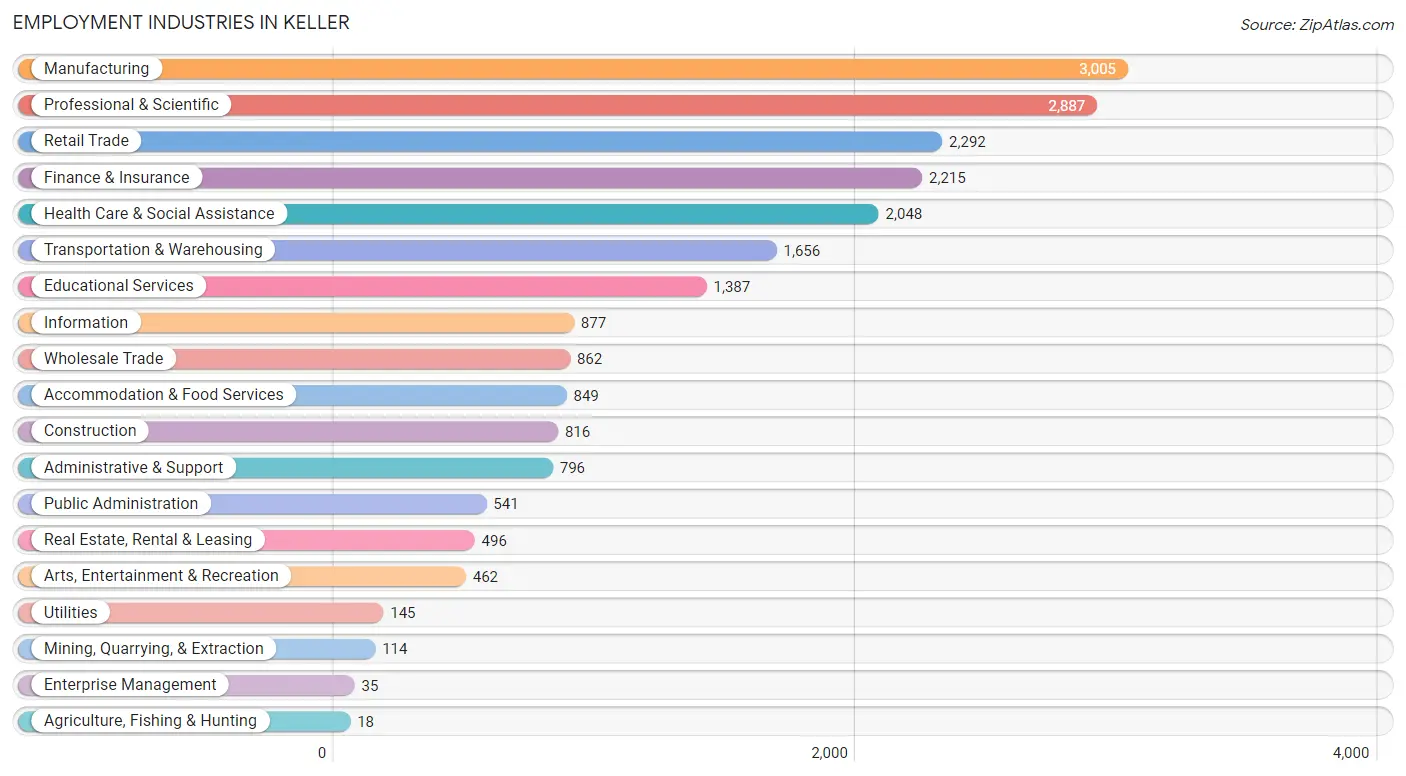
Employment Industries in Keller
The major employment industries in Keller include Manufacturing (3,005 | 13.3%), Professional & Scientific (2,887 | 12.8%), Retail Trade (2,292 | 10.2%), Finance & Insurance (2,215 | 9.8%), and Health Care & Social Assistance (2,048 | 9.1%).
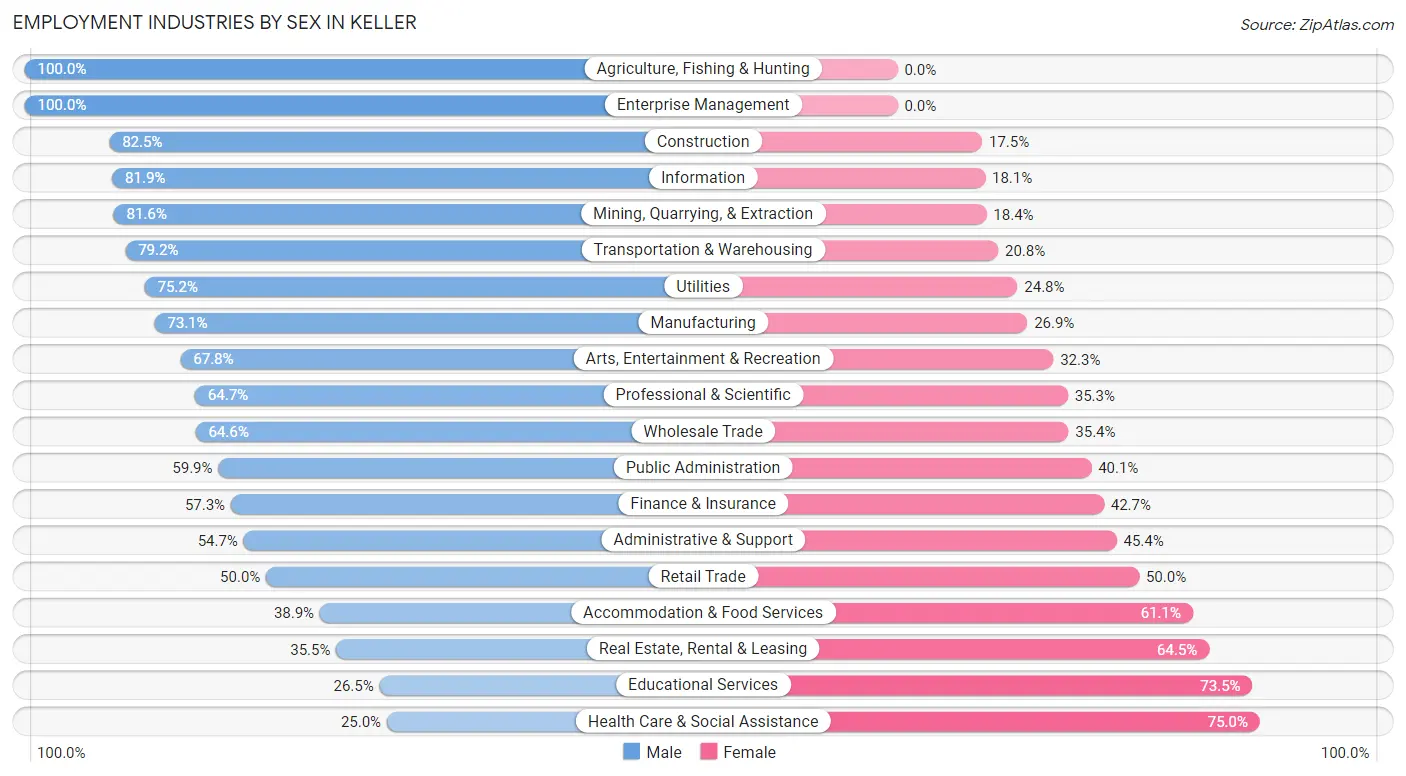
Employment Industries by Sex in Keller
The Keller industries that see more men than women are Agriculture, Fishing & Hunting (100.0%), Enterprise Management (100.0%), and Construction (82.5%), whereas the industries that tend to have a higher number of women are Health Care & Social Assistance (75.0%), Educational Services (73.5%), and Real Estate, Rental & Leasing (64.5%).
| Industry | Male | Female |
| Agriculture, Fishing & Hunting | 18 (100.0%) | 0 (0.0%) |
| Mining, Quarrying, & Extraction | 93 (81.6%) | 21 (18.4%) |
| Construction | 673 (82.5%) | 143 (17.5%) |
| Manufacturing | 2,198 (73.1%) | 807 (26.9%) |
| Wholesale Trade | 557 (64.6%) | 305 (35.4%) |
| Retail Trade | 1,146 (50.0%) | 1,146 (50.0%) |
| Transportation & Warehousing | 1,311 (79.2%) | 345 (20.8%) |
| Utilities | 109 (75.2%) | 36 (24.8%) |
| Information | 718 (81.9%) | 159 (18.1%) |
| Finance & Insurance | 1,269 (57.3%) | 946 (42.7%) |
| Real Estate, Rental & Leasing | 176 (35.5%) | 320 (64.5%) |
| Professional & Scientific | 1,869 (64.7%) | 1,018 (35.3%) |
| Enterprise Management | 35 (100.0%) | 0 (0.0%) |
| Administrative & Support | 435 (54.6%) | 361 (45.4%) |
| Educational Services | 368 (26.5%) | 1,019 (73.5%) |
| Health Care & Social Assistance | 512 (25.0%) | 1,536 (75.0%) |
| Arts, Entertainment & Recreation | 313 (67.7%) | 149 (32.3%) |
| Accommodation & Food Services | 330 (38.9%) | 519 (61.1%) |
| Public Administration | 324 (59.9%) | 217 (40.1%) |
| Total | 13,014 (57.8%) | 9,518 (42.2%) |
Education in Keller
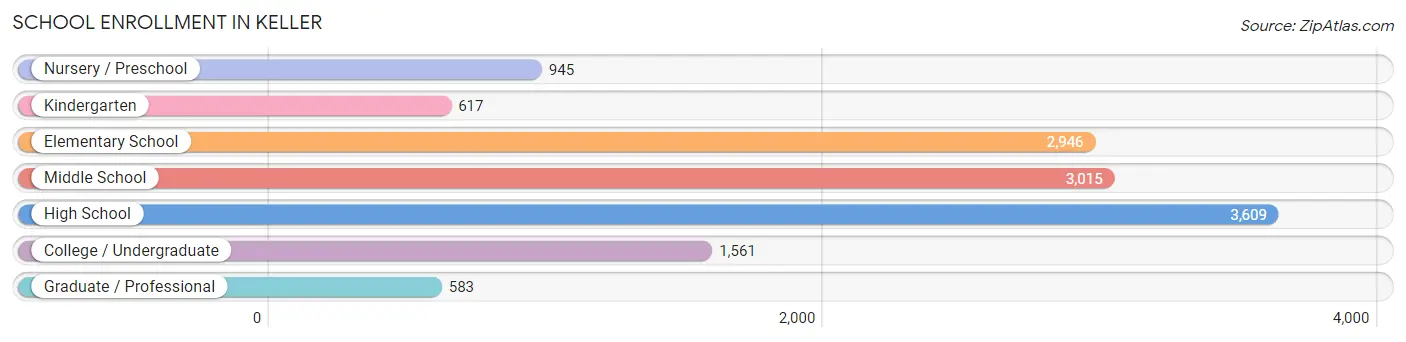
School Enrollment in Keller
The most common levels of schooling among the 13,276 students in Keller are high school (3,609 | 27.2%), middle school (3,015 | 22.7%), and elementary school (2,946 | 22.2%).
| School Level | # Students | % Students |
| Nursery / Preschool | 945 | 7.1% |
| Kindergarten | 617 | 4.6% |
| Elementary School | 2,946 | 22.2% |
| Middle School | 3,015 | 22.7% |
| High School | 3,609 | 27.2% |
| College / Undergraduate | 1,561 | 11.8% |
| Graduate / Professional | 583 | 4.4% |
| Total | 13,276 | 100.0% |
School Enrollment by Age by Funding Source in Keller
Out of a total of 13,276 students who are enrolled in schools in Keller, 2,111 (15.9%) attend a private institution, while the remaining 11,165 (84.1%) are enrolled in public schools. The age group of 3 to 4 year olds has the highest likelihood of being enrolled in private schools, with 359 (49.0% in the age bracket) enrolled. Conversely, the age group of 25 to 34 year olds has the lowest likelihood of being enrolled in a private school, with 284 (96.9% in the age bracket) attending a public institution.
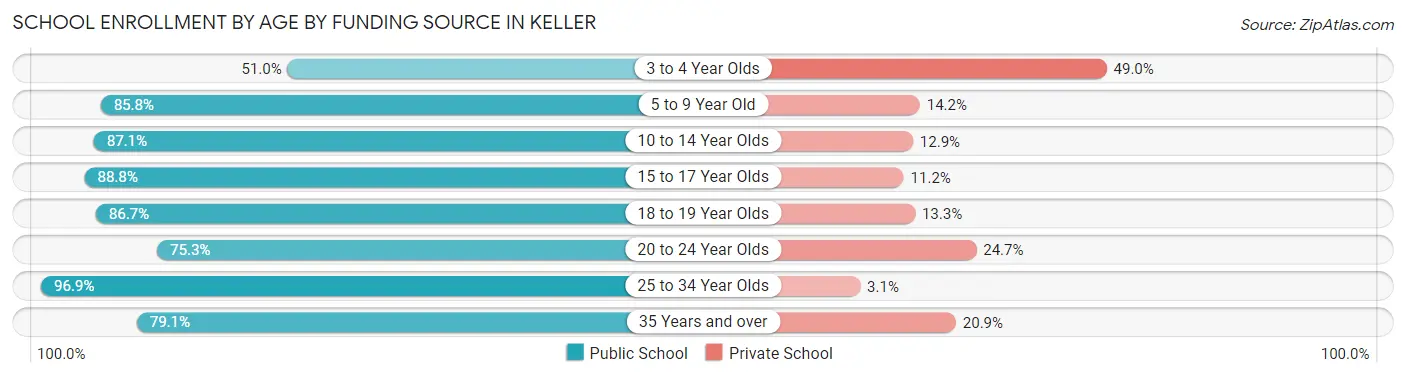
| Age Bracket | Public School | Private School |
| 3 to 4 Year Olds | 374 (51.0%) | 359 (49.0%) |
| 5 to 9 Year Old | 2,966 (85.8%) | 490 (14.2%) |
| 10 to 14 Year Olds | 2,951 (87.1%) | 437 (12.9%) |
| 15 to 17 Year Olds | 2,544 (88.8%) | 320 (11.2%) |
| 18 to 19 Year Olds | 829 (86.7%) | 127 (13.3%) |
| 20 to 24 Year Olds | 625 (75.3%) | 205 (24.7%) |
| 25 to 34 Year Olds | 284 (96.9%) | 9 (3.1%) |
| 35 Years and over | 598 (79.1%) | 158 (20.9%) |
| Total | 11,165 (84.1%) | 2,111 (15.9%) |
Educational Attainment by Field of Study in Keller
Business (5,397 | 28.3%), engineering (2,543 | 13.3%), education (2,054 | 10.8%), science & technology (1,286 | 6.7%), and arts & humanities (1,042 | 5.5%) are the most common fields of study among 19,083 individuals in Keller who have obtained a bachelor's degree or higher.
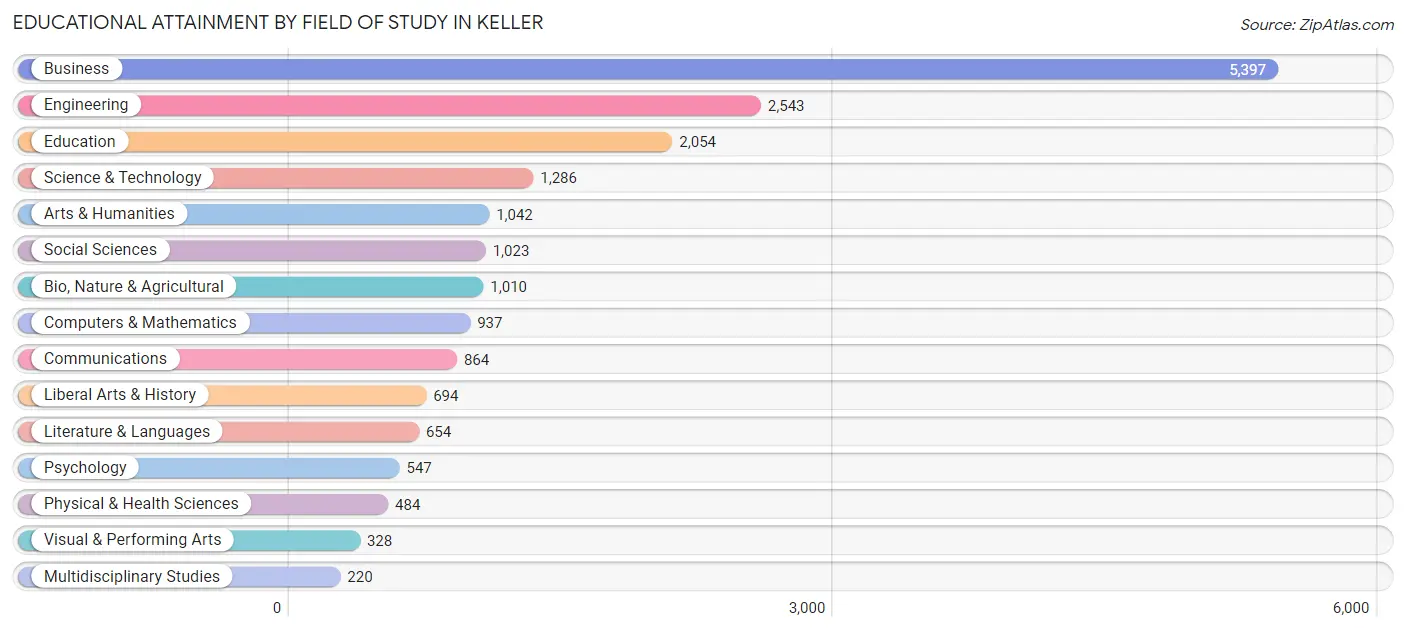
| Field of Study | # Graduates | % Graduates |
| Computers & Mathematics | 937 | 4.9% |
| Bio, Nature & Agricultural | 1,010 | 5.3% |
| Physical & Health Sciences | 484 | 2.5% |
| Psychology | 547 | 2.9% |
| Social Sciences | 1,023 | 5.4% |
| Engineering | 2,543 | 13.3% |
| Multidisciplinary Studies | 220 | 1.1% |
| Science & Technology | 1,286 | 6.7% |
| Business | 5,397 | 28.3% |
| Education | 2,054 | 10.8% |
| Literature & Languages | 654 | 3.4% |
| Liberal Arts & History | 694 | 3.6% |
| Visual & Performing Arts | 328 | 1.7% |
| Communications | 864 | 4.5% |
| Arts & Humanities | 1,042 | 5.5% |
| Total | 19,083 | 100.0% |
Transportation & Commute in Keller
Vehicle Availability by Sex in Keller
The most prevalent vehicle ownership categories in Keller are males with 2 vehicles (6,035, accounting for 46.2%) and females with 2 vehicles (4,172, making up 64.2%).
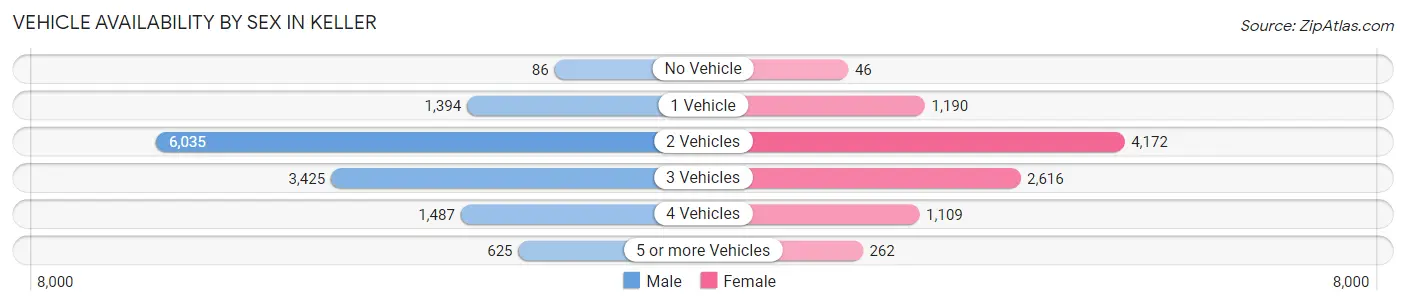
| Vehicles Available | Male | Female |
| No Vehicle | 86 (0.7%) | 46 (0.5%) |
| 1 Vehicle | 1,394 (10.7%) | 1,190 (12.7%) |
| 2 Vehicles | 6,035 (46.2%) | 4,172 (44.4%) |
| 3 Vehicles | 3,425 (26.2%) | 2,616 (27.8%) |
| 4 Vehicles | 1,487 (11.4%) | 1,109 (11.8%) |
| 5 or more Vehicles | 625 (4.8%) | 262 (2.8%) |
| Total | 13,052 (100.0%) | 9,395 (100.0%) |
Commute Time in Keller
The most frequently occuring commute durations in Keller are 30 to 34 minutes (2,978 commuters, 17.1%), 20 to 24 minutes (2,386 commuters, 13.7%), and 15 to 19 minutes (2,094 commuters, 12.0%).
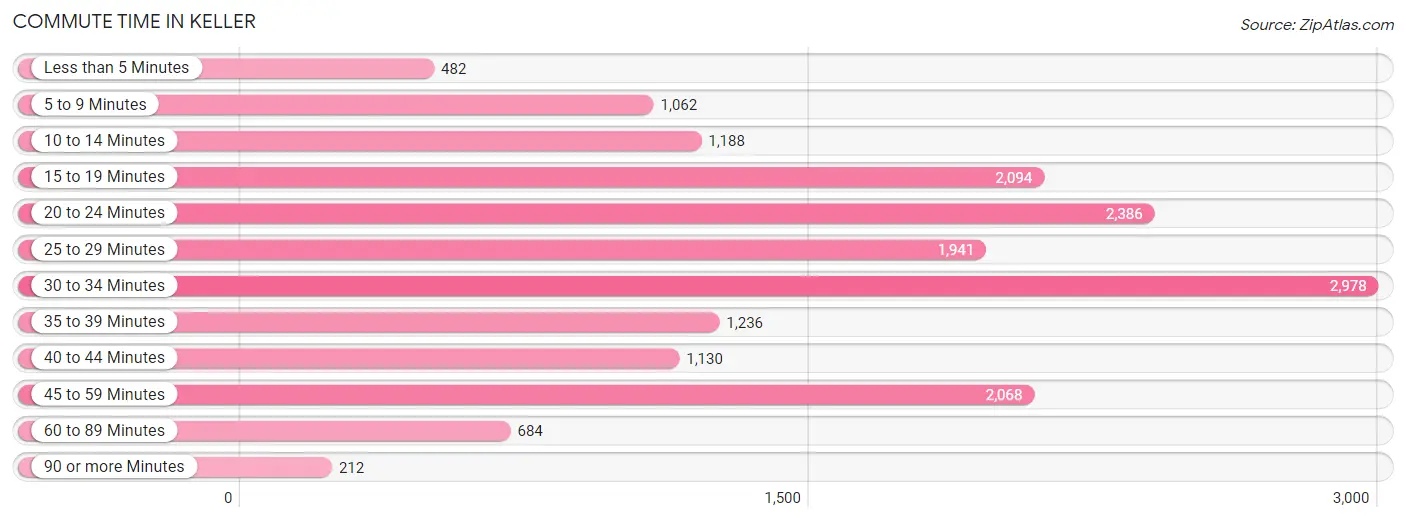
| Commute Time | # Commuters | % Commuters |
| Less than 5 Minutes | 482 | 2.8% |
| 5 to 9 Minutes | 1,062 | 6.1% |
| 10 to 14 Minutes | 1,188 | 6.8% |
| 15 to 19 Minutes | 2,094 | 12.0% |
| 20 to 24 Minutes | 2,386 | 13.7% |
| 25 to 29 Minutes | 1,941 | 11.1% |
| 30 to 34 Minutes | 2,978 | 17.1% |
| 35 to 39 Minutes | 1,236 | 7.1% |
| 40 to 44 Minutes | 1,130 | 6.5% |
| 45 to 59 Minutes | 2,068 | 11.8% |
| 60 to 89 Minutes | 684 | 3.9% |
| 90 or more Minutes | 212 | 1.2% |
Commute Time by Sex in Keller
The most common commute times in Keller are 30 to 34 minutes (1,658 commuters, 16.4%) for males and 30 to 34 minutes (1,320 commuters, 18.0%) for females.
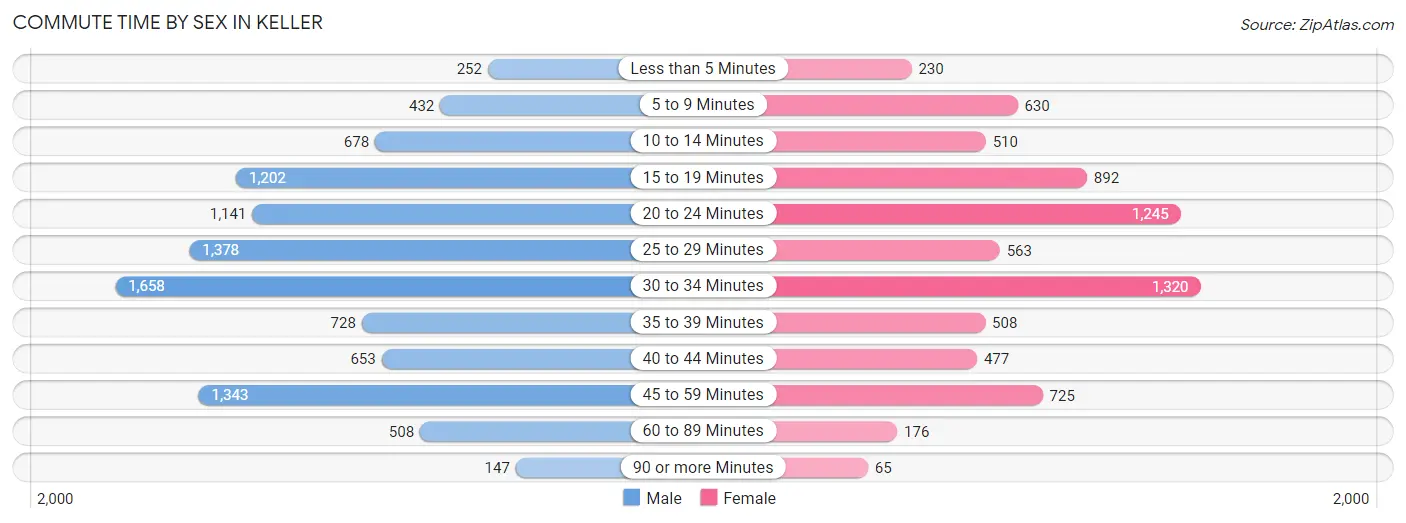
| Commute Time | Male | Female |
| Less than 5 Minutes | 252 (2.5%) | 230 (3.1%) |
| 5 to 9 Minutes | 432 (4.3%) | 630 (8.6%) |
| 10 to 14 Minutes | 678 (6.7%) | 510 (7.0%) |
| 15 to 19 Minutes | 1,202 (11.9%) | 892 (12.1%) |
| 20 to 24 Minutes | 1,141 (11.3%) | 1,245 (17.0%) |
| 25 to 29 Minutes | 1,378 (13.6%) | 563 (7.7%) |
| 30 to 34 Minutes | 1,658 (16.4%) | 1,320 (18.0%) |
| 35 to 39 Minutes | 728 (7.2%) | 508 (6.9%) |
| 40 to 44 Minutes | 653 (6.5%) | 477 (6.5%) |
| 45 to 59 Minutes | 1,343 (13.3%) | 725 (9.9%) |
| 60 to 89 Minutes | 508 (5.0%) | 176 (2.4%) |
| 90 or more Minutes | 147 (1.5%) | 65 (0.9%) |
Time of Departure to Work by Sex in Keller
The most frequent times of departure to work in Keller are 7:00 AM to 7:29 AM (1,628, 16.1%) for males and 7:00 AM to 7:29 AM (1,726, 23.5%) for females.
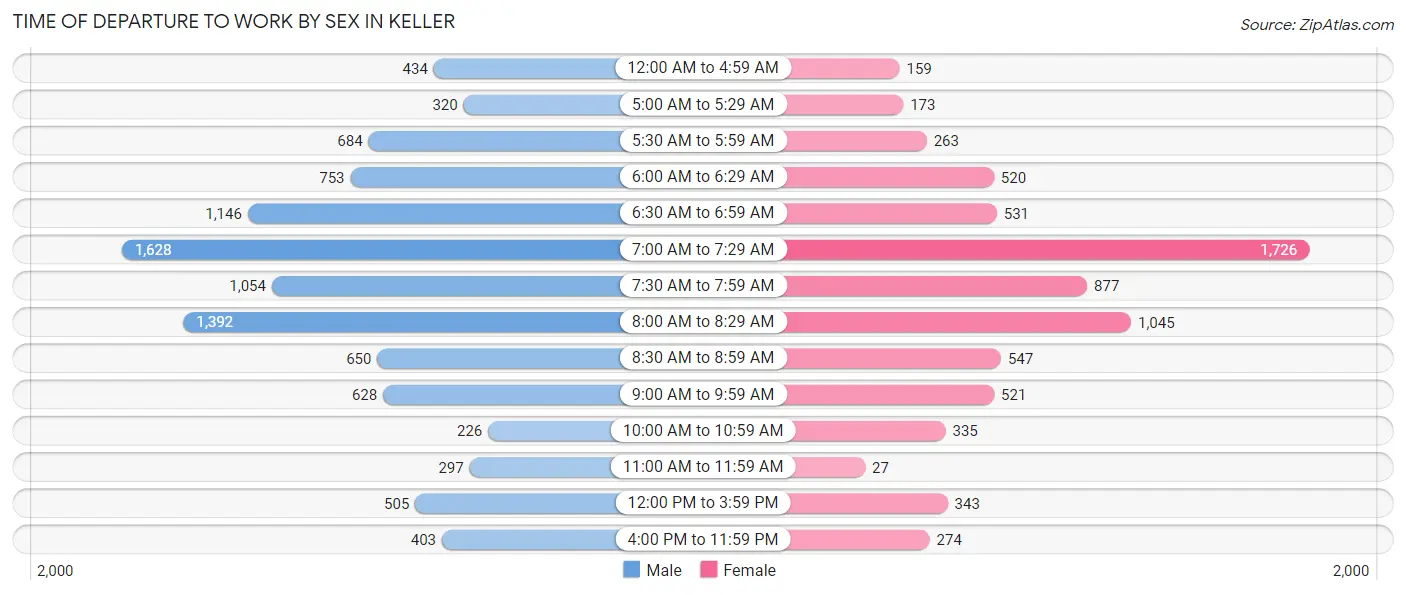
| Time of Departure | Male | Female |
| 12:00 AM to 4:59 AM | 434 (4.3%) | 159 (2.2%) |
| 5:00 AM to 5:29 AM | 320 (3.2%) | 173 (2.4%) |
| 5:30 AM to 5:59 AM | 684 (6.8%) | 263 (3.6%) |
| 6:00 AM to 6:29 AM | 753 (7.4%) | 520 (7.1%) |
| 6:30 AM to 6:59 AM | 1,146 (11.3%) | 531 (7.2%) |
| 7:00 AM to 7:29 AM | 1,628 (16.1%) | 1,726 (23.5%) |
| 7:30 AM to 7:59 AM | 1,054 (10.4%) | 877 (11.9%) |
| 8:00 AM to 8:29 AM | 1,392 (13.8%) | 1,045 (14.2%) |
| 8:30 AM to 8:59 AM | 650 (6.4%) | 547 (7.4%) |
| 9:00 AM to 9:59 AM | 628 (6.2%) | 521 (7.1%) |
| 10:00 AM to 10:59 AM | 226 (2.2%) | 335 (4.6%) |
| 11:00 AM to 11:59 AM | 297 (2.9%) | 27 (0.4%) |
| 12:00 PM to 3:59 PM | 505 (5.0%) | 343 (4.7%) |
| 4:00 PM to 11:59 PM | 403 (4.0%) | 274 (3.7%) |
| Total | 10,120 (100.0%) | 7,341 (100.0%) |
Housing Occupancy in Keller
Occupancy by Ownership in Keller
Of the total 16,052 dwellings in Keller, owner-occupied units account for 13,314 (82.9%), while renter-occupied units make up 2,738 (17.1%).
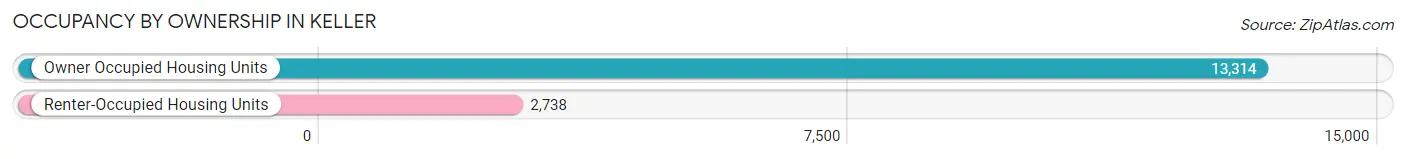
| Occupancy | # Housing Units | % Housing Units |
| Owner Occupied Housing Units | 13,314 | 82.9% |
| Renter-Occupied Housing Units | 2,738 | 17.1% |
| Total Occupied Housing Units | 16,052 | 100.0% |
Occupancy by Household Size in Keller
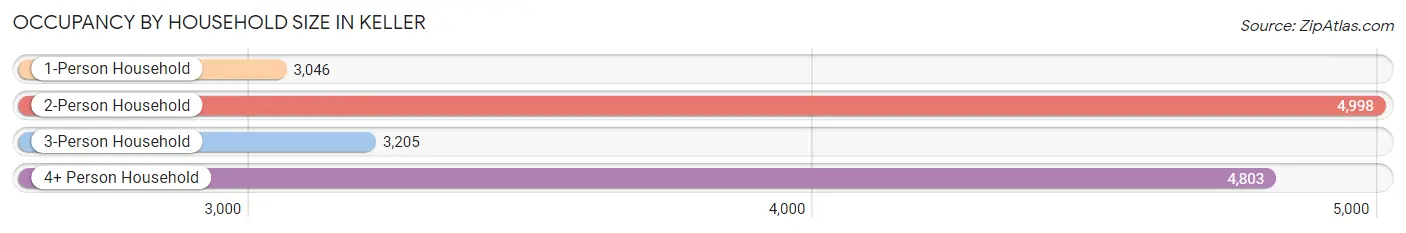
| Household Size | # Housing Units | % Housing Units |
| 1-Person Household | 3,046 | 19.0% |
| 2-Person Household | 4,998 | 31.1% |
| 3-Person Household | 3,205 | 20.0% |
| 4+ Person Household | 4,803 | 29.9% |
| Total Housing Units | 16,052 | 100.0% |
Occupancy by Ownership by Household Size in Keller
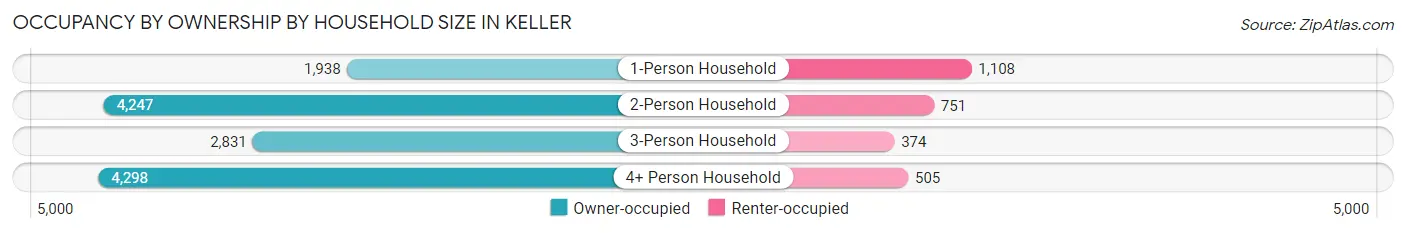
| Household Size | Owner-occupied | Renter-occupied |
| 1-Person Household | 1,938 (63.6%) | 1,108 (36.4%) |
| 2-Person Household | 4,247 (85.0%) | 751 (15.0%) |
| 3-Person Household | 2,831 (88.3%) | 374 (11.7%) |
| 4+ Person Household | 4,298 (89.5%) | 505 (10.5%) |
| Total Housing Units | 13,314 (82.9%) | 2,738 (17.1%) |
Occupancy by Educational Attainment in Keller
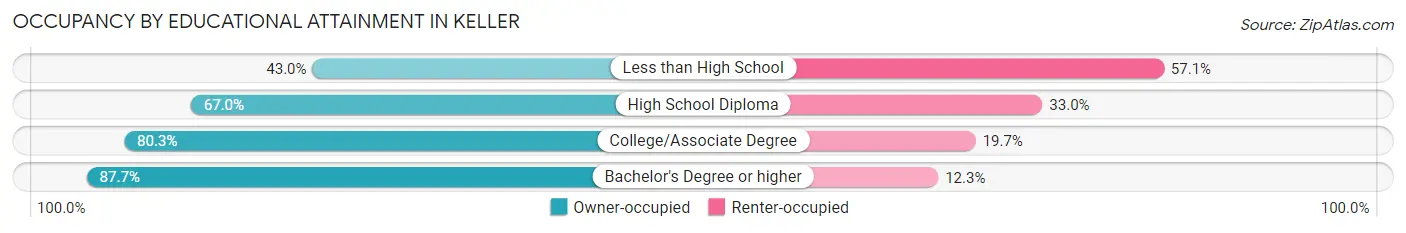
| Household Size | Owner-occupied | Renter-occupied |
| Less than High School | 134 (42.9%) | 178 (57.1%) |
| High School Diploma | 1,151 (67.0%) | 566 (33.0%) |
| College/Associate Degree | 2,893 (80.3%) | 711 (19.7%) |
| Bachelor's Degree or higher | 9,136 (87.7%) | 1,283 (12.3%) |
Occupancy by Age of Householder in Keller
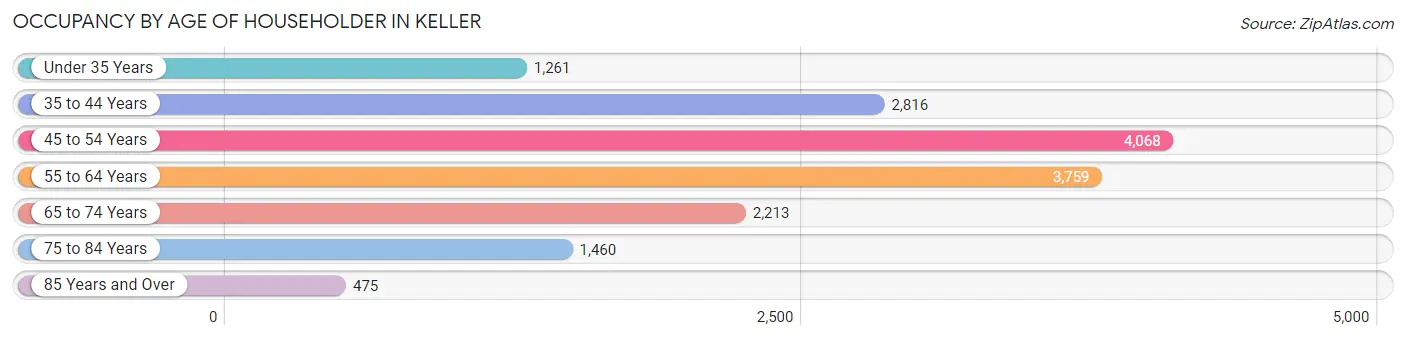
| Age Bracket | # Households | % Households |
| Under 35 Years | 1,261 | 7.9% |
| 35 to 44 Years | 2,816 | 17.5% |
| 45 to 54 Years | 4,068 | 25.3% |
| 55 to 64 Years | 3,759 | 23.4% |
| 65 to 74 Years | 2,213 | 13.8% |
| 75 to 84 Years | 1,460 | 9.1% |
| 85 Years and Over | 475 | 3.0% |
| Total | 16,052 | 100.0% |
Housing Finances in Keller
Median Income by Occupancy in Keller
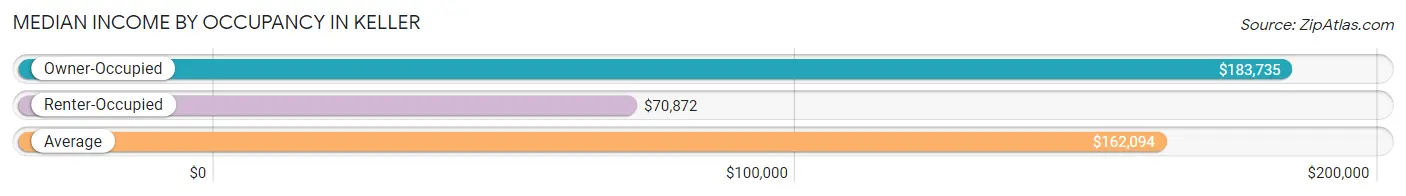
| Occupancy Type | # Households | Median Income |
| Owner-Occupied | 13,314 (82.9%) | $183,735 |
| Renter-Occupied | 2,738 (17.1%) | $70,872 |
| Average | 16,052 (100.0%) | $162,094 |
Occupancy by Householder Income Bracket in Keller
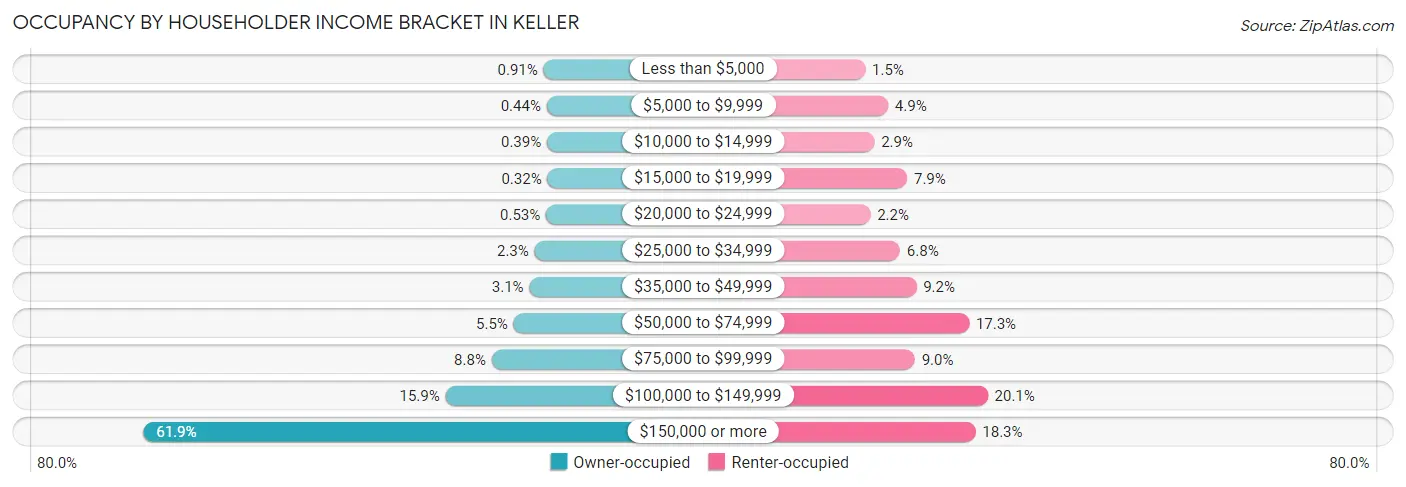
| Income Bracket | Owner-occupied | Renter-occupied |
| Less than $5,000 | 121 (0.9%) | 40 (1.5%) |
| $5,000 to $9,999 | 59 (0.4%) | 135 (4.9%) |
| $10,000 to $14,999 | 52 (0.4%) | 78 (2.9%) |
| $15,000 to $19,999 | 42 (0.3%) | 215 (7.9%) |
| $20,000 to $24,999 | 71 (0.5%) | 61 (2.2%) |
| $25,000 to $34,999 | 304 (2.3%) | 185 (6.8%) |
| $35,000 to $49,999 | 409 (3.1%) | 253 (9.2%) |
| $50,000 to $74,999 | 728 (5.5%) | 473 (17.3%) |
| $75,000 to $99,999 | 1,174 (8.8%) | 247 (9.0%) |
| $100,000 to $149,999 | 2,111 (15.9%) | 551 (20.1%) |
| $150,000 or more | 8,243 (61.9%) | 500 (18.3%) |
| Total | 13,314 (100.0%) | 2,738 (100.0%) |
Monthly Housing Cost Tiers in Keller
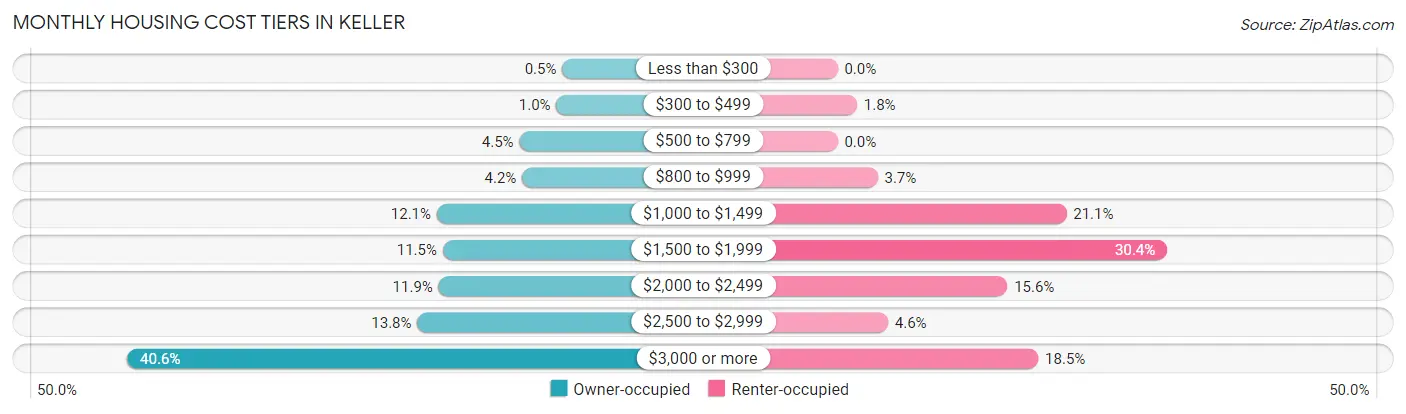
| Monthly Cost | Owner-occupied | Renter-occupied |
| Less than $300 | 66 (0.5%) | 0 (0.0%) |
| $300 to $499 | 138 (1.0%) | 49 (1.8%) |
| $500 to $799 | 592 (4.4%) | 0 (0.0%) |
| $800 to $999 | 558 (4.2%) | 101 (3.7%) |
| $1,000 to $1,499 | 1,604 (12.0%) | 577 (21.1%) |
| $1,500 to $1,999 | 1,531 (11.5%) | 831 (30.3%) |
| $2,000 to $2,499 | 1,582 (11.9%) | 428 (15.6%) |
| $2,500 to $2,999 | 1,843 (13.8%) | 127 (4.6%) |
| $3,000 or more | 5,400 (40.6%) | 506 (18.5%) |
| Total | 13,314 (100.0%) | 2,738 (100.0%) |
Physical Housing Characteristics in Keller
Housing Structures in Keller
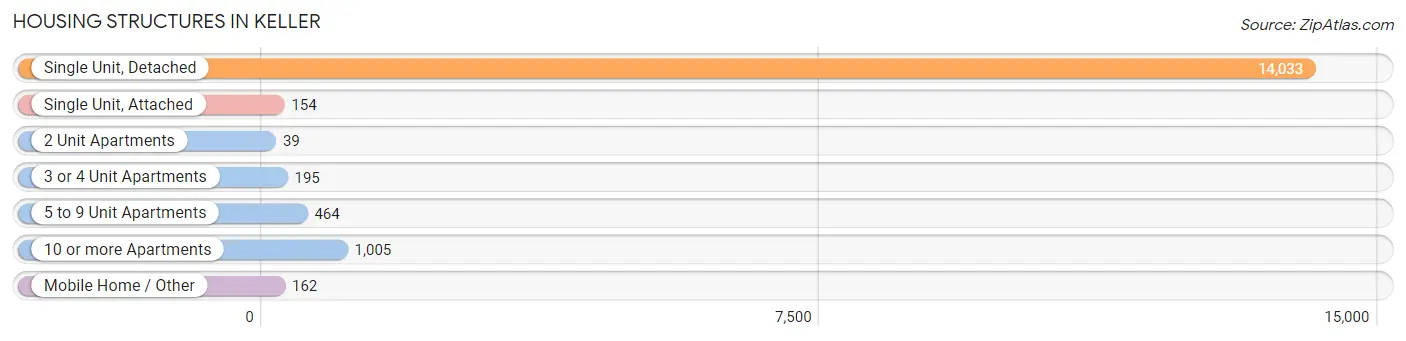
| Structure Type | # Housing Units | % Housing Units |
| Single Unit, Detached | 14,033 | 87.4% |
| Single Unit, Attached | 154 | 1.0% |
| 2 Unit Apartments | 39 | 0.2% |
| 3 or 4 Unit Apartments | 195 | 1.2% |
| 5 to 9 Unit Apartments | 464 | 2.9% |
| 10 or more Apartments | 1,005 | 6.3% |
| Mobile Home / Other | 162 | 1.0% |
| Total | 16,052 | 100.0% |
Housing Structures by Occupancy in Keller
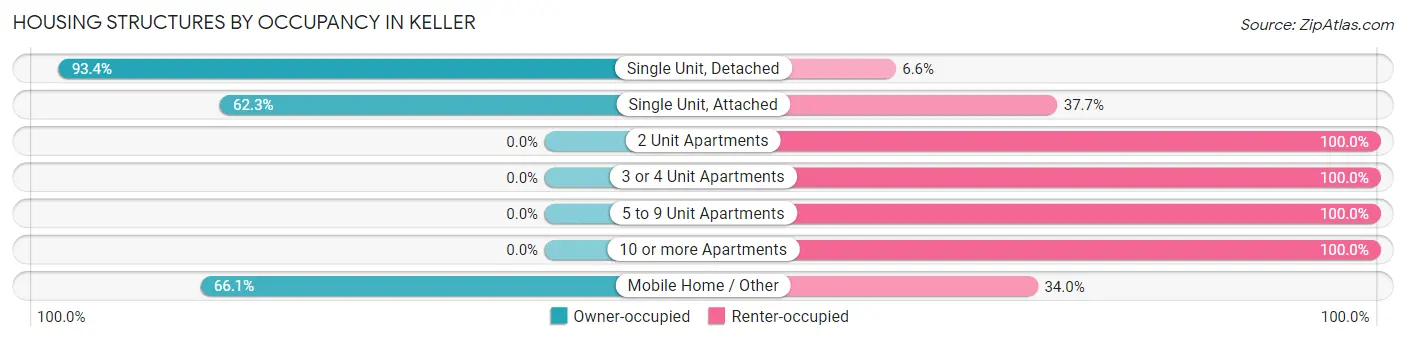
| Structure Type | Owner-occupied | Renter-occupied |
| Single Unit, Detached | 13,111 (93.4%) | 922 (6.6%) |
| Single Unit, Attached | 96 (62.3%) | 58 (37.7%) |
| 2 Unit Apartments | 0 (0.0%) | 39 (100.0%) |
| 3 or 4 Unit Apartments | 0 (0.0%) | 195 (100.0%) |
| 5 to 9 Unit Apartments | 0 (0.0%) | 464 (100.0%) |
| 10 or more Apartments | 0 (0.0%) | 1,005 (100.0%) |
| Mobile Home / Other | 107 (66.0%) | 55 (34.0%) |
| Total | 13,314 (82.9%) | 2,738 (17.1%) |
Housing Structures by Number of Rooms in Keller
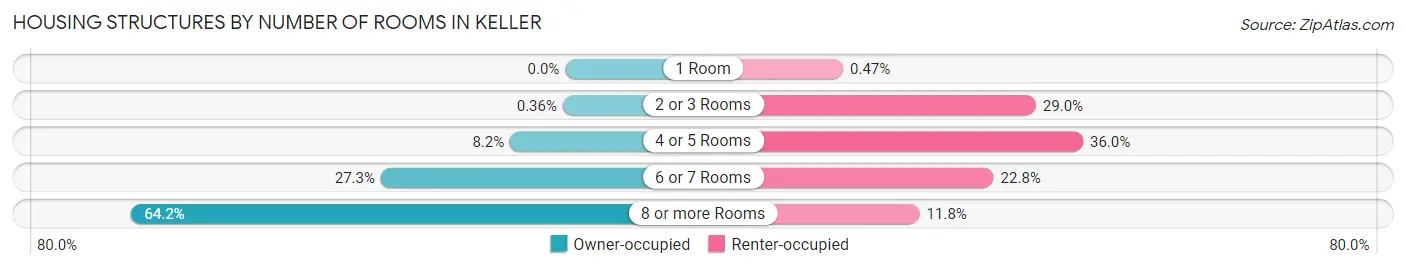
| Number of Rooms | Owner-occupied | Renter-occupied |
| 1 Room | 0 (0.0%) | 13 (0.5%) |
| 2 or 3 Rooms | 48 (0.4%) | 794 (29.0%) |
| 4 or 5 Rooms | 1,086 (8.2%) | 985 (36.0%) |
| 6 or 7 Rooms | 3,634 (27.3%) | 623 (22.8%) |
| 8 or more Rooms | 8,546 (64.2%) | 323 (11.8%) |
| Total | 13,314 (100.0%) | 2,738 (100.0%) |
Housing Structure by Heating Type in Keller
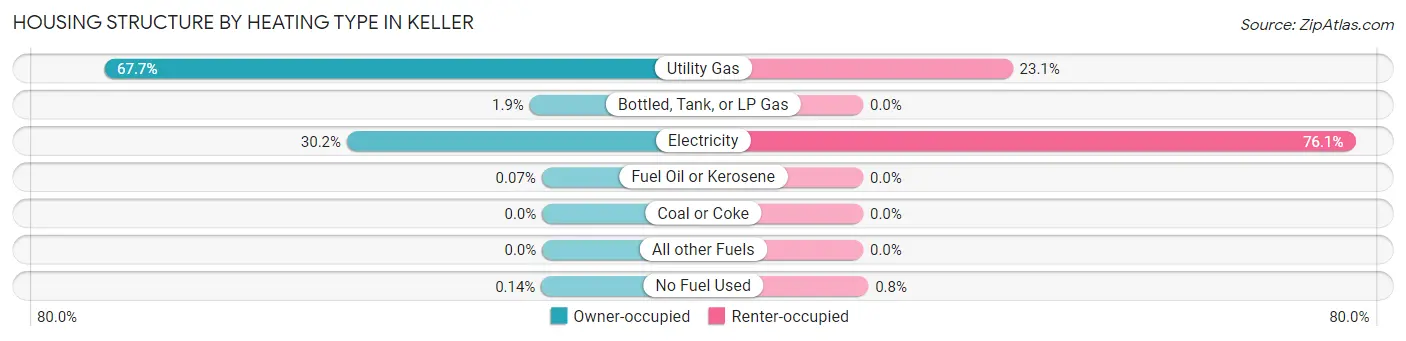
| Heating Type | Owner-occupied | Renter-occupied |
| Utility Gas | 9,013 (67.7%) | 633 (23.1%) |
| Bottled, Tank, or LP Gas | 255 (1.9%) | 0 (0.0%) |
| Electricity | 4,018 (30.2%) | 2,083 (76.1%) |
| Fuel Oil or Kerosene | 9 (0.1%) | 0 (0.0%) |
| Coal or Coke | 0 (0.0%) | 0 (0.0%) |
| All other Fuels | 0 (0.0%) | 0 (0.0%) |
| No Fuel Used | 19 (0.1%) | 22 (0.8%) |
| Total | 13,314 (100.0%) | 2,738 (100.0%) |
Household Vehicle Usage in Keller
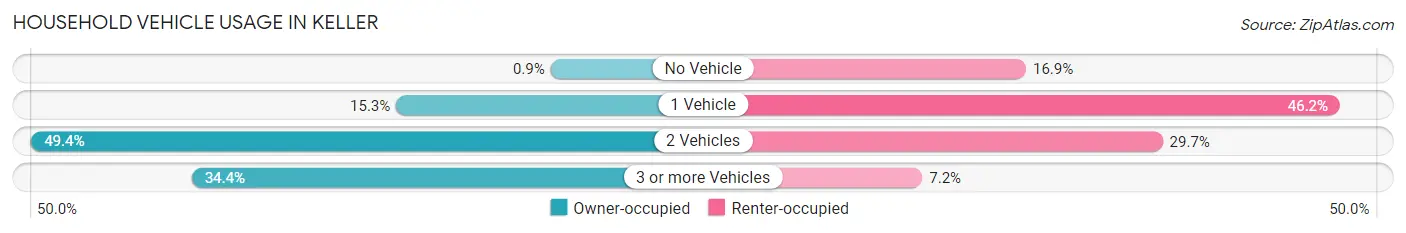
| Vehicles per Household | Owner-occupied | Renter-occupied |
| No Vehicle | 120 (0.9%) | 463 (16.9%) |
| 1 Vehicle | 2,040 (15.3%) | 1,265 (46.2%) |
| 2 Vehicles | 6,574 (49.4%) | 812 (29.7%) |
| 3 or more Vehicles | 4,580 (34.4%) | 198 (7.2%) |
| Total | 13,314 (100.0%) | 2,738 (100.0%) |
Real Estate & Mortgages in Keller
Real Estate and Mortgage Overview in Keller
| Characteristic | Without Mortgage | With Mortgage |
| Housing Units | 3,713 | 9,601 |
| Median Property Value | $459,100 | $493,900 |
| Median Household Income | $143,686 | $6,457 |
| Monthly Housing Costs | $1,248 | $5,097 |
| Real Estate Taxes | $8,018 | $144 |
Property Value by Mortgage Status in Keller
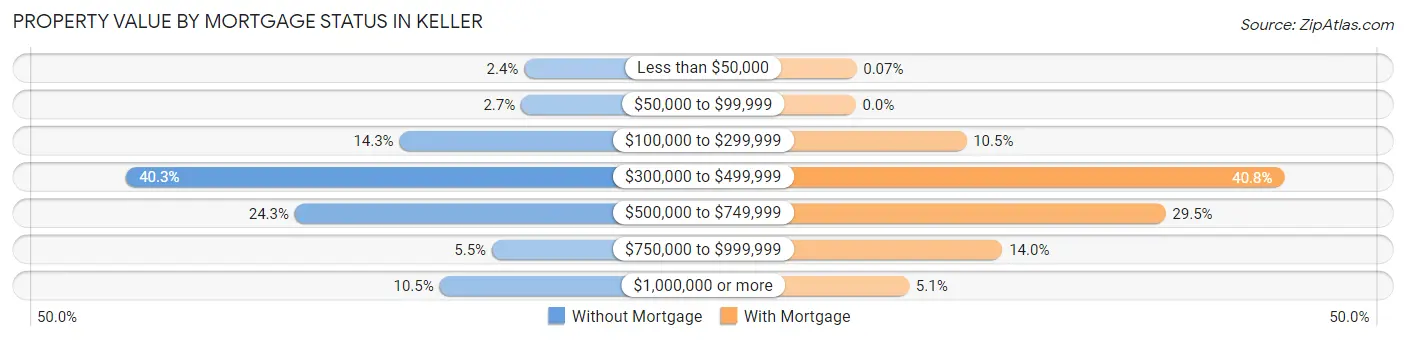
| Property Value | Without Mortgage | With Mortgage |
| Less than $50,000 | 90 (2.4%) | 7 (0.1%) |
| $50,000 to $99,999 | 101 (2.7%) | 0 (0.0%) |
| $100,000 to $299,999 | 531 (14.3%) | 1,012 (10.5%) |
| $300,000 to $499,999 | 1,497 (40.3%) | 3,920 (40.8%) |
| $500,000 to $749,999 | 901 (24.3%) | 2,833 (29.5%) |
| $750,000 to $999,999 | 204 (5.5%) | 1,341 (14.0%) |
| $1,000,000 or more | 389 (10.5%) | 488 (5.1%) |
| Total | 3,713 (100.0%) | 9,601 (100.0%) |
Household Income by Mortgage Status in Keller
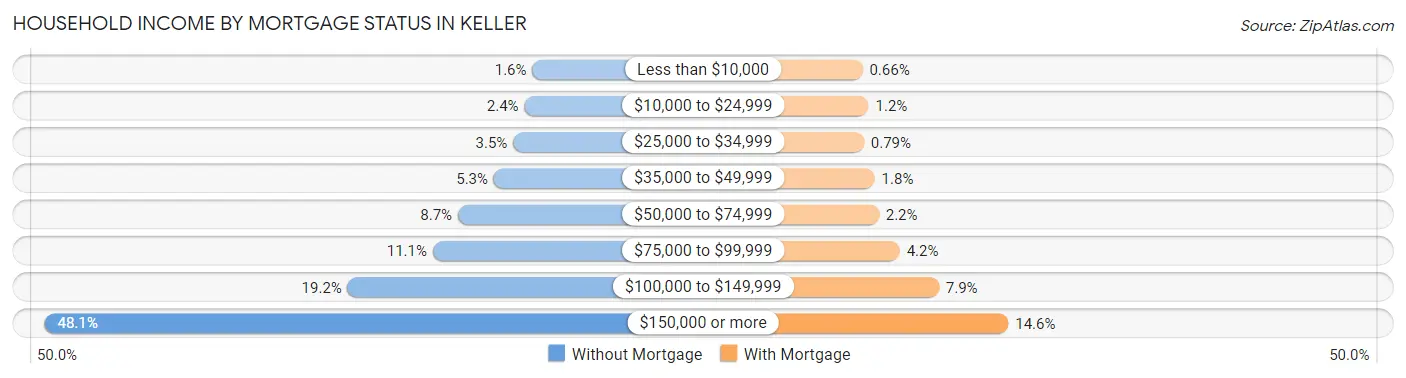
| Household Income | Without Mortgage | With Mortgage |
| Less than $10,000 | 61 (1.6%) | 63 (0.7%) |
| $10,000 to $24,999 | 89 (2.4%) | 119 (1.2%) |
| $25,000 to $34,999 | 129 (3.5%) | 76 (0.8%) |
| $35,000 to $49,999 | 197 (5.3%) | 175 (1.8%) |
| $50,000 to $74,999 | 324 (8.7%) | 212 (2.2%) |
| $75,000 to $99,999 | 413 (11.1%) | 404 (4.2%) |
| $100,000 to $149,999 | 714 (19.2%) | 761 (7.9%) |
| $150,000 or more | 1,786 (48.1%) | 1,397 (14.5%) |
| Total | 3,713 (100.0%) | 9,601 (100.0%) |
Property Value to Household Income Ratio in Keller
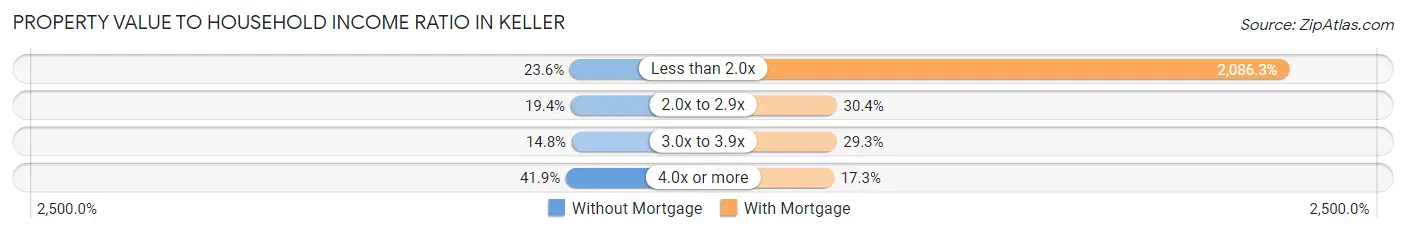
| Value-to-Income Ratio | Without Mortgage | With Mortgage |
| Less than 2.0x | 876 (23.6%) | 200,306 (2,086.3%) |
| 2.0x to 2.9x | 720 (19.4%) | 2,920 (30.4%) |
| 3.0x to 3.9x | 550 (14.8%) | 2,808 (29.2%) |
| 4.0x or more | 1,557 (41.9%) | 1,658 (17.3%) |
| Total | 3,713 (100.0%) | 9,601 (100.0%) |
Real Estate Taxes by Mortgage Status in Keller
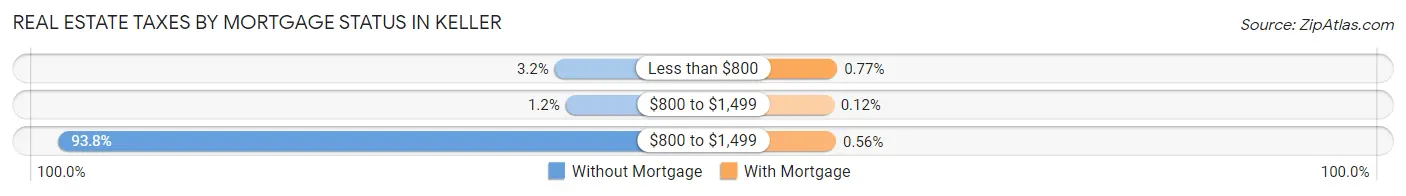
| Property Taxes | Without Mortgage | With Mortgage |
| Less than $800 | 119 (3.2%) | 74 (0.8%) |
| $800 to $1,499 | 44 (1.2%) | 12 (0.1%) |
| $800 to $1,499 | 3,484 (93.8%) | 54 (0.6%) |
| Total | 3,713 (100.0%) | 9,601 (100.0%) |
Health & Disability in Keller
Health Insurance Coverage by Age in Keller
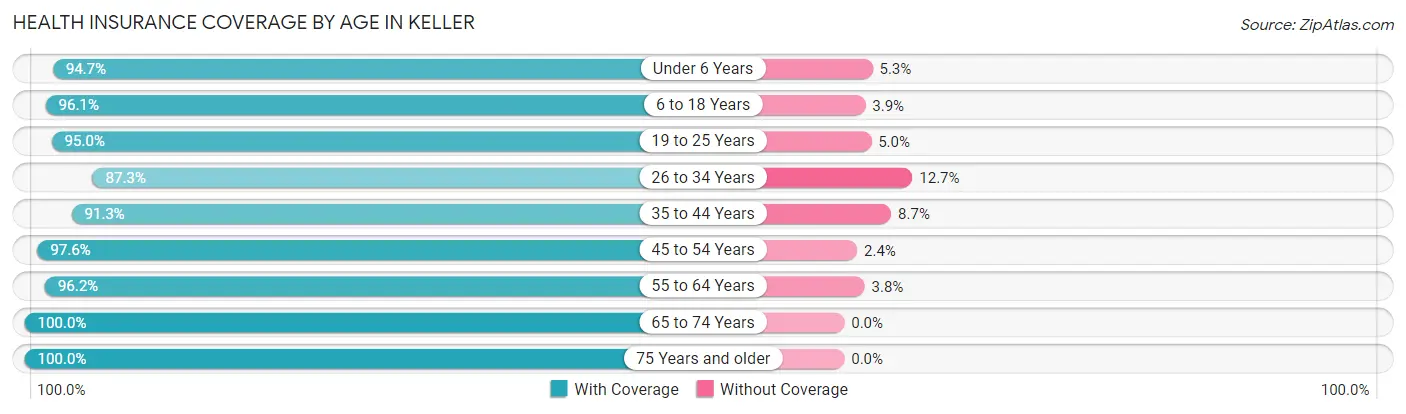
| Age Bracket | With Coverage | Without Coverage |
| Under 6 Years | 2,604 (94.7%) | 145 (5.3%) |
| 6 to 18 Years | 9,712 (96.1%) | 396 (3.9%) |
| 19 to 25 Years | 2,026 (95.0%) | 107 (5.0%) |
| 26 to 34 Years | 2,676 (87.3%) | 389 (12.7%) |
| 35 to 44 Years | 5,034 (91.3%) | 482 (8.7%) |
| 45 to 54 Years | 7,547 (97.6%) | 185 (2.4%) |
| 55 to 64 Years | 6,646 (96.2%) | 262 (3.8%) |
| 65 to 74 Years | 3,934 (100.0%) | 0 (0.0%) |
| 75 Years and older | 2,804 (100.0%) | 0 (0.0%) |
| Total | 42,983 (95.6%) | 1,966 (4.4%) |
Health Insurance Coverage by Citizenship Status in Keller

| Citizenship Status | With Coverage | Without Coverage |
| Native Born | 2,604 (94.7%) | 145 (5.3%) |
| Foreign Born, Citizen | 9,712 (96.1%) | 396 (3.9%) |
| Foreign Born, not a Citizen | 2,026 (95.0%) | 107 (5.0%) |
Health Insurance Coverage by Household Income in Keller
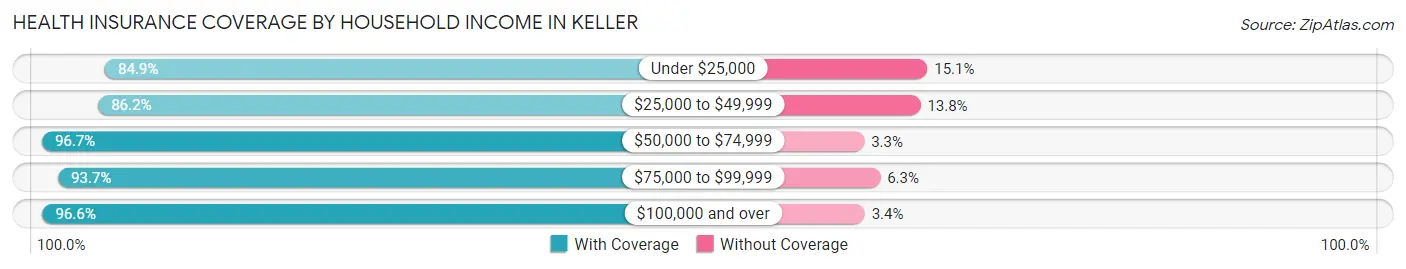
| Household Income | With Coverage | Without Coverage |
| Under $25,000 | 1,098 (84.9%) | 195 (15.1%) |
| $25,000 to $49,999 | 1,768 (86.2%) | 283 (13.8%) |
| $50,000 to $74,999 | 2,434 (96.7%) | 82 (3.3%) |
| $75,000 to $99,999 | 3,011 (93.7%) | 201 (6.3%) |
| $100,000 and over | 34,665 (96.6%) | 1,205 (3.4%) |
Public vs Private Health Insurance Coverage by Age in Keller
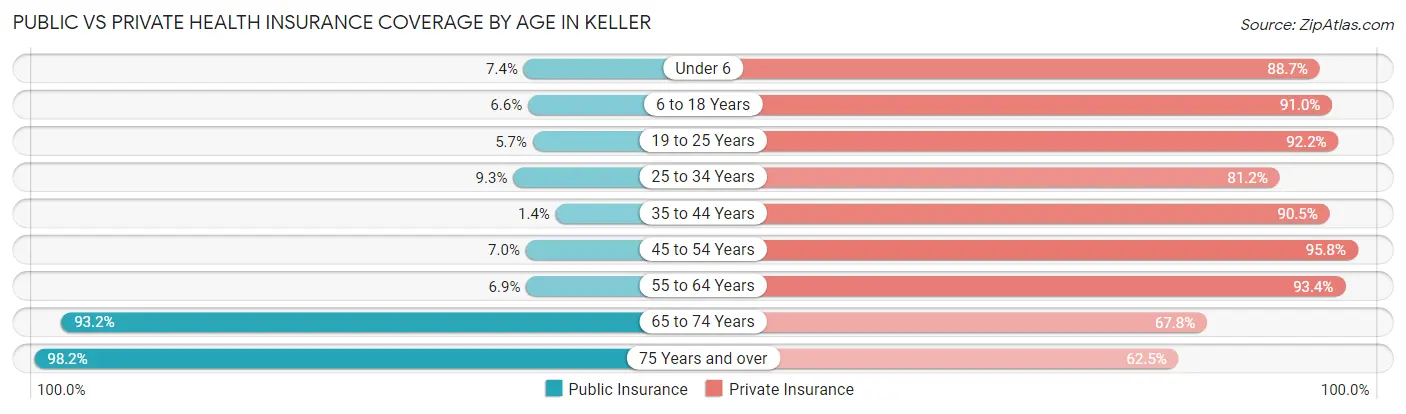
| Age Bracket | Public Insurance | Private Insurance |
| Under 6 | 202 (7.3%) | 2,438 (88.7%) |
| 6 to 18 Years | 663 (6.6%) | 9,199 (91.0%) |
| 19 to 25 Years | 121 (5.7%) | 1,966 (92.2%) |
| 25 to 34 Years | 285 (9.3%) | 2,490 (81.2%) |
| 35 to 44 Years | 79 (1.4%) | 4,994 (90.5%) |
| 45 to 54 Years | 540 (7.0%) | 7,405 (95.8%) |
| 55 to 64 Years | 476 (6.9%) | 6,454 (93.4%) |
| 65 to 74 Years | 3,666 (93.2%) | 2,667 (67.8%) |
| 75 Years and over | 2,753 (98.2%) | 1,753 (62.5%) |
| Total | 8,785 (19.5%) | 39,366 (87.6%) |
Disability Status by Sex by Age in Keller
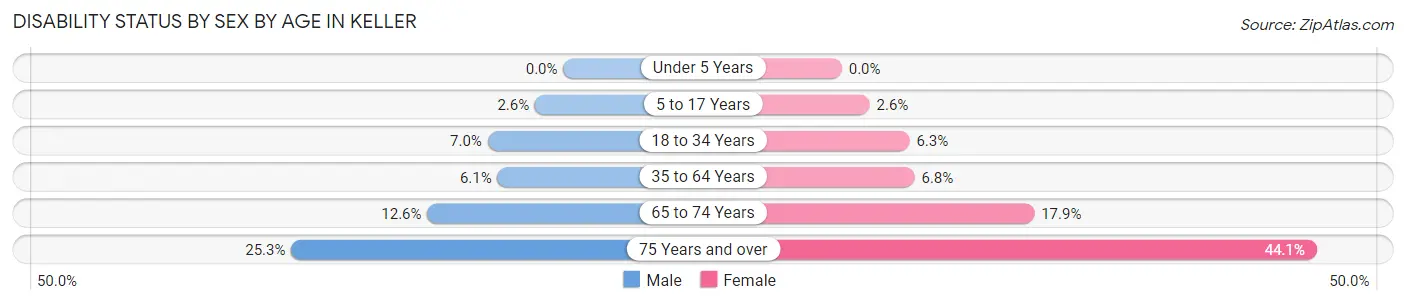
| Age Bracket | Male | Female |
| Under 5 Years | 0 (0.0%) | 0 (0.0%) |
| 5 to 17 Years | 133 (2.6%) | 123 (2.6%) |
| 18 to 34 Years | 221 (7.0%) | 179 (6.3%) |
| 35 to 64 Years | 609 (6.1%) | 688 (6.8%) |
| 65 to 74 Years | 245 (12.6%) | 356 (17.9%) |
| 75 Years and over | 307 (25.3%) | 700 (44.1%) |
Disability Class by Sex by Age in Keller
Disability Class: Hearing Difficulty
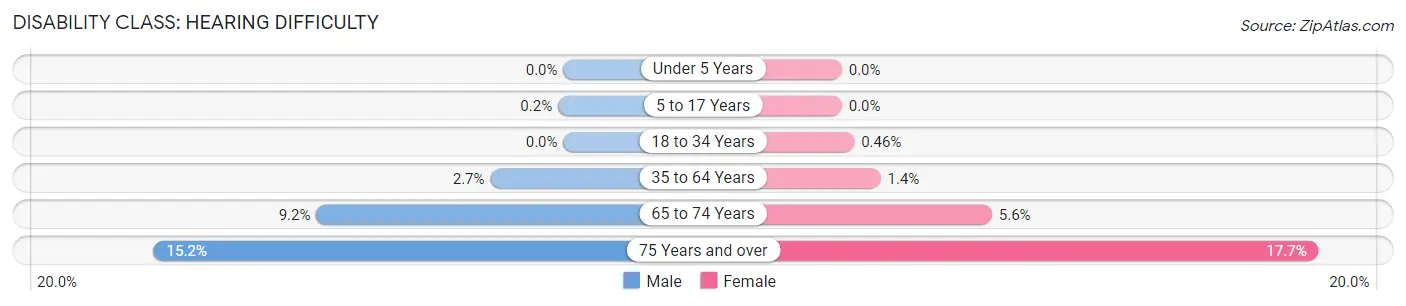
| Age Bracket | Male | Female |
| Under 5 Years | 0 (0.0%) | 0 (0.0%) |
| 5 to 17 Years | 10 (0.2%) | 0 (0.0%) |
| 18 to 34 Years | 0 (0.0%) | 13 (0.5%) |
| 35 to 64 Years | 270 (2.7%) | 147 (1.4%) |
| 65 to 74 Years | 178 (9.2%) | 111 (5.6%) |
| 75 Years and over | 185 (15.2%) | 281 (17.7%) |
Disability Class: Vision Difficulty
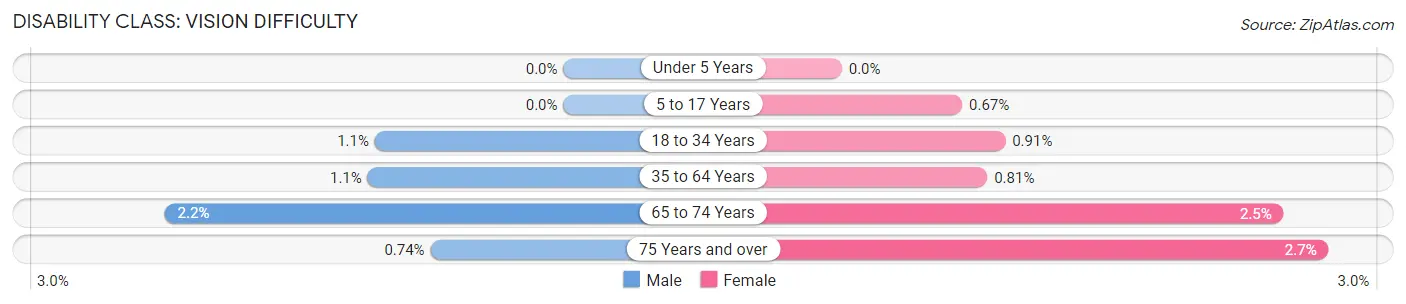
| Age Bracket | Male | Female |
| Under 5 Years | 0 (0.0%) | 0 (0.0%) |
| 5 to 17 Years | 0 (0.0%) | 32 (0.7%) |
| 18 to 34 Years | 33 (1.1%) | 26 (0.9%) |
| 35 to 64 Years | 109 (1.1%) | 83 (0.8%) |
| 65 to 74 Years | 43 (2.2%) | 49 (2.5%) |
| 75 Years and over | 9 (0.7%) | 43 (2.7%) |
Disability Class: Cognitive Difficulty
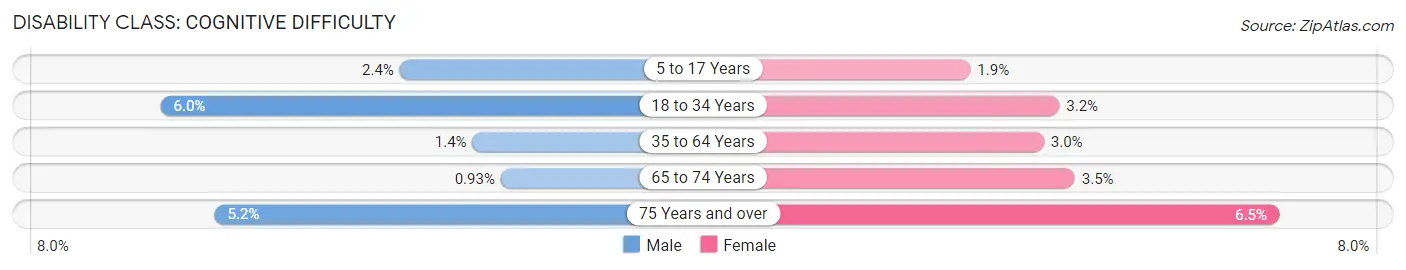
| Age Bracket | Male | Female |
| 5 to 17 Years | 123 (2.4%) | 91 (1.9%) |
| 18 to 34 Years | 188 (6.0%) | 92 (3.2%) |
| 35 to 64 Years | 134 (1.3%) | 306 (3.0%) |
| 65 to 74 Years | 18 (0.9%) | 69 (3.5%) |
| 75 Years and over | 63 (5.2%) | 103 (6.5%) |
Disability Class: Ambulatory Difficulty
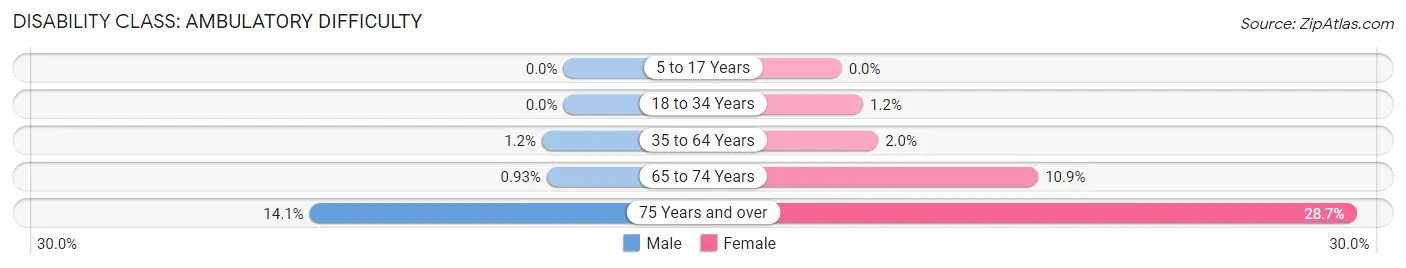
| Age Bracket | Male | Female |
| 5 to 17 Years | 0 (0.0%) | 0 (0.0%) |
| 18 to 34 Years | 0 (0.0%) | 34 (1.2%) |
| 35 to 64 Years | 120 (1.2%) | 207 (2.0%) |
| 65 to 74 Years | 18 (0.9%) | 218 (10.9%) |
| 75 Years and over | 172 (14.1%) | 455 (28.6%) |
Disability Class: Self-Care Difficulty
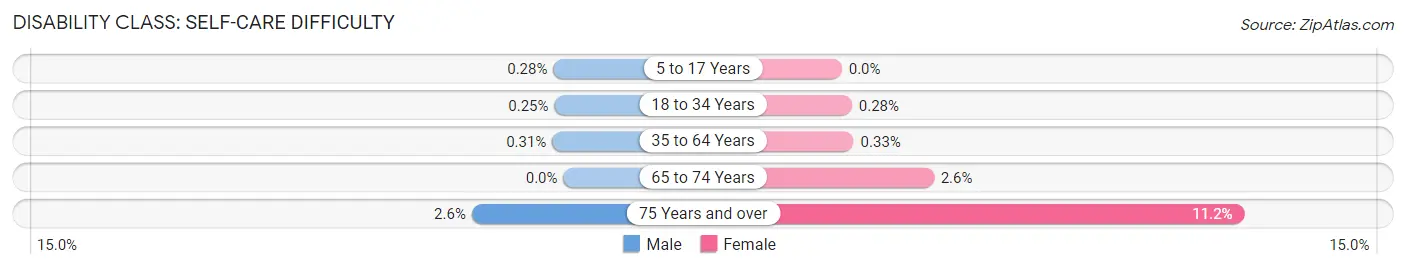
| Age Bracket | Male | Female |
| 5 to 17 Years | 14 (0.3%) | 0 (0.0%) |
| 18 to 34 Years | 8 (0.3%) | 8 (0.3%) |
| 35 to 64 Years | 31 (0.3%) | 34 (0.3%) |
| 65 to 74 Years | 0 (0.0%) | 51 (2.6%) |
| 75 Years and over | 31 (2.5%) | 178 (11.2%) |
Technology Access in Keller
Computing Device Access in Keller
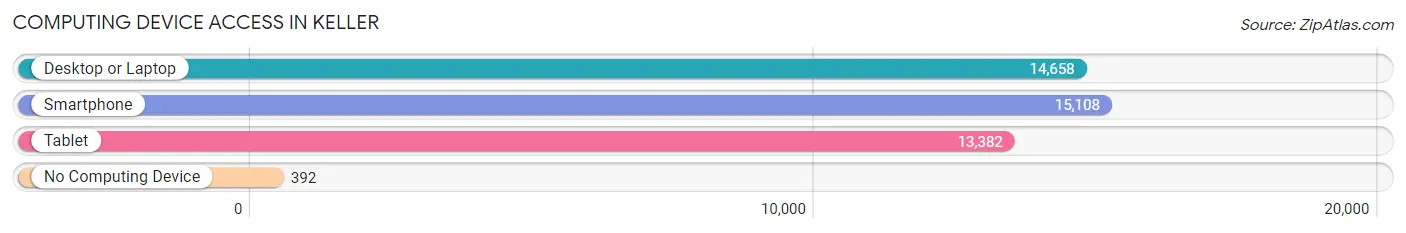
| Device Type | # Households | % Households |
| Desktop or Laptop | 14,658 | 91.3% |
| Smartphone | 15,108 | 94.1% |
| Tablet | 13,382 | 83.4% |
| No Computing Device | 392 | 2.4% |
| Total | 16,052 | 100.0% |
Internet Access in Keller
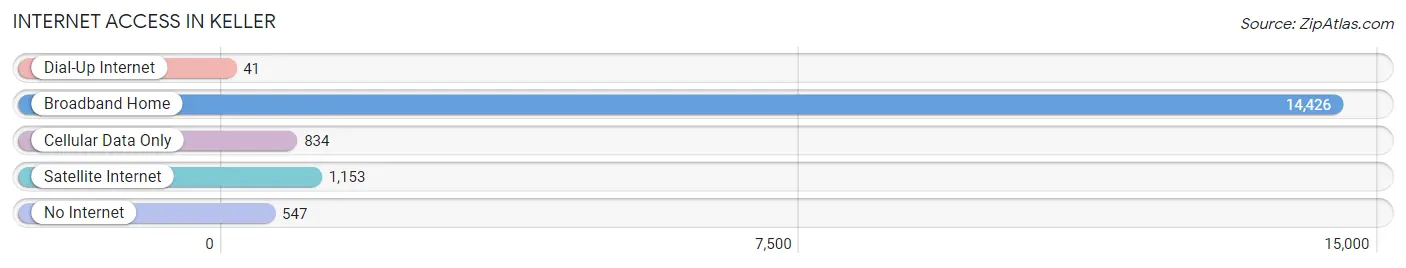
| Internet Type | # Households | % Households |
| Dial-Up Internet | 41 | 0.3% |
| Broadband Home | 14,426 | 89.9% |
| Cellular Data Only | 834 | 5.2% |
| Satellite Internet | 1,153 | 7.2% |
| No Internet | 547 | 3.4% |
| Total | 16,052 | 100.0% |
Keller Summary
Keller, Texas is a city located in Tarrant County, Texas, United States. It is part of the Dallas-Fort Worth-Arlington metropolitan area. The population was 39,627 at the 2010 census, making it the 74th most populous city in Texas.
History
Keller was founded in 1881 by John C. Keller, a German immigrant who had moved to the area from Illinois. He purchased land from the local Native Americans and began to build a small settlement. The settlement grew slowly, but by the early 1900s, it had become a thriving community. The town was officially incorporated in 1909 and was named after its founder.
In the early 20th century, Keller was a small farming community, but it began to grow rapidly in the 1950s and 1960s as the Dallas-Fort Worth area experienced a population boom. The city was annexed by the City of Fort Worth in 1969, and it has continued to grow since then.
Geography
Keller is located in Tarrant County, Texas, about 25 miles northwest of downtown Dallas. It is situated on the western edge of the Dallas-Fort Worth metropolitan area. The city covers an area of approximately 20 square miles and is bordered by the cities of Fort Worth, Roanoke, and Westlake.
Keller is located in the Blackland Prairie region of Texas, which is characterized by rolling hills and fertile soil. The city is home to several parks and recreational areas, including Keller Park, Keller Sports Park, and Keller Pointe.
Economy
Keller is a major economic center in the Dallas-Fort Worth area. The city is home to several large employers, including the headquarters of RadioShack, Pier 1 Imports, and the Texas Health Resources. The city also has a thriving retail sector, with several shopping centers and malls located in the area.
Keller is also home to several major educational institutions, including the University of Texas at Arlington, Texas Christian University, and the University of North Texas. The city is also home to several major medical centers, including Texas Health Harris Methodist Hospital and Baylor Scott & White Medical Center.
Demographics
As of the 2010 census, the population of Keller was 39,627. The racial makeup of the city was 79.3% White, 8.2% African American, 0.4% Native American, 5.2% Asian, and 4.7% from other races. Hispanic or Latino of any race were 15.2% of the population.
The median household income in Keller was $76,845 in 2019, and the median home value was $269,400. The city has a low unemployment rate of 3.2%, and the poverty rate is 6.2%.
Keller is a diverse city, with a variety of religious and cultural backgrounds represented. The city is home to several churches, including the First United Methodist Church, the Church of Jesus Christ of Latter-day Saints, and the Church of the Nazarene. The city also has a large Jewish population, with several synagogues located in the area.
Common Questions
What is Per Capita Income in Keller?
Per Capita income in Keller is $72,994.
What is the Median Family Income in Keller?
Median Family Income in Keller is $184,459.
What is the Median Household income in Keller?
Median Household Income in Keller is $162,094.
What is Income or Wage Gap in Keller?
Income or Wage Gap in Keller is 54.5%.
Women in Keller earn 45.5 cents for every dollar earned by a man.
What is Family Income Deficit in Keller?
Family Income Deficit in Keller is $6,944.
Families that are below poverty line in Keller earn $6,944 less on average than the poverty threshold level.
What is Inequality or Gini Index in Keller?
Inequality or Gini Index in Keller is 0.42.
What is the Total Population of Keller?
Total Population of Keller is 45,320.
What is the Total Male Population of Keller?
Total Male Population of Keller is 22,576.
What is the Total Female Population of Keller?
Total Female Population of Keller is 22,744.
What is the Ratio of Males per 100 Females in Keller?
There are 99.26 Males per 100 Females in Keller.
What is the Ratio of Females per 100 Males in Keller?
There are 100.74 Females per 100 Males in Keller.
What is the Median Population Age in Keller?
Median Population Age in Keller is 43.3 Years.
What is the Average Family Size in Keller
Average Family Size in Keller is 3.2 People.
What is the Average Household Size in Keller
Average Household Size in Keller is 2.8 People.
How Large is the Labor Force in Keller?
There are 23,336 People in the Labor Forcein in Keller.
What is the Percentage of People in the Labor Force in Keller?
66.5% of People are in the Labor Force in Keller.
What is the Unemployment Rate in Keller?
Unemployment Rate in Keller is 3.0%.