Crosbyton, TX Map & Demographics
Crosbyton Map
Crosbyton Overview
$35,177
PER CAPITA INCOME
$61,058
AVG FAMILY INCOME
$47,083
AVG HOUSEHOLD INCOME
18.2%
WAGE / INCOME GAP [ % ]
81.8¢/ $1
WAGE / INCOME GAP [ $ ]
0.64
INEQUALITY / GINI INDEX
1,657
TOTAL POPULATION
828
MALE POPULATION
829
FEMALE POPULATION
99.88
MALES / 100 FEMALES
100.12
FEMALES / 100 MALES
39.1
MEDIAN AGE
3.0
AVG FAMILY SIZE
2.5
AVG HOUSEHOLD SIZE
665
LABOR FORCE [ PEOPLE ]
52.7%
PERCENT IN LABOR FORCE
7.5%
UNEMPLOYMENT RATE
Crosbyton Zip Codes
Crosbyton Area Codes
Income in Crosbyton
Income Overview in Crosbyton
Per Capita Income in Crosbyton is $35,177, while median incomes of families and households are $61,058 and $47,083 respectively.
| Characteristic | Number | Measure |
| Per Capita Income | 1,657 | $35,177 |
| Median Family Income | 437 | $61,058 |
| Mean Family Income | 437 | $120,935 |
| Median Household Income | 634 | $47,083 |
| Mean Household Income | 634 | $91,567 |
| Income Deficit | 437 | $0 |
| Wage / Income Gap (%) | 1,657 | 18.23% |
| Wage / Income Gap ($) | 1,657 | 81.77¢ per $1 |
| Gini / Inequality Index | 1,657 | 0.64 |
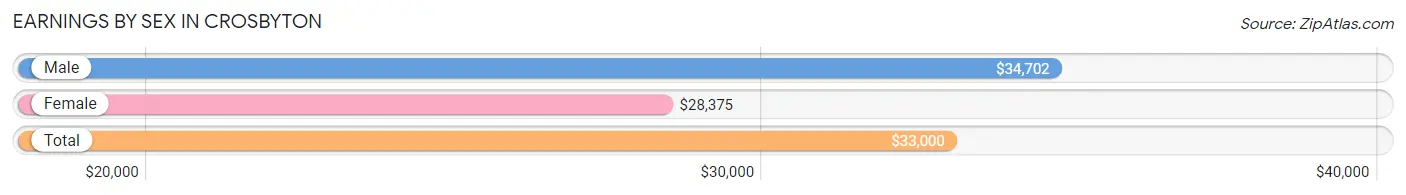
Earnings by Sex in Crosbyton
Average Earnings in Crosbyton are $33,000, $34,702 for men and $28,375 for women, a difference of 18.2%.
| Sex | Number | Average Earnings |
| Male | 399 (56.8%) | $34,702 |
| Female | 303 (43.2%) | $28,375 |
| Total | 702 (100.0%) | $33,000 |
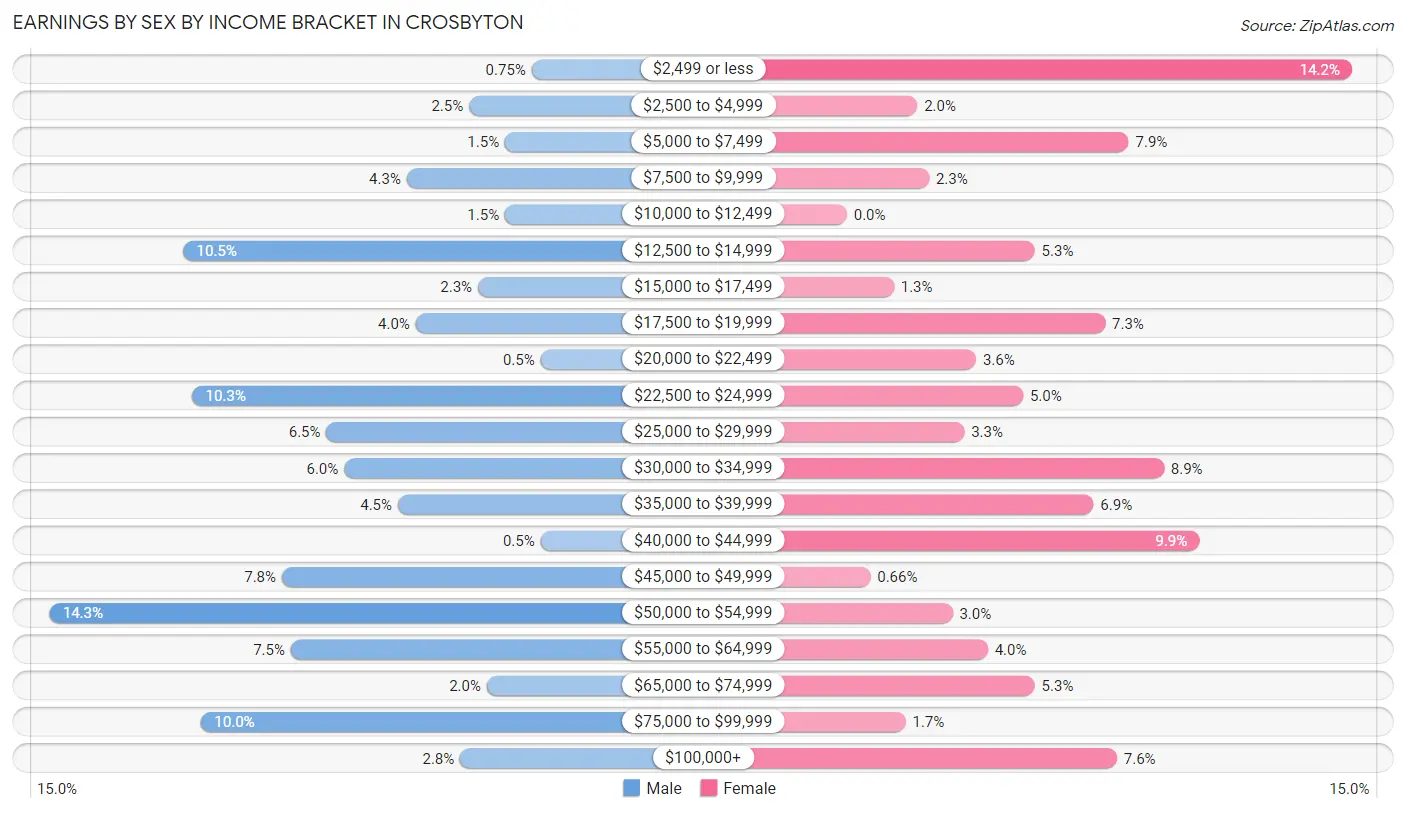
Earnings by Sex by Income Bracket in Crosbyton
The most common earnings brackets in Crosbyton are $50,000 to $54,999 for men (57 | 14.3%) and $2,499 or less for women (43 | 14.2%).
| Income | Male | Female |
| $2,499 or less | 3 (0.7%) | 43 (14.2%) |
| $2,500 to $4,999 | 10 (2.5%) | 6 (2.0%) |
| $5,000 to $7,499 | 6 (1.5%) | 24 (7.9%) |
| $7,500 to $9,999 | 17 (4.3%) | 7 (2.3%) |
| $10,000 to $12,499 | 6 (1.5%) | 0 (0.0%) |
| $12,500 to $14,999 | 42 (10.5%) | 16 (5.3%) |
| $15,000 to $17,499 | 9 (2.3%) | 4 (1.3%) |
| $17,500 to $19,999 | 16 (4.0%) | 22 (7.3%) |
| $20,000 to $22,499 | 2 (0.5%) | 11 (3.6%) |
| $22,500 to $24,999 | 41 (10.3%) | 15 (5.0%) |
| $25,000 to $29,999 | 26 (6.5%) | 10 (3.3%) |
| $30,000 to $34,999 | 24 (6.0%) | 27 (8.9%) |
| $35,000 to $39,999 | 18 (4.5%) | 21 (6.9%) |
| $40,000 to $44,999 | 2 (0.5%) | 30 (9.9%) |
| $45,000 to $49,999 | 31 (7.8%) | 2 (0.7%) |
| $50,000 to $54,999 | 57 (14.3%) | 9 (3.0%) |
| $55,000 to $64,999 | 30 (7.5%) | 12 (4.0%) |
| $65,000 to $74,999 | 8 (2.0%) | 16 (5.3%) |
| $75,000 to $99,999 | 40 (10.0%) | 5 (1.7%) |
| $100,000+ | 11 (2.8%) | 23 (7.6%) |
| Total | 399 (100.0%) | 303 (100.0%) |
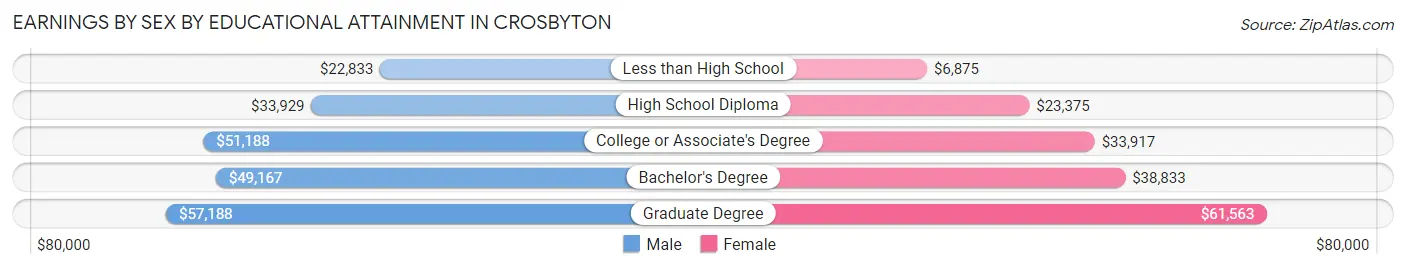
Earnings by Sex by Educational Attainment in Crosbyton
Average earnings in Crosbyton are $37,292 for men and $24,583 for women, a difference of 34.1%. Men with an educational attainment of graduate degree enjoy the highest average annual earnings of $57,188, while those with less than high school education earn the least with $22,833. Women with an educational attainment of graduate degree earn the most with the average annual earnings of $61,563, while those with less than high school education have the smallest earnings of $6,875.
| Educational Attainment | Male Income | Female Income |
| Less than High School | $22,833 | $6,875 |
| High School Diploma | $33,929 | $23,375 |
| College or Associate's Degree | $51,188 | $33,917 |
| Bachelor's Degree | $49,167 | $38,833 |
| Graduate Degree | $57,188 | $61,563 |
| Total | $37,292 | $24,583 |
Family Income in Crosbyton
Family Income Brackets in Crosbyton
According to the Crosbyton family income data, there are 84 families falling into the $50,000 to $74,999 income range, which is the most common income bracket and makes up 19.2% of all families. Conversely, the less than $10,000 income bracket is the least frequent group with only 4 families (0.9%) belonging to this category.
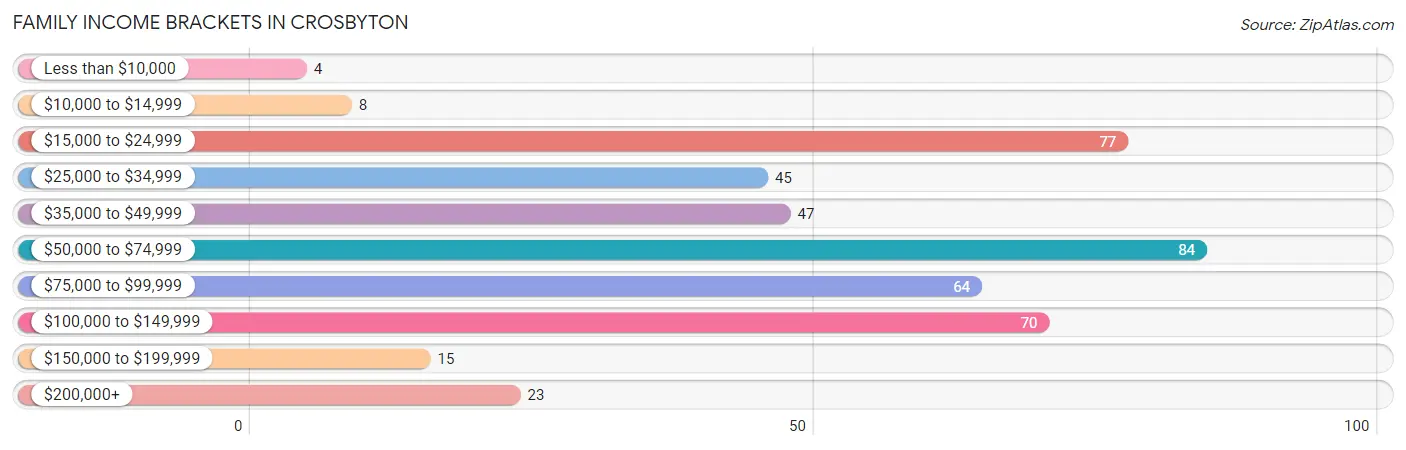
| Income Bracket | # Families | % Families |
| Less than $10,000 | 4 | 0.9% |
| $10,000 to $14,999 | 8 | 1.8% |
| $15,000 to $24,999 | 77 | 17.6% |
| $25,000 to $34,999 | 45 | 10.3% |
| $35,000 to $49,999 | 47 | 10.8% |
| $50,000 to $74,999 | 84 | 19.2% |
| $75,000 to $99,999 | 64 | 14.6% |
| $100,000 to $149,999 | 70 | 16.0% |
| $150,000 to $199,999 | 15 | 3.4% |
| $200,000+ | 23 | 5.3% |
Family Income by Famaliy Size in Crosbyton
5-person families (72 | 16.5%) account for the highest median family income in Crosbyton with $73,000 per family, while 2-person families (212 | 48.5%) have the highest median income of $21,875 per family member.
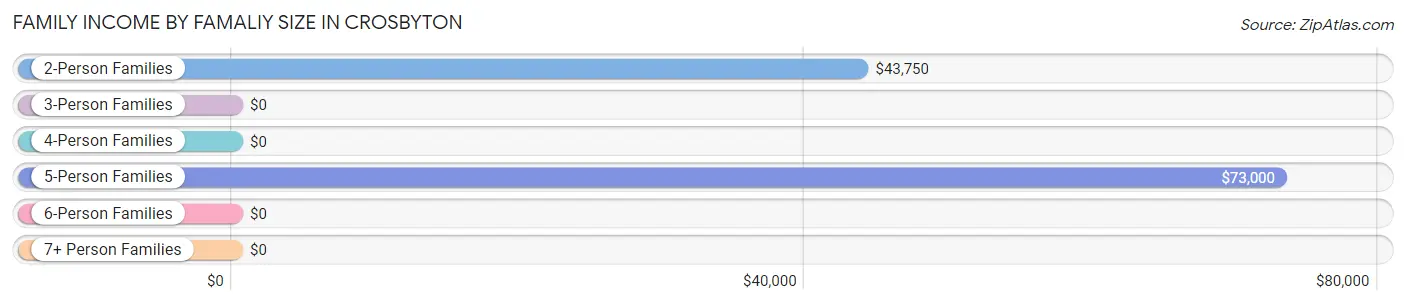
| Income Bracket | # Families | Median Income |
| 2-Person Families | 212 (48.5%) | $43,750 |
| 3-Person Families | 64 (14.6%) | $0 |
| 4-Person Families | 60 (13.7%) | $0 |
| 5-Person Families | 72 (16.5%) | $73,000 |
| 6-Person Families | 27 (6.2%) | $0 |
| 7+ Person Families | 2 (0.5%) | $0 |
| Total | 437 (100.0%) | $61,058 |
Family Income by Number of Earners in Crosbyton
The median family income in Crosbyton is $61,058, with families comprising 3+ earners (35) having the highest median family income of $105,966, while families with no earners (87) have the lowest median family income of $27,596, accounting for 8.0% and 19.9% of families, respectively.
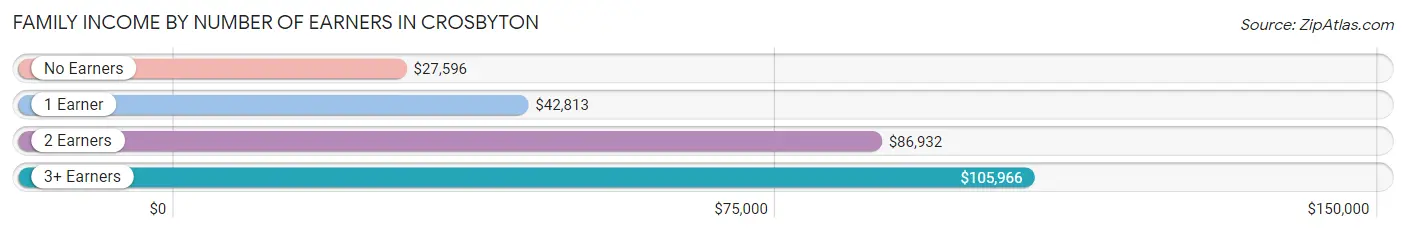
| Number of Earners | # Families | Median Income |
| No Earners | 87 (19.9%) | $27,596 |
| 1 Earner | 130 (29.7%) | $42,813 |
| 2 Earners | 185 (42.3%) | $86,932 |
| 3+ Earners | 35 (8.0%) | $105,966 |
| Total | 437 (100.0%) | $61,058 |
Household Income in Crosbyton
Household Income Brackets in Crosbyton
With 103 households falling in the category, the $50,000 to $74,999 income range is the most frequent in Crosbyton, accounting for 16.3% of all households. In contrast, only 13 households (2.1%) fall into the $150,000 to $199,999 income bracket, making it the least populous group.
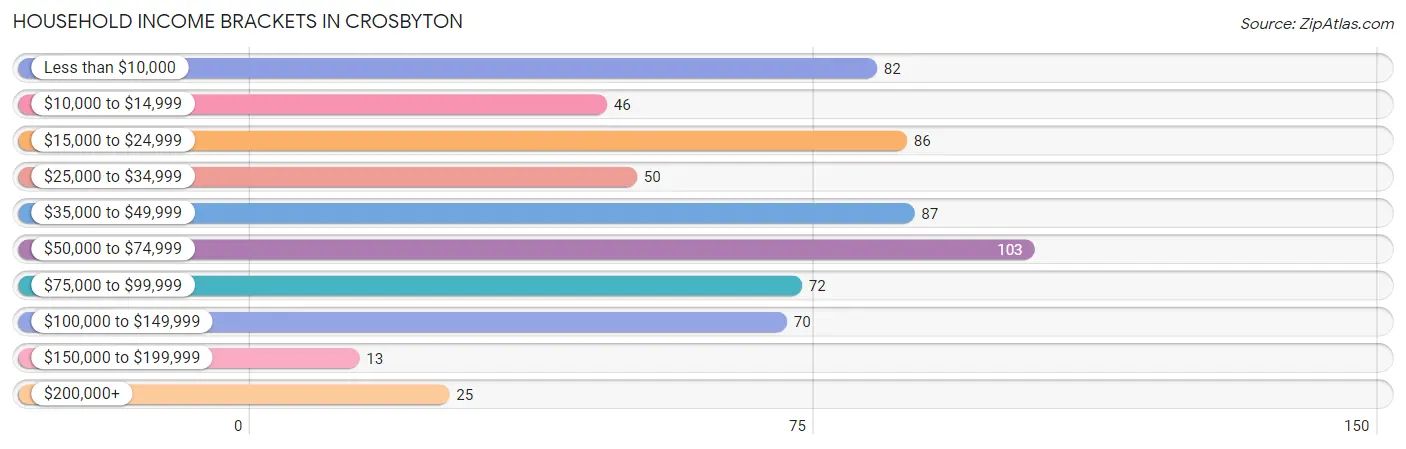
| Income Bracket | # Households | % Households |
| Less than $10,000 | 82 | 12.9% |
| $10,000 to $14,999 | 46 | 7.3% |
| $15,000 to $24,999 | 86 | 13.6% |
| $25,000 to $34,999 | 50 | 7.9% |
| $35,000 to $49,999 | 87 | 13.7% |
| $50,000 to $74,999 | 103 | 16.2% |
| $75,000 to $99,999 | 72 | 11.4% |
| $100,000 to $149,999 | 70 | 11.0% |
| $150,000 to $199,999 | 13 | 2.1% |
| $200,000+ | 25 | 3.9% |
Household Income by Householder Age in Crosbyton
The median household income in Crosbyton is $47,083, with the highest median household income of $62,019 found in the 45 to 64 years age bracket for the primary householder. A total of 285 households (45.0%) fall into this category. Meanwhile, the 15 to 24 years age bracket for the primary householder has the lowest median household income of $0, with 24 households (3.8%) in this group.
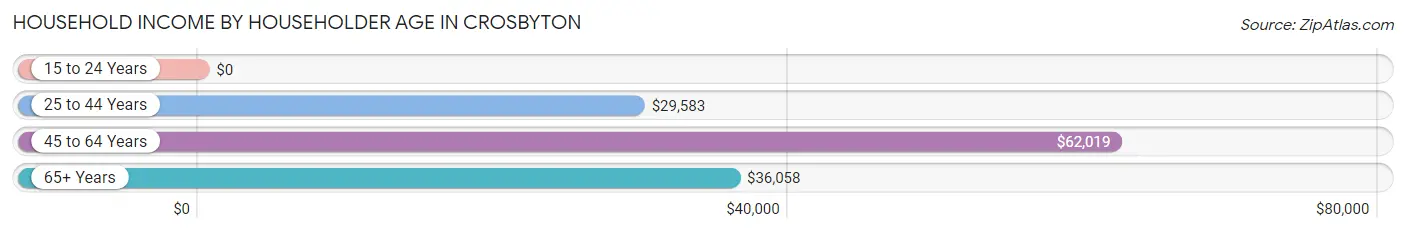
| Income Bracket | # Households | Median Income |
| 15 to 24 Years | 24 (3.8%) | $0 |
| 25 to 44 Years | 162 (25.6%) | $29,583 |
| 45 to 64 Years | 285 (45.0%) | $62,019 |
| 65+ Years | 163 (25.7%) | $36,058 |
| Total | 634 (100.0%) | $47,083 |
Poverty in Crosbyton
Income Below Poverty by Sex and Age in Crosbyton
With 21.7% poverty level for males and 31.2% for females among the residents of Crosbyton, 15 year old males and 25 to 34 year old females are the most vulnerable to poverty, with 8 males (100.0%) and 43 females (51.2%) in their respective age groups living below the poverty level.
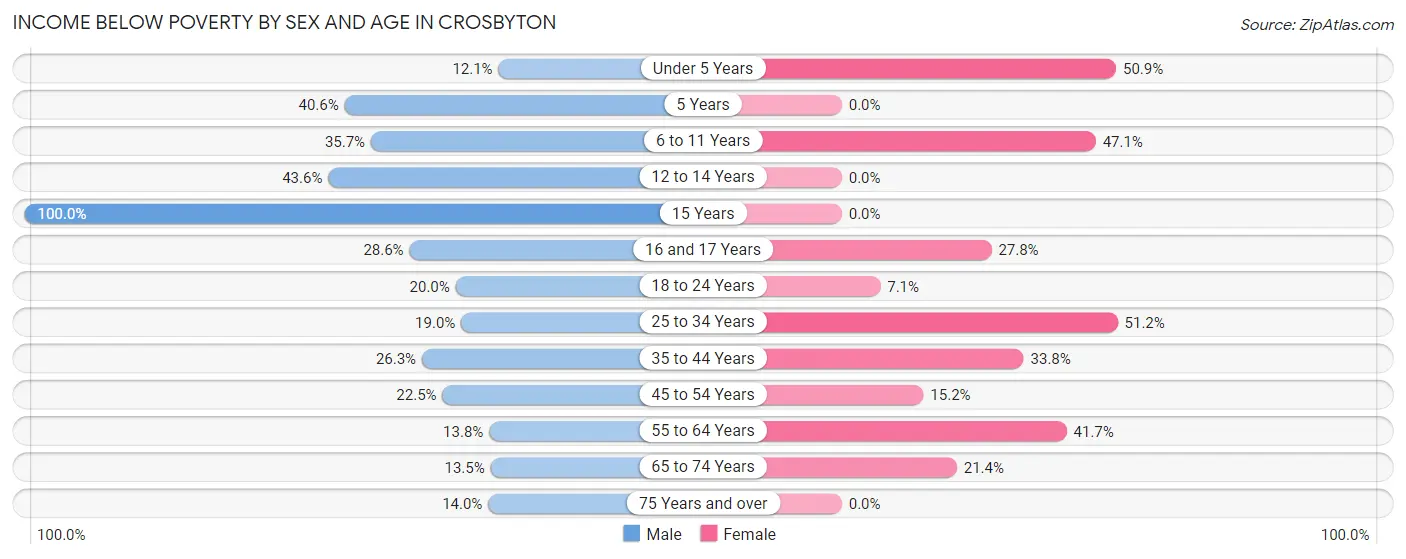
| Age Bracket | Male | Female |
| Under 5 Years | 10 (12.0%) | 28 (50.9%) |
| 5 Years | 13 (40.6%) | 0 (0.0%) |
| 6 to 11 Years | 10 (35.7%) | 41 (47.1%) |
| 12 to 14 Years | 24 (43.6%) | 0 (0.0%) |
| 15 Years | 8 (100.0%) | 0 (0.0%) |
| 16 and 17 Years | 2 (28.6%) | 5 (27.8%) |
| 18 to 24 Years | 16 (20.0%) | 3 (7.1%) |
| 25 to 34 Years | 22 (19.0%) | 43 (51.2%) |
| 35 to 44 Years | 21 (26.3%) | 27 (33.8%) |
| 45 to 54 Years | 11 (22.5%) | 10 (15.1%) |
| 55 to 64 Years | 19 (13.8%) | 73 (41.7%) |
| 65 to 74 Years | 10 (13.5%) | 19 (21.3%) |
| 75 Years and over | 6 (14.0%) | 0 (0.0%) |
| Total | 172 (21.7%) | 249 (31.2%) |
Income Above Poverty by Sex and Age in Crosbyton
According to the poverty statistics in Crosbyton, males aged under 5 years and females aged 5 years are the age groups that are most secure financially, with 87.9% of males and 100.0% of females in these age groups living above the poverty line.
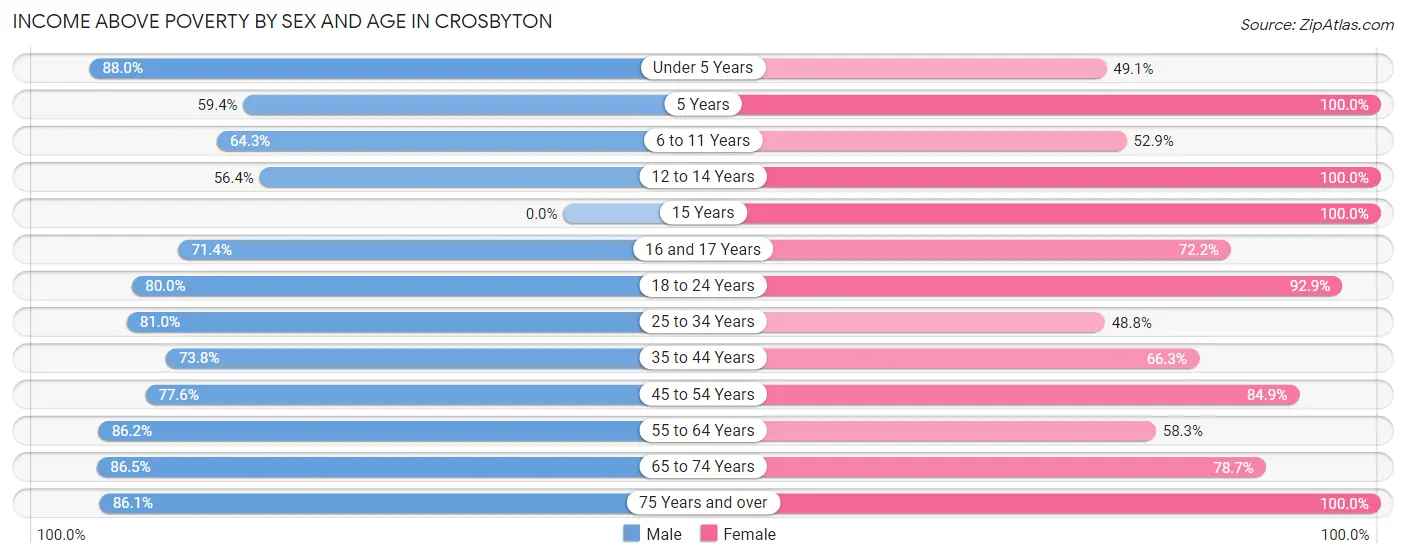
| Age Bracket | Male | Female |
| Under 5 Years | 73 (87.9%) | 27 (49.1%) |
| 5 Years | 19 (59.4%) | 12 (100.0%) |
| 6 to 11 Years | 18 (64.3%) | 46 (52.9%) |
| 12 to 14 Years | 31 (56.4%) | 18 (100.0%) |
| 15 Years | 0 (0.0%) | 6 (100.0%) |
| 16 and 17 Years | 5 (71.4%) | 13 (72.2%) |
| 18 to 24 Years | 64 (80.0%) | 39 (92.9%) |
| 25 to 34 Years | 94 (81.0%) | 41 (48.8%) |
| 35 to 44 Years | 59 (73.8%) | 53 (66.2%) |
| 45 to 54 Years | 38 (77.5%) | 56 (84.9%) |
| 55 to 64 Years | 119 (86.2%) | 102 (58.3%) |
| 65 to 74 Years | 64 (86.5%) | 70 (78.6%) |
| 75 Years and over | 37 (86.1%) | 66 (100.0%) |
| Total | 621 (78.3%) | 549 (68.8%) |
Income Below Poverty Among Married-Couple Families in Crosbyton
The poverty statistics for married-couple families in Crosbyton show that 8.6% or 24 of the total 278 families live below the poverty line. Families with 3 or 4 children have the highest poverty rate of 21.8%, comprising of 12 families. On the other hand, families with 1 or 2 children have the lowest poverty rate of 0.0%, which includes 0 families.
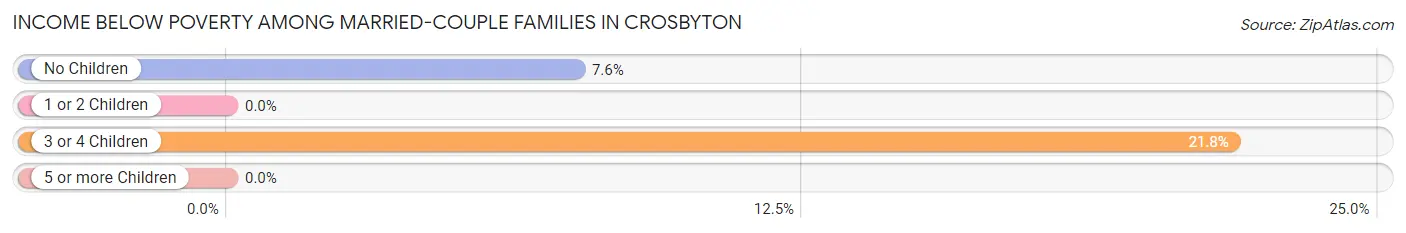
| Children | Above Poverty | Below Poverty |
| No Children | 147 (92.4%) | 12 (7.5%) |
| 1 or 2 Children | 64 (100.0%) | 0 (0.0%) |
| 3 or 4 Children | 43 (78.2%) | 12 (21.8%) |
| 5 or more Children | 0 (0.0%) | 0 (0.0%) |
| Total | 254 (91.4%) | 24 (8.6%) |
Income Below Poverty Among Single-Parent Households in Crosbyton
According to the poverty data in Crosbyton, 21.0% or 12 single-father households and 40.2% or 41 single-mother households are living below the poverty line. Among single-father households, those with 1 or 2 children have the highest poverty rate, with 12 households (22.2%) experiencing poverty. Likewise, among single-mother households, those with 3 or 4 children have the highest poverty rate, with 19 households (100.0%) falling below the poverty line.
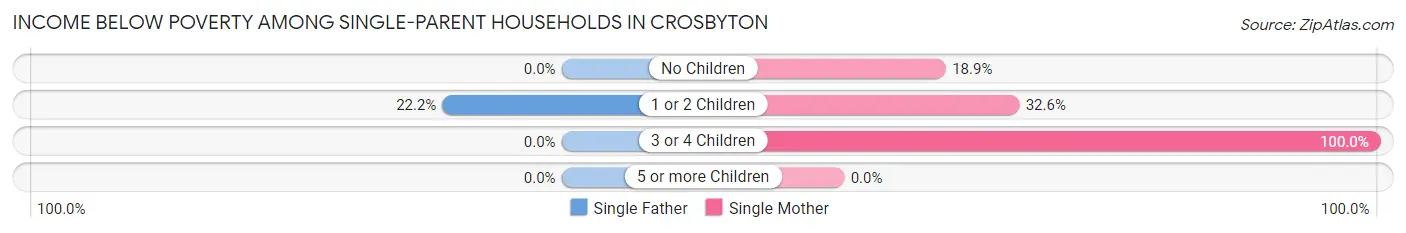
| Children | Single Father | Single Mother |
| No Children | 0 (0.0%) | 7 (18.9%) |
| 1 or 2 Children | 12 (22.2%) | 15 (32.6%) |
| 3 or 4 Children | 0 (0.0%) | 19 (100.0%) |
| 5 or more Children | 0 (0.0%) | 0 (0.0%) |
| Total | 12 (21.0%) | 41 (40.2%) |
Income Below Poverty Among Married-Couple vs Single-Parent Households in Crosbyton
The poverty data for Crosbyton shows that 24 of the married-couple family households (8.6%) and 53 of the single-parent households (33.3%) are living below the poverty level. Within the married-couple family households, those with 3 or 4 children have the highest poverty rate, with 12 households (21.8%) falling below the poverty line. Among the single-parent households, those with 3 or 4 children have the highest poverty rate, with 19 household (100.0%) living below poverty.
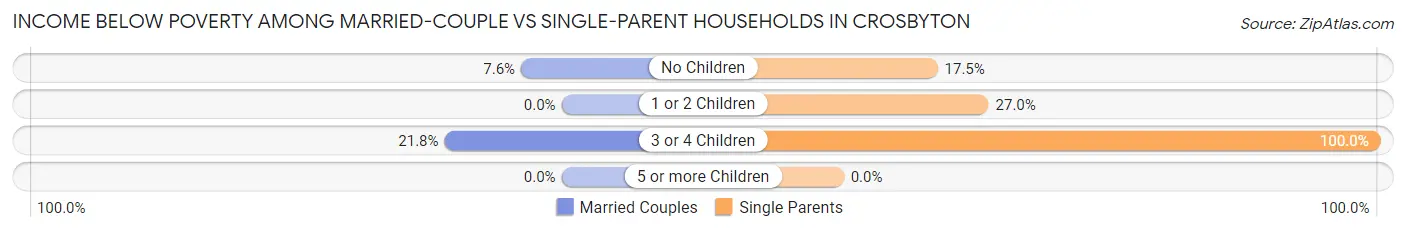
| Children | Married-Couple Families | Single-Parent Households |
| No Children | 12 (7.5%) | 7 (17.5%) |
| 1 or 2 Children | 0 (0.0%) | 27 (27.0%) |
| 3 or 4 Children | 12 (21.8%) | 19 (100.0%) |
| 5 or more Children | 0 (0.0%) | 0 (0.0%) |
| Total | 24 (8.6%) | 53 (33.3%) |
Race in Crosbyton
The most populous races in Crosbyton are Hispanic or Latino (1,092 | 65.9%), White / Caucasian (1,036 | 62.5%), and Some other Race (327 | 19.7%).
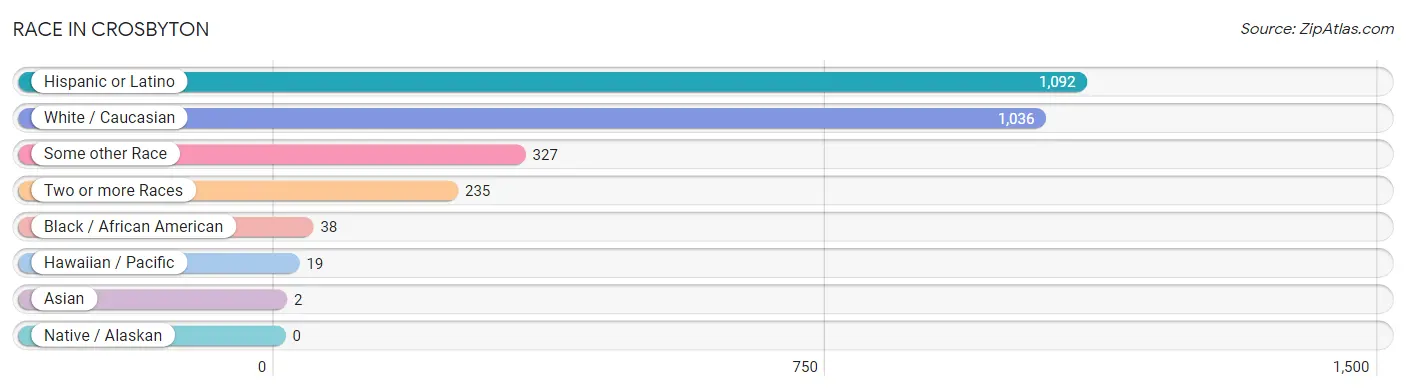
| Race | # Population | % Population |
| Asian | 2 | 0.1% |
| Black / African American | 38 | 2.3% |
| Hawaiian / Pacific | 19 | 1.1% |
| Hispanic or Latino | 1,092 | 65.9% |
| Native / Alaskan | 0 | 0.0% |
| White / Caucasian | 1,036 | 62.5% |
| Two or more Races | 235 | 14.2% |
| Some other Race | 327 | 19.7% |
| Total | 1,657 | 100.0% |
Ancestry in Crosbyton
The most populous ancestries reported in Crosbyton are Mexican (988 | 59.6%), German (89 | 5.4%), European (77 | 4.6%), English (58 | 3.5%), and Dutch (49 | 3.0%), together accounting for 76.1% of all Crosbyton residents.
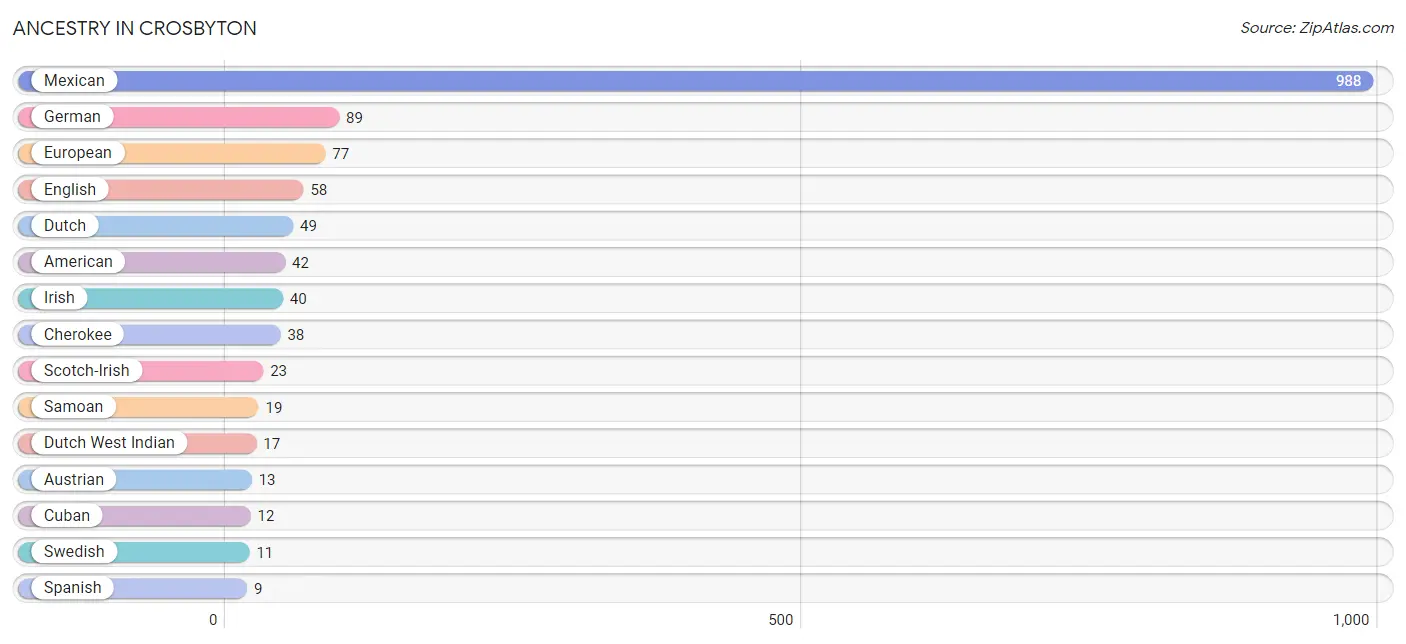
| Ancestry | # Population | % Population |
| African | 1 | 0.1% |
| American | 42 | 2.5% |
| Arab | 1 | 0.1% |
| Austrian | 13 | 0.8% |
| Blackfeet | 2 | 0.1% |
| British | 3 | 0.2% |
| Cherokee | 38 | 2.3% |
| Cuban | 12 | 0.7% |
| Dutch | 49 | 3.0% |
| Dutch West Indian | 17 | 1.0% |
| English | 58 | 3.5% |
| European | 77 | 4.6% |
| French | 5 | 0.3% |
| German | 89 | 5.4% |
| Greek | 6 | 0.4% |
| Irish | 40 | 2.4% |
| Italian | 4 | 0.2% |
| Mexican | 988 | 59.6% |
| Palestinian | 1 | 0.1% |
| Portuguese | 2 | 0.1% |
| Puerto Rican | 8 | 0.5% |
| Samoan | 19 | 1.1% |
| Scotch-Irish | 23 | 1.4% |
| Scottish | 2 | 0.1% |
| Spaniard | 5 | 0.3% |
| Spanish | 9 | 0.5% |
| Subsaharan African | 1 | 0.1% |
| Swedish | 11 | 0.7% |
| Welsh | 2 | 0.1% |
| West Indian | 1 | 0.1% | View All 30 Rows |
Immigrants in Crosbyton
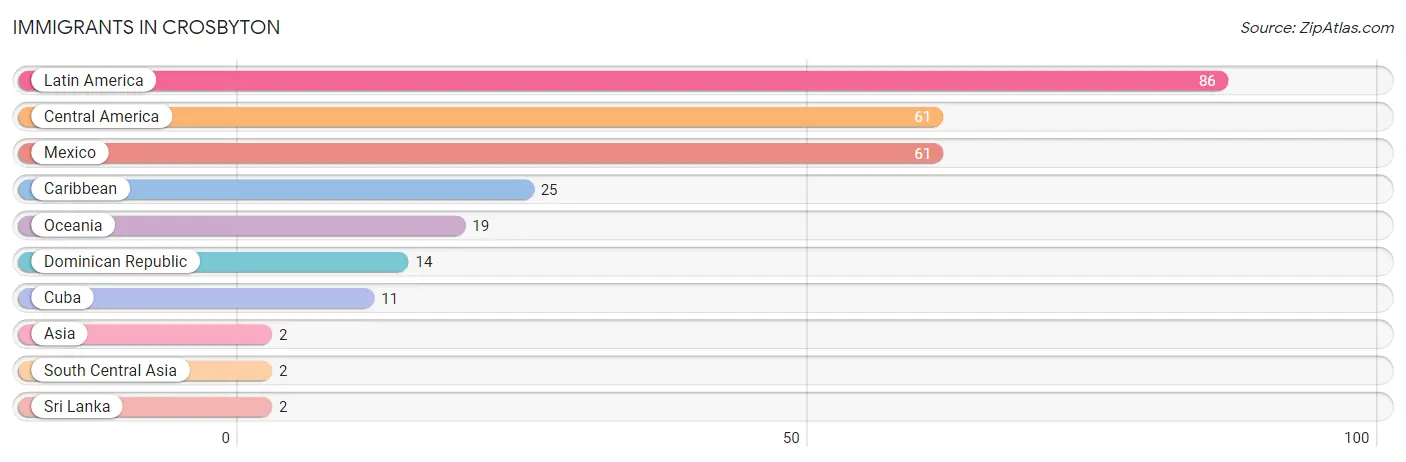
The most numerous immigrant groups reported in Crosbyton came from Latin America (86 | 5.2%), Central America (61 | 3.7%), Mexico (61 | 3.7%), Caribbean (25 | 1.5%), and Oceania (19 | 1.1%), together accounting for 15.2% of all Crosbyton residents.
| Immigration Origin | # Population | % Population |
| Asia | 2 | 0.1% |
| Caribbean | 25 | 1.5% |
| Central America | 61 | 3.7% |
| Cuba | 11 | 0.7% |
| Dominican Republic | 14 | 0.8% |
| Latin America | 86 | 5.2% |
| Mexico | 61 | 3.7% |
| Oceania | 19 | 1.1% |
| South Central Asia | 2 | 0.1% |
| Sri Lanka | 2 | 0.1% | View All 10 Rows |
Sex and Age in Crosbyton
Sex and Age in Crosbyton
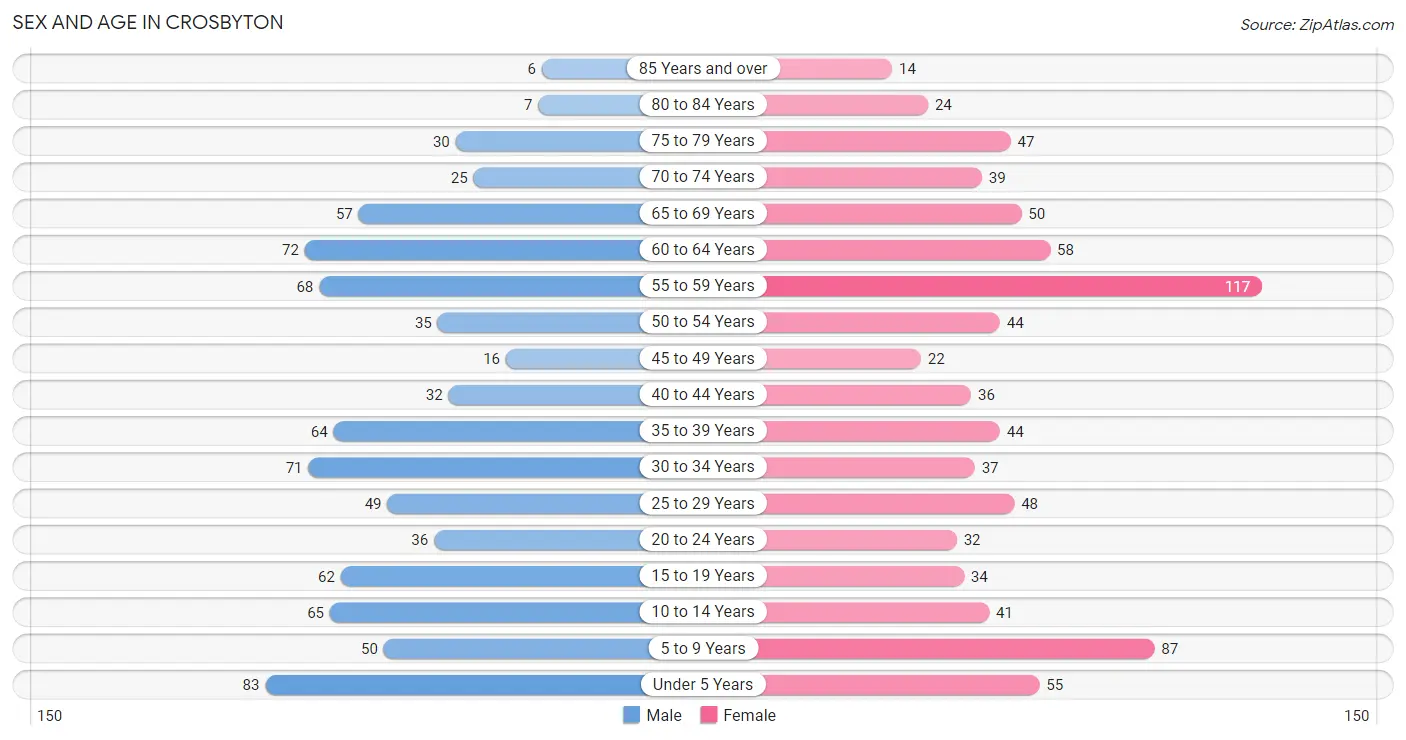
The most populous age groups in Crosbyton are Under 5 Years (83 | 10.0%) for men and 55 to 59 Years (117 | 14.1%) for women.
| Age Bracket | Male | Female |
| Under 5 Years | 83 (10.0%) | 55 (6.6%) |
| 5 to 9 Years | 50 (6.0%) | 87 (10.5%) |
| 10 to 14 Years | 65 (7.9%) | 41 (5.0%) |
| 15 to 19 Years | 62 (7.5%) | 34 (4.1%) |
| 20 to 24 Years | 36 (4.3%) | 32 (3.9%) |
| 25 to 29 Years | 49 (5.9%) | 48 (5.8%) |
| 30 to 34 Years | 71 (8.6%) | 37 (4.5%) |
| 35 to 39 Years | 64 (7.7%) | 44 (5.3%) |
| 40 to 44 Years | 32 (3.9%) | 36 (4.3%) |
| 45 to 49 Years | 16 (1.9%) | 22 (2.6%) |
| 50 to 54 Years | 35 (4.2%) | 44 (5.3%) |
| 55 to 59 Years | 68 (8.2%) | 117 (14.1%) |
| 60 to 64 Years | 72 (8.7%) | 58 (7.0%) |
| 65 to 69 Years | 57 (6.9%) | 50 (6.0%) |
| 70 to 74 Years | 25 (3.0%) | 39 (4.7%) |
| 75 to 79 Years | 30 (3.6%) | 47 (5.7%) |
| 80 to 84 Years | 7 (0.9%) | 24 (2.9%) |
| 85 Years and over | 6 (0.7%) | 14 (1.7%) |
| Total | 828 (100.0%) | 829 (100.0%) |
Families and Households in Crosbyton
Median Family Size in Crosbyton
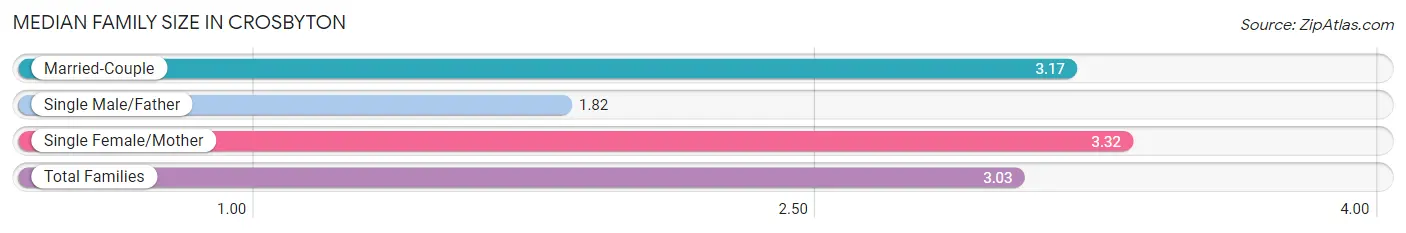
The median family size in Crosbyton is 3.03 persons per family, with single female/mother families (102 | 23.3%) accounting for the largest median family size of 3.32 persons per family. On the other hand, single male/father families (57 | 13.0%) represent the smallest median family size with 1.82 persons per family.
| Family Type | # Families | Family Size |
| Married-Couple | 278 (63.6%) | 3.17 |
| Single Male/Father | 57 (13.0%) | 1.82 |
| Single Female/Mother | 102 (23.3%) | 3.32 |
| Total Families | 437 (100.0%) | 3.03 |
Median Household Size in Crosbyton
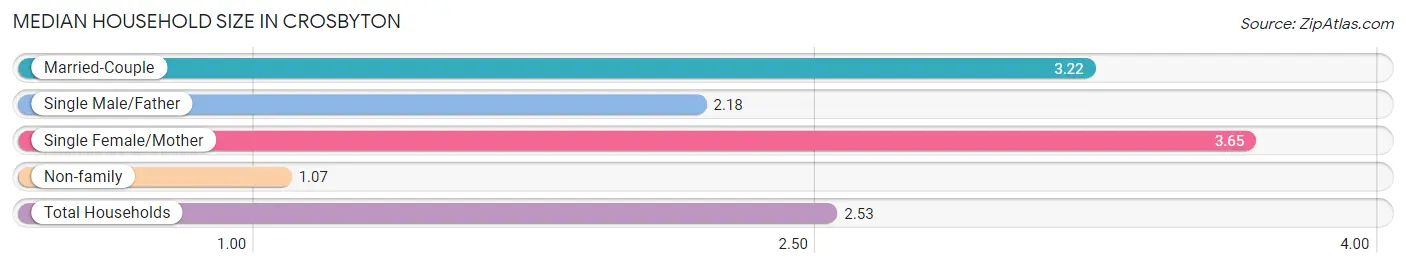
The median household size in Crosbyton is 2.53 persons per household, with single female/mother households (102 | 16.1%) accounting for the largest median household size of 3.65 persons per household. non-family households (197 | 31.1%) represent the smallest median household size with 1.07 persons per household.
| Household Type | # Households | Household Size |
| Married-Couple | 278 (43.9%) | 3.22 |
| Single Male/Father | 57 (9.0%) | 2.18 |
| Single Female/Mother | 102 (16.1%) | 3.65 |
| Non-family | 197 (31.1%) | 1.07 |
| Total Households | 634 (100.0%) | 2.53 |
Household Size by Marriage Status in Crosbyton
Out of a total of 634 households in Crosbyton, 437 (68.9%) are family households, while 197 (31.1%) are nonfamily households. The most numerous type of family households are 2-person households, comprising 202, and the most common type of nonfamily households are 1-person households, comprising 181.
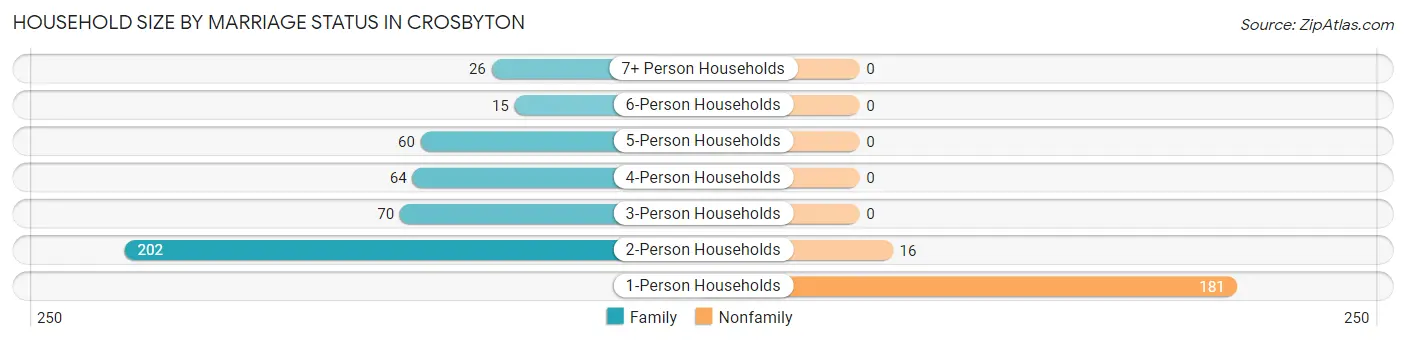
| Household Size | Family Households | Nonfamily Households |
| 1-Person Households | - | 181 (28.5%) |
| 2-Person Households | 202 (31.9%) | 16 (2.5%) |
| 3-Person Households | 70 (11.0%) | 0 (0.0%) |
| 4-Person Households | 64 (10.1%) | 0 (0.0%) |
| 5-Person Households | 60 (9.5%) | 0 (0.0%) |
| 6-Person Households | 15 (2.4%) | 0 (0.0%) |
| 7+ Person Households | 26 (4.1%) | 0 (0.0%) |
| Total | 437 (68.9%) | 197 (31.1%) |
Female Fertility in Crosbyton
Fertility by Age in Crosbyton
Average fertility rate in Crosbyton is 104.0 births per 1,000 women. Women in the age bracket of 20 to 34 years have the highest fertility rate with 197.0 births per 1,000 women. Women in the age bracket of 20 to 34 years acount for 82.1% of all women with births.
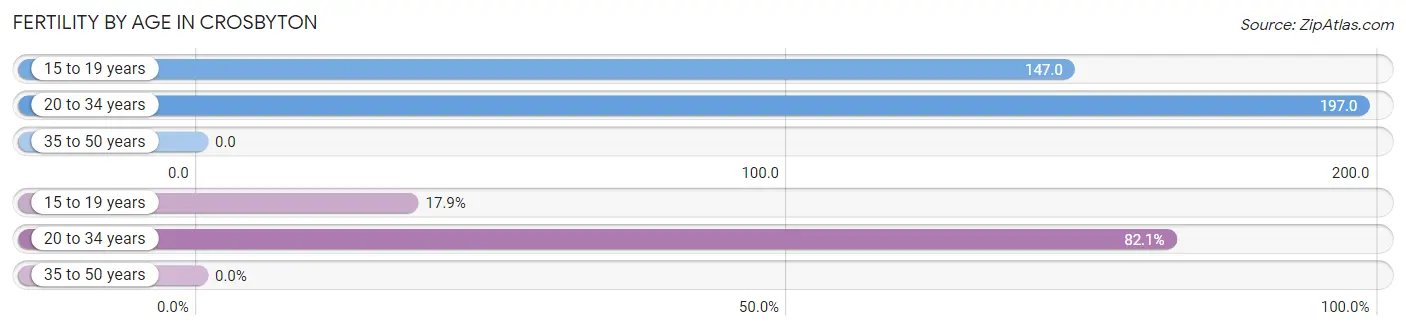
| Age Bracket | Women with Births | Births / 1,000 Women |
| 15 to 19 years | 5 (17.9%) | 147.0 |
| 20 to 34 years | 23 (82.1%) | 197.0 |
| 35 to 50 years | 0 (0.0%) | 0.0 |
| Total | 28 (100.0%) | 104.0 |
Fertility by Age by Marriage Status in Crosbyton
82.1% of women with births (28) in Crosbyton are married. The highest percentage of unmarried women with births falls into 15 to 19 years age bracket with 100.0% of them unmarried at the time of birth, while the lowest percentage of unmarried women with births belong to 20 to 34 years age bracket with 0.0% of them unmarried.
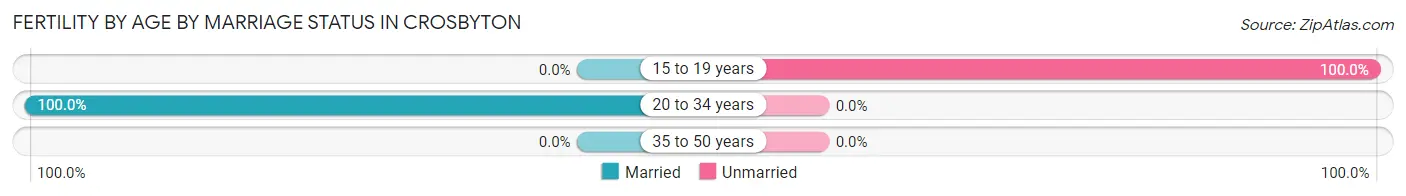
| Age Bracket | Married | Unmarried |
| 15 to 19 years | 0 (0.0%) | 5 (100.0%) |
| 20 to 34 years | 23 (100.0%) | 0 (0.0%) |
| 35 to 50 years | 0 (0.0%) | 0 (0.0%) |
| Total | 23 (82.1%) | 5 (17.9%) |
Fertility by Education in Crosbyton
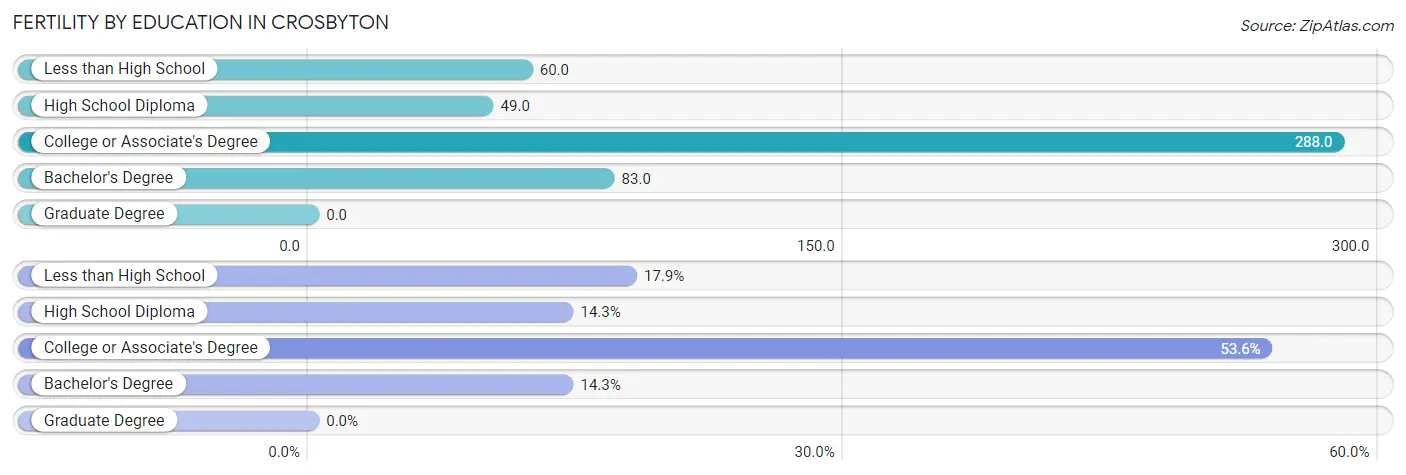
| Educational Attainment | Women with Births | Births / 1,000 Women |
| Less than High School | 5 (17.9%) | 60.0 |
| High School Diploma | 4 (14.3%) | 49.0 |
| College or Associate's Degree | 15 (53.6%) | 288.0 |
| Bachelor's Degree | 4 (14.3%) | 83.0 |
| Graduate Degree | 0 (0.0%) | 0.0 |
| Total | 28 (100.0%) | 104.0 |
Fertility by Education by Marriage Status in Crosbyton
17.9% of women with births in Crosbyton are unmarried. Women with the educational attainment of high school diploma are most likely to be married with 100.0% of them married at childbirth, while women with the educational attainment of less than high school are least likely to be married with 100.0% of them unmarried at childbirth.
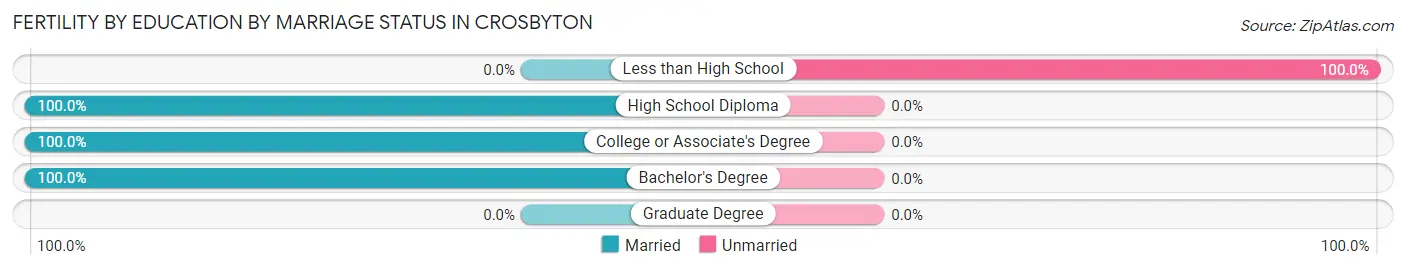
| Educational Attainment | Married | Unmarried |
| Less than High School | 0 (0.0%) | 5 (100.0%) |
| High School Diploma | 4 (100.0%) | 0 (0.0%) |
| College or Associate's Degree | 15 (100.0%) | 0 (0.0%) |
| Bachelor's Degree | 4 (100.0%) | 0 (0.0%) |
| Graduate Degree | 0 (0.0%) | 0 (0.0%) |
| Total | 23 (82.1%) | 5 (17.9%) |
Employment Characteristics in Crosbyton
Employment by Class of Employer in Crosbyton
Among the 614 employed individuals in Crosbyton, private company employees (324 | 52.8%), local government employees (180 | 29.3%), and not-for-profit organizations (58 | 9.5%) make up the most common classes of employment.
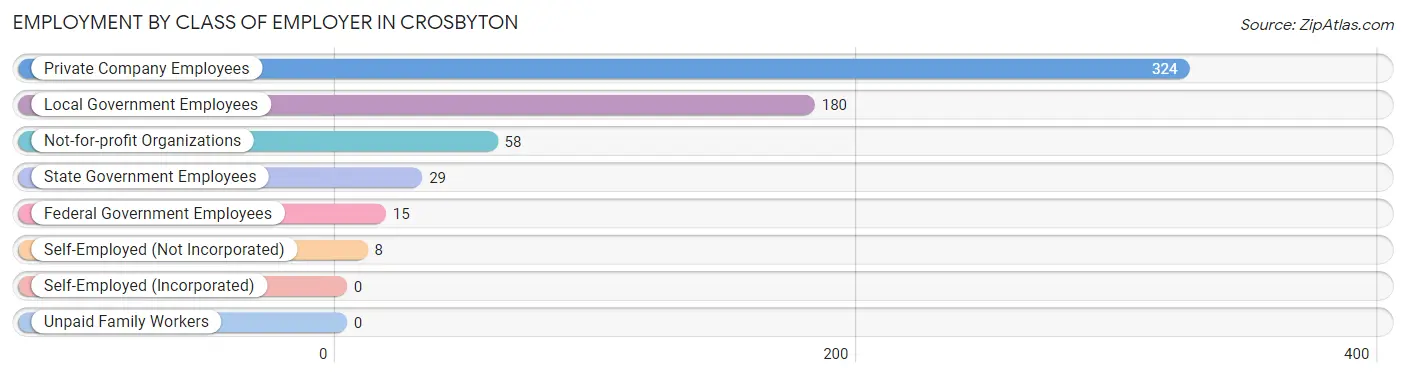
| Employer Class | # Employees | % Employees |
| Private Company Employees | 324 | 52.8% |
| Self-Employed (Incorporated) | 0 | 0.0% |
| Self-Employed (Not Incorporated) | 8 | 1.3% |
| Not-for-profit Organizations | 58 | 9.5% |
| Local Government Employees | 180 | 29.3% |
| State Government Employees | 29 | 4.7% |
| Federal Government Employees | 15 | 2.4% |
| Unpaid Family Workers | 0 | 0.0% |
| Total | 614 | 100.0% |
Employment Status by Age in Crosbyton
According to the labor force statistics for Crosbyton, out of the total population over 16 years of age (1,262), 52.7% or 665 individuals are in the labor force, with 7.5% or 50 of them unemployed. The age group with the highest labor force participation rate is 20 to 24 years, with 85.3% or 58 individuals in the labor force. Within the labor force, the 35 to 44 years age range has the highest percentage of unemployed individuals, with 27.8% or 37 of them being unemployed.
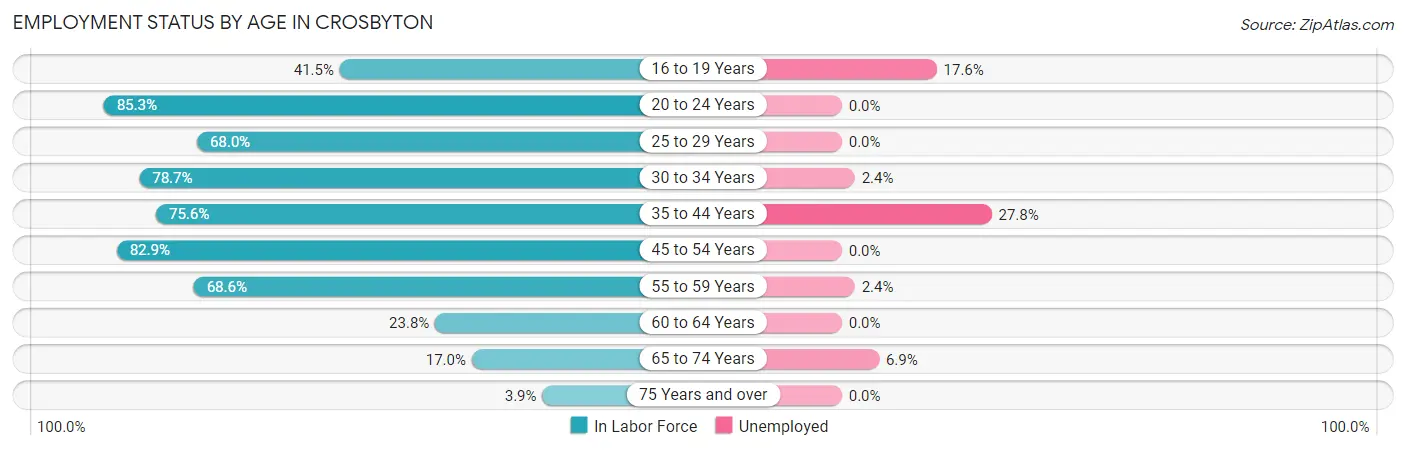
| Age Bracket | In Labor Force | Unemployed |
| 16 to 19 Years | 34 (41.5%) | 6 (17.6%) |
| 20 to 24 Years | 58 (85.3%) | 0 (0.0%) |
| 25 to 29 Years | 66 (68.0%) | 0 (0.0%) |
| 30 to 34 Years | 85 (78.7%) | 2 (2.4%) |
| 35 to 44 Years | 133 (75.6%) | 37 (27.8%) |
| 45 to 54 Years | 97 (82.9%) | 0 (0.0%) |
| 55 to 59 Years | 127 (68.6%) | 3 (2.4%) |
| 60 to 64 Years | 31 (23.8%) | 0 (0.0%) |
| 65 to 74 Years | 29 (17.0%) | 2 (6.9%) |
| 75 Years and over | 5 (3.9%) | 0 (0.0%) |
| Total | 665 (52.7%) | 50 (7.5%) |
Employment Status by Educational Attainment in Crosbyton
According to labor force statistics for Crosbyton, 66.3% of individuals (539) out of the total population between 25 and 64 years of age (813) are in the labor force, with 7.8% or 42 of them being unemployed. The group with the highest labor force participation rate are those with the educational attainment of bachelor's degree or higher, with 89.7% or 87 individuals in the labor force. Within the labor force, individuals with less than high school education have the highest percentage of unemployment, with 38.7% or 29 of them being unemployed.
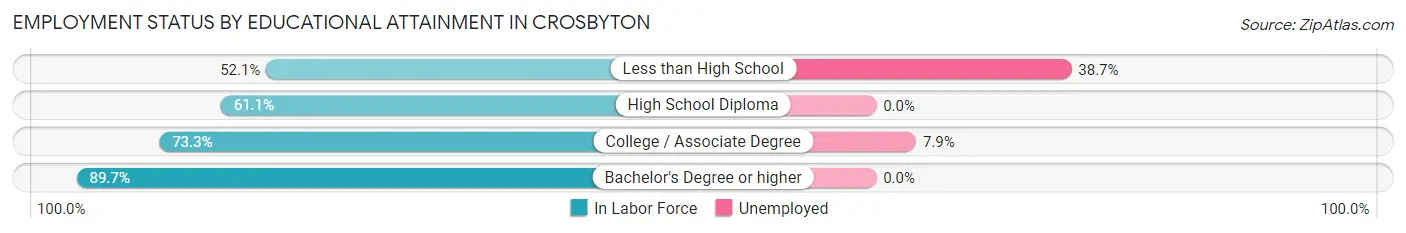
| Educational Attainment | In Labor Force | Unemployed |
| Less than High School | 75 (52.1%) | 56 (38.7%) |
| High School Diploma | 212 (61.1%) | 0 (0.0%) |
| College / Associate Degree | 165 (73.3%) | 18 (7.9%) |
| Bachelor's Degree or higher | 87 (89.7%) | 0 (0.0%) |
| Total | 539 (66.3%) | 63 (7.8%) |
Employment Occupations by Sex in Crosbyton
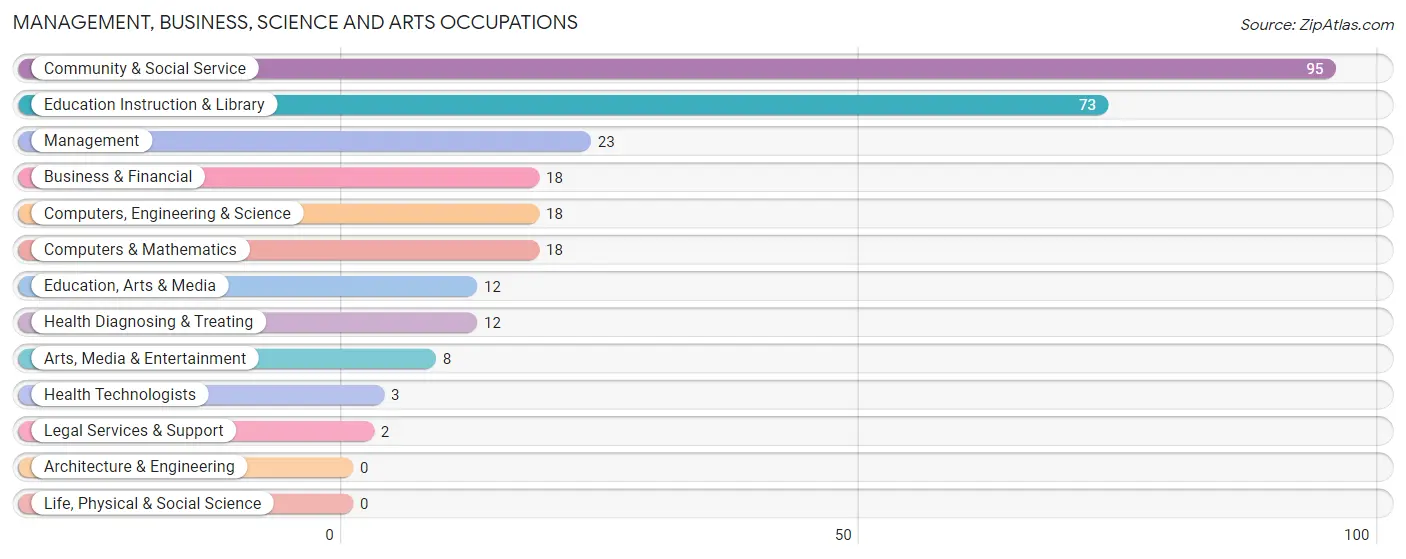
Management, Business, Science and Arts Occupations
The most common Management, Business, Science and Arts occupations in Crosbyton are Community & Social Service (95 | 15.4%), Education Instruction & Library (73 | 11.9%), Management (23 | 3.7%), Business & Financial (18 | 2.9%), and Computers, Engineering & Science (18 | 2.9%).
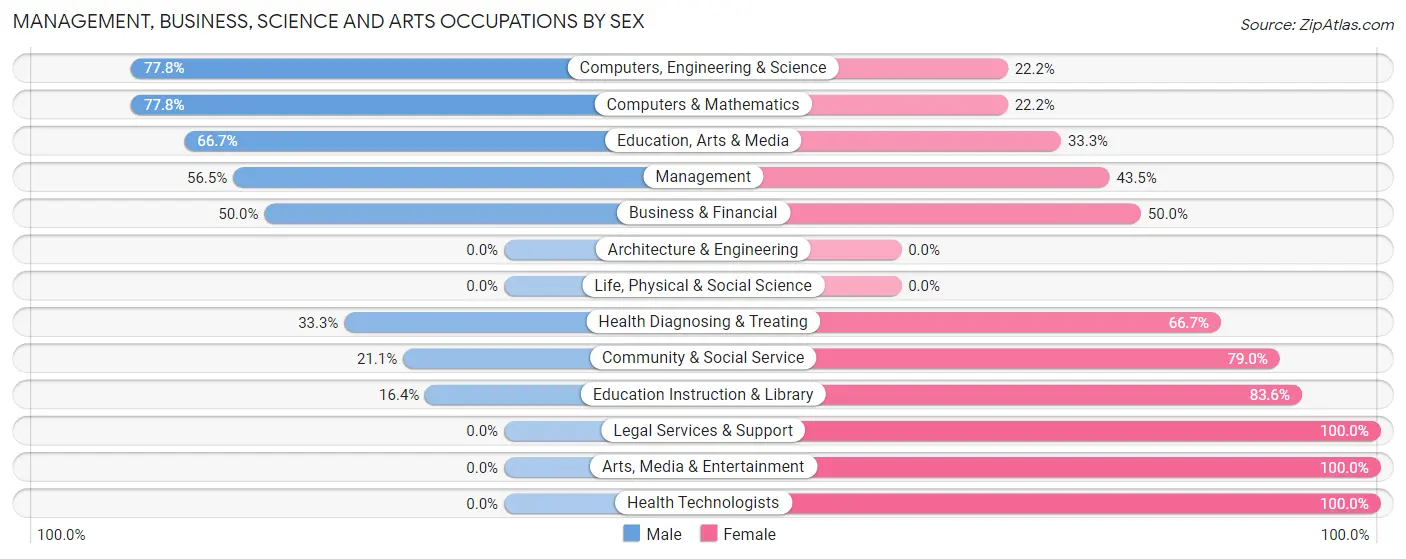
Management, Business, Science and Arts Occupations by Sex
Within the Management, Business, Science and Arts occupations in Crosbyton, the most male-oriented occupations are Computers, Engineering & Science (77.8%), Computers & Mathematics (77.8%), and Education, Arts & Media (66.7%), while the most female-oriented occupations are Legal Services & Support (100.0%), Arts, Media & Entertainment (100.0%), and Health Technologists (100.0%).
| Occupation | Male | Female |
| Management | 13 (56.5%) | 10 (43.5%) |
| Business & Financial | 9 (50.0%) | 9 (50.0%) |
| Computers, Engineering & Science | 14 (77.8%) | 4 (22.2%) |
| Computers & Mathematics | 14 (77.8%) | 4 (22.2%) |
| Architecture & Engineering | 0 (0.0%) | 0 (0.0%) |
| Life, Physical & Social Science | 0 (0.0%) | 0 (0.0%) |
| Community & Social Service | 20 (21.0%) | 75 (78.9%) |
| Education, Arts & Media | 8 (66.7%) | 4 (33.3%) |
| Legal Services & Support | 0 (0.0%) | 2 (100.0%) |
| Education Instruction & Library | 12 (16.4%) | 61 (83.6%) |
| Arts, Media & Entertainment | 0 (0.0%) | 8 (100.0%) |
| Health Diagnosing & Treating | 4 (33.3%) | 8 (66.7%) |
| Health Technologists | 0 (0.0%) | 3 (100.0%) |
| Total (Category) | 60 (36.1%) | 106 (63.9%) |
| Total (Overall) | 358 (58.2%) | 257 (41.8%) |
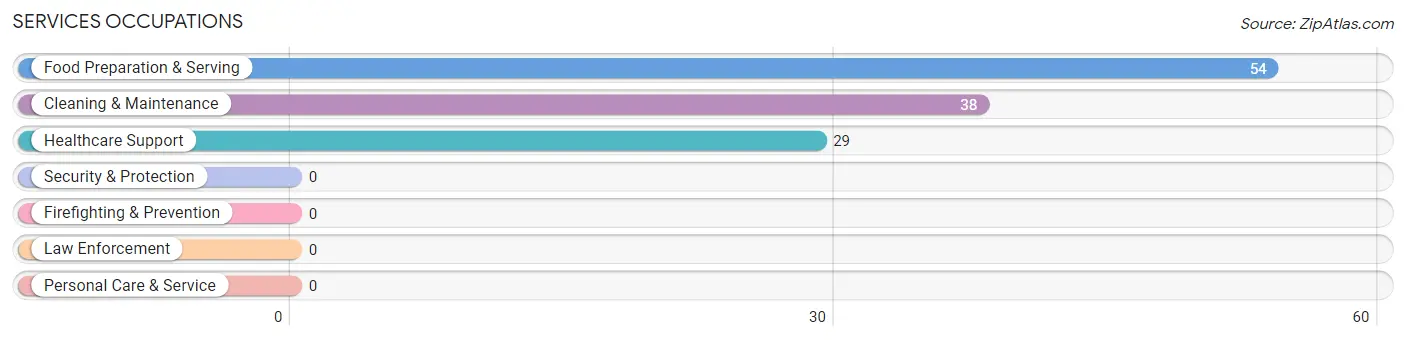
Services Occupations
The most common Services occupations in Crosbyton are Food Preparation & Serving (54 | 8.8%), Cleaning & Maintenance (38 | 6.2%), and Healthcare Support (29 | 4.7%).
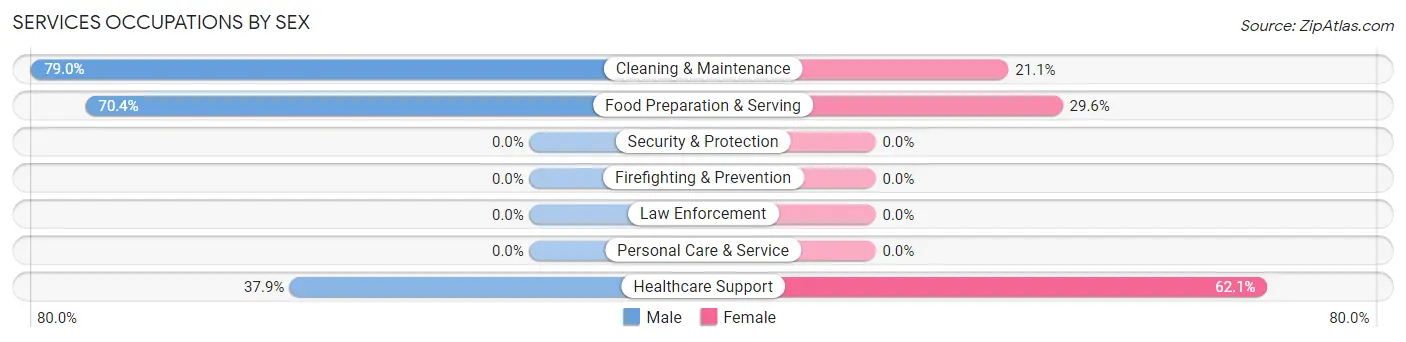
Services Occupations by Sex
Within the Services occupations in Crosbyton, the most male-oriented occupations are Cleaning & Maintenance (78.9%), Food Preparation & Serving (70.4%), and Healthcare Support (37.9%), while the most female-oriented occupations are Healthcare Support (62.1%), Food Preparation & Serving (29.6%), and Cleaning & Maintenance (21.0%).
| Occupation | Male | Female |
| Healthcare Support | 11 (37.9%) | 18 (62.1%) |
| Security & Protection | 0 (0.0%) | 0 (0.0%) |
| Firefighting & Prevention | 0 (0.0%) | 0 (0.0%) |
| Law Enforcement | 0 (0.0%) | 0 (0.0%) |
| Food Preparation & Serving | 38 (70.4%) | 16 (29.6%) |
| Cleaning & Maintenance | 30 (78.9%) | 8 (21.0%) |
| Personal Care & Service | 0 (0.0%) | 0 (0.0%) |
| Total (Category) | 79 (65.3%) | 42 (34.7%) |
| Total (Overall) | 358 (58.2%) | 257 (41.8%) |
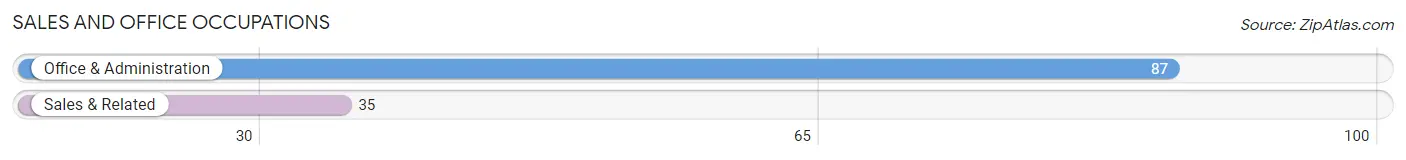
Sales and Office Occupations
The most common Sales and Office occupations in Crosbyton are Office & Administration (87 | 14.1%), and Sales & Related (35 | 5.7%).
Sales and Office Occupations by Sex
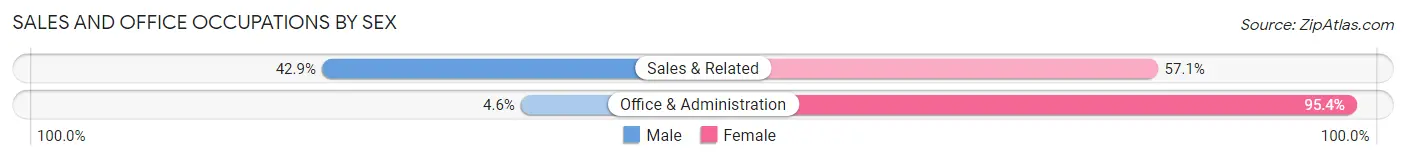
| Occupation | Male | Female |
| Sales & Related | 15 (42.9%) | 20 (57.1%) |
| Office & Administration | 4 (4.6%) | 83 (95.4%) |
| Total (Category) | 19 (15.6%) | 103 (84.4%) |
| Total (Overall) | 358 (58.2%) | 257 (41.8%) |
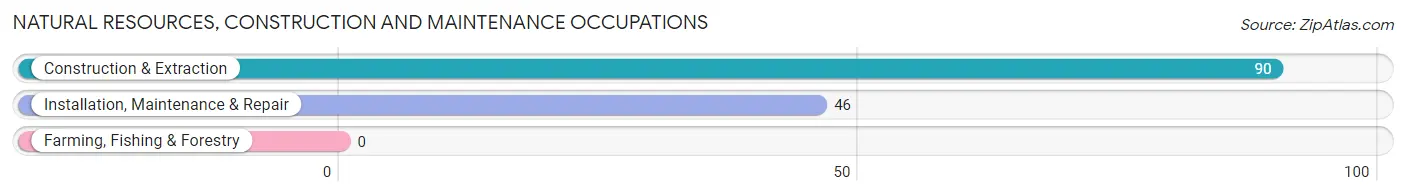
Natural Resources, Construction and Maintenance Occupations
The most common Natural Resources, Construction and Maintenance occupations in Crosbyton are Construction & Extraction (90 | 14.6%), and Installation, Maintenance & Repair (46 | 7.5%).
Natural Resources, Construction and Maintenance Occupations by Sex
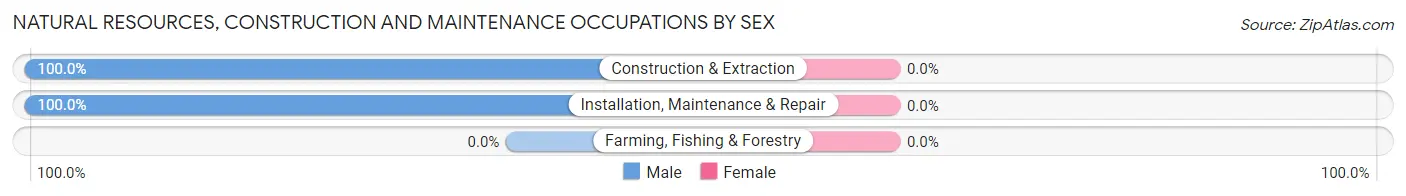
| Occupation | Male | Female |
| Farming, Fishing & Forestry | 0 (0.0%) | 0 (0.0%) |
| Construction & Extraction | 90 (100.0%) | 0 (0.0%) |
| Installation, Maintenance & Repair | 46 (100.0%) | 0 (0.0%) |
| Total (Category) | 136 (100.0%) | 0 (0.0%) |
| Total (Overall) | 358 (58.2%) | 257 (41.8%) |
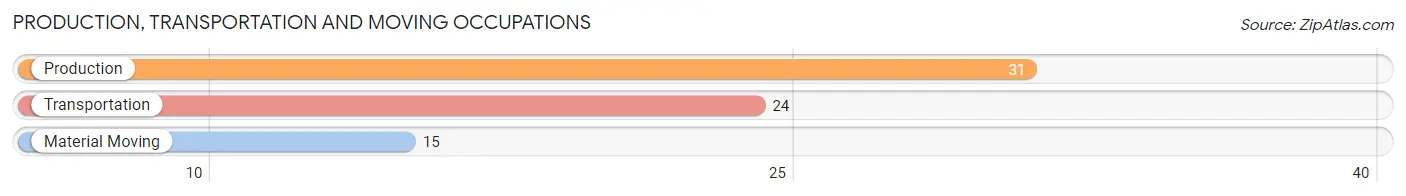
Production, Transportation and Moving Occupations
The most common Production, Transportation and Moving occupations in Crosbyton are Production (31 | 5.0%), Transportation (24 | 3.9%), and Material Moving (15 | 2.4%).
Production, Transportation and Moving Occupations by Sex
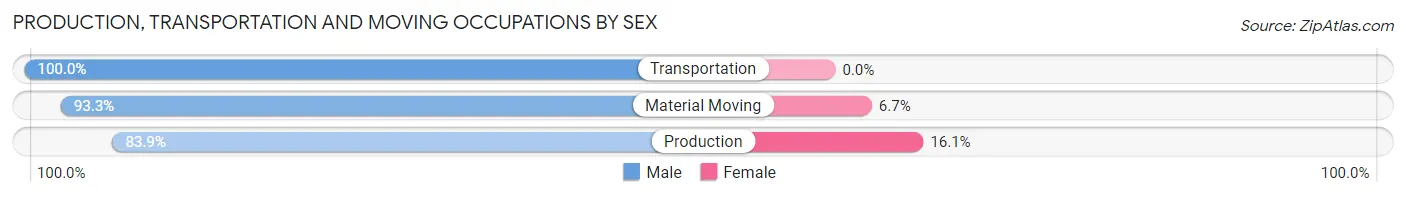
| Occupation | Male | Female |
| Production | 26 (83.9%) | 5 (16.1%) |
| Transportation | 24 (100.0%) | 0 (0.0%) |
| Material Moving | 14 (93.3%) | 1 (6.7%) |
| Total (Category) | 64 (91.4%) | 6 (8.6%) |
| Total (Overall) | 358 (58.2%) | 257 (41.8%) |
Employment Industries by Sex in Crosbyton
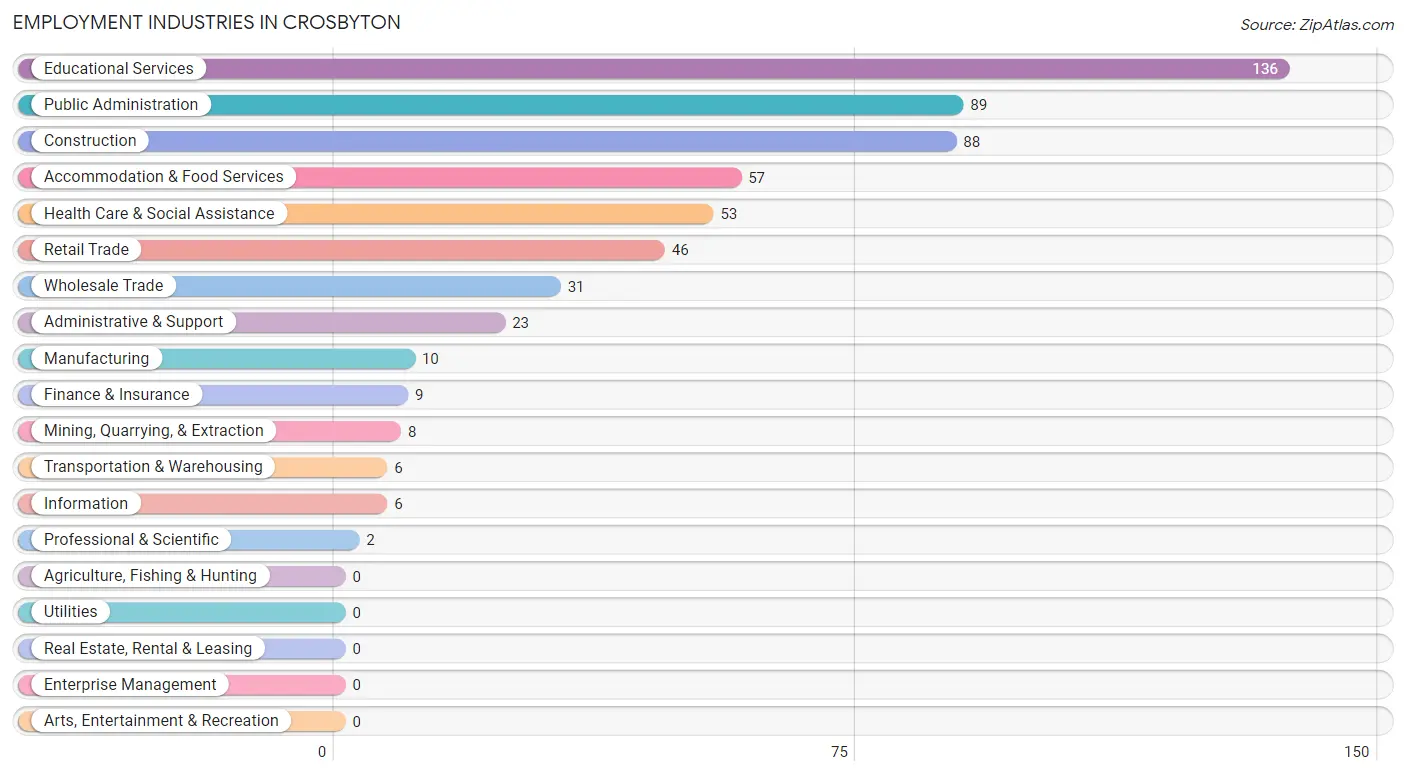
Employment Industries in Crosbyton
The major employment industries in Crosbyton include Educational Services (136 | 22.1%), Public Administration (89 | 14.5%), Construction (88 | 14.3%), Accommodation & Food Services (57 | 9.3%), and Health Care & Social Assistance (53 | 8.6%).
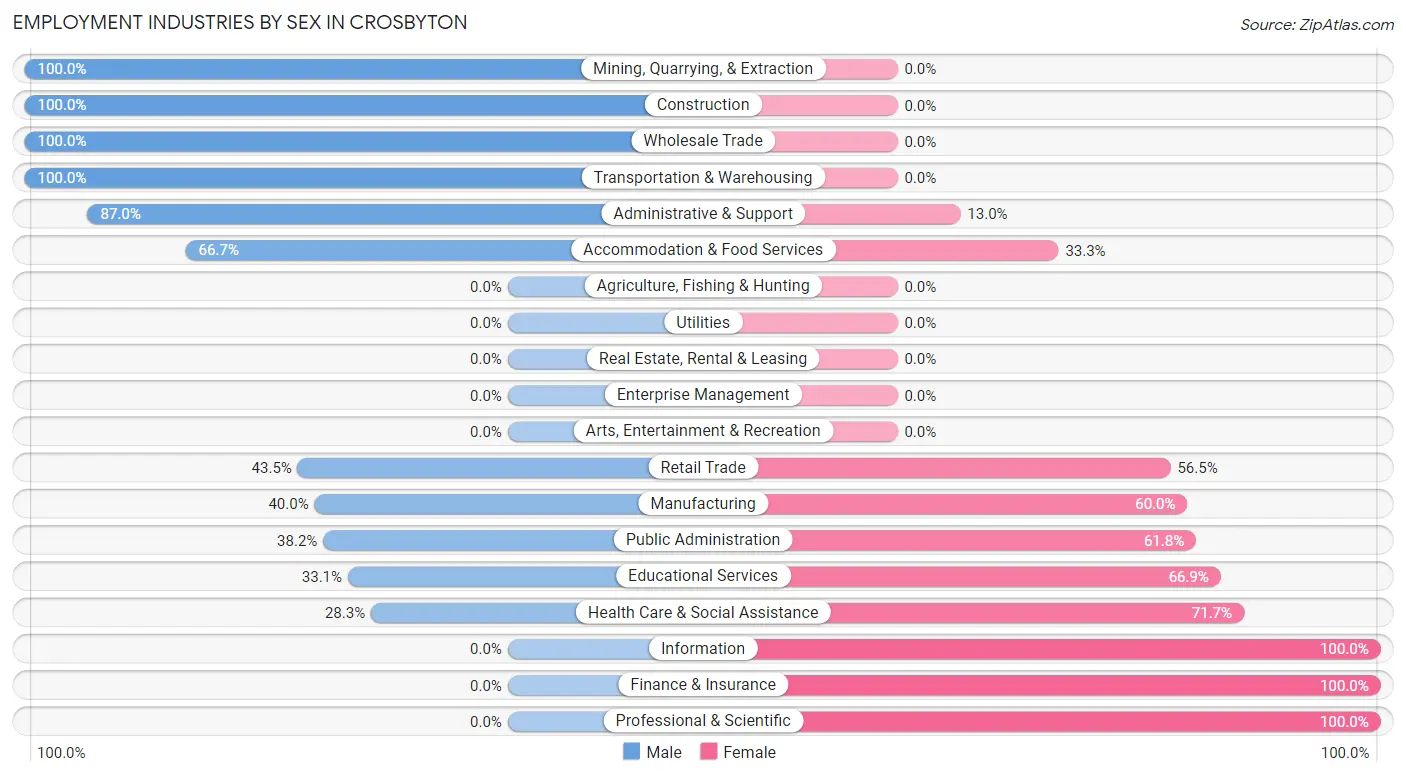
Employment Industries by Sex in Crosbyton
The Crosbyton industries that see more men than women are Mining, Quarrying, & Extraction (100.0%), Construction (100.0%), and Wholesale Trade (100.0%), whereas the industries that tend to have a higher number of women are Information (100.0%), Finance & Insurance (100.0%), and Professional & Scientific (100.0%).
| Industry | Male | Female |
| Agriculture, Fishing & Hunting | 0 (0.0%) | 0 (0.0%) |
| Mining, Quarrying, & Extraction | 8 (100.0%) | 0 (0.0%) |
| Construction | 88 (100.0%) | 0 (0.0%) |
| Manufacturing | 4 (40.0%) | 6 (60.0%) |
| Wholesale Trade | 31 (100.0%) | 0 (0.0%) |
| Retail Trade | 20 (43.5%) | 26 (56.5%) |
| Transportation & Warehousing | 6 (100.0%) | 0 (0.0%) |
| Utilities | 0 (0.0%) | 0 (0.0%) |
| Information | 0 (0.0%) | 6 (100.0%) |
| Finance & Insurance | 0 (0.0%) | 9 (100.0%) |
| Real Estate, Rental & Leasing | 0 (0.0%) | 0 (0.0%) |
| Professional & Scientific | 0 (0.0%) | 2 (100.0%) |
| Enterprise Management | 0 (0.0%) | 0 (0.0%) |
| Administrative & Support | 20 (87.0%) | 3 (13.0%) |
| Educational Services | 45 (33.1%) | 91 (66.9%) |
| Health Care & Social Assistance | 15 (28.3%) | 38 (71.7%) |
| Arts, Entertainment & Recreation | 0 (0.0%) | 0 (0.0%) |
| Accommodation & Food Services | 38 (66.7%) | 19 (33.3%) |
| Public Administration | 34 (38.2%) | 55 (61.8%) |
| Total | 358 (58.2%) | 257 (41.8%) |
Education in Crosbyton
School Enrollment in Crosbyton
The most common levels of schooling among the 372 students in Crosbyton are elementary school (90 | 24.2%), middle school (90 | 24.2%), and college / undergraduate (77 | 20.7%).
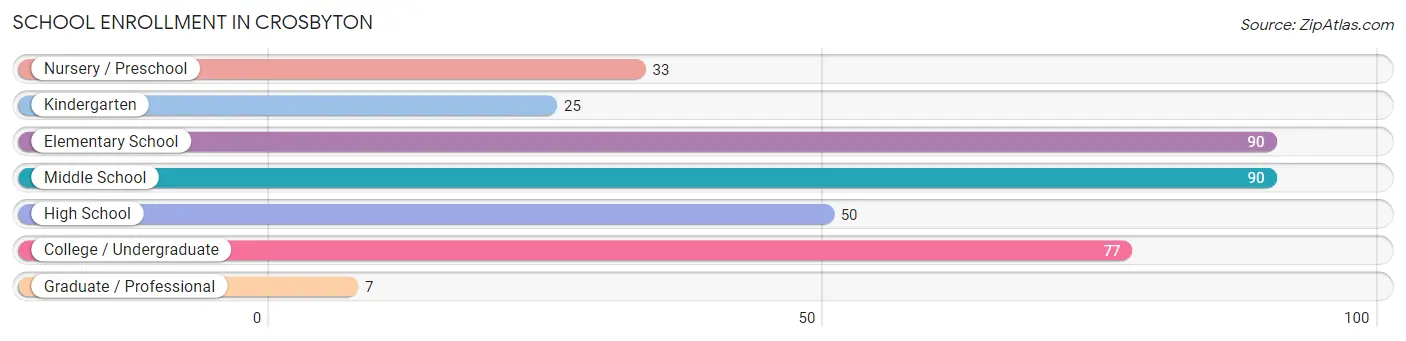
| School Level | # Students | % Students |
| Nursery / Preschool | 33 | 8.9% |
| Kindergarten | 25 | 6.7% |
| Elementary School | 90 | 24.2% |
| Middle School | 90 | 24.2% |
| High School | 50 | 13.4% |
| College / Undergraduate | 77 | 20.7% |
| Graduate / Professional | 7 | 1.9% |
| Total | 372 | 100.0% |
School Enrollment by Age by Funding Source in Crosbyton
Out of a total of 372 students who are enrolled in schools in Crosbyton, 21 (5.6%) attend a private institution, while the remaining 351 (94.4%) are enrolled in public schools. The age group of 18 to 19 year olds has the highest likelihood of being enrolled in private schools, with 7 (14.9% in the age bracket) enrolled. Conversely, the age group of 3 to 4 year olds has the lowest likelihood of being enrolled in a private school, with 10 (100.0% in the age bracket) attending a public institution.
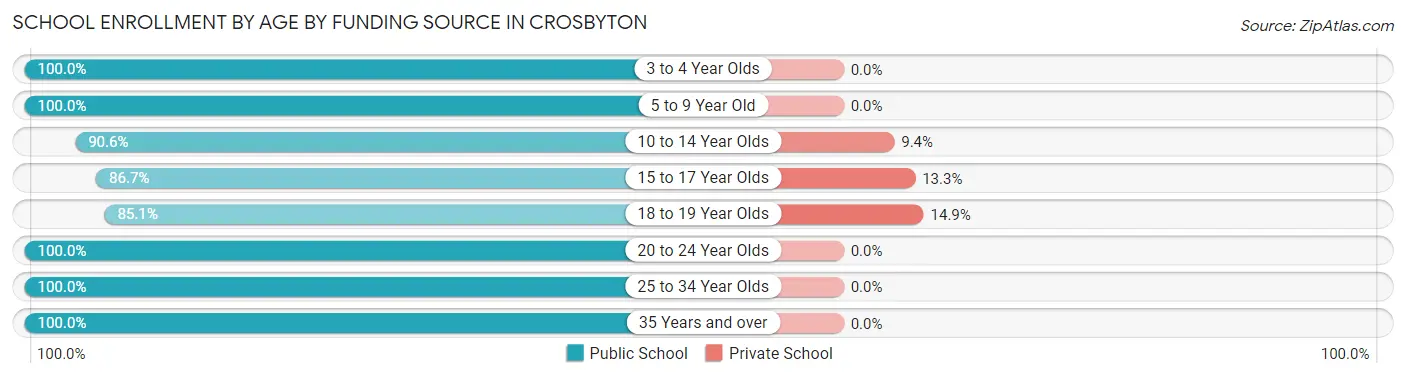
| Age Bracket | Public School | Private School |
| 3 to 4 Year Olds | 10 (100.0%) | 0 (0.0%) |
| 5 to 9 Year Old | 135 (100.0%) | 0 (0.0%) |
| 10 to 14 Year Olds | 96 (90.6%) | 10 (9.4%) |
| 15 to 17 Year Olds | 26 (86.7%) | 4 (13.3%) |
| 18 to 19 Year Olds | 40 (85.1%) | 7 (14.9%) |
| 20 to 24 Year Olds | 15 (100.0%) | 0 (0.0%) |
| 25 to 34 Year Olds | 7 (100.0%) | 0 (0.0%) |
| 35 Years and over | 22 (100.0%) | 0 (0.0%) |
| Total | 351 (94.4%) | 21 (5.6%) |
Educational Attainment by Field of Study in Crosbyton
Education (39 | 25.5%), bio, nature & agricultural (20 | 13.1%), psychology (19 | 12.4%), literature & languages (19 | 12.4%), and social sciences (15 | 9.8%) are the most common fields of study among 153 individuals in Crosbyton who have obtained a bachelor's degree or higher.
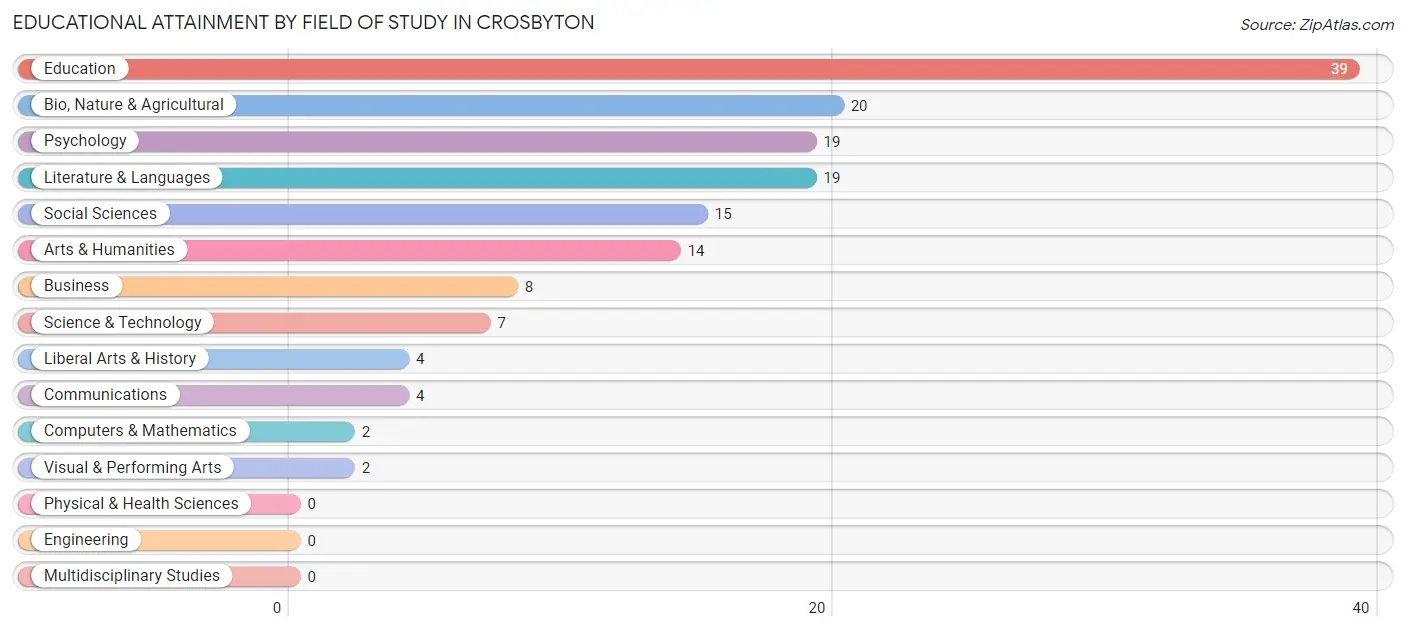
| Field of Study | # Graduates | % Graduates |
| Computers & Mathematics | 2 | 1.3% |
| Bio, Nature & Agricultural | 20 | 13.1% |
| Physical & Health Sciences | 0 | 0.0% |
| Psychology | 19 | 12.4% |
| Social Sciences | 15 | 9.8% |
| Engineering | 0 | 0.0% |
| Multidisciplinary Studies | 0 | 0.0% |
| Science & Technology | 7 | 4.6% |
| Business | 8 | 5.2% |
| Education | 39 | 25.5% |
| Literature & Languages | 19 | 12.4% |
| Liberal Arts & History | 4 | 2.6% |
| Visual & Performing Arts | 2 | 1.3% |
| Communications | 4 | 2.6% |
| Arts & Humanities | 14 | 9.1% |
| Total | 153 | 100.0% |
Transportation & Commute in Crosbyton
Vehicle Availability by Sex in Crosbyton
The most prevalent vehicle ownership categories in Crosbyton are males with 2 vehicles (220, accounting for 61.5%) and females with 2 vehicles (153, making up 85.9%).
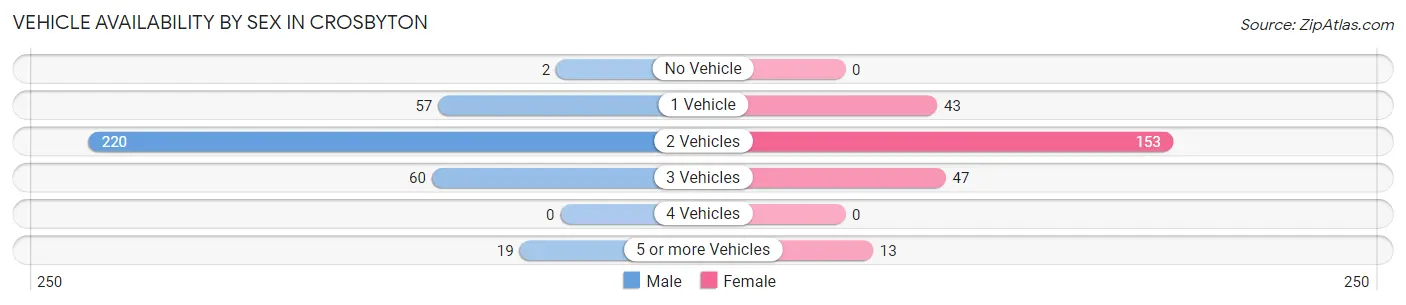
| Vehicles Available | Male | Female |
| No Vehicle | 2 (0.6%) | 0 (0.0%) |
| 1 Vehicle | 57 (15.9%) | 43 (16.8%) |
| 2 Vehicles | 220 (61.5%) | 153 (59.8%) |
| 3 Vehicles | 60 (16.8%) | 47 (18.4%) |
| 4 Vehicles | 0 (0.0%) | 0 (0.0%) |
| 5 or more Vehicles | 19 (5.3%) | 13 (5.1%) |
| Total | 358 (100.0%) | 256 (100.0%) |
Commute Time in Crosbyton
The most frequently occuring commute durations in Crosbyton are less than 5 minutes (208 commuters, 34.4%), 5 to 9 minutes (113 commuters, 18.7%), and 45 to 59 minutes (93 commuters, 15.4%).
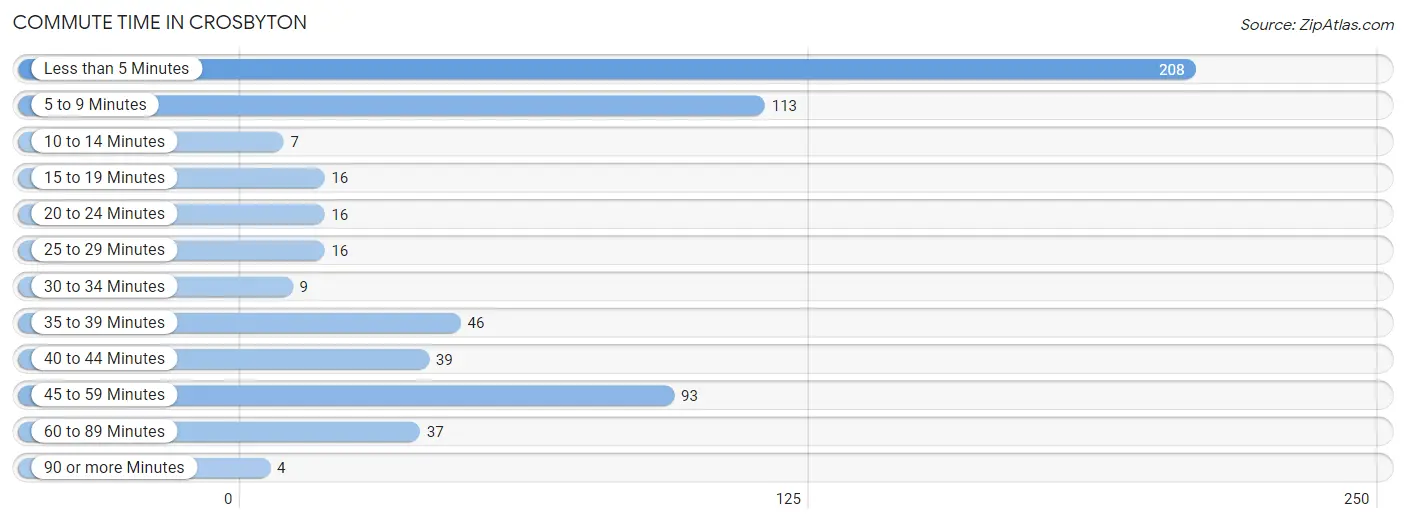
| Commute Time | # Commuters | % Commuters |
| Less than 5 Minutes | 208 | 34.4% |
| 5 to 9 Minutes | 113 | 18.7% |
| 10 to 14 Minutes | 7 | 1.2% |
| 15 to 19 Minutes | 16 | 2.6% |
| 20 to 24 Minutes | 16 | 2.6% |
| 25 to 29 Minutes | 16 | 2.6% |
| 30 to 34 Minutes | 9 | 1.5% |
| 35 to 39 Minutes | 46 | 7.6% |
| 40 to 44 Minutes | 39 | 6.5% |
| 45 to 59 Minutes | 93 | 15.4% |
| 60 to 89 Minutes | 37 | 6.1% |
| 90 or more Minutes | 4 | 0.7% |
Commute Time by Sex in Crosbyton
The most common commute times in Crosbyton are less than 5 minutes (94 commuters, 26.3%) for males and less than 5 minutes (114 commuters, 46.3%) for females.
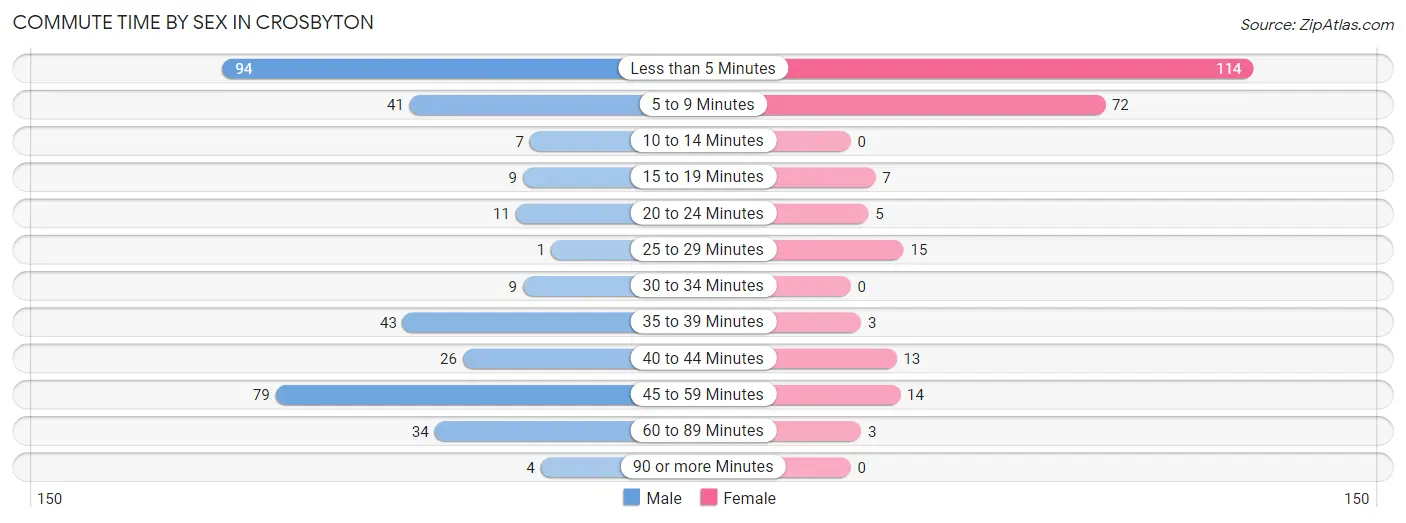
| Commute Time | Male | Female |
| Less than 5 Minutes | 94 (26.3%) | 114 (46.3%) |
| 5 to 9 Minutes | 41 (11.5%) | 72 (29.3%) |
| 10 to 14 Minutes | 7 (2.0%) | 0 (0.0%) |
| 15 to 19 Minutes | 9 (2.5%) | 7 (2.9%) |
| 20 to 24 Minutes | 11 (3.1%) | 5 (2.0%) |
| 25 to 29 Minutes | 1 (0.3%) | 15 (6.1%) |
| 30 to 34 Minutes | 9 (2.5%) | 0 (0.0%) |
| 35 to 39 Minutes | 43 (12.0%) | 3 (1.2%) |
| 40 to 44 Minutes | 26 (7.3%) | 13 (5.3%) |
| 45 to 59 Minutes | 79 (22.1%) | 14 (5.7%) |
| 60 to 89 Minutes | 34 (9.5%) | 3 (1.2%) |
| 90 or more Minutes | 4 (1.1%) | 0 (0.0%) |
Time of Departure to Work by Sex in Crosbyton
The most frequent times of departure to work in Crosbyton are 7:00 AM to 7:29 AM (69, 19.3%) for males and 7:30 AM to 7:59 AM (138, 56.1%) for females.
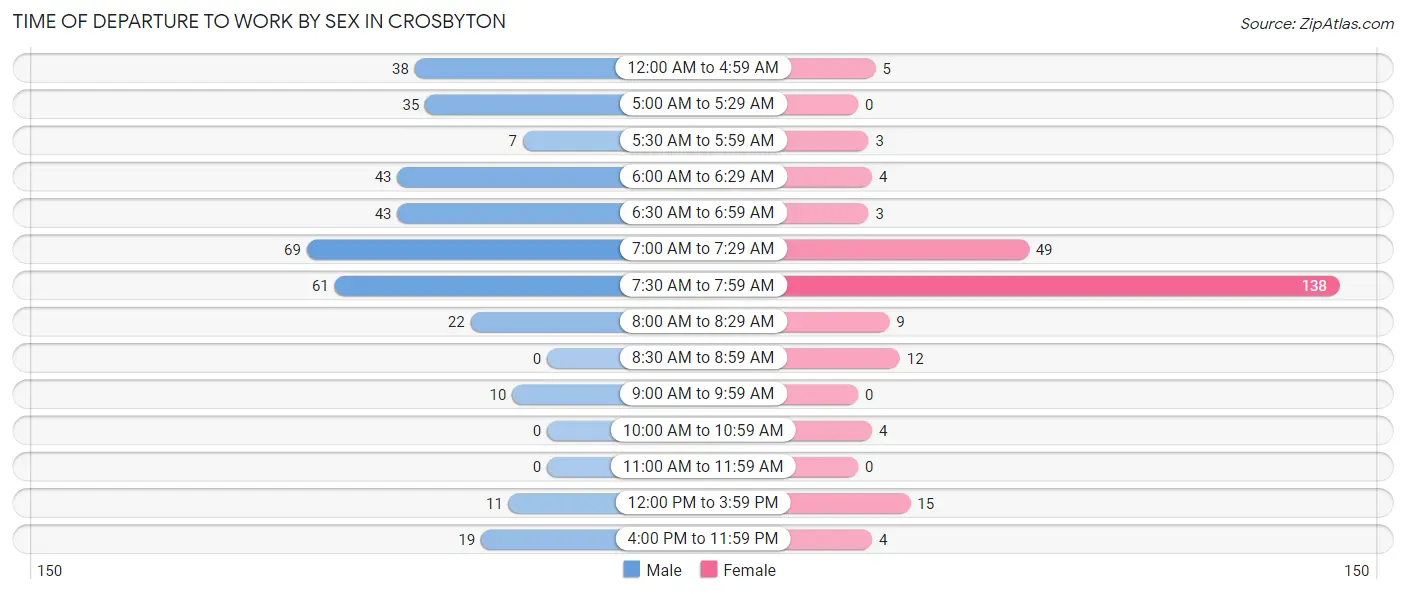
| Time of Departure | Male | Female |
| 12:00 AM to 4:59 AM | 38 (10.6%) | 5 (2.0%) |
| 5:00 AM to 5:29 AM | 35 (9.8%) | 0 (0.0%) |
| 5:30 AM to 5:59 AM | 7 (2.0%) | 3 (1.2%) |
| 6:00 AM to 6:29 AM | 43 (12.0%) | 4 (1.6%) |
| 6:30 AM to 6:59 AM | 43 (12.0%) | 3 (1.2%) |
| 7:00 AM to 7:29 AM | 69 (19.3%) | 49 (19.9%) |
| 7:30 AM to 7:59 AM | 61 (17.0%) | 138 (56.1%) |
| 8:00 AM to 8:29 AM | 22 (6.1%) | 9 (3.7%) |
| 8:30 AM to 8:59 AM | 0 (0.0%) | 12 (4.9%) |
| 9:00 AM to 9:59 AM | 10 (2.8%) | 0 (0.0%) |
| 10:00 AM to 10:59 AM | 0 (0.0%) | 4 (1.6%) |
| 11:00 AM to 11:59 AM | 0 (0.0%) | 0 (0.0%) |
| 12:00 PM to 3:59 PM | 11 (3.1%) | 15 (6.1%) |
| 4:00 PM to 11:59 PM | 19 (5.3%) | 4 (1.6%) |
| Total | 358 (100.0%) | 246 (100.0%) |
Housing Occupancy in Crosbyton
Occupancy by Ownership in Crosbyton
Of the total 634 dwellings in Crosbyton, owner-occupied units account for 395 (62.3%), while renter-occupied units make up 239 (37.7%).
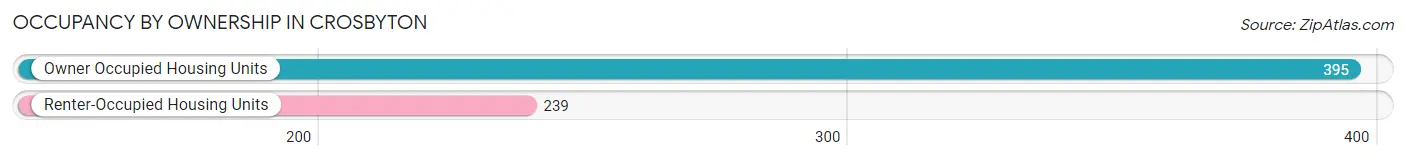
| Occupancy | # Housing Units | % Housing Units |
| Owner Occupied Housing Units | 395 | 62.3% |
| Renter-Occupied Housing Units | 239 | 37.7% |
| Total Occupied Housing Units | 634 | 100.0% |
Occupancy by Household Size in Crosbyton
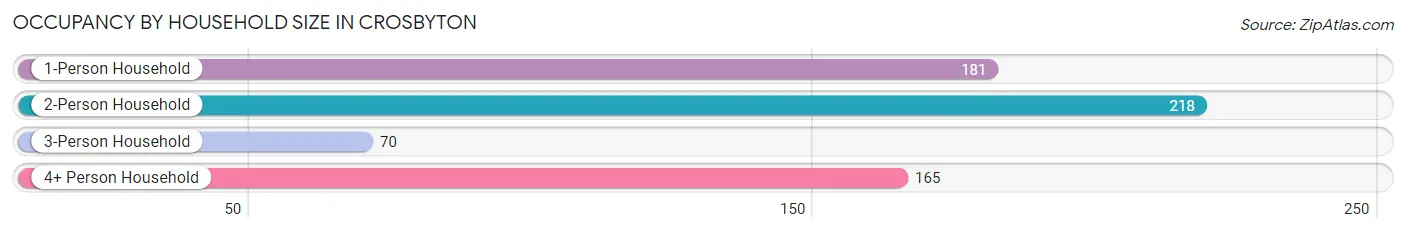
| Household Size | # Housing Units | % Housing Units |
| 1-Person Household | 181 | 28.5% |
| 2-Person Household | 218 | 34.4% |
| 3-Person Household | 70 | 11.0% |
| 4+ Person Household | 165 | 26.0% |
| Total Housing Units | 634 | 100.0% |
Occupancy by Ownership by Household Size in Crosbyton
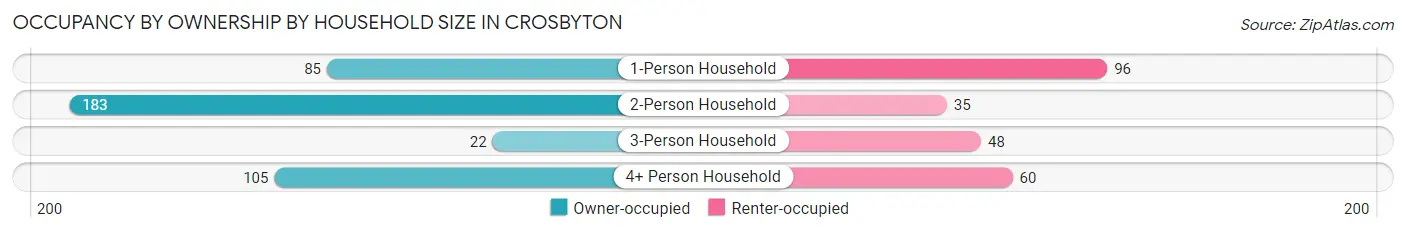
| Household Size | Owner-occupied | Renter-occupied |
| 1-Person Household | 85 (47.0%) | 96 (53.0%) |
| 2-Person Household | 183 (83.9%) | 35 (16.1%) |
| 3-Person Household | 22 (31.4%) | 48 (68.6%) |
| 4+ Person Household | 105 (63.6%) | 60 (36.4%) |
| Total Housing Units | 395 (62.3%) | 239 (37.7%) |
Occupancy by Educational Attainment in Crosbyton
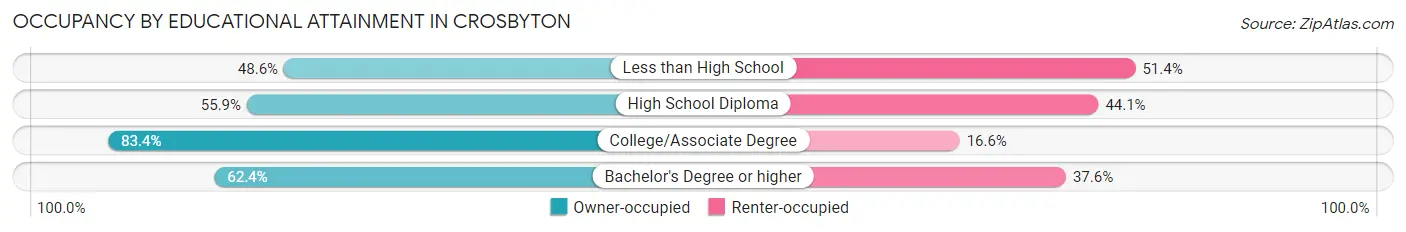
| Household Size | Owner-occupied | Renter-occupied |
| Less than High School | 69 (48.6%) | 73 (51.4%) |
| High School Diploma | 132 (55.9%) | 104 (44.1%) |
| College/Associate Degree | 136 (83.4%) | 27 (16.6%) |
| Bachelor's Degree or higher | 58 (62.4%) | 35 (37.6%) |
Occupancy by Age of Householder in Crosbyton
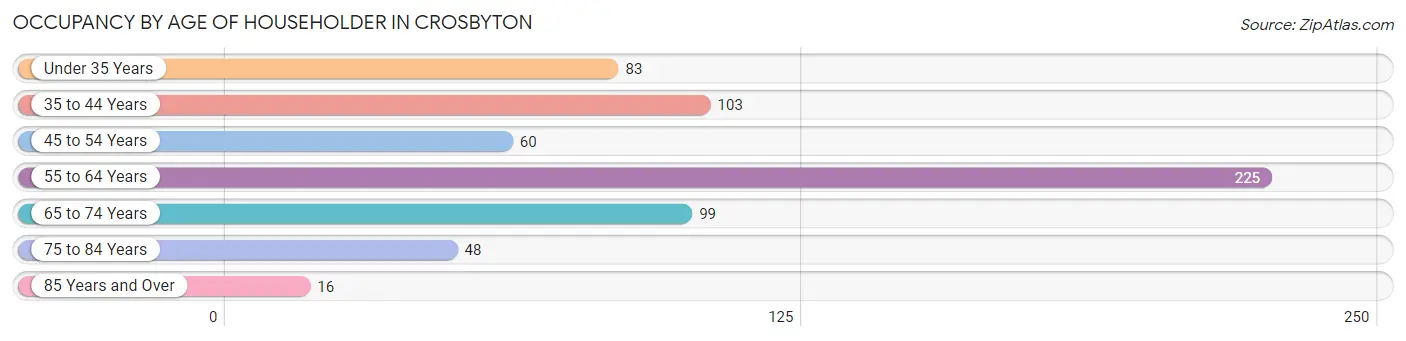
| Age Bracket | # Households | % Households |
| Under 35 Years | 83 | 13.1% |
| 35 to 44 Years | 103 | 16.3% |
| 45 to 54 Years | 60 | 9.5% |
| 55 to 64 Years | 225 | 35.5% |
| 65 to 74 Years | 99 | 15.6% |
| 75 to 84 Years | 48 | 7.6% |
| 85 Years and Over | 16 | 2.5% |
| Total | 634 | 100.0% |
Housing Finances in Crosbyton
Median Income by Occupancy in Crosbyton
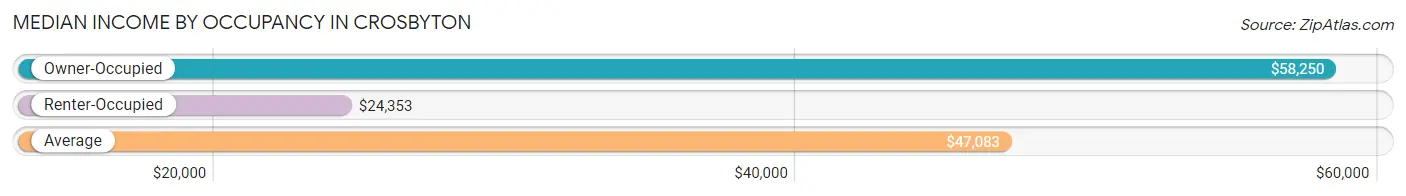
| Occupancy Type | # Households | Median Income |
| Owner-Occupied | 395 (62.3%) | $58,250 |
| Renter-Occupied | 239 (37.7%) | $24,353 |
| Average | 634 (100.0%) | $47,083 |
Occupancy by Householder Income Bracket in Crosbyton
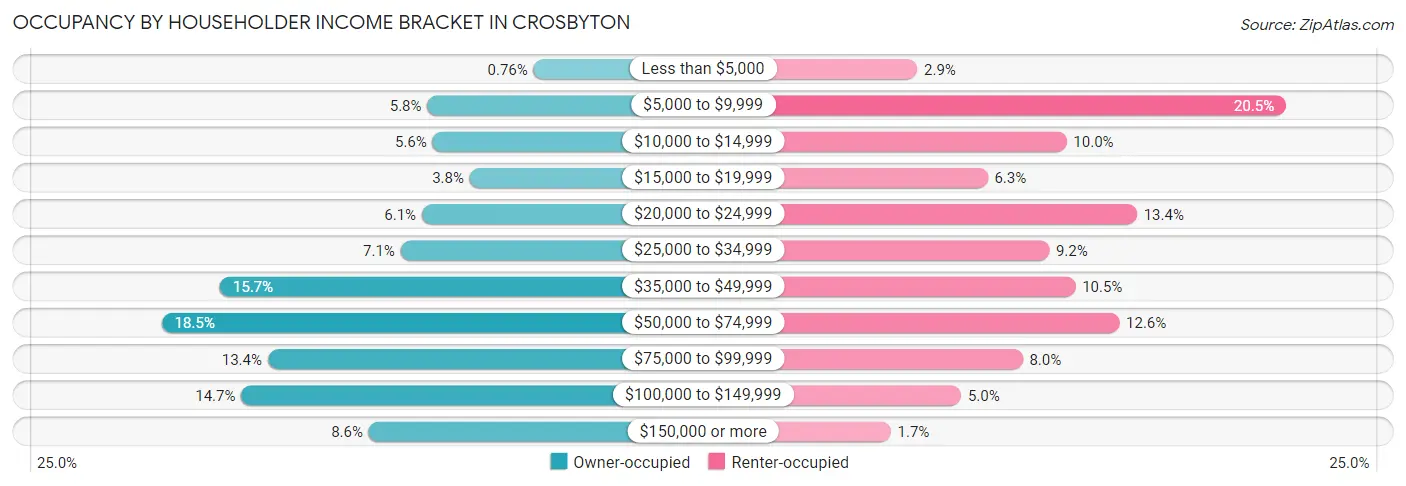
| Income Bracket | Owner-occupied | Renter-occupied |
| Less than $5,000 | 3 (0.8%) | 7 (2.9%) |
| $5,000 to $9,999 | 23 (5.8%) | 49 (20.5%) |
| $10,000 to $14,999 | 22 (5.6%) | 24 (10.0%) |
| $15,000 to $19,999 | 15 (3.8%) | 15 (6.3%) |
| $20,000 to $24,999 | 24 (6.1%) | 32 (13.4%) |
| $25,000 to $34,999 | 28 (7.1%) | 22 (9.2%) |
| $35,000 to $49,999 | 62 (15.7%) | 25 (10.5%) |
| $50,000 to $74,999 | 73 (18.5%) | 30 (12.6%) |
| $75,000 to $99,999 | 53 (13.4%) | 19 (8.0%) |
| $100,000 to $149,999 | 58 (14.7%) | 12 (5.0%) |
| $150,000 or more | 34 (8.6%) | 4 (1.7%) |
| Total | 395 (100.0%) | 239 (100.0%) |
Monthly Housing Cost Tiers in Crosbyton
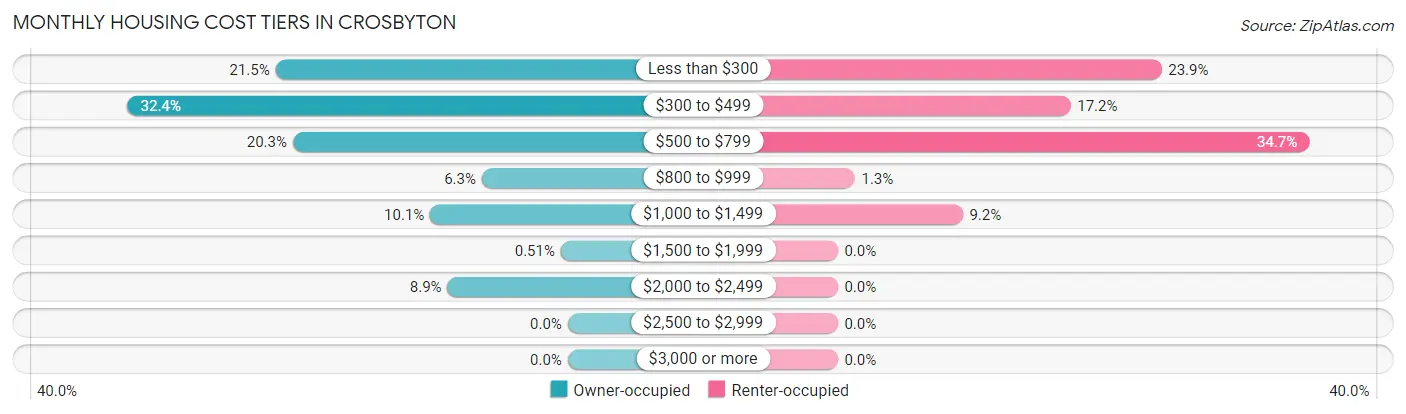
| Monthly Cost | Owner-occupied | Renter-occupied |
| Less than $300 | 85 (21.5%) | 57 (23.8%) |
| $300 to $499 | 128 (32.4%) | 41 (17.2%) |
| $500 to $799 | 80 (20.3%) | 83 (34.7%) |
| $800 to $999 | 25 (6.3%) | 3 (1.3%) |
| $1,000 to $1,499 | 40 (10.1%) | 22 (9.2%) |
| $1,500 to $1,999 | 2 (0.5%) | 0 (0.0%) |
| $2,000 to $2,499 | 35 (8.9%) | 0 (0.0%) |
| $2,500 to $2,999 | 0 (0.0%) | 0 (0.0%) |
| $3,000 or more | 0 (0.0%) | 0 (0.0%) |
| Total | 395 (100.0%) | 239 (100.0%) |
Physical Housing Characteristics in Crosbyton
Housing Structures in Crosbyton
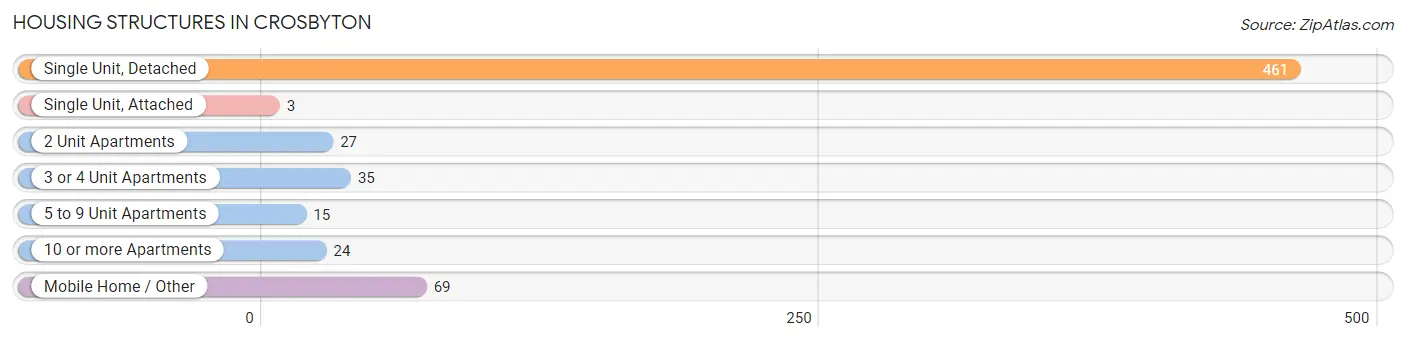
| Structure Type | # Housing Units | % Housing Units |
| Single Unit, Detached | 461 | 72.7% |
| Single Unit, Attached | 3 | 0.5% |
| 2 Unit Apartments | 27 | 4.3% |
| 3 or 4 Unit Apartments | 35 | 5.5% |
| 5 to 9 Unit Apartments | 15 | 2.4% |
| 10 or more Apartments | 24 | 3.8% |
| Mobile Home / Other | 69 | 10.9% |
| Total | 634 | 100.0% |
Housing Structures by Occupancy in Crosbyton
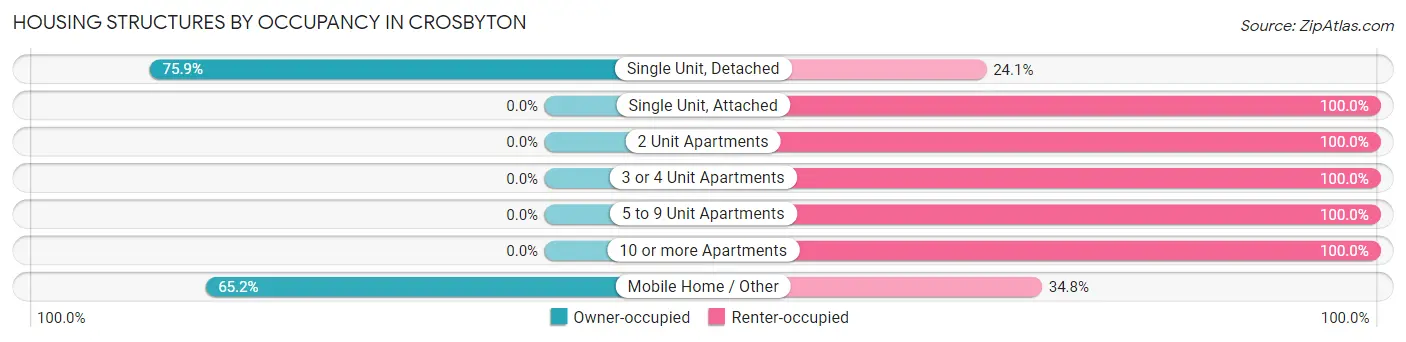
| Structure Type | Owner-occupied | Renter-occupied |
| Single Unit, Detached | 350 (75.9%) | 111 (24.1%) |
| Single Unit, Attached | 0 (0.0%) | 3 (100.0%) |
| 2 Unit Apartments | 0 (0.0%) | 27 (100.0%) |
| 3 or 4 Unit Apartments | 0 (0.0%) | 35 (100.0%) |
| 5 to 9 Unit Apartments | 0 (0.0%) | 15 (100.0%) |
| 10 or more Apartments | 0 (0.0%) | 24 (100.0%) |
| Mobile Home / Other | 45 (65.2%) | 24 (34.8%) |
| Total | 395 (62.3%) | 239 (37.7%) |
Housing Structures by Number of Rooms in Crosbyton
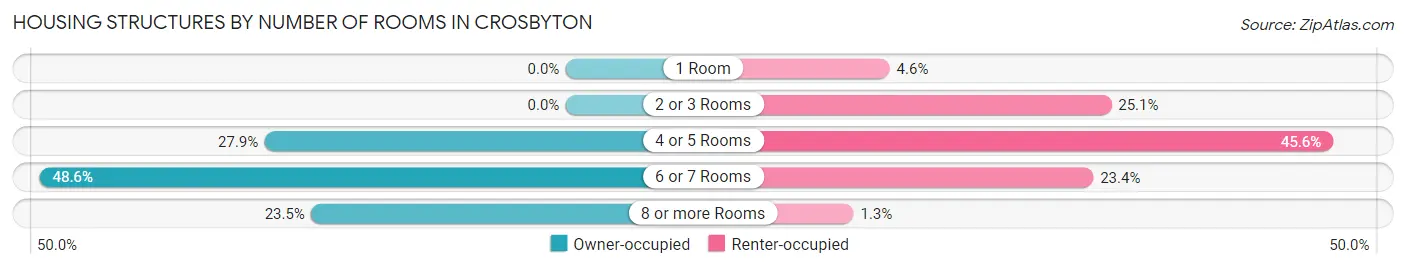
| Number of Rooms | Owner-occupied | Renter-occupied |
| 1 Room | 0 (0.0%) | 11 (4.6%) |
| 2 or 3 Rooms | 0 (0.0%) | 60 (25.1%) |
| 4 or 5 Rooms | 110 (27.9%) | 109 (45.6%) |
| 6 or 7 Rooms | 192 (48.6%) | 56 (23.4%) |
| 8 or more Rooms | 93 (23.5%) | 3 (1.3%) |
| Total | 395 (100.0%) | 239 (100.0%) |
Housing Structure by Heating Type in Crosbyton
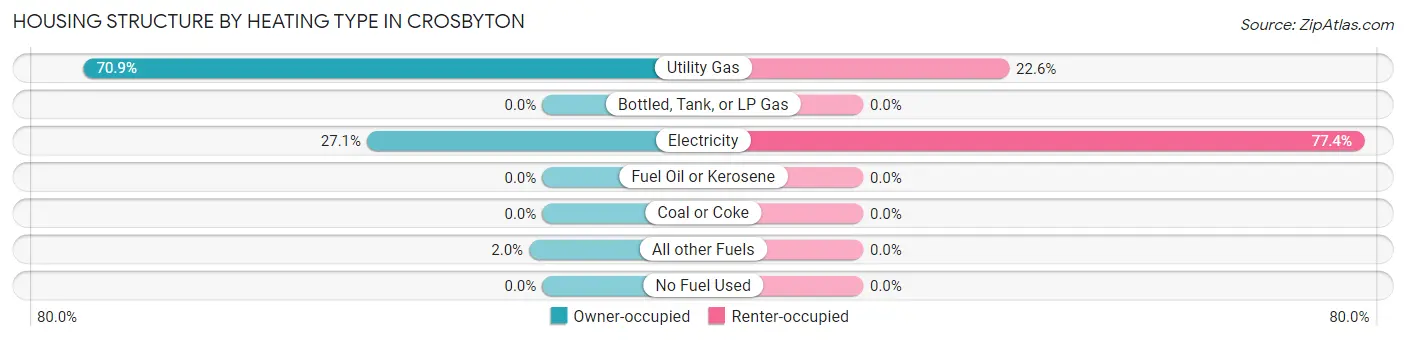
| Heating Type | Owner-occupied | Renter-occupied |
| Utility Gas | 280 (70.9%) | 54 (22.6%) |
| Bottled, Tank, or LP Gas | 0 (0.0%) | 0 (0.0%) |
| Electricity | 107 (27.1%) | 185 (77.4%) |
| Fuel Oil or Kerosene | 0 (0.0%) | 0 (0.0%) |
| Coal or Coke | 0 (0.0%) | 0 (0.0%) |
| All other Fuels | 8 (2.0%) | 0 (0.0%) |
| No Fuel Used | 0 (0.0%) | 0 (0.0%) |
| Total | 395 (100.0%) | 239 (100.0%) |
Household Vehicle Usage in Crosbyton
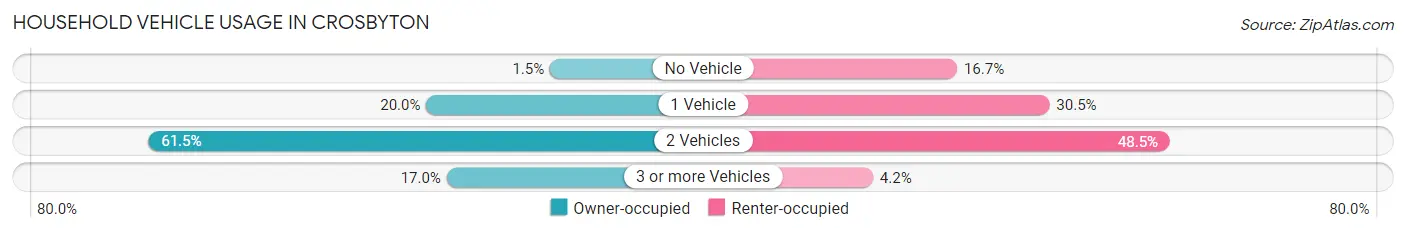
| Vehicles per Household | Owner-occupied | Renter-occupied |
| No Vehicle | 6 (1.5%) | 40 (16.7%) |
| 1 Vehicle | 79 (20.0%) | 73 (30.5%) |
| 2 Vehicles | 243 (61.5%) | 116 (48.5%) |
| 3 or more Vehicles | 67 (17.0%) | 10 (4.2%) |
| Total | 395 (100.0%) | 239 (100.0%) |
Real Estate & Mortgages in Crosbyton
Real Estate and Mortgage Overview in Crosbyton
| Characteristic | Without Mortgage | With Mortgage |
| Housing Units | 294 | 101 |
| Median Property Value | $43,200 | $94,300 |
| Median Household Income | $48,485 | $9 |
| Monthly Housing Costs | $387 | $0 |
| Real Estate Taxes | $900 | $0 |
Property Value by Mortgage Status in Crosbyton
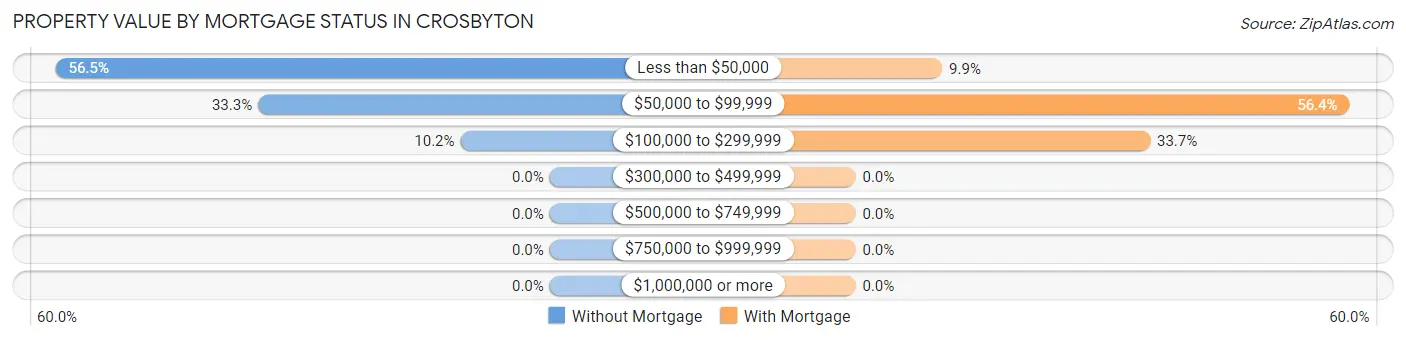
| Property Value | Without Mortgage | With Mortgage |
| Less than $50,000 | 166 (56.5%) | 10 (9.9%) |
| $50,000 to $99,999 | 98 (33.3%) | 57 (56.4%) |
| $100,000 to $299,999 | 30 (10.2%) | 34 (33.7%) |
| $300,000 to $499,999 | 0 (0.0%) | 0 (0.0%) |
| $500,000 to $749,999 | 0 (0.0%) | 0 (0.0%) |
| $750,000 to $999,999 | 0 (0.0%) | 0 (0.0%) |
| $1,000,000 or more | 0 (0.0%) | 0 (0.0%) |
| Total | 294 (100.0%) | 101 (100.0%) |
Household Income by Mortgage Status in Crosbyton
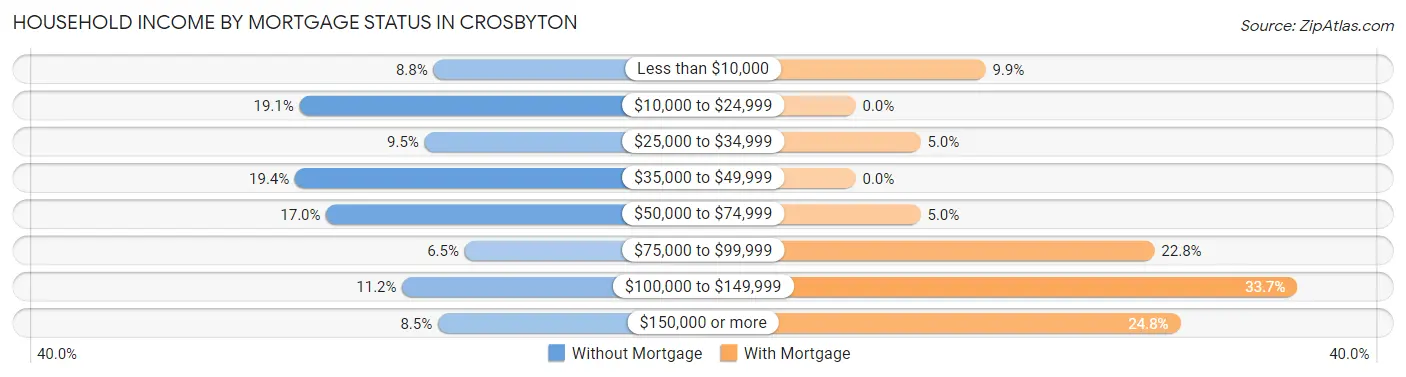
| Household Income | Without Mortgage | With Mortgage |
| Less than $10,000 | 26 (8.8%) | 10 (9.9%) |
| $10,000 to $24,999 | 56 (19.1%) | 0 (0.0%) |
| $25,000 to $34,999 | 28 (9.5%) | 5 (5.0%) |
| $35,000 to $49,999 | 57 (19.4%) | 0 (0.0%) |
| $50,000 to $74,999 | 50 (17.0%) | 5 (5.0%) |
| $75,000 to $99,999 | 19 (6.5%) | 23 (22.8%) |
| $100,000 to $149,999 | 33 (11.2%) | 34 (33.7%) |
| $150,000 or more | 25 (8.5%) | 25 (24.7%) |
| Total | 294 (100.0%) | 101 (100.0%) |
Property Value to Household Income Ratio in Crosbyton
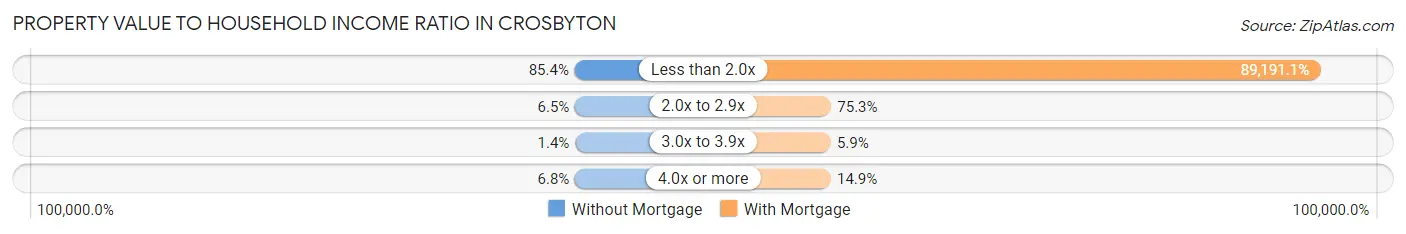
| Value-to-Income Ratio | Without Mortgage | With Mortgage |
| Less than 2.0x | 251 (85.4%) | 90,083 (89,191.1%) |
| 2.0x to 2.9x | 19 (6.5%) | 76 (75.2%) |
| 3.0x to 3.9x | 4 (1.4%) | 6 (5.9%) |
| 4.0x or more | 20 (6.8%) | 15 (14.8%) |
| Total | 294 (100.0%) | 101 (100.0%) |
Real Estate Taxes by Mortgage Status in Crosbyton
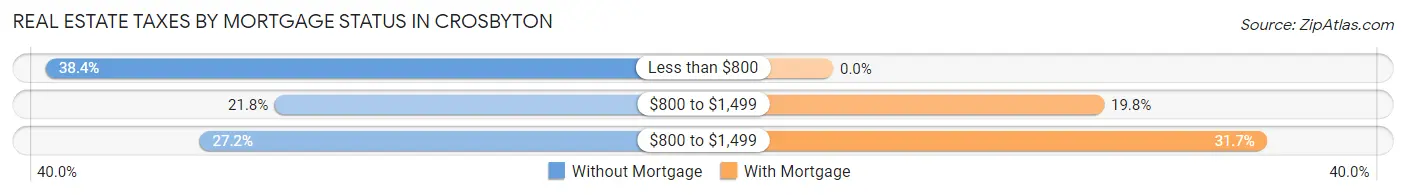
| Property Taxes | Without Mortgage | With Mortgage |
| Less than $800 | 113 (38.4%) | 0 (0.0%) |
| $800 to $1,499 | 64 (21.8%) | 20 (19.8%) |
| $800 to $1,499 | 80 (27.2%) | 32 (31.7%) |
| Total | 294 (100.0%) | 101 (100.0%) |
Health & Disability in Crosbyton
Health Insurance Coverage by Age in Crosbyton
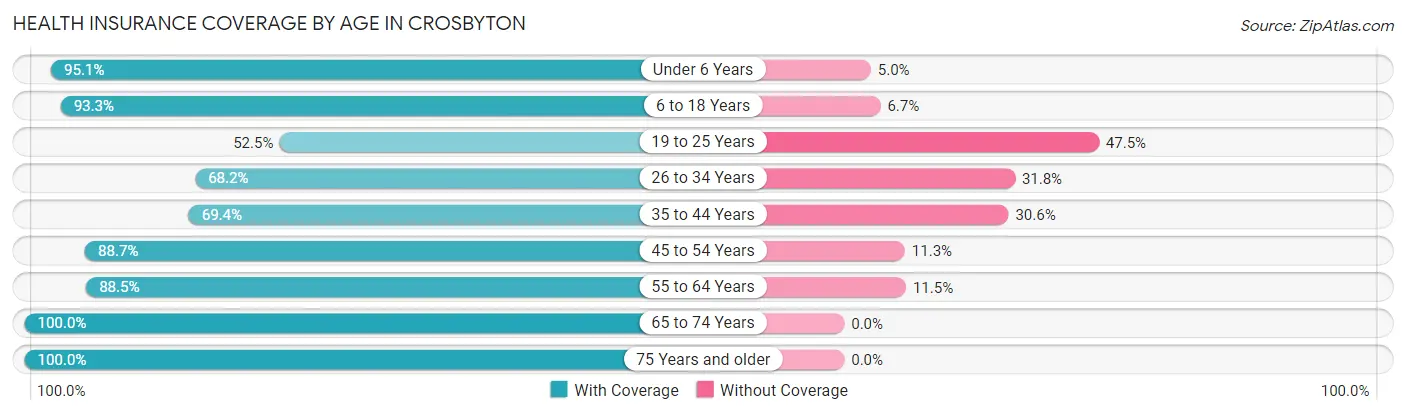
| Age Bracket | With Coverage | Without Coverage |
| Under 6 Years | 173 (95.1%) | 9 (5.0%) |
| 6 to 18 Years | 249 (93.3%) | 18 (6.7%) |
| 19 to 25 Years | 73 (52.5%) | 66 (47.5%) |
| 26 to 34 Years | 105 (68.2%) | 49 (31.8%) |
| 35 to 44 Years | 111 (69.4%) | 49 (30.6%) |
| 45 to 54 Years | 102 (88.7%) | 13 (11.3%) |
| 55 to 64 Years | 277 (88.5%) | 36 (11.5%) |
| 65 to 74 Years | 163 (100.0%) | 0 (0.0%) |
| 75 Years and older | 109 (100.0%) | 0 (0.0%) |
| Total | 1,362 (85.0%) | 240 (15.0%) |
Health Insurance Coverage by Citizenship Status in Crosbyton
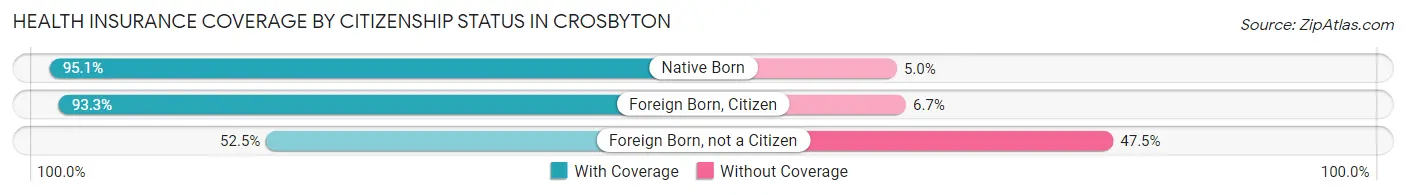
| Citizenship Status | With Coverage | Without Coverage |
| Native Born | 173 (95.1%) | 9 (5.0%) |
| Foreign Born, Citizen | 249 (93.3%) | 18 (6.7%) |
| Foreign Born, not a Citizen | 73 (52.5%) | 66 (47.5%) |
Health Insurance Coverage by Household Income in Crosbyton
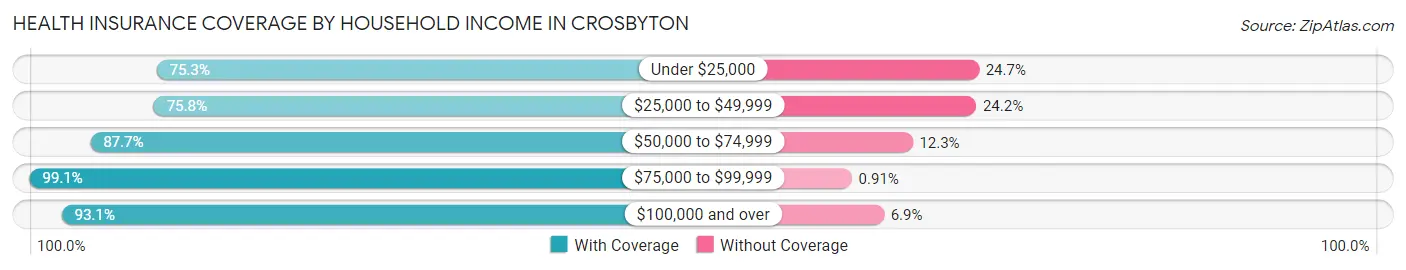
| Household Income | With Coverage | Without Coverage |
| Under $25,000 | 268 (75.3%) | 88 (24.7%) |
| $25,000 to $49,999 | 260 (75.8%) | 83 (24.2%) |
| $50,000 to $74,999 | 321 (87.7%) | 45 (12.3%) |
| $75,000 to $99,999 | 217 (99.1%) | 2 (0.9%) |
| $100,000 and over | 296 (93.1%) | 22 (6.9%) |
Public vs Private Health Insurance Coverage by Age in Crosbyton
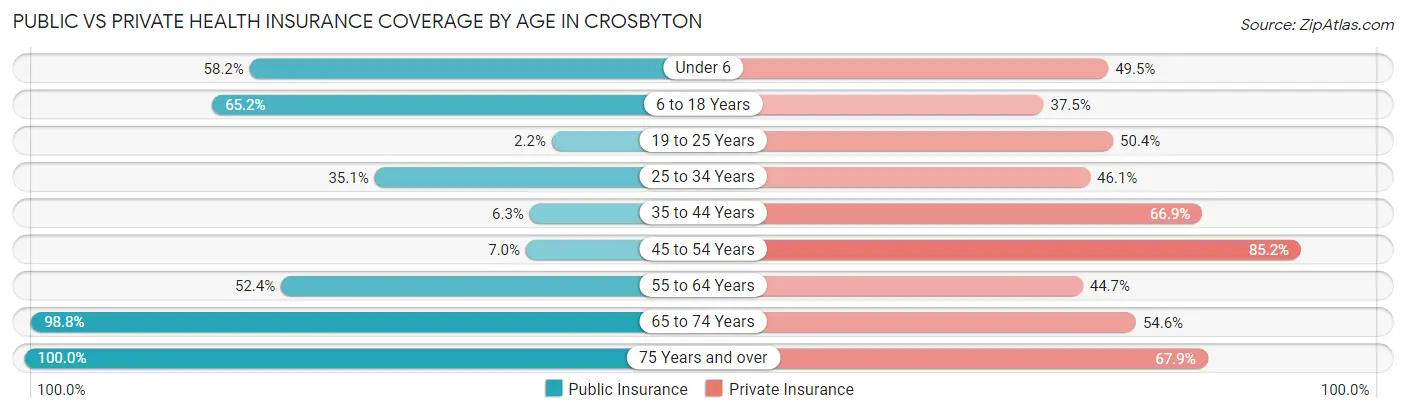
| Age Bracket | Public Insurance | Private Insurance |
| Under 6 | 106 (58.2%) | 90 (49.4%) |
| 6 to 18 Years | 174 (65.2%) | 100 (37.4%) |
| 19 to 25 Years | 3 (2.2%) | 70 (50.4%) |
| 25 to 34 Years | 54 (35.1%) | 71 (46.1%) |
| 35 to 44 Years | 10 (6.2%) | 107 (66.9%) |
| 45 to 54 Years | 8 (7.0%) | 98 (85.2%) |
| 55 to 64 Years | 164 (52.4%) | 140 (44.7%) |
| 65 to 74 Years | 161 (98.8%) | 89 (54.6%) |
| 75 Years and over | 109 (100.0%) | 74 (67.9%) |
| Total | 789 (49.2%) | 839 (52.4%) |
Disability Status by Sex by Age in Crosbyton
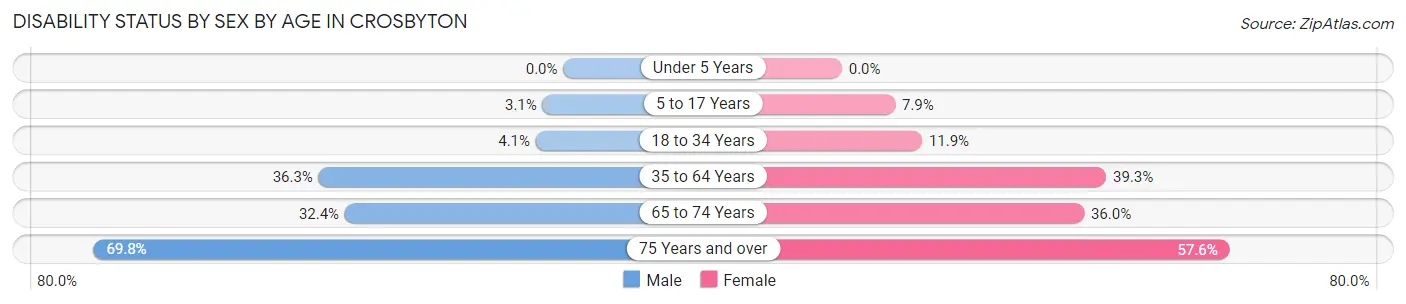
| Age Bracket | Male | Female |
| Under 5 Years | 0 (0.0%) | 0 (0.0%) |
| 5 to 17 Years | 4 (3.1%) | 12 (7.9%) |
| 18 to 34 Years | 8 (4.1%) | 15 (11.9%) |
| 35 to 64 Years | 97 (36.3%) | 126 (39.3%) |
| 65 to 74 Years | 24 (32.4%) | 32 (36.0%) |
| 75 Years and over | 30 (69.8%) | 38 (57.6%) |
Disability Class by Sex by Age in Crosbyton
Disability Class: Hearing Difficulty
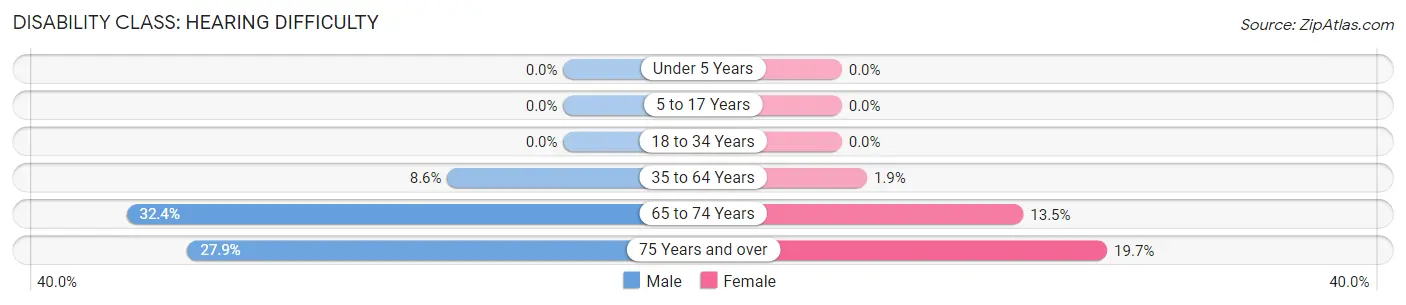
| Age Bracket | Male | Female |
| Under 5 Years | 0 (0.0%) | 0 (0.0%) |
| 5 to 17 Years | 0 (0.0%) | 0 (0.0%) |
| 18 to 34 Years | 0 (0.0%) | 0 (0.0%) |
| 35 to 64 Years | 23 (8.6%) | 6 (1.9%) |
| 65 to 74 Years | 24 (32.4%) | 12 (13.5%) |
| 75 Years and over | 12 (27.9%) | 13 (19.7%) |
Disability Class: Vision Difficulty
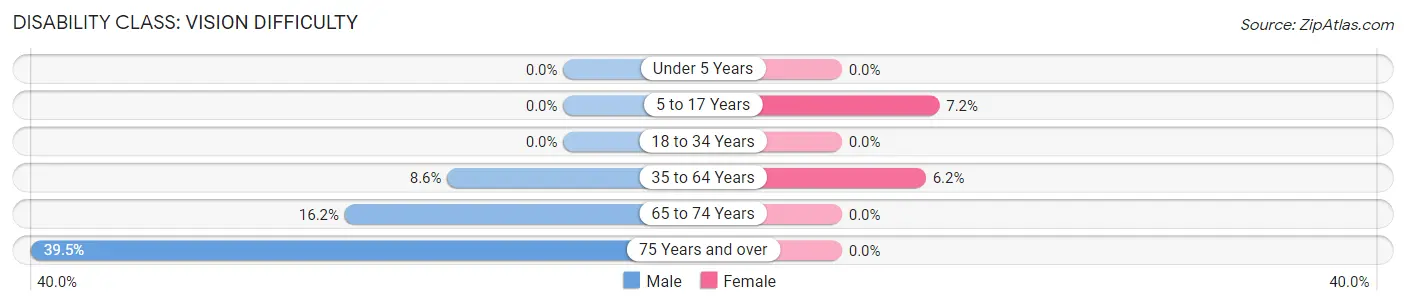
| Age Bracket | Male | Female |
| Under 5 Years | 0 (0.0%) | 0 (0.0%) |
| 5 to 17 Years | 0 (0.0%) | 11 (7.2%) |
| 18 to 34 Years | 0 (0.0%) | 0 (0.0%) |
| 35 to 64 Years | 23 (8.6%) | 20 (6.2%) |
| 65 to 74 Years | 12 (16.2%) | 0 (0.0%) |
| 75 Years and over | 17 (39.5%) | 0 (0.0%) |
Disability Class: Cognitive Difficulty
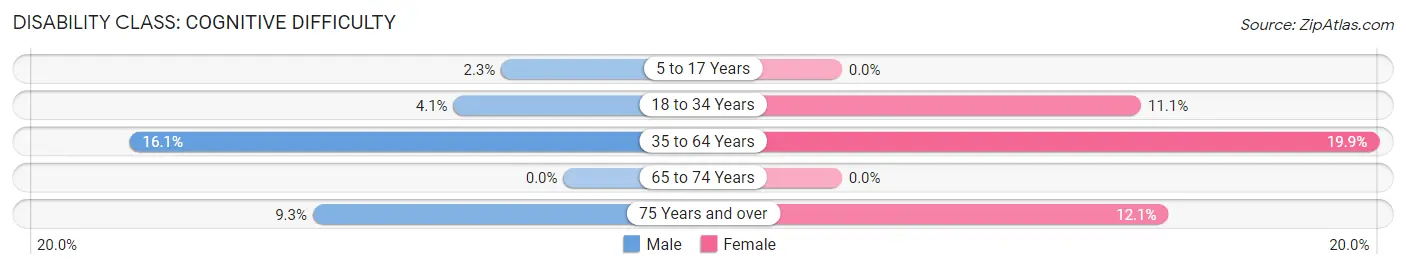
| Age Bracket | Male | Female |
| 5 to 17 Years | 3 (2.3%) | 0 (0.0%) |
| 18 to 34 Years | 8 (4.1%) | 14 (11.1%) |
| 35 to 64 Years | 43 (16.1%) | 64 (19.9%) |
| 65 to 74 Years | 0 (0.0%) | 0 (0.0%) |
| 75 Years and over | 4 (9.3%) | 8 (12.1%) |
Disability Class: Ambulatory Difficulty
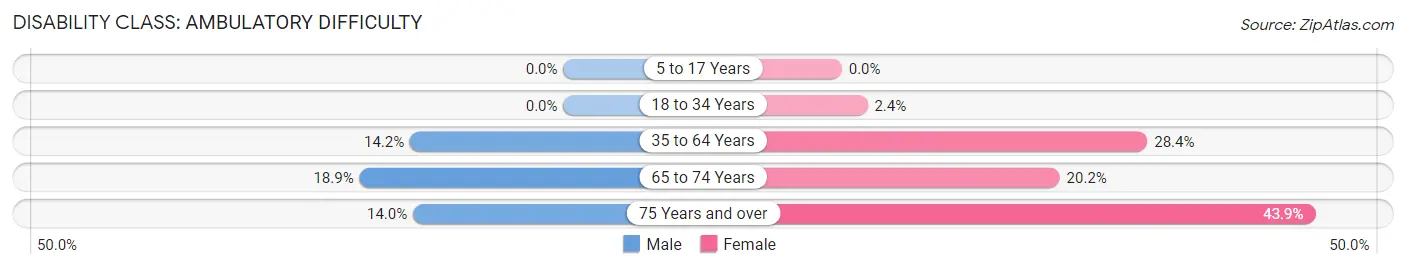
| Age Bracket | Male | Female |
| 5 to 17 Years | 0 (0.0%) | 0 (0.0%) |
| 18 to 34 Years | 0 (0.0%) | 3 (2.4%) |
| 35 to 64 Years | 38 (14.2%) | 91 (28.3%) |
| 65 to 74 Years | 14 (18.9%) | 18 (20.2%) |
| 75 Years and over | 6 (14.0%) | 29 (43.9%) |
Disability Class: Self-Care Difficulty
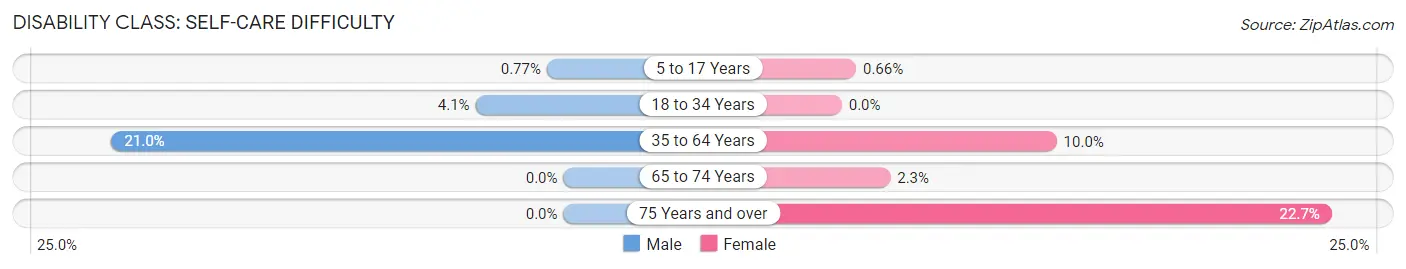
| Age Bracket | Male | Female |
| 5 to 17 Years | 1 (0.8%) | 1 (0.7%) |
| 18 to 34 Years | 8 (4.1%) | 0 (0.0%) |
| 35 to 64 Years | 56 (21.0%) | 32 (10.0%) |
| 65 to 74 Years | 0 (0.0%) | 2 (2.2%) |
| 75 Years and over | 0 (0.0%) | 15 (22.7%) |
Technology Access in Crosbyton
Computing Device Access in Crosbyton
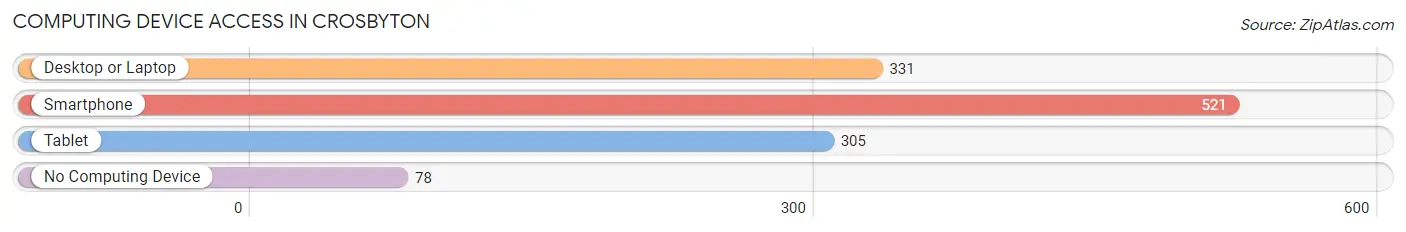
| Device Type | # Households | % Households |
| Desktop or Laptop | 331 | 52.2% |
| Smartphone | 521 | 82.2% |
| Tablet | 305 | 48.1% |
| No Computing Device | 78 | 12.3% |
| Total | 634 | 100.0% |
Internet Access in Crosbyton
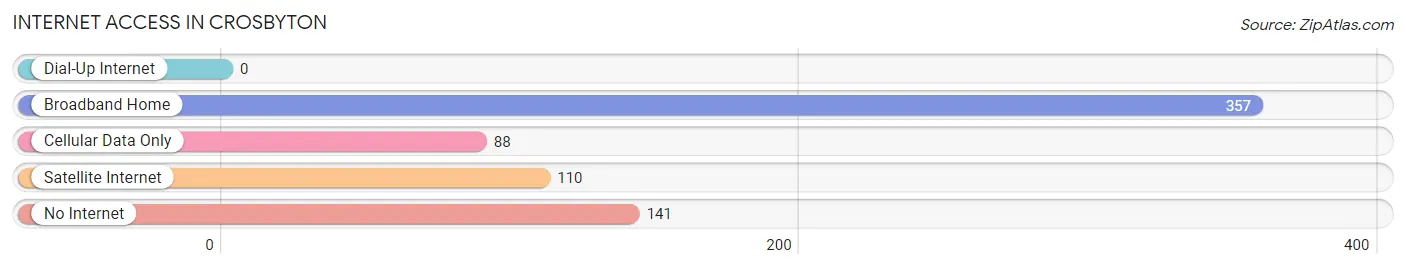
| Internet Type | # Households | % Households |
| Dial-Up Internet | 0 | 0.0% |
| Broadband Home | 357 | 56.3% |
| Cellular Data Only | 88 | 13.9% |
| Satellite Internet | 110 | 17.3% |
| No Internet | 141 | 22.2% |
| Total | 634 | 100.0% |
Crosbyton Summary
Crosbyton is a small town located in Crosby County, Texas, United States. It is situated in the South Plains region of the state, approximately 50 miles east of Lubbock. The town was founded in 1892 and named after Stephen Crosby, a local rancher. As of the 2010 census, the population of Crosbyton was 1,741.
History
The area around Crosbyton was first settled in the late 1880s by ranchers and farmers. The town was founded in 1892 and named after Stephen Crosby, a local rancher. The town was incorporated in 1909 and the first post office was established in 1910.
In the early 1900s, the town was a center for cotton production and the local economy was largely based on agriculture. The town also had a number of businesses, including a bank, a hotel, a general store, and a newspaper.
In the 1920s, the town began to experience a period of growth and development. The first school was built in 1923 and the first hospital was established in 1925. The town also had a number of churches, including the First Baptist Church, which was established in 1924.
In the 1930s, the Great Depression had a significant impact on the town. Many businesses closed and the population declined. However, the town was able to survive and the economy began to recover in the 1940s.
Geography
Crosbyton is located in the South Plains region of Texas, approximately 50 miles east of Lubbock. The town is situated at the intersection of U.S. Highway 82 and State Highway 207. The town is surrounded by farmland and is located near the White River.
The climate in Crosbyton is semi-arid, with hot summers and mild winters. The average annual temperature is 64°F and the average annual precipitation is 19 inches.
Economy
The economy of Crosbyton is largely based on agriculture. The town is home to a number of farms and ranches, which produce cotton, wheat, corn, and other crops. The town also has a number of businesses, including a bank, a hotel, a general store, and a newspaper.
Demographics
As of the 2010 census, the population of Crosbyton was 1,741. The racial makeup of the town was 79.2% White, 0.2% African American, 0.7% Native American, 0.2% Asian, 0.1% Pacific Islander, 17.7% from other races, and 2.0% from two or more races. Hispanic or Latino of any race were 33.2% of the population.
The median household income in Crosbyton was $30,938 and the median family income was $35,625. The per capita income was $15,845. About 18.2% of the population was below the poverty line.
Common Questions
What is Per Capita Income in Crosbyton?
Per Capita income in Crosbyton is $35,177.
What is the Median Family Income in Crosbyton?
Median Family Income in Crosbyton is $61,058.
What is the Median Household income in Crosbyton?
Median Household Income in Crosbyton is $47,083.
What is Income or Wage Gap in Crosbyton?
Income or Wage Gap in Crosbyton is 18.2%.
Women in Crosbyton earn 81.8 cents for every dollar earned by a man.
What is Inequality or Gini Index in Crosbyton?
Inequality or Gini Index in Crosbyton is 0.64.
What is the Total Population of Crosbyton?
Total Population of Crosbyton is 1,657.
What is the Total Male Population of Crosbyton?
Total Male Population of Crosbyton is 828.
What is the Total Female Population of Crosbyton?
Total Female Population of Crosbyton is 829.
What is the Ratio of Males per 100 Females in Crosbyton?
There are 99.88 Males per 100 Females in Crosbyton.
What is the Ratio of Females per 100 Males in Crosbyton?
There are 100.12 Females per 100 Males in Crosbyton.
What is the Median Population Age in Crosbyton?
Median Population Age in Crosbyton is 39.1 Years.
What is the Average Family Size in Crosbyton
Average Family Size in Crosbyton is 3.0 People.
What is the Average Household Size in Crosbyton
Average Household Size in Crosbyton is 2.5 People.
How Large is the Labor Force in Crosbyton?
There are 665 People in the Labor Forcein in Crosbyton.
What is the Percentage of People in the Labor Force in Crosbyton?
52.7% of People are in the Labor Force in Crosbyton.
What is the Unemployment Rate in Crosbyton?
Unemployment Rate in Crosbyton is 7.5%.