Kingsbury, TX Map & Demographics
Kingsbury Map
Kingsbury Overview
$27,332
PER CAPITA INCOME
$76,250
AVG FAMILY INCOME
$75,956
AVG HOUSEHOLD INCOME
0.30
INEQUALITY / GINI INDEX
157
TOTAL POPULATION
73
MALE POPULATION
84
FEMALE POPULATION
86.90
MALES / 100 FEMALES
115.07
FEMALES / 100 MALES
42.8
MEDIAN AGE
2.8
AVG FAMILY SIZE
3.1
AVG HOUSEHOLD SIZE
72
LABOR FORCE [ PEOPLE ]
55.8%
PERCENT IN LABOR FORCE
5.6%
UNEMPLOYMENT RATE
Kingsbury Zip Codes
Income in Kingsbury
Income Overview in Kingsbury
Per Capita Income in Kingsbury is $27,332, while median incomes of families and households are $76,250 and $75,956 respectively.
| Characteristic | Number | Measure |
| Per Capita Income | 157 | $27,332 |
| Median Family Income | 44 | $76,250 |
| Mean Family Income | 44 | $84,336 |
| Median Household Income | 51 | $75,956 |
| Mean Household Income | 51 | $82,212 |
| Income Deficit | 44 | $0 |
| Wage / Income Gap (%) | 157 | 0.00% |
| Wage / Income Gap ($) | 157 | 100.00¢ per $1 |
| Gini / Inequality Index | 157 | 0.30 |
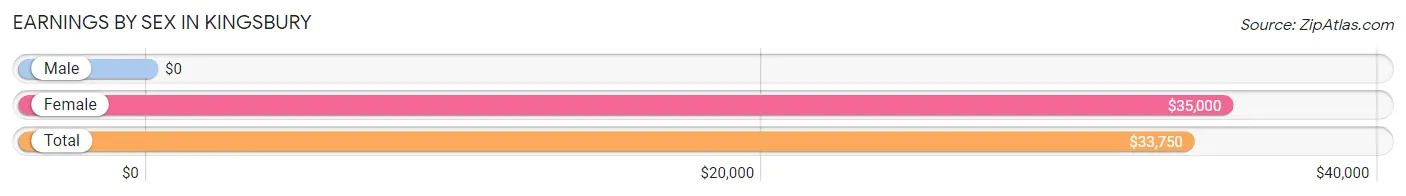
Earnings by Sex in Kingsbury
| Sex | Number | Average Earnings |
| Male | 35 (38.5%) | $0 |
| Female | 56 (61.5%) | $35,000 |
| Total | 91 (100.0%) | $33,750 |
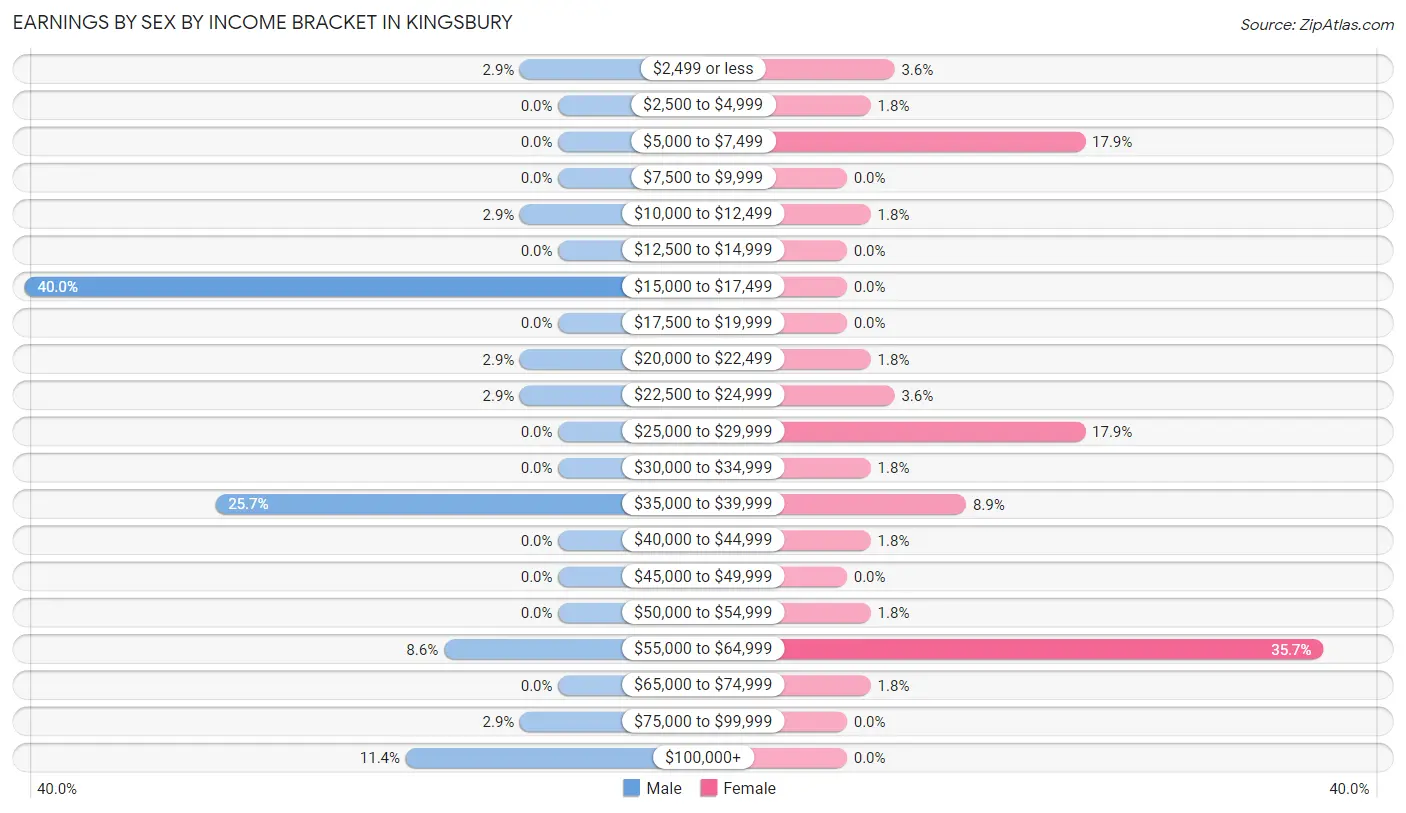
Earnings by Sex by Income Bracket in Kingsbury
The most common earnings brackets in Kingsbury are $15,000 to $17,499 for men (14 | 40.0%) and $55,000 to $64,999 for women (20 | 35.7%).
| Income | Male | Female |
| $2,499 or less | 1 (2.9%) | 2 (3.6%) |
| $2,500 to $4,999 | 0 (0.0%) | 1 (1.8%) |
| $5,000 to $7,499 | 0 (0.0%) | 10 (17.9%) |
| $7,500 to $9,999 | 0 (0.0%) | 0 (0.0%) |
| $10,000 to $12,499 | 1 (2.9%) | 1 (1.8%) |
| $12,500 to $14,999 | 0 (0.0%) | 0 (0.0%) |
| $15,000 to $17,499 | 14 (40.0%) | 0 (0.0%) |
| $17,500 to $19,999 | 0 (0.0%) | 0 (0.0%) |
| $20,000 to $22,499 | 1 (2.9%) | 1 (1.8%) |
| $22,500 to $24,999 | 1 (2.9%) | 2 (3.6%) |
| $25,000 to $29,999 | 0 (0.0%) | 10 (17.9%) |
| $30,000 to $34,999 | 0 (0.0%) | 1 (1.8%) |
| $35,000 to $39,999 | 9 (25.7%) | 5 (8.9%) |
| $40,000 to $44,999 | 0 (0.0%) | 1 (1.8%) |
| $45,000 to $49,999 | 0 (0.0%) | 0 (0.0%) |
| $50,000 to $54,999 | 0 (0.0%) | 1 (1.8%) |
| $55,000 to $64,999 | 3 (8.6%) | 20 (35.7%) |
| $65,000 to $74,999 | 0 (0.0%) | 1 (1.8%) |
| $75,000 to $99,999 | 1 (2.9%) | 0 (0.0%) |
| $100,000+ | 4 (11.4%) | 0 (0.0%) |
| Total | 35 (100.0%) | 56 (100.0%) |
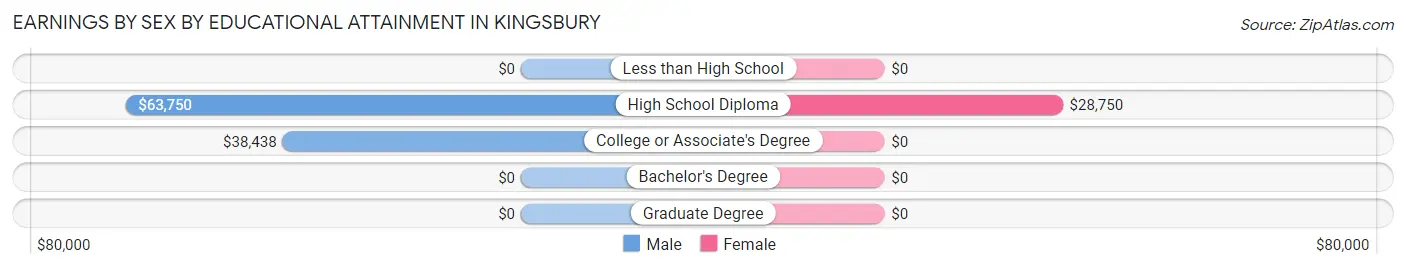
Earnings by Sex by Educational Attainment in Kingsbury
| Educational Attainment | Male Income | Female Income |
| Less than High School | - | - |
| High School Diploma | $63,750 | $28,750 |
| College or Associate's Degree | $38,438 | $0 |
| Bachelor's Degree | - | - |
| Graduate Degree | - | - |
| Total | - | - |
Family Income in Kingsbury
Family Income Brackets in Kingsbury
According to the Kingsbury family income data, there are 21 families falling into the $75,000 to $99,999 income range, which is the most common income bracket and makes up 47.7% of all families.
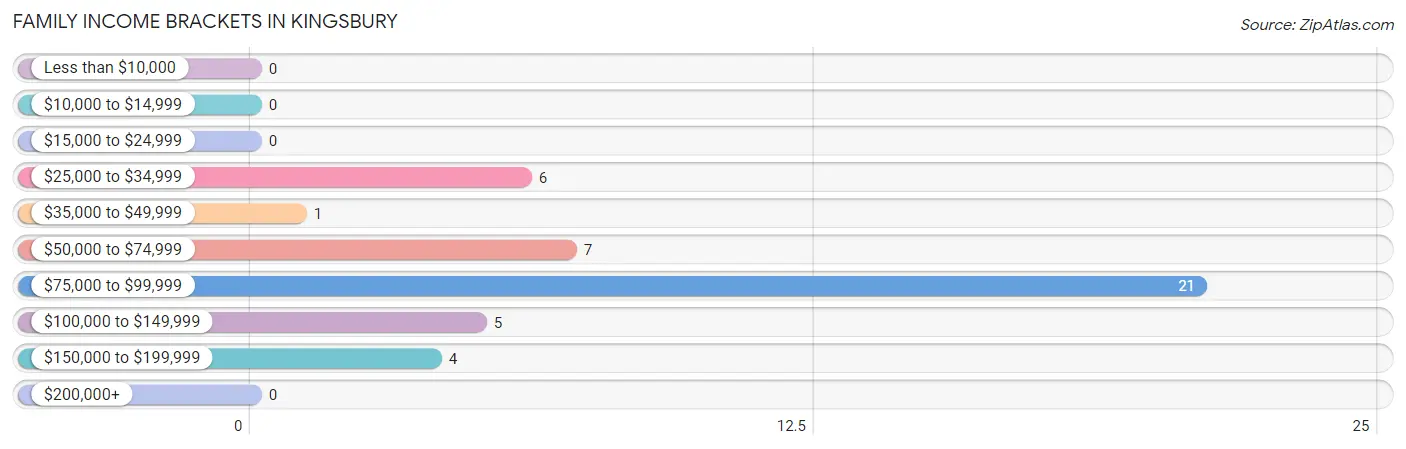
| Income Bracket | # Families | % Families |
| Less than $10,000 | 0 | 0.0% |
| $10,000 to $14,999 | 0 | 0.0% |
| $15,000 to $24,999 | 0 | 0.0% |
| $25,000 to $34,999 | 6 | 13.6% |
| $35,000 to $49,999 | 1 | 2.3% |
| $50,000 to $74,999 | 7 | 15.9% |
| $75,000 to $99,999 | 21 | 47.7% |
| $100,000 to $149,999 | 5 | 11.4% |
| $150,000 to $199,999 | 4 | 9.1% |
| $200,000+ | 0 | 0.0% |
Family Income by Famaliy Size in Kingsbury
3-person families (3 | 6.8%) account for the highest median family income in Kingsbury with $98,750 per family, while 2-person families (34 | 77.3%) have the highest median income of $38,203 per family member.
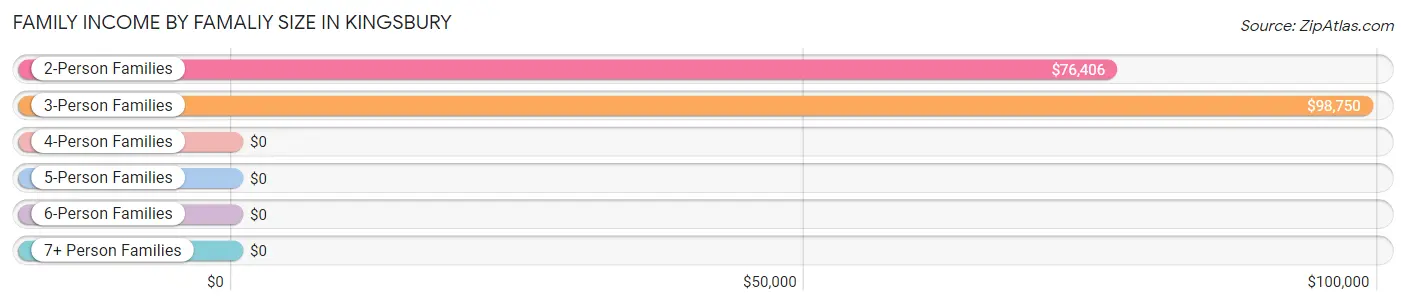
| Income Bracket | # Families | Median Income |
| 2-Person Families | 34 (77.3%) | $76,406 |
| 3-Person Families | 3 (6.8%) | $98,750 |
| 4-Person Families | 5 (11.4%) | $0 |
| 5-Person Families | 0 (0.0%) | $0 |
| 6-Person Families | 0 (0.0%) | $0 |
| 7+ Person Families | 2 (4.5%) | $0 |
| Total | 44 (100.0%) | $76,250 |
Family Income by Number of Earners in Kingsbury
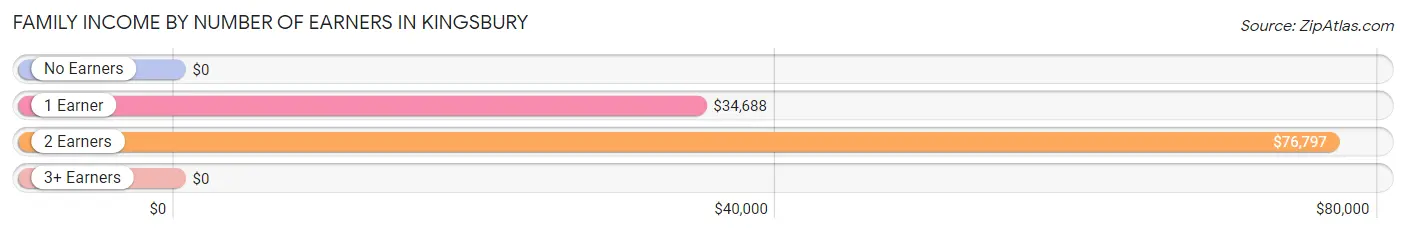
| Number of Earners | # Families | Median Income |
| No Earners | 3 (6.8%) | $0 |
| 1 Earner | 7 (15.9%) | $34,688 |
| 2 Earners | 33 (75.0%) | $76,797 |
| 3+ Earners | 1 (2.3%) | $0 |
| Total | 44 (100.0%) | $76,250 |
Household Income in Kingsbury
Household Income Brackets in Kingsbury
With 23 households falling in the category, the $75,000 to $99,999 income range is the most frequent in Kingsbury, accounting for 45.1% of all households.
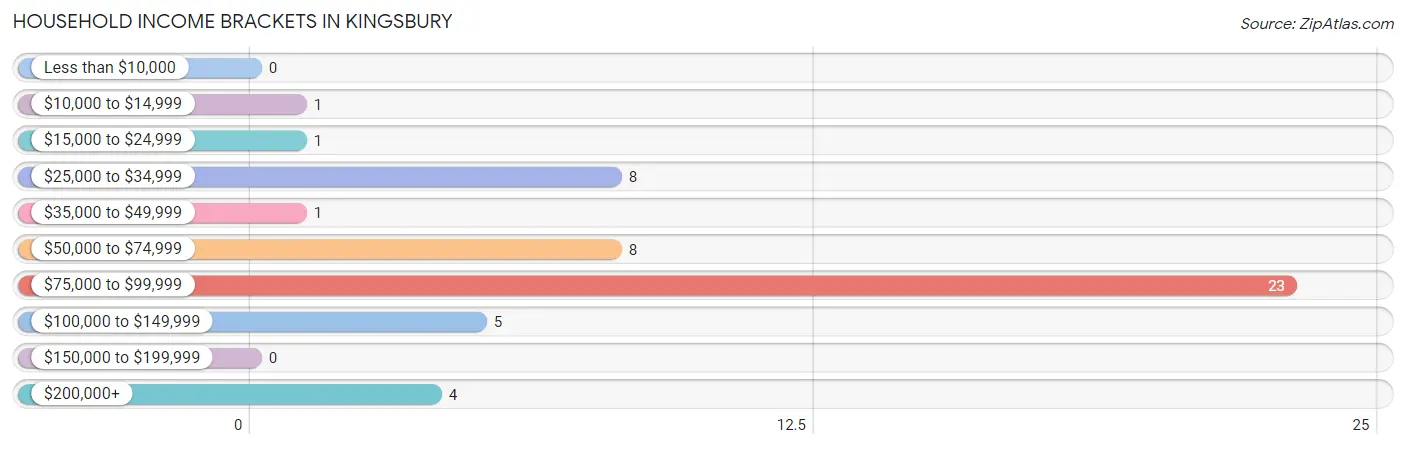
| Income Bracket | # Households | % Households |
| Less than $10,000 | 0 | 0.0% |
| $10,000 to $14,999 | 1 | 2.0% |
| $15,000 to $24,999 | 1 | 2.0% |
| $25,000 to $34,999 | 8 | 15.7% |
| $35,000 to $49,999 | 1 | 2.0% |
| $50,000 to $74,999 | 8 | 15.7% |
| $75,000 to $99,999 | 23 | 45.1% |
| $100,000 to $149,999 | 5 | 9.8% |
| $150,000 to $199,999 | 0 | 0.0% |
| $200,000+ | 4 | 7.8% |
Household Income by Householder Age in Kingsbury
The median household income in Kingsbury is $75,956, with the highest median household income of $76,641 found in the 45 to 64 years age bracket for the primary householder. A total of 31 households (60.8%) fall into this category.
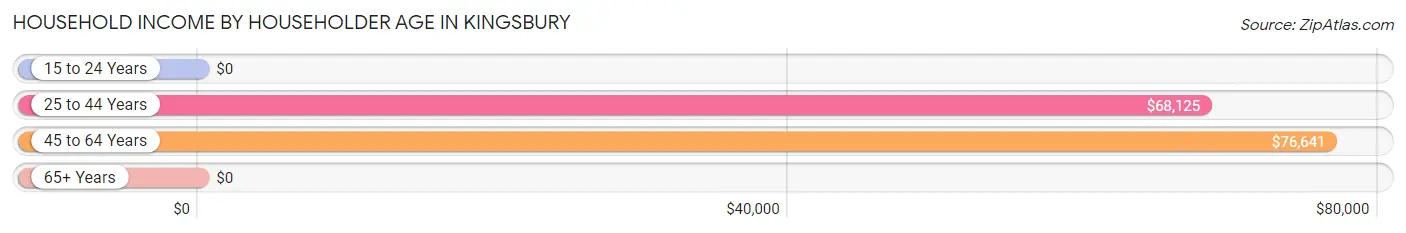
| Income Bracket | # Households | Median Income |
| 15 to 24 Years | 0 (0.0%) | $0 |
| 25 to 44 Years | 8 (15.7%) | $68,125 |
| 45 to 64 Years | 31 (60.8%) | $76,641 |
| 65+ Years | 12 (23.5%) | $0 |
| Total | 51 (100.0%) | $75,956 |
Poverty in Kingsbury
Income Below Poverty by Sex and Age in Kingsbury
With 27.4% poverty level for males and 23.7% for females among the residents of Kingsbury, 6 to 11 year old males and 5 year old females are the most vulnerable to poverty, with 6 males (100.0%) and 1 females (100.0%) in their respective age groups living below the poverty level.
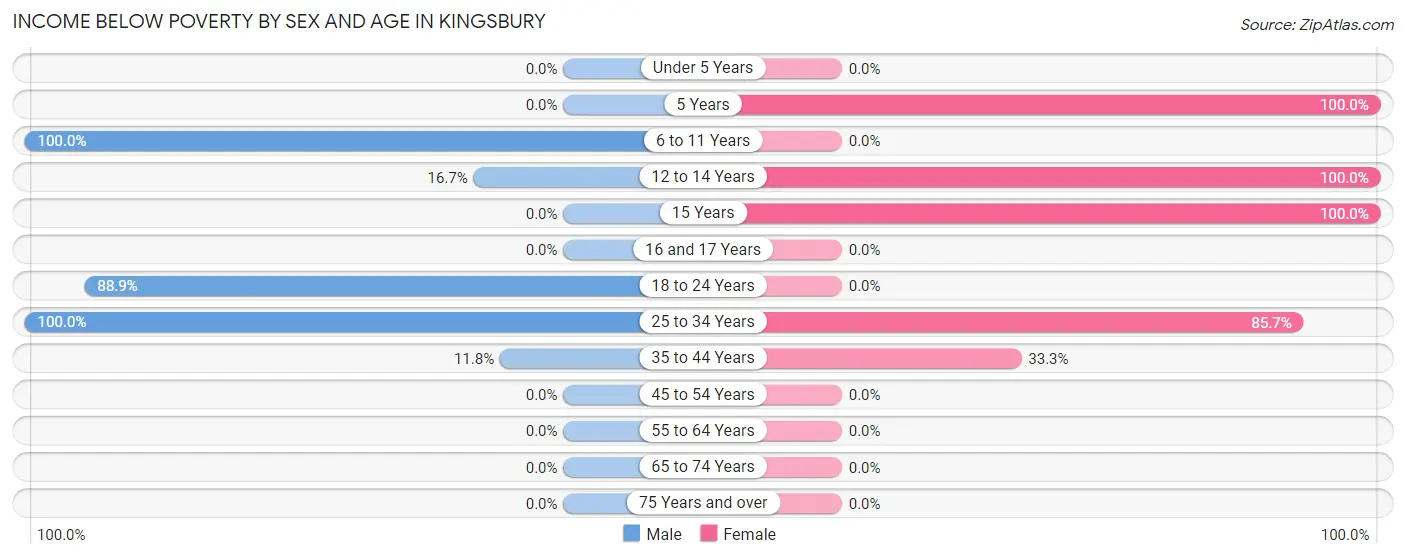
| Age Bracket | Male | Female |
| Under 5 Years | 0 (0.0%) | 0 (0.0%) |
| 5 Years | 0 (0.0%) | 1 (100.0%) |
| 6 to 11 Years | 6 (100.0%) | 0 (0.0%) |
| 12 to 14 Years | 1 (16.7%) | 7 (100.0%) |
| 15 Years | 0 (0.0%) | 3 (100.0%) |
| 16 and 17 Years | 0 (0.0%) | 0 (0.0%) |
| 18 to 24 Years | 8 (88.9%) | 0 (0.0%) |
| 25 to 34 Years | 3 (100.0%) | 6 (85.7%) |
| 35 to 44 Years | 2 (11.8%) | 2 (33.3%) |
| 45 to 54 Years | 0 (0.0%) | 0 (0.0%) |
| 55 to 64 Years | 0 (0.0%) | 0 (0.0%) |
| 65 to 74 Years | 0 (0.0%) | 0 (0.0%) |
| 75 Years and over | 0 (0.0%) | 0 (0.0%) |
| Total | 20 (27.4%) | 19 (23.7%) |
Income Above Poverty by Sex and Age in Kingsbury
According to the poverty statistics in Kingsbury, males aged 5 years and females aged 16 and 17 years are the age groups that are most secure financially, with 100.0% of males and 100.0% of females in these age groups living above the poverty line.
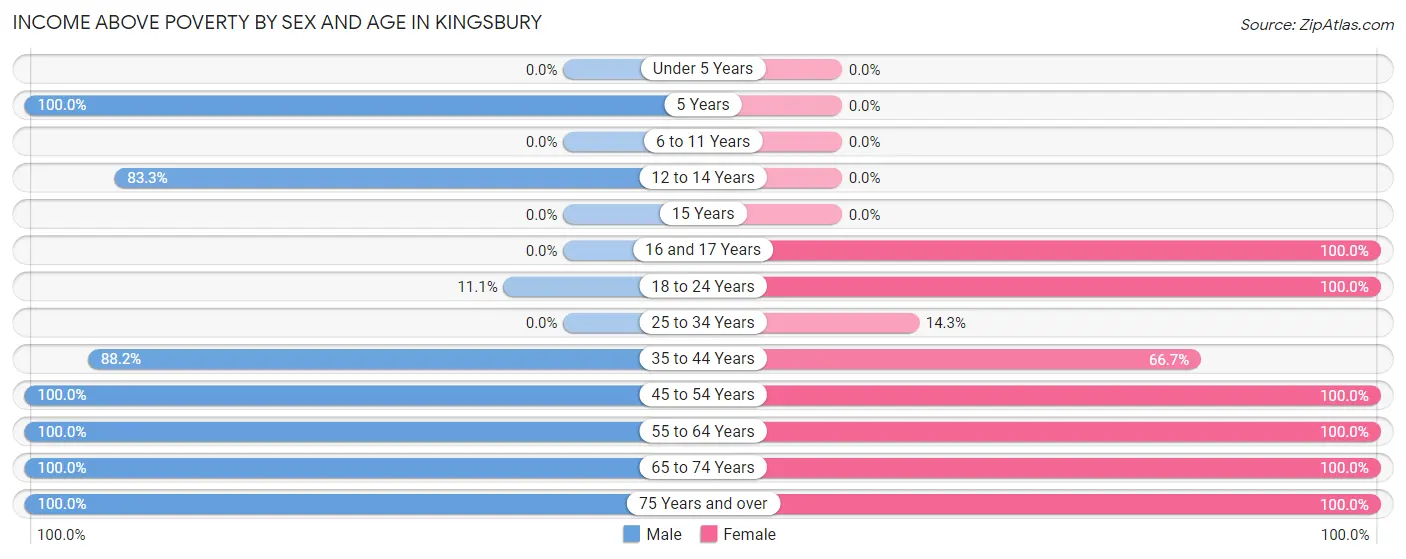
| Age Bracket | Male | Female |
| Under 5 Years | 0 (0.0%) | 0 (0.0%) |
| 5 Years | 1 (100.0%) | 0 (0.0%) |
| 6 to 11 Years | 0 (0.0%) | 0 (0.0%) |
| 12 to 14 Years | 5 (83.3%) | 0 (0.0%) |
| 15 Years | 0 (0.0%) | 0 (0.0%) |
| 16 and 17 Years | 0 (0.0%) | 6 (100.0%) |
| 18 to 24 Years | 1 (11.1%) | 5 (100.0%) |
| 25 to 34 Years | 0 (0.0%) | 1 (14.3%) |
| 35 to 44 Years | 15 (88.2%) | 4 (66.7%) |
| 45 to 54 Years | 9 (100.0%) | 19 (100.0%) |
| 55 to 64 Years | 13 (100.0%) | 17 (100.0%) |
| 65 to 74 Years | 6 (100.0%) | 7 (100.0%) |
| 75 Years and over | 3 (100.0%) | 2 (100.0%) |
| Total | 53 (72.6%) | 61 (76.2%) |
Income Below Poverty Among Married-Couple Families in Kingsbury
The poverty statistics for married-couple families in Kingsbury show that 5.1% or 2 of the total 39 families live below the poverty line. Families with 5 or more children have the highest poverty rate of 100.0%, comprising of 2 families. On the other hand, families with no children have the lowest poverty rate of 0.0%, which includes 0 families.
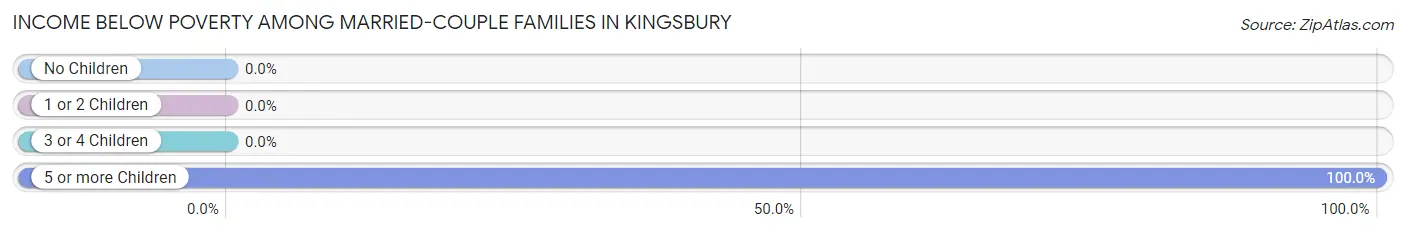
| Children | Above Poverty | Below Poverty |
| No Children | 36 (100.0%) | 0 (0.0%) |
| 1 or 2 Children | 1 (100.0%) | 0 (0.0%) |
| 3 or 4 Children | 0 (0.0%) | 0 (0.0%) |
| 5 or more Children | 0 (0.0%) | 2 (100.0%) |
| Total | 37 (94.9%) | 2 (5.1%) |
Income Below Poverty Among Single-Parent Households in Kingsbury
| Children | Single Father | Single Mother |
| No Children | 0 (0.0%) | 0 (0.0%) |
| 1 or 2 Children | 0 (0.0%) | 0 (0.0%) |
| 3 or 4 Children | 0 (0.0%) | 0 (0.0%) |
| 5 or more Children | 0 (0.0%) | 0 (0.0%) |
| Total | 0 (0.0%) | 0 (0.0%) |
Income Below Poverty Among Married-Couple vs Single-Parent Households in Kingsbury
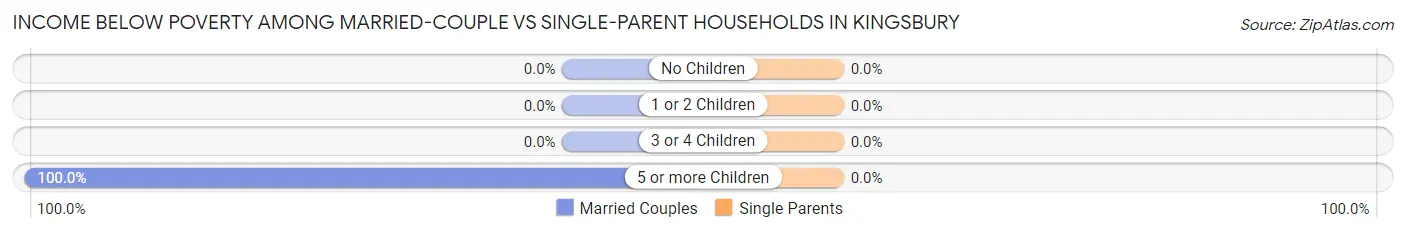
| Children | Married-Couple Families | Single-Parent Households |
| No Children | 0 (0.0%) | 0 (0.0%) |
| 1 or 2 Children | 0 (0.0%) | 0 (0.0%) |
| 3 or 4 Children | 0 (0.0%) | 0 (0.0%) |
| 5 or more Children | 2 (100.0%) | 0 (0.0%) |
| Total | 2 (5.1%) | 0 (0.0%) |
Race in Kingsbury
The most populous races in Kingsbury are White / Caucasian (123 | 78.3%), Hispanic or Latino (42 | 26.8%), and Two or more Races (31 | 19.8%).
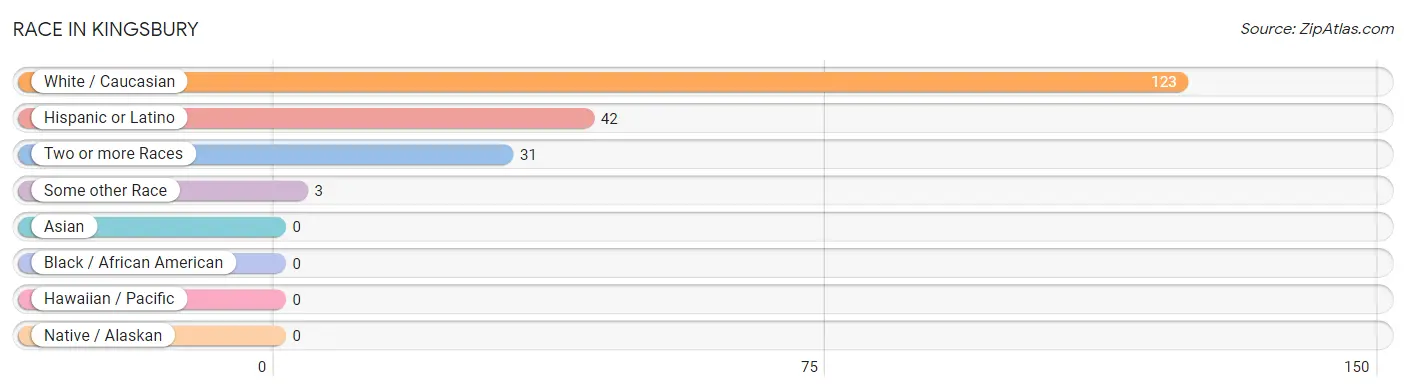
| Race | # Population | % Population |
| Asian | 0 | 0.0% |
| Black / African American | 0 | 0.0% |
| Hawaiian / Pacific | 0 | 0.0% |
| Hispanic or Latino | 42 | 26.8% |
| Native / Alaskan | 0 | 0.0% |
| White / Caucasian | 123 | 78.3% |
| Two or more Races | 31 | 19.8% |
| Some other Race | 3 | 1.9% |
| Total | 157 | 100.0% |
Ancestry in Kingsbury
The most populous ancestries reported in Kingsbury are German (46 | 29.3%), English (40 | 25.5%), Mexican (37 | 23.6%), Irish (23 | 14.6%), and Scottish (3 | 1.9%), together accounting for 94.9% of all Kingsbury residents.
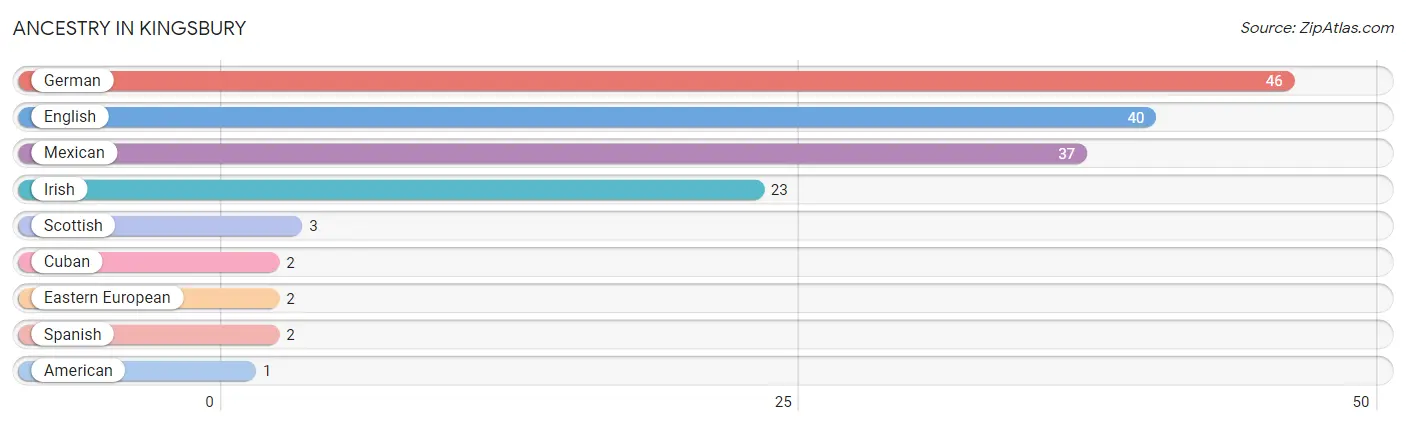
| Ancestry | # Population | % Population |
| American | 1 | 0.6% |
| Cuban | 2 | 1.3% |
| Eastern European | 2 | 1.3% |
| English | 40 | 25.5% |
| German | 46 | 29.3% |
| Irish | 23 | 14.6% |
| Mexican | 37 | 23.6% |
| Scottish | 3 | 1.9% |
| Spanish | 2 | 1.3% | View All 9 Rows |
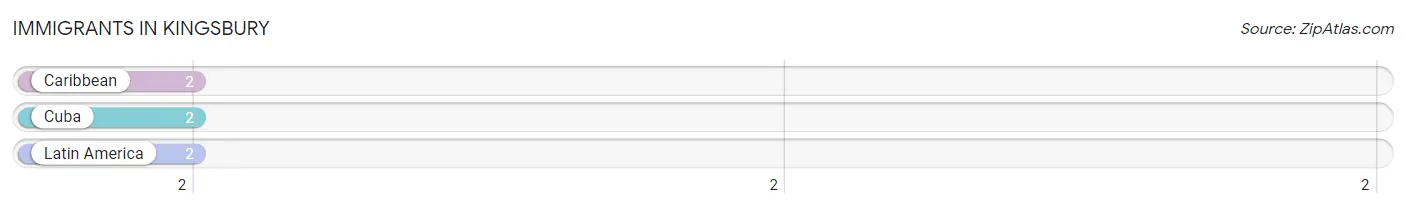
Immigrants in Kingsbury
The most numerous immigrant groups reported in Kingsbury came from Caribbean (2 | 1.3%), Cuba (2 | 1.3%), and Latin America (2 | 1.3%), together accounting for 3.8% of all Kingsbury residents.
| Immigration Origin | # Population | % Population |
| Caribbean | 2 | 1.3% |
| Cuba | 2 | 1.3% |
| Latin America | 2 | 1.3% | View All 3 Rows |
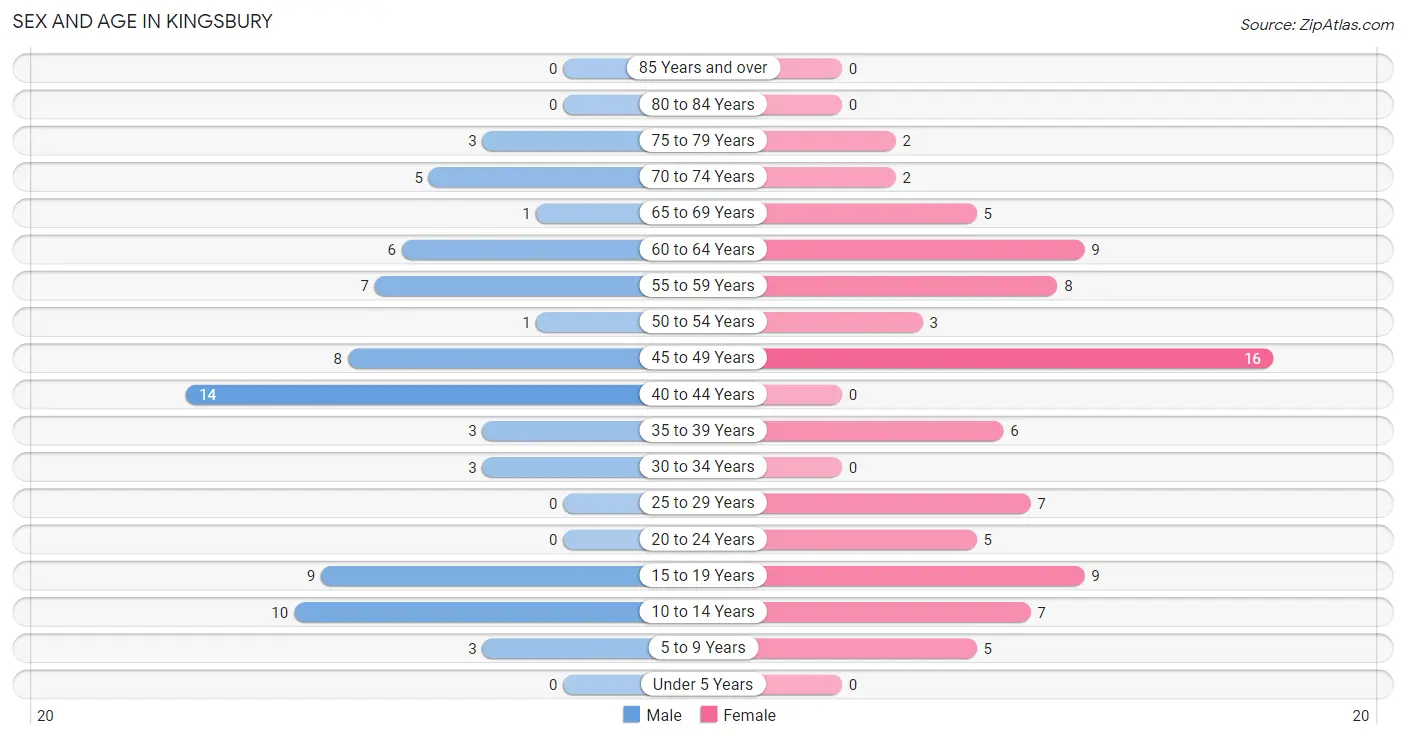
Sex and Age in Kingsbury
Sex and Age in Kingsbury
The most populous age groups in Kingsbury are 40 to 44 Years (14 | 19.2%) for men and 45 to 49 Years (16 | 19.1%) for women.
| Age Bracket | Male | Female |
| Under 5 Years | 0 (0.0%) | 0 (0.0%) |
| 5 to 9 Years | 3 (4.1%) | 5 (5.9%) |
| 10 to 14 Years | 10 (13.7%) | 7 (8.3%) |
| 15 to 19 Years | 9 (12.3%) | 9 (10.7%) |
| 20 to 24 Years | 0 (0.0%) | 5 (5.9%) |
| 25 to 29 Years | 0 (0.0%) | 7 (8.3%) |
| 30 to 34 Years | 3 (4.1%) | 0 (0.0%) |
| 35 to 39 Years | 3 (4.1%) | 6 (7.1%) |
| 40 to 44 Years | 14 (19.2%) | 0 (0.0%) |
| 45 to 49 Years | 8 (11.0%) | 16 (19.1%) |
| 50 to 54 Years | 1 (1.4%) | 3 (3.6%) |
| 55 to 59 Years | 7 (9.6%) | 8 (9.5%) |
| 60 to 64 Years | 6 (8.2%) | 9 (10.7%) |
| 65 to 69 Years | 1 (1.4%) | 5 (5.9%) |
| 70 to 74 Years | 5 (6.9%) | 2 (2.4%) |
| 75 to 79 Years | 3 (4.1%) | 2 (2.4%) |
| 80 to 84 Years | 0 (0.0%) | 0 (0.0%) |
| 85 Years and over | 0 (0.0%) | 0 (0.0%) |
| Total | 73 (100.0%) | 84 (100.0%) |
Families and Households in Kingsbury
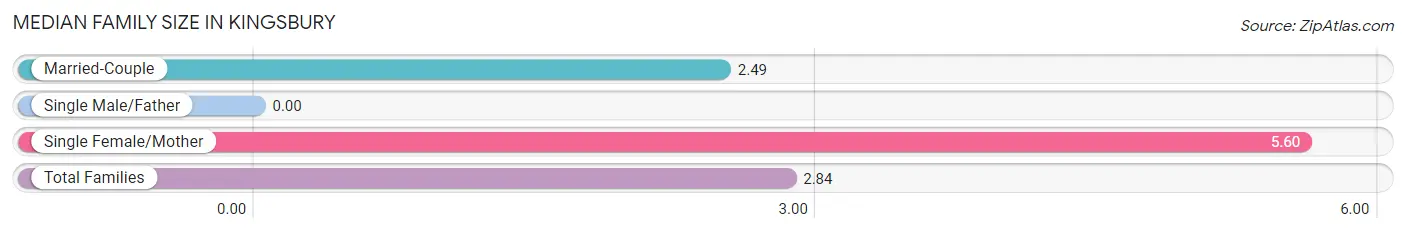
Median Family Size in Kingsbury
| Family Type | # Families | Family Size |
| Married-Couple | 39 (88.6%) | 2.49 |
| Single Male/Father | 0 (0.0%) | - |
| Single Female/Mother | 5 (11.4%) | 5.60 |
| Total Families | 44 (100.0%) | 2.84 |
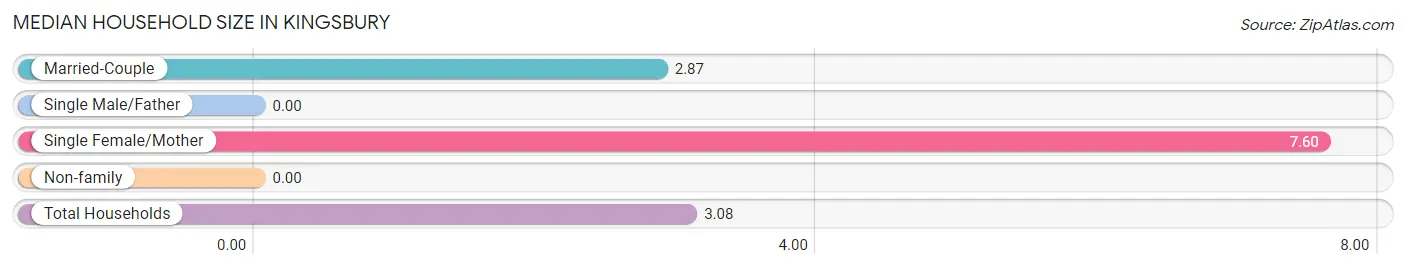
Median Household Size in Kingsbury
| Household Type | # Households | Household Size |
| Married-Couple | 39 (76.5%) | 2.87 |
| Single Male/Father | 0 (0.0%) | - |
| Single Female/Mother | 5 (9.8%) | 7.60 |
| Non-family | 7 (13.7%) | - |
| Total Households | 51 (100.0%) | 3.08 |
Household Size by Marriage Status in Kingsbury
Out of a total of 51 households in Kingsbury, 44 (86.3%) are family households, while 7 (13.7%) are nonfamily households. The most numerous type of family households are 2-person households, comprising 30, and the most common type of nonfamily households are 1-person households, comprising 7.
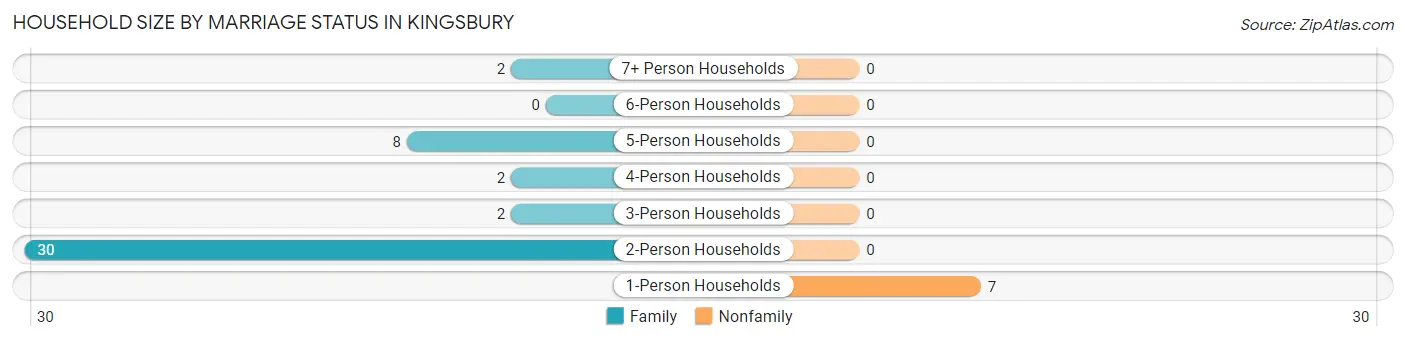
| Household Size | Family Households | Nonfamily Households |
| 1-Person Households | - | 7 (13.7%) |
| 2-Person Households | 30 (58.8%) | 0 (0.0%) |
| 3-Person Households | 2 (3.9%) | 0 (0.0%) |
| 4-Person Households | 2 (3.9%) | 0 (0.0%) |
| 5-Person Households | 8 (15.7%) | 0 (0.0%) |
| 6-Person Households | 0 (0.0%) | 0 (0.0%) |
| 7+ Person Households | 2 (3.9%) | 0 (0.0%) |
| Total | 44 (86.3%) | 7 (13.7%) |
Female Fertility in Kingsbury
Fertility by Age in Kingsbury
| Age Bracket | Women with Births | Births / 1,000 Women |
| 15 to 19 years | 0 (0.0%) | 0.0 |
| 20 to 34 years | 0 (0.0%) | 0.0 |
| 35 to 50 years | 0 (0.0%) | 0.0 |
| Total | 0 (0.0%) | 0.0 |
Fertility by Age by Marriage Status in Kingsbury
| Age Bracket | Married | Unmarried |
| 15 to 19 years | 0 (0.0%) | 0 (0.0%) |
| 20 to 34 years | 0 (0.0%) | 0 (0.0%) |
| 35 to 50 years | 0 (0.0%) | 0 (0.0%) |
| Total | 0 (0.0%) | 0 (0.0%) |
Fertility by Education in Kingsbury
| Educational Attainment | Women with Births | Births / 1,000 Women |
| Less than High School | 0 (0.0%) | 0.0 |
| High School Diploma | 0 (0.0%) | 0.0 |
| College or Associate's Degree | 0 (0.0%) | 0.0 |
| Bachelor's Degree | 0 (0.0%) | 0.0 |
| Graduate Degree | 0 (0.0%) | 0.0 |
| Total | 0 (0.0%) | 0.0 |
Fertility by Education by Marriage Status in Kingsbury
| Educational Attainment | Married | Unmarried |
| Less than High School | 0 (0.0%) | 0 (0.0%) |
| High School Diploma | 0 (0.0%) | 0 (0.0%) |
| College or Associate's Degree | 0 (0.0%) | 0 (0.0%) |
| Bachelor's Degree | 0 (0.0%) | 0 (0.0%) |
| Graduate Degree | 0 (0.0%) | 0 (0.0%) |
| Total | 0 (0.0%) | 0 (0.0%) |
Employment Characteristics in Kingsbury
Employment by Class of Employer in Kingsbury
Among the 67 employed individuals in Kingsbury, private company employees (56 | 83.6%), not-for-profit organizations (6 | 9.0%), and local government employees (4 | 6.0%) make up the most common classes of employment.
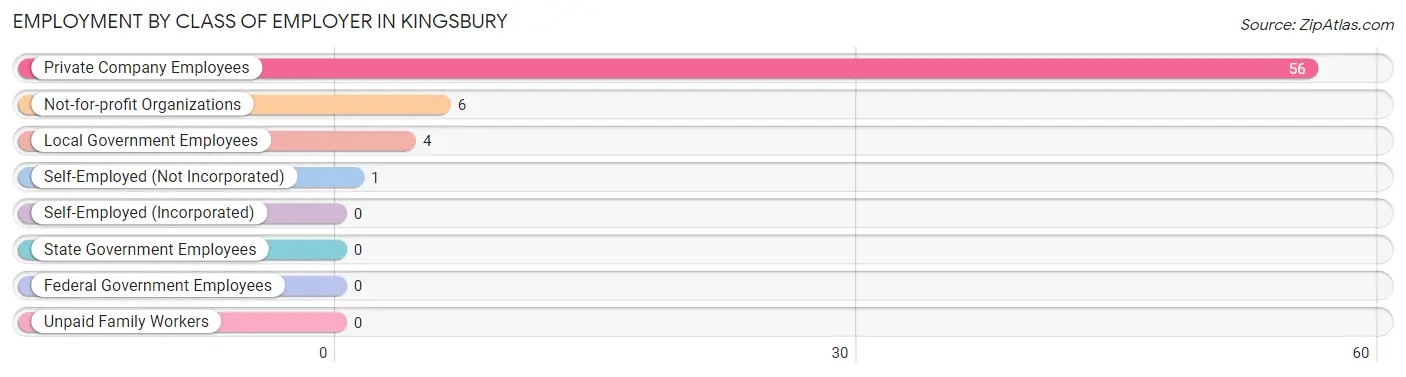
| Employer Class | # Employees | % Employees |
| Private Company Employees | 56 | 83.6% |
| Self-Employed (Incorporated) | 0 | 0.0% |
| Self-Employed (Not Incorporated) | 1 | 1.5% |
| Not-for-profit Organizations | 6 | 9.0% |
| Local Government Employees | 4 | 6.0% |
| State Government Employees | 0 | 0.0% |
| Federal Government Employees | 0 | 0.0% |
| Unpaid Family Workers | 0 | 0.0% |
| Total | 67 | 100.0% |
Employment Status by Age in Kingsbury
According to the labor force statistics for Kingsbury, out of the total population over 16 years of age (129), 55.8% or 72 individuals are in the labor force, with 5.6% or 4 of them unemployed. The age group with the highest labor force participation rate is 20 to 24 years, with 100.0% or 5 individuals in the labor force. Within the labor force, the 30 to 34 years age range has the highest percentage of unemployed individuals, with 66.7% or 2 of them being unemployed.
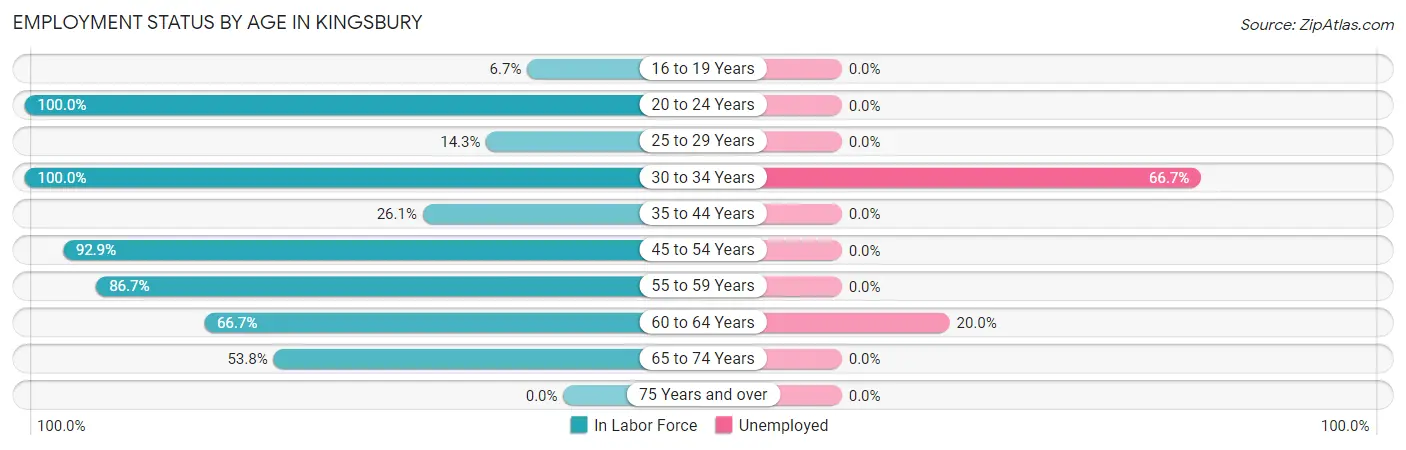
| Age Bracket | In Labor Force | Unemployed |
| 16 to 19 Years | 1 (6.7%) | 0 (0.0%) |
| 20 to 24 Years | 5 (100.0%) | 0 (0.0%) |
| 25 to 29 Years | 1 (14.3%) | 0 (0.0%) |
| 30 to 34 Years | 3 (100.0%) | 2 (66.7%) |
| 35 to 44 Years | 6 (26.1%) | 0 (0.0%) |
| 45 to 54 Years | 26 (92.9%) | 0 (0.0%) |
| 55 to 59 Years | 13 (86.7%) | 0 (0.0%) |
| 60 to 64 Years | 10 (66.7%) | 2 (20.0%) |
| 65 to 74 Years | 7 (53.8%) | 0 (0.0%) |
| 75 Years and over | 0 (0.0%) | 0 (0.0%) |
| Total | 72 (55.8%) | 4 (5.6%) |
Employment Status by Educational Attainment in Kingsbury
According to labor force statistics for Kingsbury, 64.8% of individuals (59) out of the total population between 25 and 64 years of age (91) are in the labor force, with 6.8% or 4 of them being unemployed. The group with the highest labor force participation rate are those with the educational attainment of high school diploma, with 91.7% or 22 individuals in the labor force. Within the labor force, individuals with less than high school education have the highest percentage of unemployment, with 66.7% or 2 of them being unemployed.
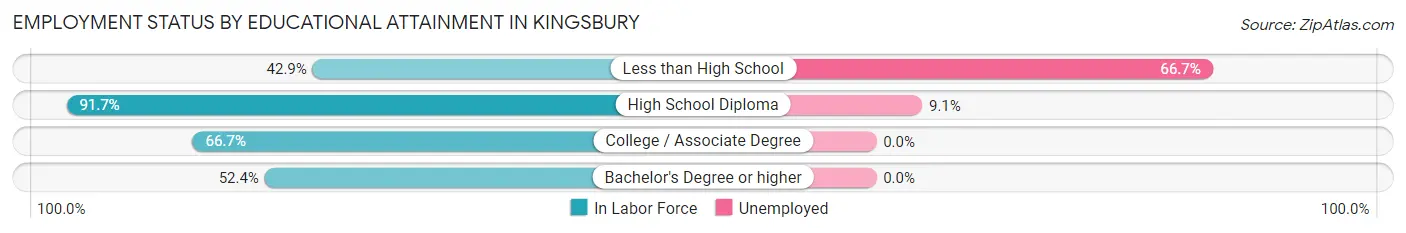
| Educational Attainment | In Labor Force | Unemployed |
| Less than High School | 3 (42.9%) | 5 (66.7%) |
| High School Diploma | 22 (91.7%) | 2 (9.1%) |
| College / Associate Degree | 12 (66.7%) | 0 (0.0%) |
| Bachelor's Degree or higher | 22 (52.4%) | 0 (0.0%) |
| Total | 59 (64.8%) | 6 (6.8%) |
Employment Occupations by Sex in Kingsbury
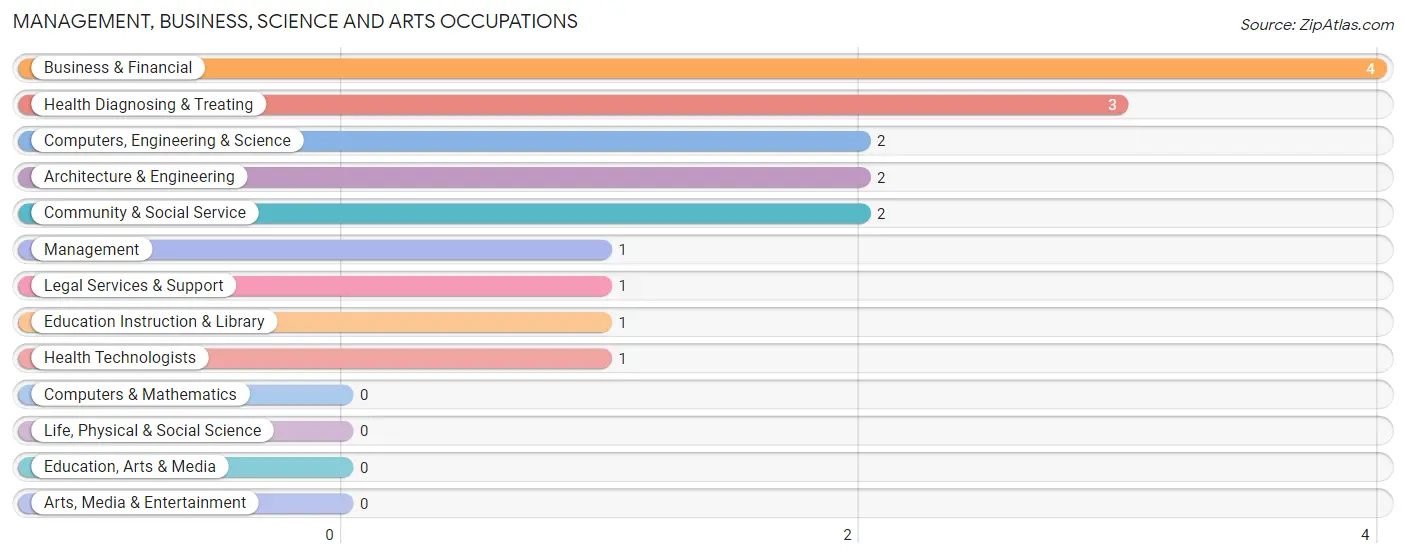
Management, Business, Science and Arts Occupations
The most common Management, Business, Science and Arts occupations in Kingsbury are Business & Financial (4 | 5.9%), Health Diagnosing & Treating (3 | 4.4%), Computers, Engineering & Science (2 | 2.9%), Architecture & Engineering (2 | 2.9%), and Community & Social Service (2 | 2.9%).
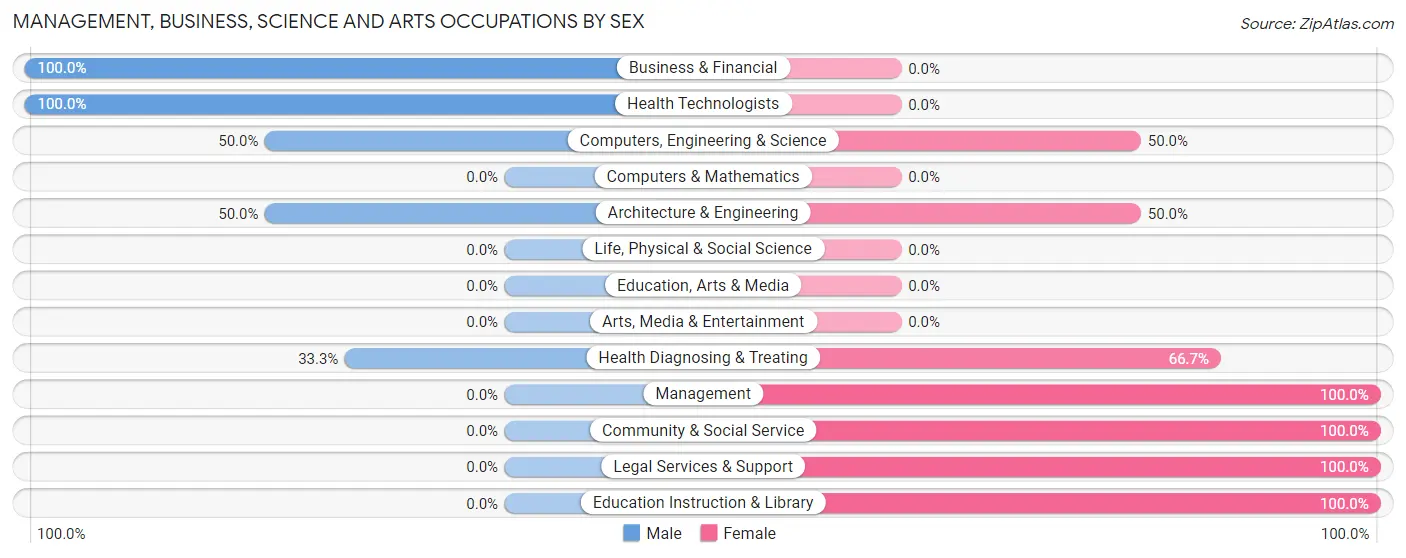
Management, Business, Science and Arts Occupations by Sex
Within the Management, Business, Science and Arts occupations in Kingsbury, the most male-oriented occupations are Business & Financial (100.0%), Health Technologists (100.0%), and Computers, Engineering & Science (50.0%), while the most female-oriented occupations are Management (100.0%), Community & Social Service (100.0%), and Legal Services & Support (100.0%).
| Occupation | Male | Female |
| Management | 0 (0.0%) | 1 (100.0%) |
| Business & Financial | 4 (100.0%) | 0 (0.0%) |
| Computers, Engineering & Science | 1 (50.0%) | 1 (50.0%) |
| Computers & Mathematics | 0 (0.0%) | 0 (0.0%) |
| Architecture & Engineering | 1 (50.0%) | 1 (50.0%) |
| Life, Physical & Social Science | 0 (0.0%) | 0 (0.0%) |
| Community & Social Service | 0 (0.0%) | 2 (100.0%) |
| Education, Arts & Media | 0 (0.0%) | 0 (0.0%) |
| Legal Services & Support | 0 (0.0%) | 1 (100.0%) |
| Education Instruction & Library | 0 (0.0%) | 1 (100.0%) |
| Arts, Media & Entertainment | 0 (0.0%) | 0 (0.0%) |
| Health Diagnosing & Treating | 1 (33.3%) | 2 (66.7%) |
| Health Technologists | 1 (100.0%) | 0 (0.0%) |
| Total (Category) | 6 (50.0%) | 6 (50.0%) |
| Total (Overall) | 20 (29.4%) | 48 (70.6%) |
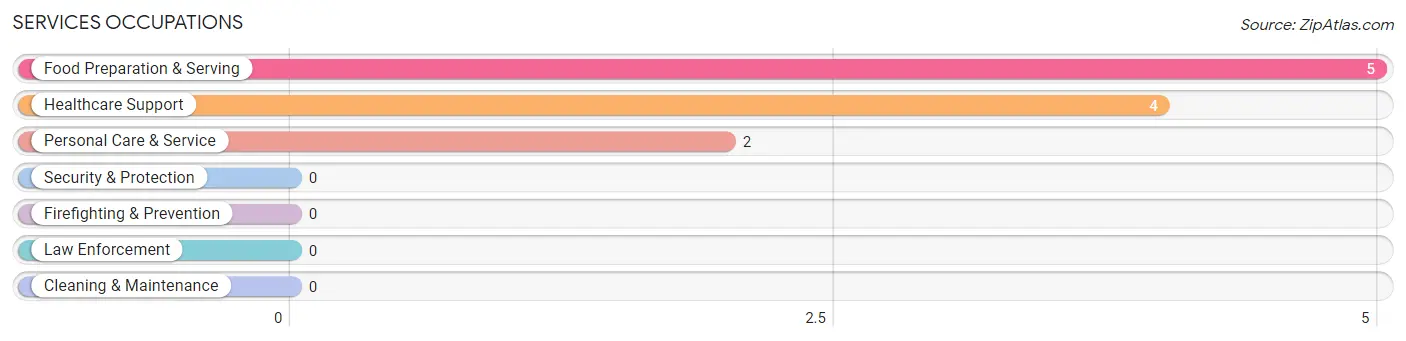
Services Occupations
The most common Services occupations in Kingsbury are Food Preparation & Serving (5 | 7.3%), Healthcare Support (4 | 5.9%), and Personal Care & Service (2 | 2.9%).
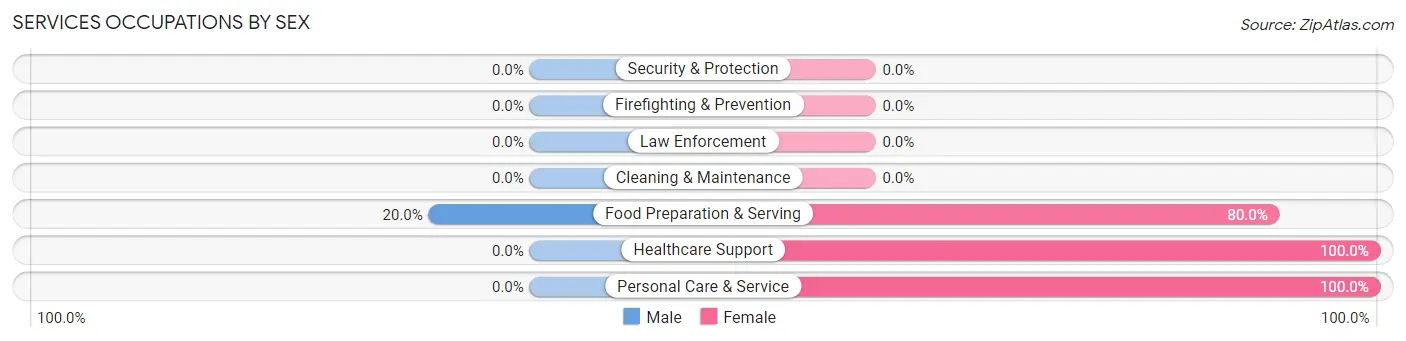
Services Occupations by Sex
| Occupation | Male | Female |
| Healthcare Support | 0 (0.0%) | 4 (100.0%) |
| Security & Protection | 0 (0.0%) | 0 (0.0%) |
| Firefighting & Prevention | 0 (0.0%) | 0 (0.0%) |
| Law Enforcement | 0 (0.0%) | 0 (0.0%) |
| Food Preparation & Serving | 1 (20.0%) | 4 (80.0%) |
| Cleaning & Maintenance | 0 (0.0%) | 0 (0.0%) |
| Personal Care & Service | 0 (0.0%) | 2 (100.0%) |
| Total (Category) | 1 (9.1%) | 10 (90.9%) |
| Total (Overall) | 20 (29.4%) | 48 (70.6%) |
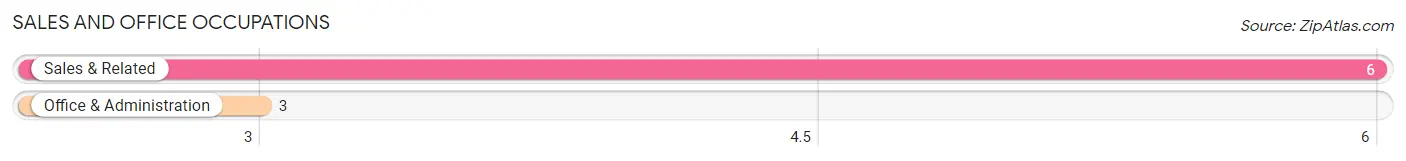
Sales and Office Occupations
The most common Sales and Office occupations in Kingsbury are Sales & Related (6 | 8.8%), and Office & Administration (3 | 4.4%).
Sales and Office Occupations by Sex
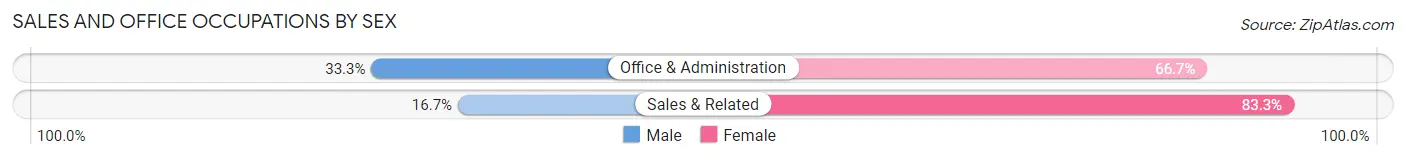
| Occupation | Male | Female |
| Sales & Related | 1 (16.7%) | 5 (83.3%) |
| Office & Administration | 1 (33.3%) | 2 (66.7%) |
| Total (Category) | 2 (22.2%) | 7 (77.8%) |
| Total (Overall) | 20 (29.4%) | 48 (70.6%) |
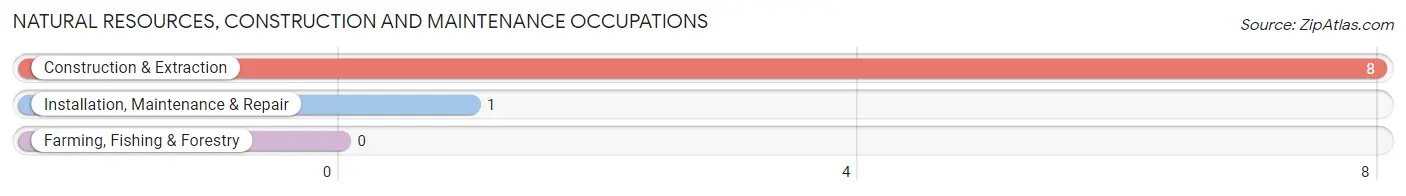
Natural Resources, Construction and Maintenance Occupations
The most common Natural Resources, Construction and Maintenance occupations in Kingsbury are Construction & Extraction (8 | 11.8%), and Installation, Maintenance & Repair (1 | 1.5%).
Natural Resources, Construction and Maintenance Occupations by Sex
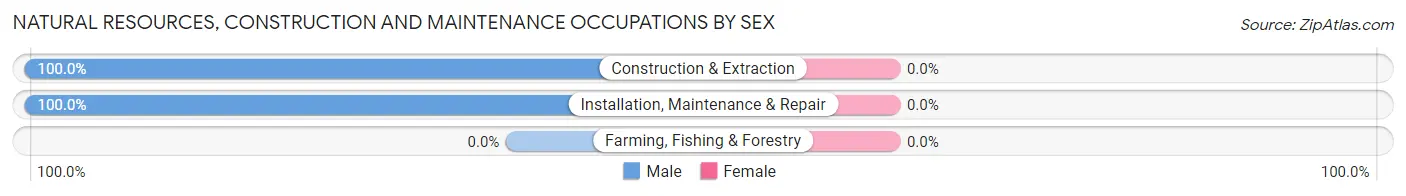
| Occupation | Male | Female |
| Farming, Fishing & Forestry | 0 (0.0%) | 0 (0.0%) |
| Construction & Extraction | 8 (100.0%) | 0 (0.0%) |
| Installation, Maintenance & Repair | 1 (100.0%) | 0 (0.0%) |
| Total (Category) | 9 (100.0%) | 0 (0.0%) |
| Total (Overall) | 20 (29.4%) | 48 (70.6%) |
Production, Transportation and Moving Occupations
The most common Production, Transportation and Moving occupations in Kingsbury are Material Moving (21 | 30.9%), and Production (6 | 8.8%).
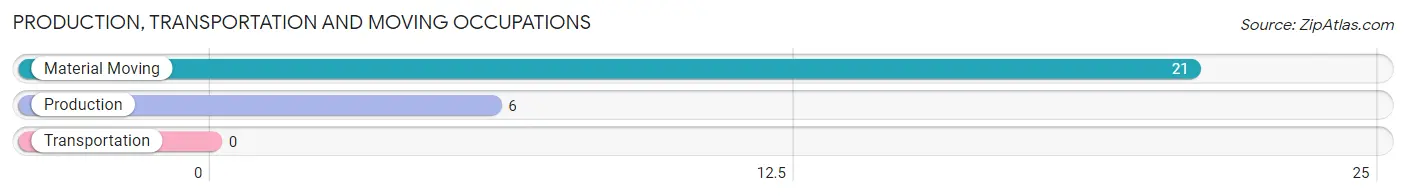
Production, Transportation and Moving Occupations by Sex
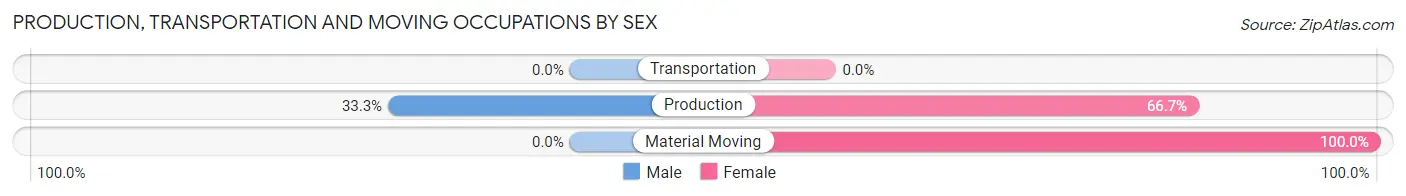
| Occupation | Male | Female |
| Production | 2 (33.3%) | 4 (66.7%) |
| Transportation | 0 (0.0%) | 0 (0.0%) |
| Material Moving | 0 (0.0%) | 21 (100.0%) |
| Total (Category) | 2 (7.4%) | 25 (92.6%) |
| Total (Overall) | 20 (29.4%) | 48 (70.6%) |
Employment Industries by Sex in Kingsbury
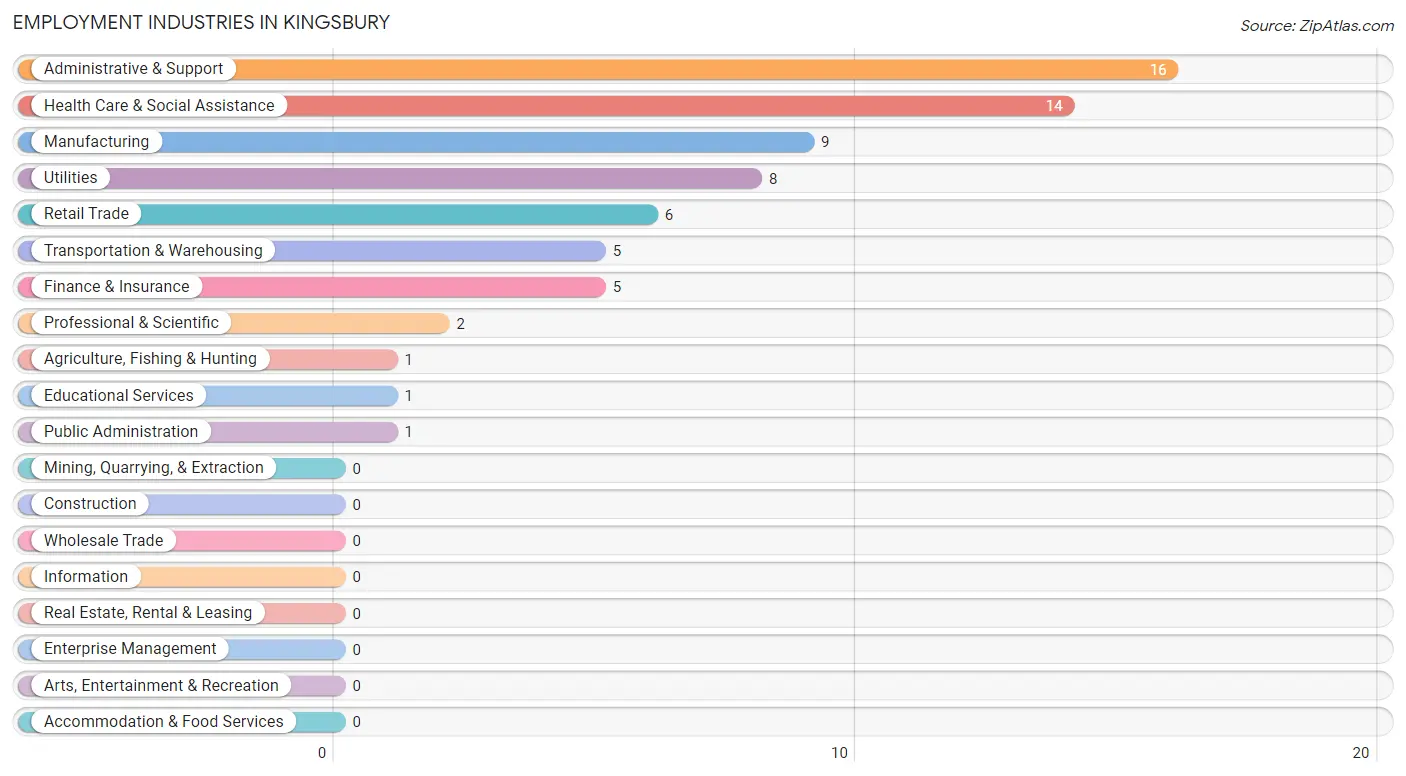
Employment Industries in Kingsbury
The major employment industries in Kingsbury include Administrative & Support (16 | 23.5%), Health Care & Social Assistance (14 | 20.6%), Manufacturing (9 | 13.2%), Utilities (8 | 11.8%), and Retail Trade (6 | 8.8%).
Employment Industries by Sex in Kingsbury
The Kingsbury industries that see more men than women are Utilities (100.0%), Finance & Insurance (80.0%), and Professional & Scientific (50.0%), whereas the industries that tend to have a higher number of women are Agriculture, Fishing & Hunting (100.0%), Transportation & Warehousing (100.0%), and Administrative & Support (100.0%).
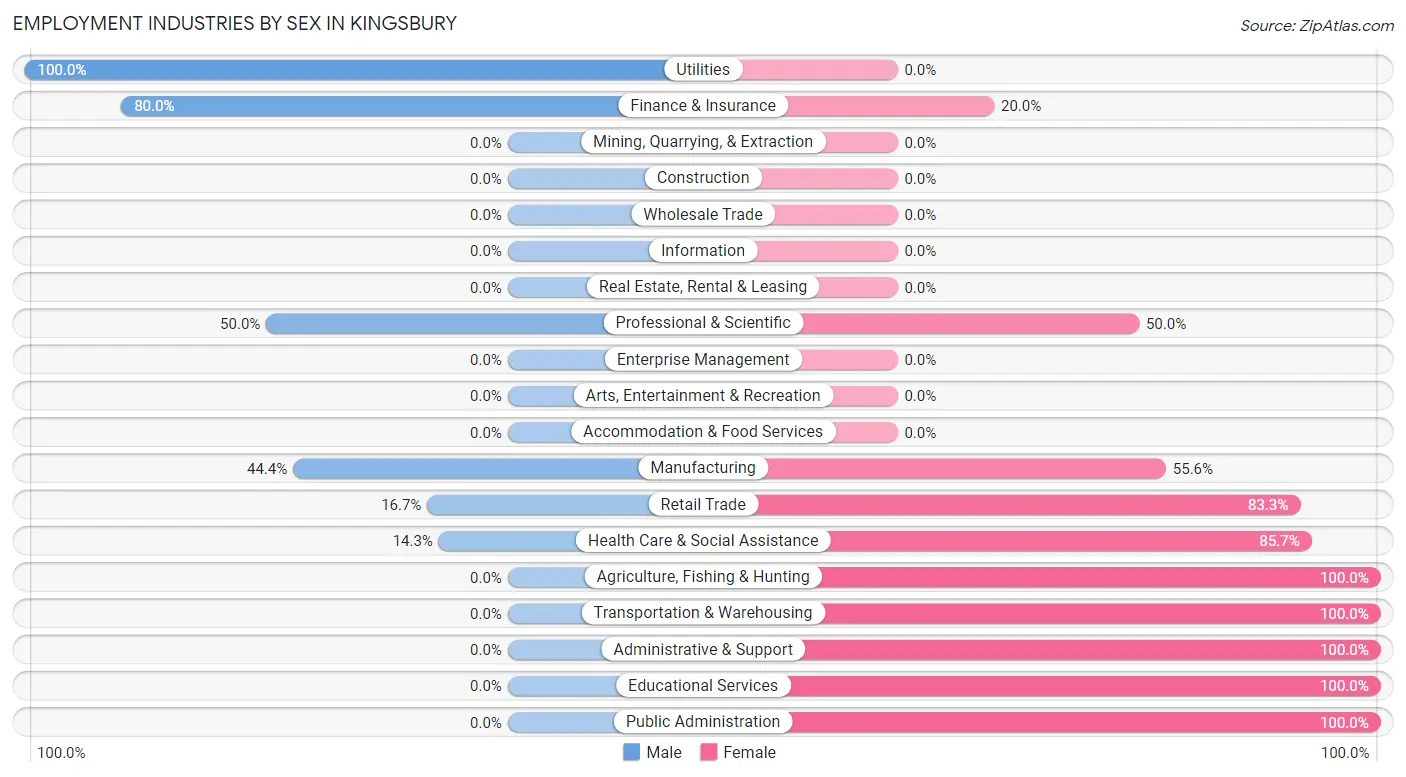
| Industry | Male | Female |
| Agriculture, Fishing & Hunting | 0 (0.0%) | 1 (100.0%) |
| Mining, Quarrying, & Extraction | 0 (0.0%) | 0 (0.0%) |
| Construction | 0 (0.0%) | 0 (0.0%) |
| Manufacturing | 4 (44.4%) | 5 (55.6%) |
| Wholesale Trade | 0 (0.0%) | 0 (0.0%) |
| Retail Trade | 1 (16.7%) | 5 (83.3%) |
| Transportation & Warehousing | 0 (0.0%) | 5 (100.0%) |
| Utilities | 8 (100.0%) | 0 (0.0%) |
| Information | 0 (0.0%) | 0 (0.0%) |
| Finance & Insurance | 4 (80.0%) | 1 (20.0%) |
| Real Estate, Rental & Leasing | 0 (0.0%) | 0 (0.0%) |
| Professional & Scientific | 1 (50.0%) | 1 (50.0%) |
| Enterprise Management | 0 (0.0%) | 0 (0.0%) |
| Administrative & Support | 0 (0.0%) | 16 (100.0%) |
| Educational Services | 0 (0.0%) | 1 (100.0%) |
| Health Care & Social Assistance | 2 (14.3%) | 12 (85.7%) |
| Arts, Entertainment & Recreation | 0 (0.0%) | 0 (0.0%) |
| Accommodation & Food Services | 0 (0.0%) | 0 (0.0%) |
| Public Administration | 0 (0.0%) | 1 (100.0%) |
| Total | 20 (29.4%) | 48 (70.6%) |
Education in Kingsbury
School Enrollment in Kingsbury
The most common levels of schooling among the 35 students in Kingsbury are middle school (18 | 51.4%), high school (8 | 22.9%), and elementary school (7 | 20.0%).
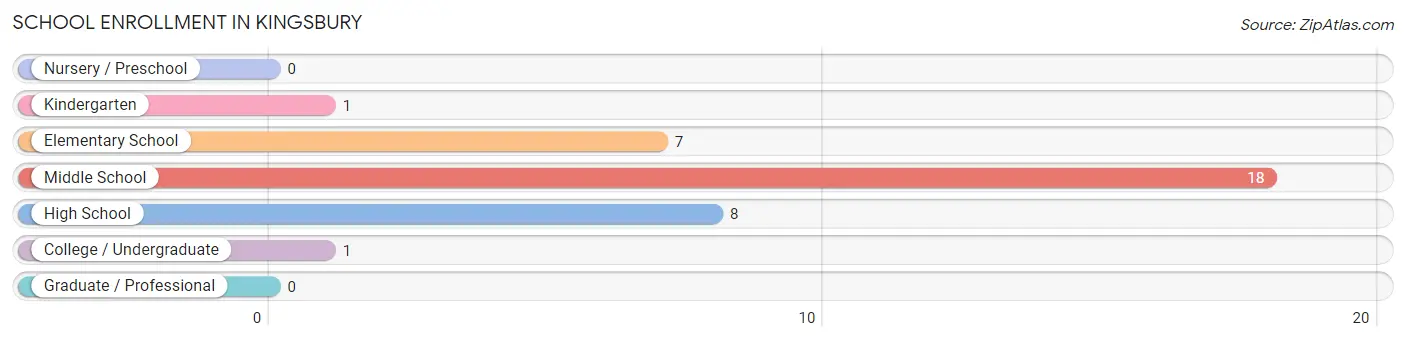
| School Level | # Students | % Students |
| Nursery / Preschool | 0 | 0.0% |
| Kindergarten | 1 | 2.9% |
| Elementary School | 7 | 20.0% |
| Middle School | 18 | 51.4% |
| High School | 8 | 22.9% |
| College / Undergraduate | 1 | 2.9% |
| Graduate / Professional | 0 | 0.0% |
| Total | 35 | 100.0% |
School Enrollment by Age by Funding Source in Kingsbury
Out of a total of 35 students who are enrolled in schools in Kingsbury, 4 (11.4%) attend a private institution, while the remaining 31 (88.6%) are enrolled in public schools. The age group of 5 to 9 year old has the highest likelihood of being enrolled in private schools, with 4 (50.0% in the age bracket) enrolled. Conversely, the age group of 10 to 14 year olds has the lowest likelihood of being enrolled in a private school, with 17 (100.0% in the age bracket) attending a public institution.
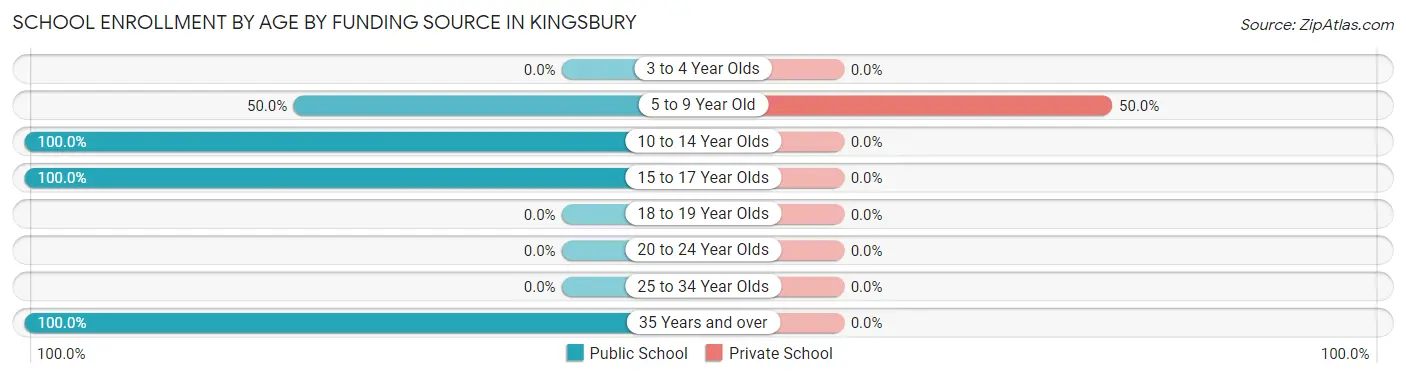
| Age Bracket | Public School | Private School |
| 3 to 4 Year Olds | 0 (0.0%) | 0 (0.0%) |
| 5 to 9 Year Old | 4 (50.0%) | 4 (50.0%) |
| 10 to 14 Year Olds | 17 (100.0%) | 0 (0.0%) |
| 15 to 17 Year Olds | 9 (100.0%) | 0 (0.0%) |
| 18 to 19 Year Olds | 0 (0.0%) | 0 (0.0%) |
| 20 to 24 Year Olds | 0 (0.0%) | 0 (0.0%) |
| 25 to 34 Year Olds | 0 (0.0%) | 0 (0.0%) |
| 35 Years and over | 1 (100.0%) | 0 (0.0%) |
| Total | 31 (88.6%) | 4 (11.4%) |
Educational Attainment by Field of Study in Kingsbury
Liberal arts & history (18 | 40.0%), visual & performing arts (14 | 31.1%), arts & humanities (6 | 13.3%), education (4 | 8.9%), and business (2 | 4.4%) are the most common fields of study among 45 individuals in Kingsbury who have obtained a bachelor's degree or higher.
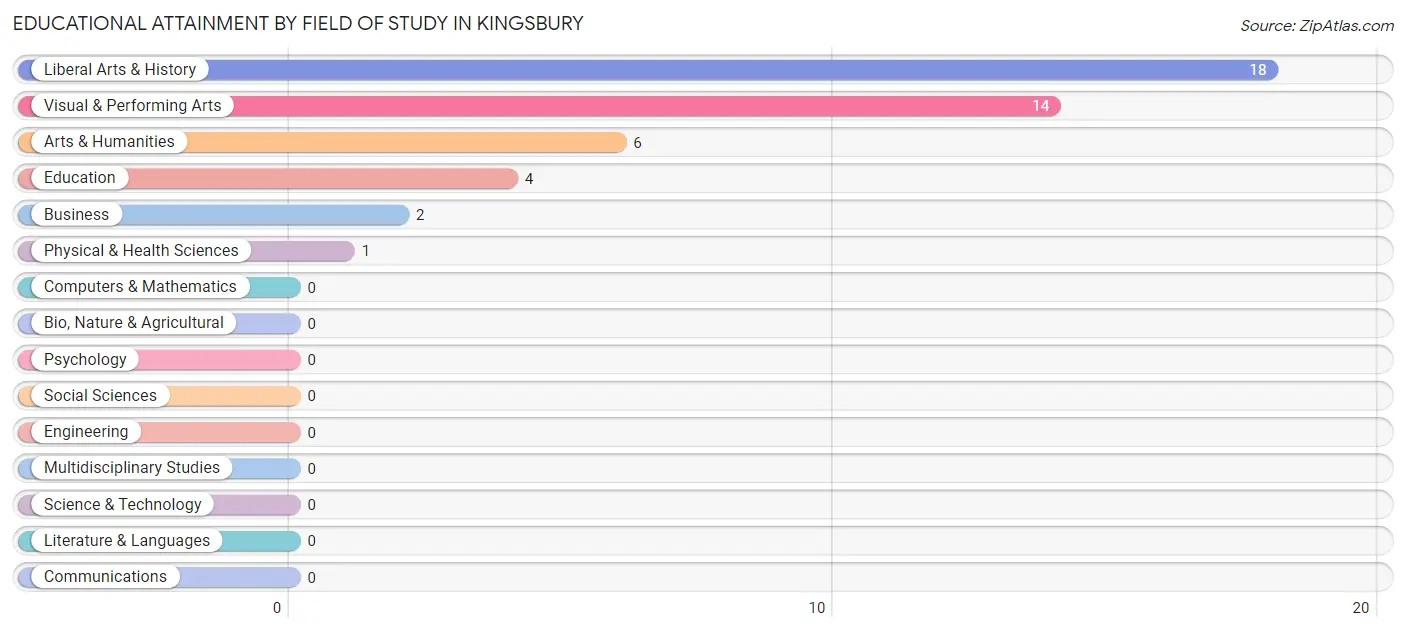
| Field of Study | # Graduates | % Graduates |
| Computers & Mathematics | 0 | 0.0% |
| Bio, Nature & Agricultural | 0 | 0.0% |
| Physical & Health Sciences | 1 | 2.2% |
| Psychology | 0 | 0.0% |
| Social Sciences | 0 | 0.0% |
| Engineering | 0 | 0.0% |
| Multidisciplinary Studies | 0 | 0.0% |
| Science & Technology | 0 | 0.0% |
| Business | 2 | 4.4% |
| Education | 4 | 8.9% |
| Literature & Languages | 0 | 0.0% |
| Liberal Arts & History | 18 | 40.0% |
| Visual & Performing Arts | 14 | 31.1% |
| Communications | 0 | 0.0% |
| Arts & Humanities | 6 | 13.3% |
| Total | 45 | 100.0% |
Transportation & Commute in Kingsbury
Vehicle Availability by Sex in Kingsbury
The most prevalent vehicle ownership categories in Kingsbury are males with 4 vehicles (8, accounting for 42.1%) and females with 4 vehicles (4, making up 16.7%).
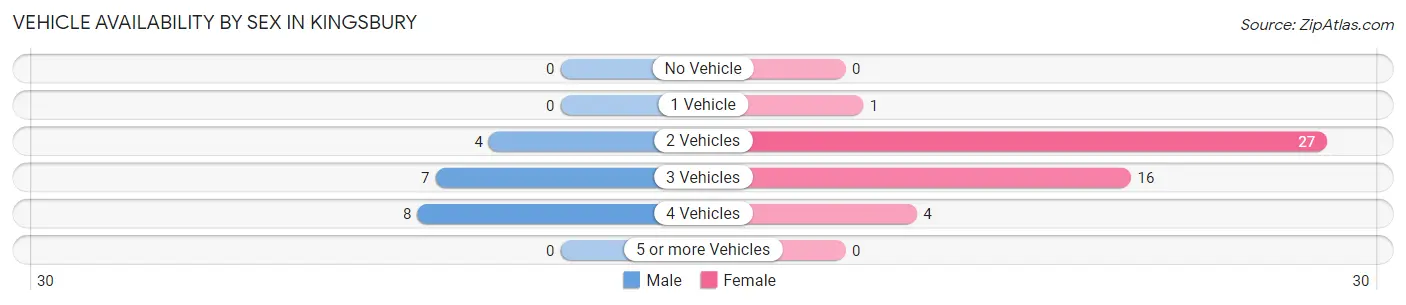
| Vehicles Available | Male | Female |
| No Vehicle | 0 (0.0%) | 0 (0.0%) |
| 1 Vehicle | 0 (0.0%) | 1 (2.1%) |
| 2 Vehicles | 4 (21.0%) | 27 (56.2%) |
| 3 Vehicles | 7 (36.8%) | 16 (33.3%) |
| 4 Vehicles | 8 (42.1%) | 4 (8.3%) |
| 5 or more Vehicles | 0 (0.0%) | 0 (0.0%) |
| Total | 19 (100.0%) | 48 (100.0%) |
Commute Time in Kingsbury
The most frequently occuring commute durations in Kingsbury are 60 to 89 minutes (21 commuters, 31.3%), 15 to 19 minutes (15 commuters, 22.4%), and 20 to 24 minutes (9 commuters, 13.4%).
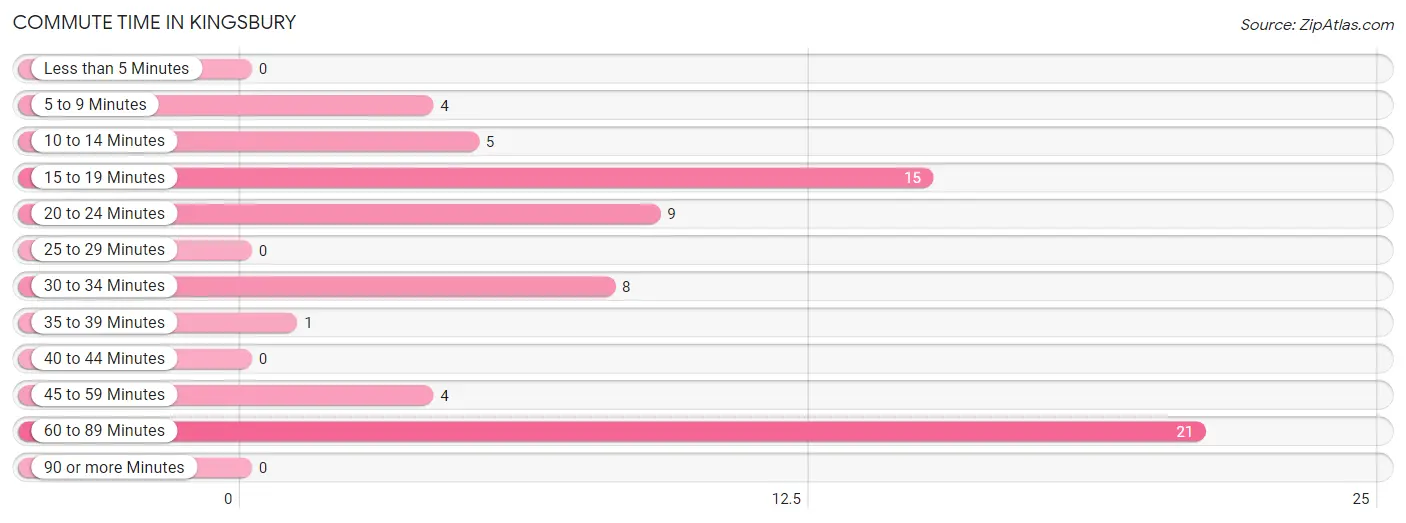
| Commute Time | # Commuters | % Commuters |
| Less than 5 Minutes | 0 | 0.0% |
| 5 to 9 Minutes | 4 | 6.0% |
| 10 to 14 Minutes | 5 | 7.5% |
| 15 to 19 Minutes | 15 | 22.4% |
| 20 to 24 Minutes | 9 | 13.4% |
| 25 to 29 Minutes | 0 | 0.0% |
| 30 to 34 Minutes | 8 | 11.9% |
| 35 to 39 Minutes | 1 | 1.5% |
| 40 to 44 Minutes | 0 | 0.0% |
| 45 to 59 Minutes | 4 | 6.0% |
| 60 to 89 Minutes | 21 | 31.3% |
| 90 or more Minutes | 0 | 0.0% |
Commute Time by Sex in Kingsbury
The most common commute times in Kingsbury are 30 to 34 minutes (8 commuters, 42.1%) for males and 60 to 89 minutes (19 commuters, 39.6%) for females.
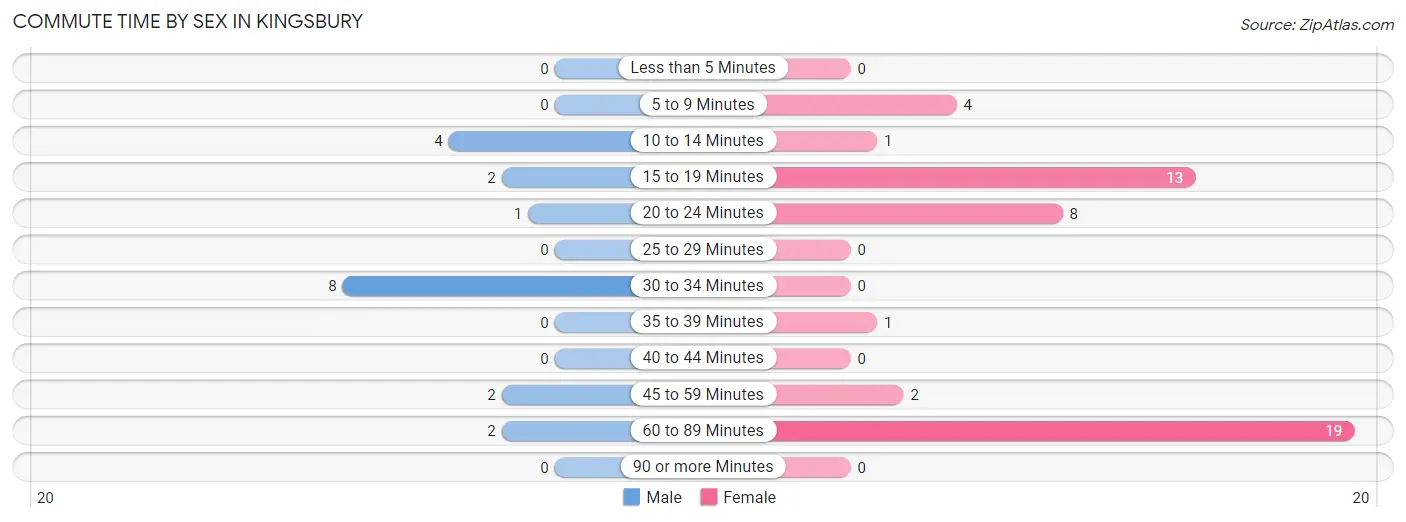
| Commute Time | Male | Female |
| Less than 5 Minutes | 0 (0.0%) | 0 (0.0%) |
| 5 to 9 Minutes | 0 (0.0%) | 4 (8.3%) |
| 10 to 14 Minutes | 4 (21.0%) | 1 (2.1%) |
| 15 to 19 Minutes | 2 (10.5%) | 13 (27.1%) |
| 20 to 24 Minutes | 1 (5.3%) | 8 (16.7%) |
| 25 to 29 Minutes | 0 (0.0%) | 0 (0.0%) |
| 30 to 34 Minutes | 8 (42.1%) | 0 (0.0%) |
| 35 to 39 Minutes | 0 (0.0%) | 1 (2.1%) |
| 40 to 44 Minutes | 0 (0.0%) | 0 (0.0%) |
| 45 to 59 Minutes | 2 (10.5%) | 2 (4.2%) |
| 60 to 89 Minutes | 2 (10.5%) | 19 (39.6%) |
| 90 or more Minutes | 0 (0.0%) | 0 (0.0%) |
Time of Departure to Work by Sex in Kingsbury
The most frequent times of departure to work in Kingsbury are 5:00 AM to 5:29 AM (8, 42.1%) for males and 7:30 AM to 7:59 AM (16, 33.3%) for females.
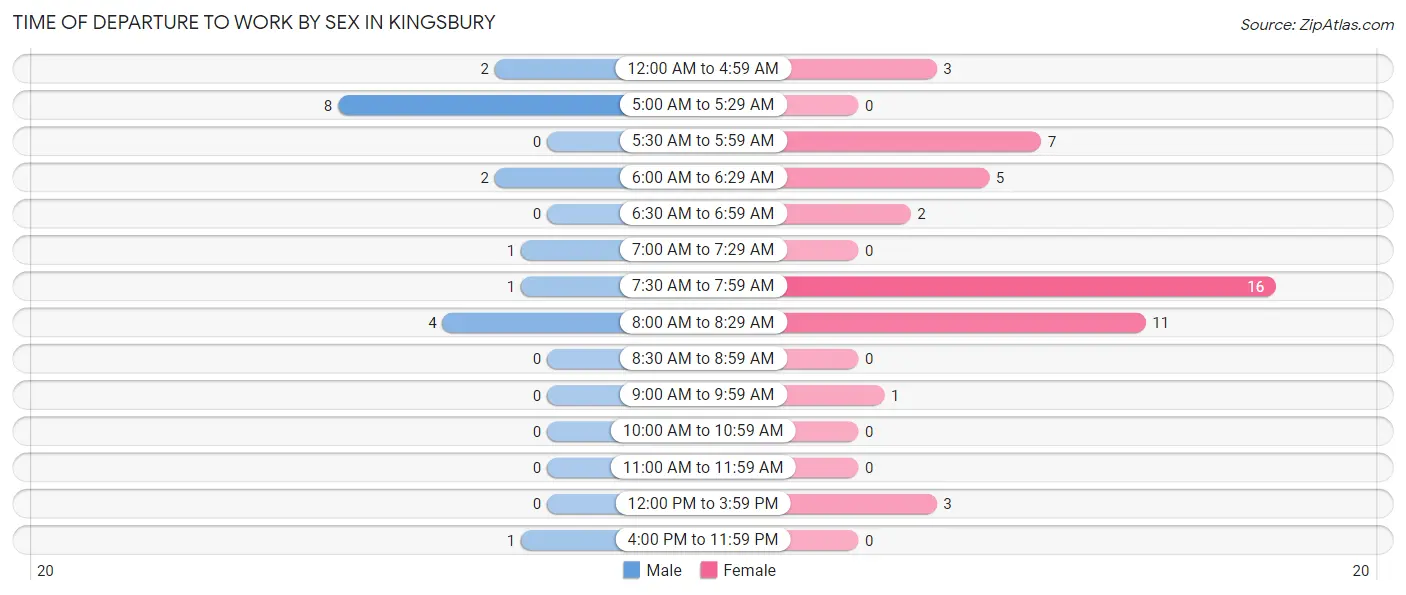
| Time of Departure | Male | Female |
| 12:00 AM to 4:59 AM | 2 (10.5%) | 3 (6.2%) |
| 5:00 AM to 5:29 AM | 8 (42.1%) | 0 (0.0%) |
| 5:30 AM to 5:59 AM | 0 (0.0%) | 7 (14.6%) |
| 6:00 AM to 6:29 AM | 2 (10.5%) | 5 (10.4%) |
| 6:30 AM to 6:59 AM | 0 (0.0%) | 2 (4.2%) |
| 7:00 AM to 7:29 AM | 1 (5.3%) | 0 (0.0%) |
| 7:30 AM to 7:59 AM | 1 (5.3%) | 16 (33.3%) |
| 8:00 AM to 8:29 AM | 4 (21.0%) | 11 (22.9%) |
| 8:30 AM to 8:59 AM | 0 (0.0%) | 0 (0.0%) |
| 9:00 AM to 9:59 AM | 0 (0.0%) | 1 (2.1%) |
| 10:00 AM to 10:59 AM | 0 (0.0%) | 0 (0.0%) |
| 11:00 AM to 11:59 AM | 0 (0.0%) | 0 (0.0%) |
| 12:00 PM to 3:59 PM | 0 (0.0%) | 3 (6.2%) |
| 4:00 PM to 11:59 PM | 1 (5.3%) | 0 (0.0%) |
| Total | 19 (100.0%) | 48 (100.0%) |
Housing Occupancy in Kingsbury
Occupancy by Ownership in Kingsbury
Of the total 51 dwellings in Kingsbury, owner-occupied units account for 46 (90.2%), while renter-occupied units make up 5 (9.8%).
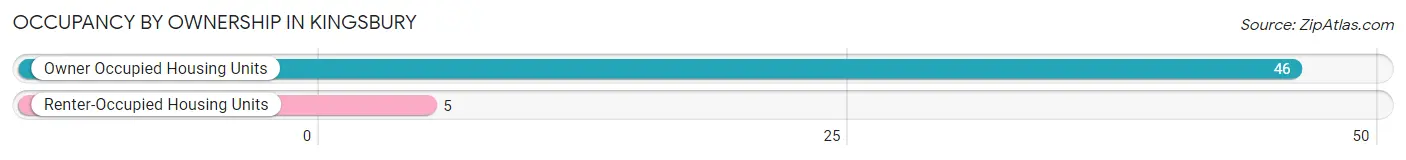
| Occupancy | # Housing Units | % Housing Units |
| Owner Occupied Housing Units | 46 | 90.2% |
| Renter-Occupied Housing Units | 5 | 9.8% |
| Total Occupied Housing Units | 51 | 100.0% |
Occupancy by Household Size in Kingsbury
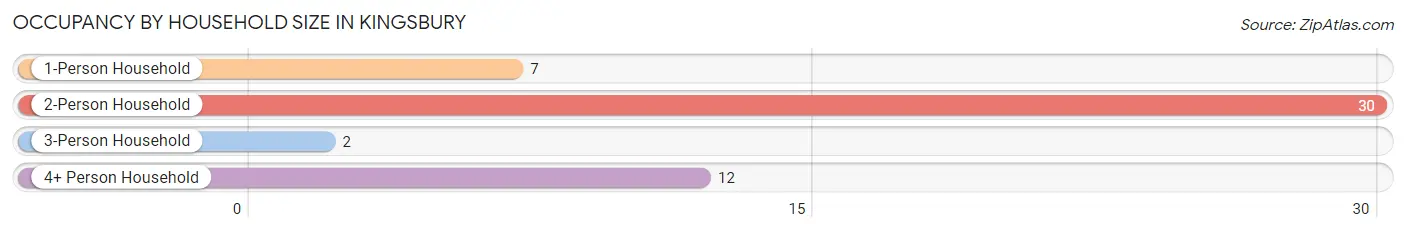
| Household Size | # Housing Units | % Housing Units |
| 1-Person Household | 7 | 13.7% |
| 2-Person Household | 30 | 58.8% |
| 3-Person Household | 2 | 3.9% |
| 4+ Person Household | 12 | 23.5% |
| Total Housing Units | 51 | 100.0% |
Occupancy by Ownership by Household Size in Kingsbury
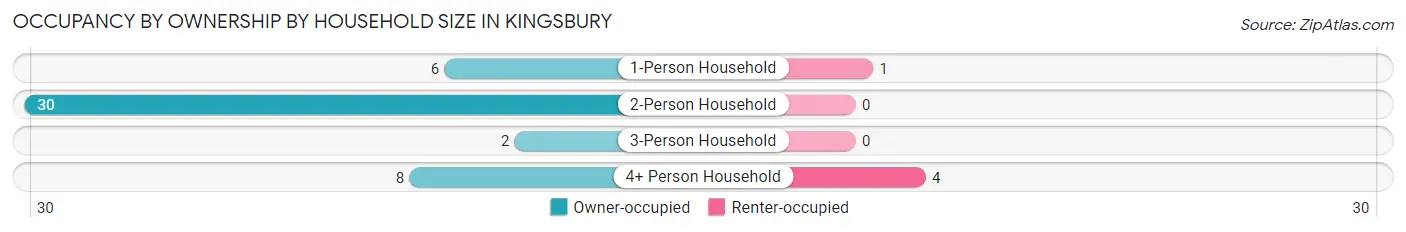
| Household Size | Owner-occupied | Renter-occupied |
| 1-Person Household | 6 (85.7%) | 1 (14.3%) |
| 2-Person Household | 30 (100.0%) | 0 (0.0%) |
| 3-Person Household | 2 (100.0%) | 0 (0.0%) |
| 4+ Person Household | 8 (66.7%) | 4 (33.3%) |
| Total Housing Units | 46 (90.2%) | 5 (9.8%) |
Occupancy by Educational Attainment in Kingsbury
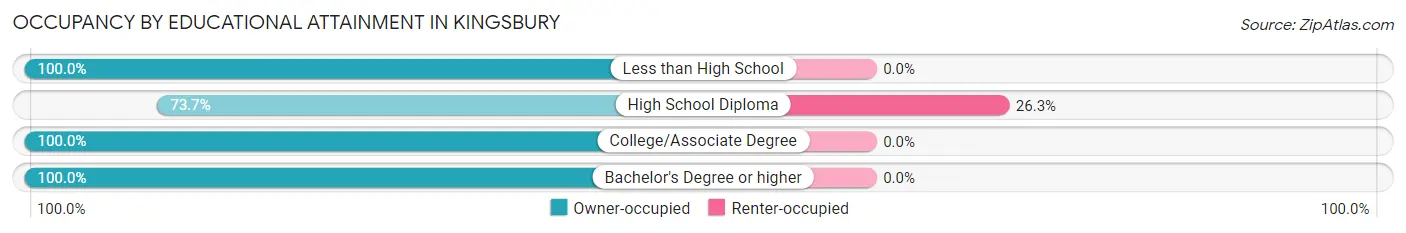
| Household Size | Owner-occupied | Renter-occupied |
| Less than High School | 5 (100.0%) | 0 (0.0%) |
| High School Diploma | 14 (73.7%) | 5 (26.3%) |
| College/Associate Degree | 7 (100.0%) | 0 (0.0%) |
| Bachelor's Degree or higher | 20 (100.0%) | 0 (0.0%) |
Occupancy by Age of Householder in Kingsbury
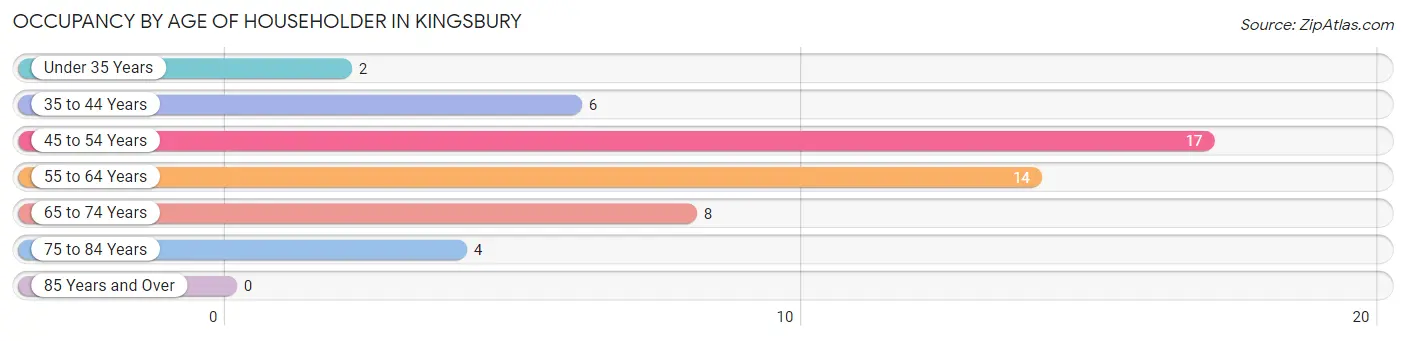
| Age Bracket | # Households | % Households |
| Under 35 Years | 2 | 3.9% |
| 35 to 44 Years | 6 | 11.8% |
| 45 to 54 Years | 17 | 33.3% |
| 55 to 64 Years | 14 | 27.5% |
| 65 to 74 Years | 8 | 15.7% |
| 75 to 84 Years | 4 | 7.8% |
| 85 Years and Over | 0 | 0.0% |
| Total | 51 | 100.0% |
Housing Finances in Kingsbury
Median Income by Occupancy in Kingsbury
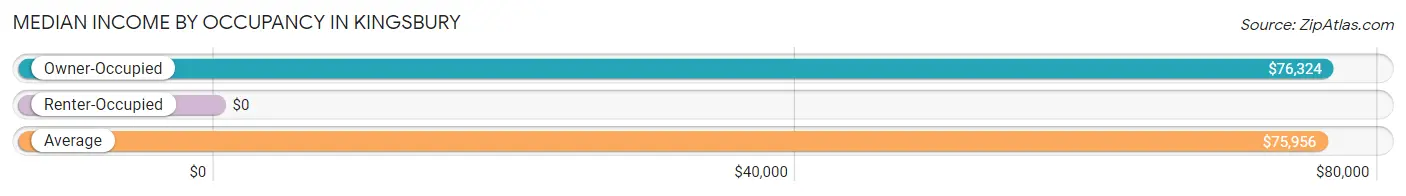
| Occupancy Type | # Households | Median Income |
| Owner-Occupied | 46 (90.2%) | $76,324 |
| Renter-Occupied | 5 (9.8%) | $0 |
| Average | 51 (100.0%) | $75,956 |
Occupancy by Householder Income Bracket in Kingsbury
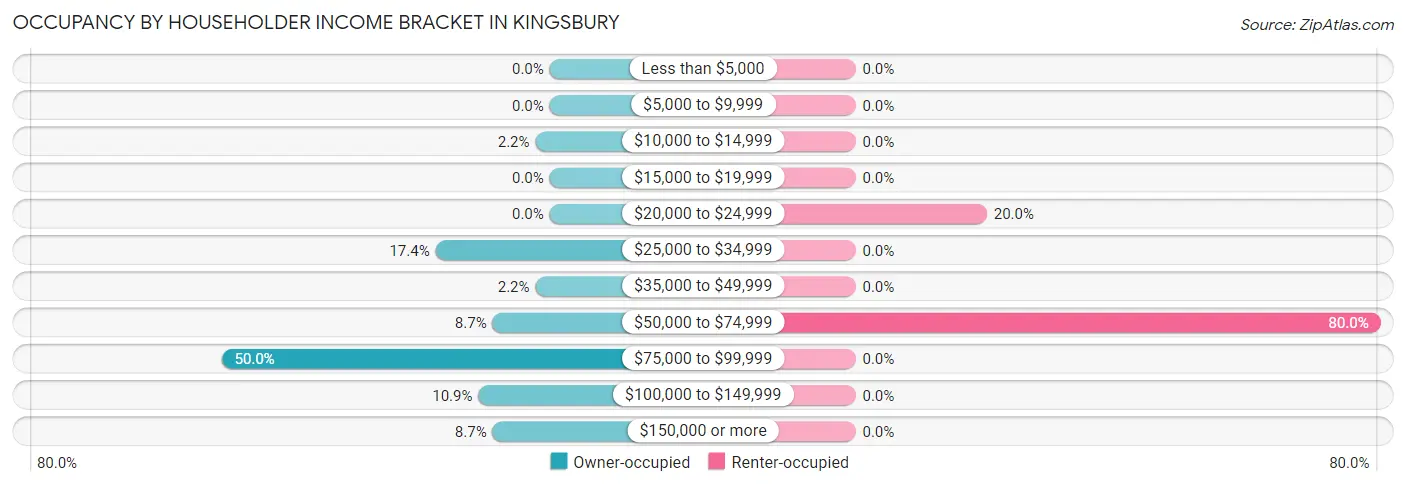
| Income Bracket | Owner-occupied | Renter-occupied |
| Less than $5,000 | 0 (0.0%) | 0 (0.0%) |
| $5,000 to $9,999 | 0 (0.0%) | 0 (0.0%) |
| $10,000 to $14,999 | 1 (2.2%) | 0 (0.0%) |
| $15,000 to $19,999 | 0 (0.0%) | 0 (0.0%) |
| $20,000 to $24,999 | 0 (0.0%) | 1 (20.0%) |
| $25,000 to $34,999 | 8 (17.4%) | 0 (0.0%) |
| $35,000 to $49,999 | 1 (2.2%) | 0 (0.0%) |
| $50,000 to $74,999 | 4 (8.7%) | 4 (80.0%) |
| $75,000 to $99,999 | 23 (50.0%) | 0 (0.0%) |
| $100,000 to $149,999 | 5 (10.9%) | 0 (0.0%) |
| $150,000 or more | 4 (8.7%) | 0 (0.0%) |
| Total | 46 (100.0%) | 5 (100.0%) |
Monthly Housing Cost Tiers in Kingsbury
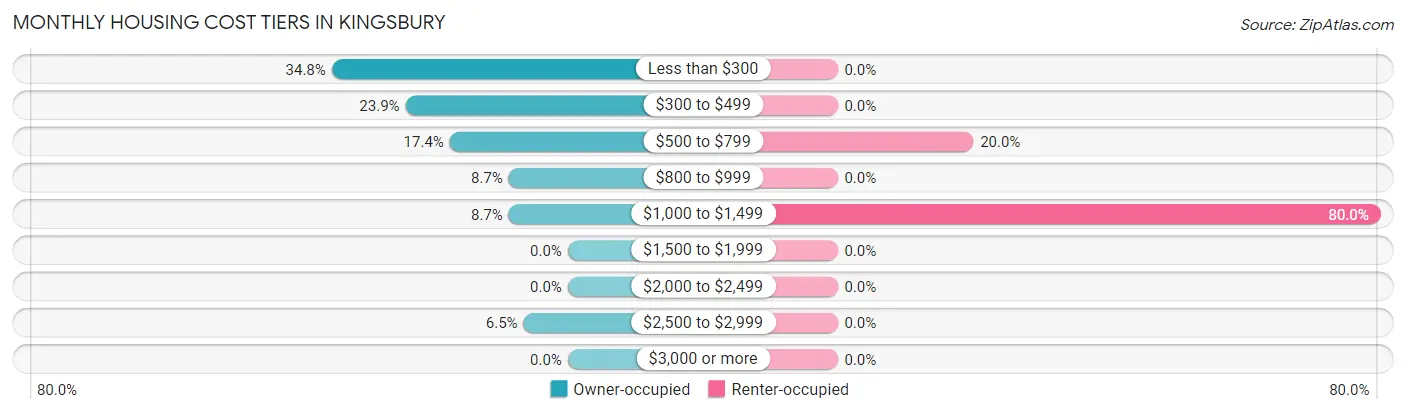
| Monthly Cost | Owner-occupied | Renter-occupied |
| Less than $300 | 16 (34.8%) | 0 (0.0%) |
| $300 to $499 | 11 (23.9%) | 0 (0.0%) |
| $500 to $799 | 8 (17.4%) | 1 (20.0%) |
| $800 to $999 | 4 (8.7%) | 0 (0.0%) |
| $1,000 to $1,499 | 4 (8.7%) | 4 (80.0%) |
| $1,500 to $1,999 | 0 (0.0%) | 0 (0.0%) |
| $2,000 to $2,499 | 0 (0.0%) | 0 (0.0%) |
| $2,500 to $2,999 | 3 (6.5%) | 0 (0.0%) |
| $3,000 or more | 0 (0.0%) | 0 (0.0%) |
| Total | 46 (100.0%) | 5 (100.0%) |
Physical Housing Characteristics in Kingsbury
Housing Structures in Kingsbury
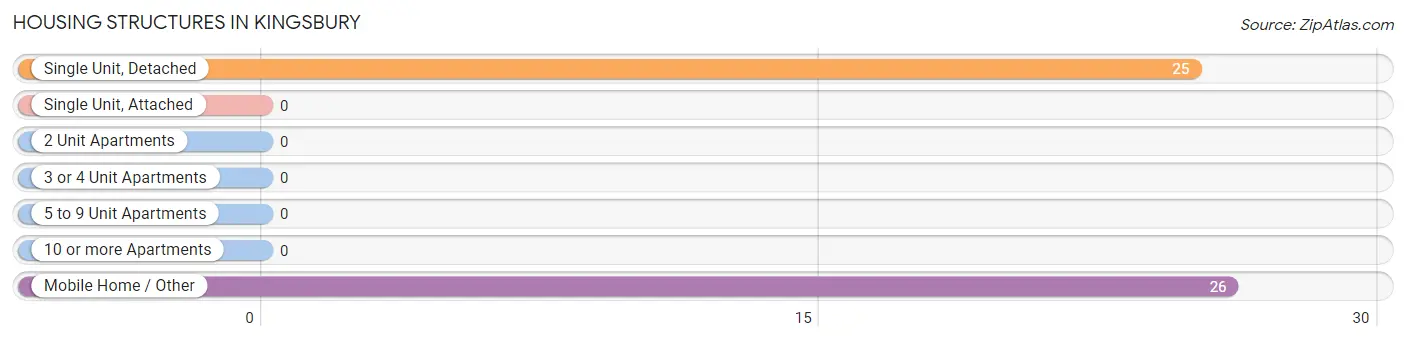
| Structure Type | # Housing Units | % Housing Units |
| Single Unit, Detached | 25 | 49.0% |
| Single Unit, Attached | 0 | 0.0% |
| 2 Unit Apartments | 0 | 0.0% |
| 3 or 4 Unit Apartments | 0 | 0.0% |
| 5 to 9 Unit Apartments | 0 | 0.0% |
| 10 or more Apartments | 0 | 0.0% |
| Mobile Home / Other | 26 | 51.0% |
| Total | 51 | 100.0% |
Housing Structures by Occupancy in Kingsbury
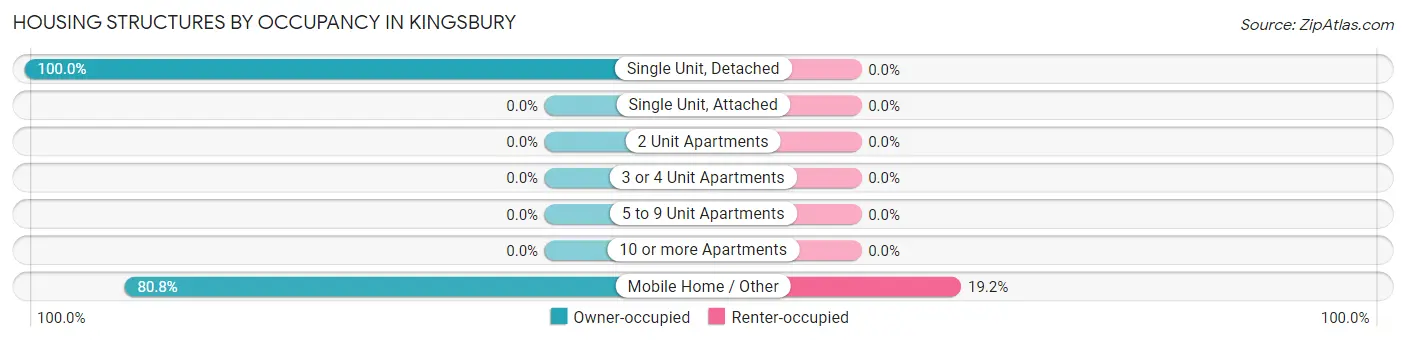
| Structure Type | Owner-occupied | Renter-occupied |
| Single Unit, Detached | 25 (100.0%) | 0 (0.0%) |
| Single Unit, Attached | 0 (0.0%) | 0 (0.0%) |
| 2 Unit Apartments | 0 (0.0%) | 0 (0.0%) |
| 3 or 4 Unit Apartments | 0 (0.0%) | 0 (0.0%) |
| 5 to 9 Unit Apartments | 0 (0.0%) | 0 (0.0%) |
| 10 or more Apartments | 0 (0.0%) | 0 (0.0%) |
| Mobile Home / Other | 21 (80.8%) | 5 (19.2%) |
| Total | 46 (90.2%) | 5 (9.8%) |
Housing Structures by Number of Rooms in Kingsbury
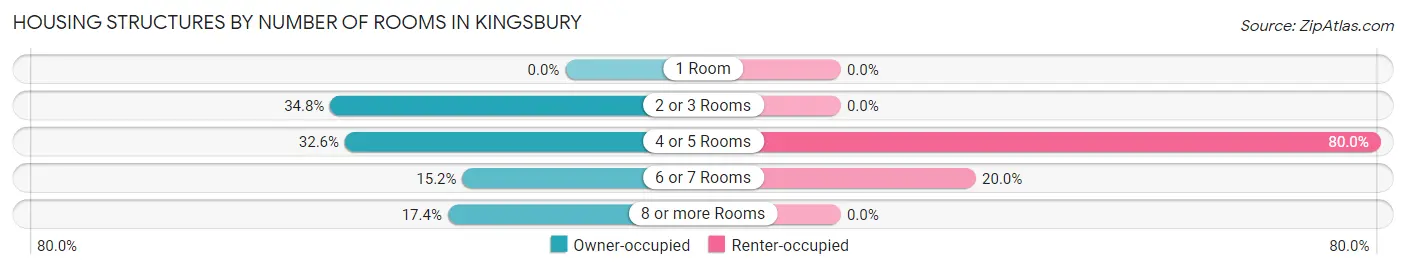
| Number of Rooms | Owner-occupied | Renter-occupied |
| 1 Room | 0 (0.0%) | 0 (0.0%) |
| 2 or 3 Rooms | 16 (34.8%) | 0 (0.0%) |
| 4 or 5 Rooms | 15 (32.6%) | 4 (80.0%) |
| 6 or 7 Rooms | 7 (15.2%) | 1 (20.0%) |
| 8 or more Rooms | 8 (17.4%) | 0 (0.0%) |
| Total | 46 (100.0%) | 5 (100.0%) |
Housing Structure by Heating Type in Kingsbury
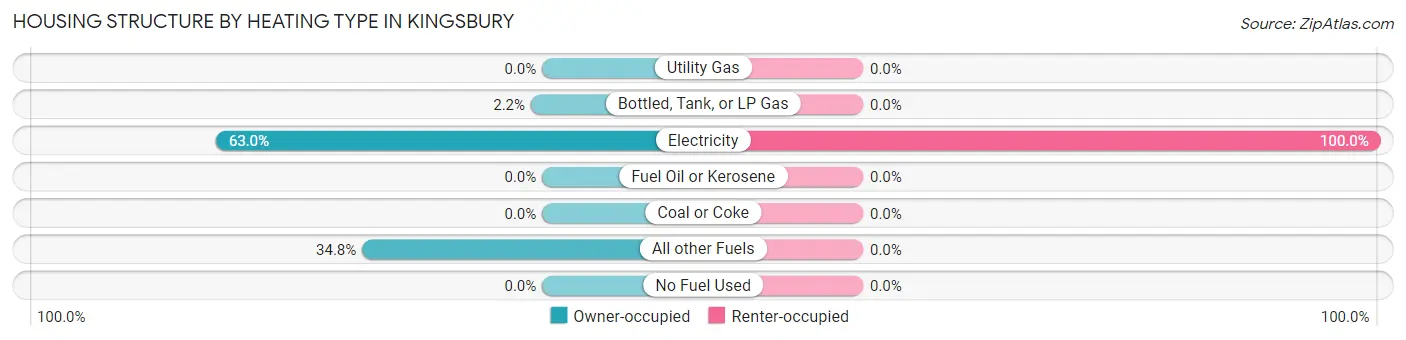
| Heating Type | Owner-occupied | Renter-occupied |
| Utility Gas | 0 (0.0%) | 0 (0.0%) |
| Bottled, Tank, or LP Gas | 1 (2.2%) | 0 (0.0%) |
| Electricity | 29 (63.0%) | 5 (100.0%) |
| Fuel Oil or Kerosene | 0 (0.0%) | 0 (0.0%) |
| Coal or Coke | 0 (0.0%) | 0 (0.0%) |
| All other Fuels | 16 (34.8%) | 0 (0.0%) |
| No Fuel Used | 0 (0.0%) | 0 (0.0%) |
| Total | 46 (100.0%) | 5 (100.0%) |
Household Vehicle Usage in Kingsbury
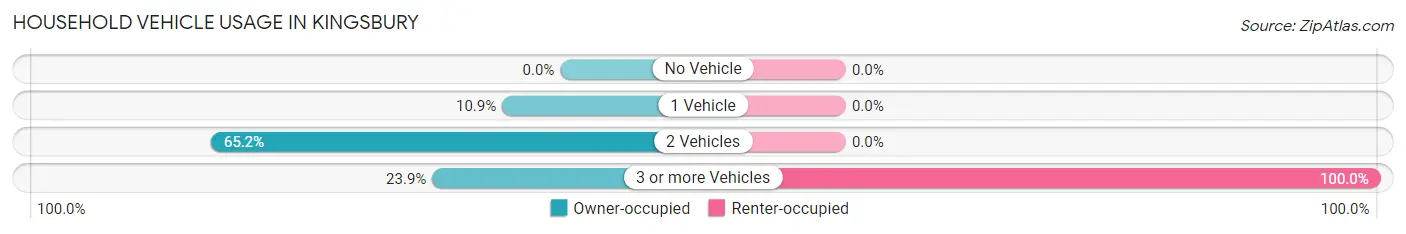
| Vehicles per Household | Owner-occupied | Renter-occupied |
| No Vehicle | 0 (0.0%) | 0 (0.0%) |
| 1 Vehicle | 5 (10.9%) | 0 (0.0%) |
| 2 Vehicles | 30 (65.2%) | 0 (0.0%) |
| 3 or more Vehicles | 11 (23.9%) | 5 (100.0%) |
| Total | 46 (100.0%) | 5 (100.0%) |
Real Estate & Mortgages in Kingsbury
Real Estate and Mortgage Overview in Kingsbury
| Characteristic | Without Mortgage | With Mortgage |
| Housing Units | 33 | 13 |
| Median Property Value | - | - |
| Median Household Income | $76,328 | $0 |
| Monthly Housing Costs | $363 | $0 |
| Real Estate Taxes | $1,667 | $0 |
Property Value by Mortgage Status in Kingsbury
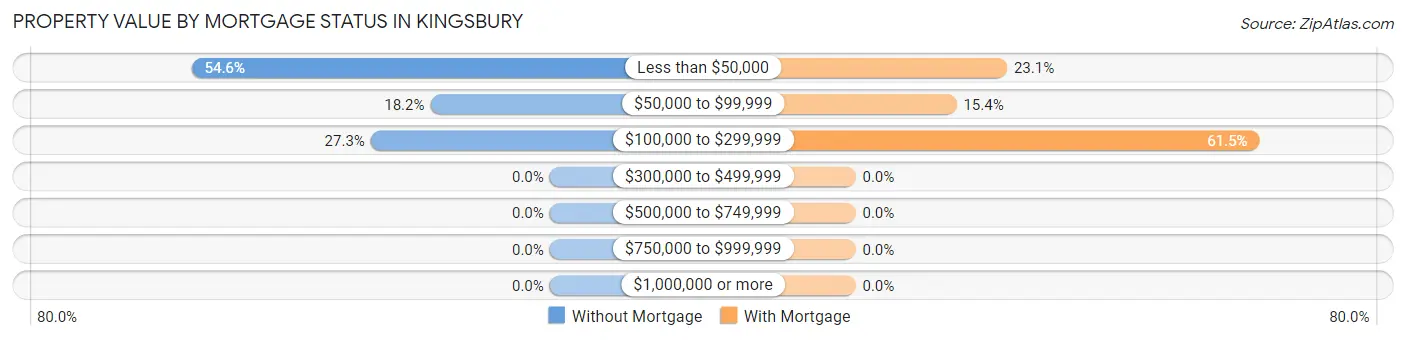
| Property Value | Without Mortgage | With Mortgage |
| Less than $50,000 | 18 (54.5%) | 3 (23.1%) |
| $50,000 to $99,999 | 6 (18.2%) | 2 (15.4%) |
| $100,000 to $299,999 | 9 (27.3%) | 8 (61.5%) |
| $300,000 to $499,999 | 0 (0.0%) | 0 (0.0%) |
| $500,000 to $749,999 | 0 (0.0%) | 0 (0.0%) |
| $750,000 to $999,999 | 0 (0.0%) | 0 (0.0%) |
| $1,000,000 or more | 0 (0.0%) | 0 (0.0%) |
| Total | 33 (100.0%) | 13 (100.0%) |
Household Income by Mortgage Status in Kingsbury
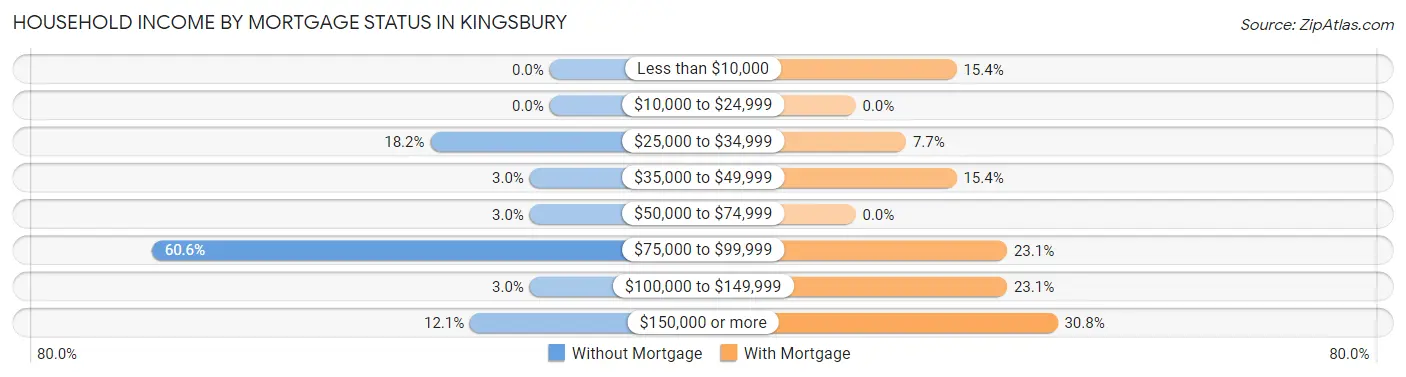
| Household Income | Without Mortgage | With Mortgage |
| Less than $10,000 | 0 (0.0%) | 2 (15.4%) |
| $10,000 to $24,999 | 0 (0.0%) | 0 (0.0%) |
| $25,000 to $34,999 | 6 (18.2%) | 1 (7.7%) |
| $35,000 to $49,999 | 1 (3.0%) | 2 (15.4%) |
| $50,000 to $74,999 | 1 (3.0%) | 0 (0.0%) |
| $75,000 to $99,999 | 20 (60.6%) | 3 (23.1%) |
| $100,000 to $149,999 | 1 (3.0%) | 3 (23.1%) |
| $150,000 or more | 4 (12.1%) | 4 (30.8%) |
| Total | 33 (100.0%) | 13 (100.0%) |
Property Value to Household Income Ratio in Kingsbury
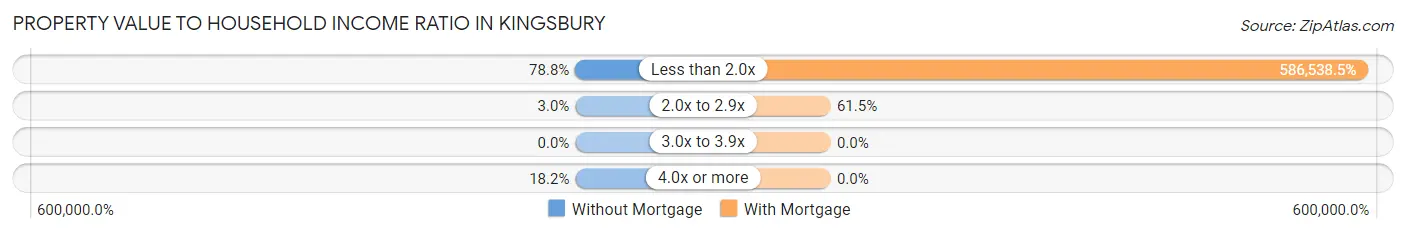
| Value-to-Income Ratio | Without Mortgage | With Mortgage |
| Less than 2.0x | 26 (78.8%) | 76,250 (586,538.5%) |
| 2.0x to 2.9x | 1 (3.0%) | 8 (61.5%) |
| 3.0x to 3.9x | 0 (0.0%) | 0 (0.0%) |
| 4.0x or more | 6 (18.2%) | 0 (0.0%) |
| Total | 33 (100.0%) | 13 (100.0%) |
Real Estate Taxes by Mortgage Status in Kingsbury
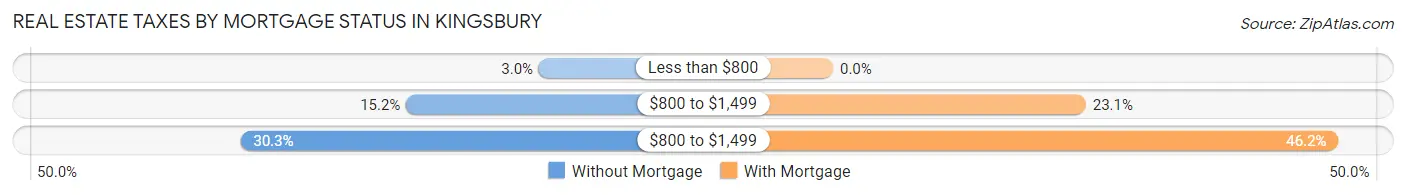
| Property Taxes | Without Mortgage | With Mortgage |
| Less than $800 | 1 (3.0%) | 0 (0.0%) |
| $800 to $1,499 | 5 (15.1%) | 3 (23.1%) |
| $800 to $1,499 | 10 (30.3%) | 6 (46.2%) |
| Total | 33 (100.0%) | 13 (100.0%) |
Health & Disability in Kingsbury
Health Insurance Coverage by Age in Kingsbury
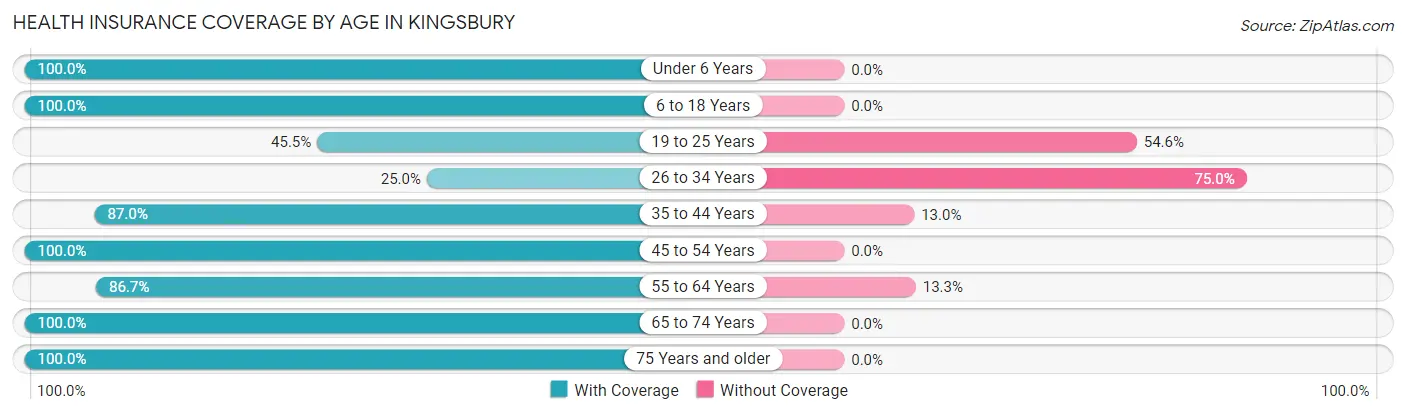
| Age Bracket | With Coverage | Without Coverage |
| Under 6 Years | 2 (100.0%) | 0 (0.0%) |
| 6 to 18 Years | 41 (100.0%) | 0 (0.0%) |
| 19 to 25 Years | 5 (45.5%) | 6 (54.5%) |
| 26 to 34 Years | 1 (25.0%) | 3 (75.0%) |
| 35 to 44 Years | 20 (87.0%) | 3 (13.0%) |
| 45 to 54 Years | 28 (100.0%) | 0 (0.0%) |
| 55 to 64 Years | 26 (86.7%) | 4 (13.3%) |
| 65 to 74 Years | 13 (100.0%) | 0 (0.0%) |
| 75 Years and older | 5 (100.0%) | 0 (0.0%) |
| Total | 141 (89.8%) | 16 (10.2%) |
Health Insurance Coverage by Citizenship Status in Kingsbury
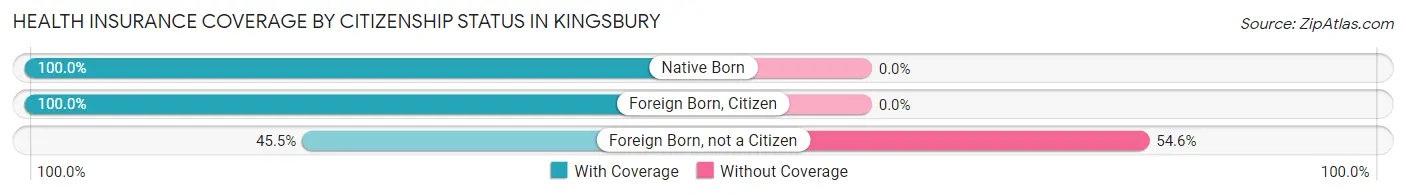
| Citizenship Status | With Coverage | Without Coverage |
| Native Born | 2 (100.0%) | 0 (0.0%) |
| Foreign Born, Citizen | 41 (100.0%) | 0 (0.0%) |
| Foreign Born, not a Citizen | 5 (45.5%) | 6 (54.5%) |
Health Insurance Coverage by Household Income in Kingsbury
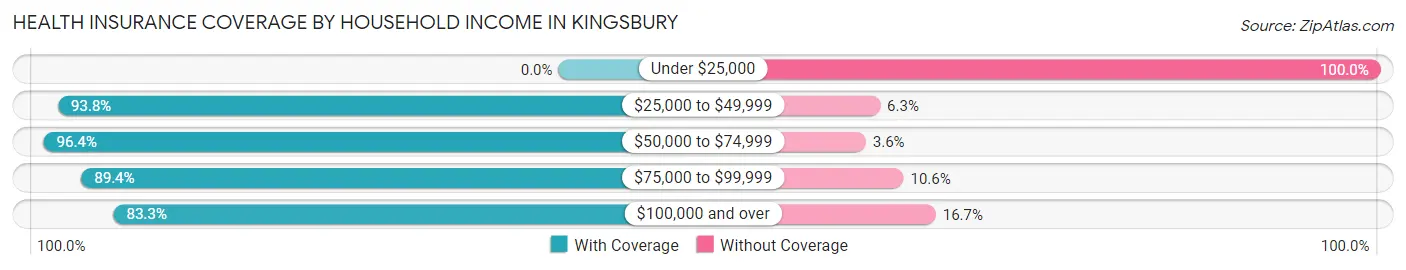
| Household Income | With Coverage | Without Coverage |
| Under $25,000 | 0 (0.0%) | 2 (100.0%) |
| $25,000 to $49,999 | 15 (93.8%) | 1 (6.2%) |
| $50,000 to $74,999 | 54 (96.4%) | 2 (3.6%) |
| $75,000 to $99,999 | 42 (89.4%) | 5 (10.6%) |
| $100,000 and over | 30 (83.3%) | 6 (16.7%) |
Public vs Private Health Insurance Coverage by Age in Kingsbury
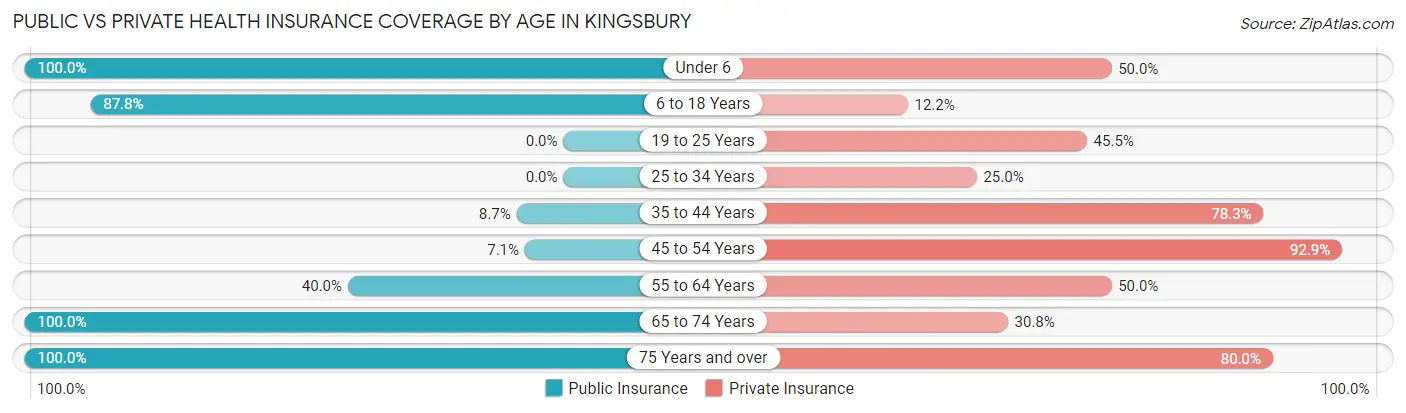
| Age Bracket | Public Insurance | Private Insurance |
| Under 6 | 2 (100.0%) | 1 (50.0%) |
| 6 to 18 Years | 36 (87.8%) | 5 (12.2%) |
| 19 to 25 Years | 0 (0.0%) | 5 (45.5%) |
| 25 to 34 Years | 0 (0.0%) | 1 (25.0%) |
| 35 to 44 Years | 2 (8.7%) | 18 (78.3%) |
| 45 to 54 Years | 2 (7.1%) | 26 (92.9%) |
| 55 to 64 Years | 12 (40.0%) | 15 (50.0%) |
| 65 to 74 Years | 13 (100.0%) | 4 (30.8%) |
| 75 Years and over | 5 (100.0%) | 4 (80.0%) |
| Total | 72 (45.9%) | 79 (50.3%) |
Disability Status by Sex by Age in Kingsbury
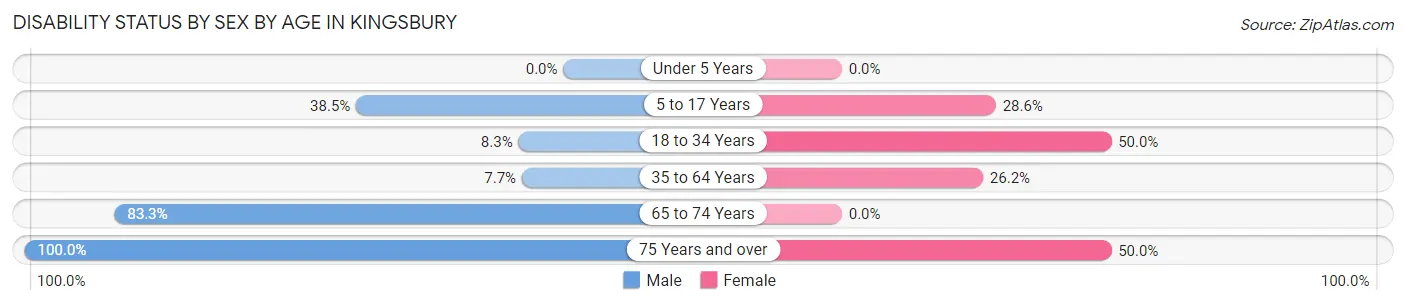
| Age Bracket | Male | Female |
| Under 5 Years | 0 (0.0%) | 0 (0.0%) |
| 5 to 17 Years | 5 (38.5%) | 6 (28.6%) |
| 18 to 34 Years | 1 (8.3%) | 6 (50.0%) |
| 35 to 64 Years | 3 (7.7%) | 11 (26.2%) |
| 65 to 74 Years | 5 (83.3%) | 0 (0.0%) |
| 75 Years and over | 3 (100.0%) | 1 (50.0%) |
Disability Class by Sex by Age in Kingsbury
Disability Class: Hearing Difficulty
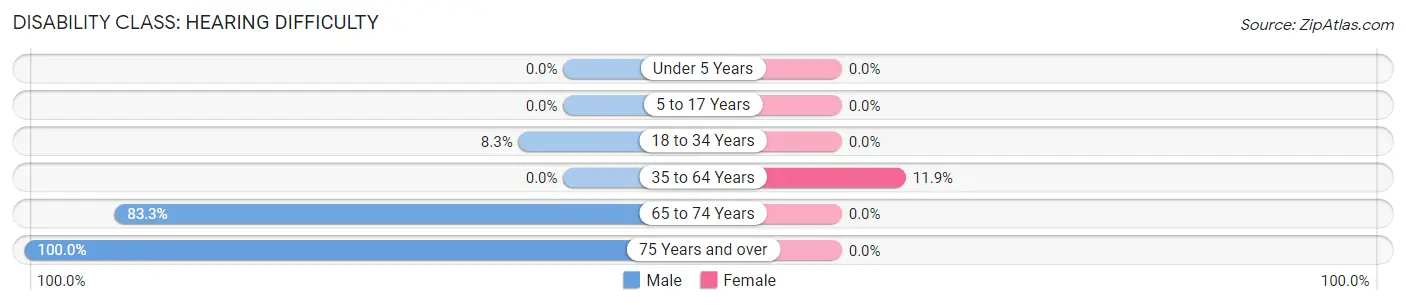
| Age Bracket | Male | Female |
| Under 5 Years | 0 (0.0%) | 0 (0.0%) |
| 5 to 17 Years | 0 (0.0%) | 0 (0.0%) |
| 18 to 34 Years | 1 (8.3%) | 0 (0.0%) |
| 35 to 64 Years | 0 (0.0%) | 5 (11.9%) |
| 65 to 74 Years | 5 (83.3%) | 0 (0.0%) |
| 75 Years and over | 3 (100.0%) | 0 (0.0%) |
Disability Class: Vision Difficulty
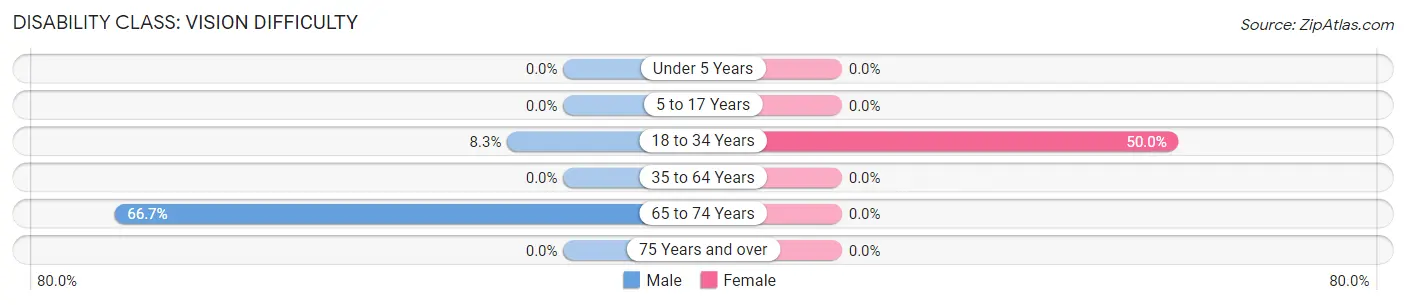
| Age Bracket | Male | Female |
| Under 5 Years | 0 (0.0%) | 0 (0.0%) |
| 5 to 17 Years | 0 (0.0%) | 0 (0.0%) |
| 18 to 34 Years | 1 (8.3%) | 6 (50.0%) |
| 35 to 64 Years | 0 (0.0%) | 0 (0.0%) |
| 65 to 74 Years | 4 (66.7%) | 0 (0.0%) |
| 75 Years and over | 0 (0.0%) | 0 (0.0%) |
Disability Class: Cognitive Difficulty
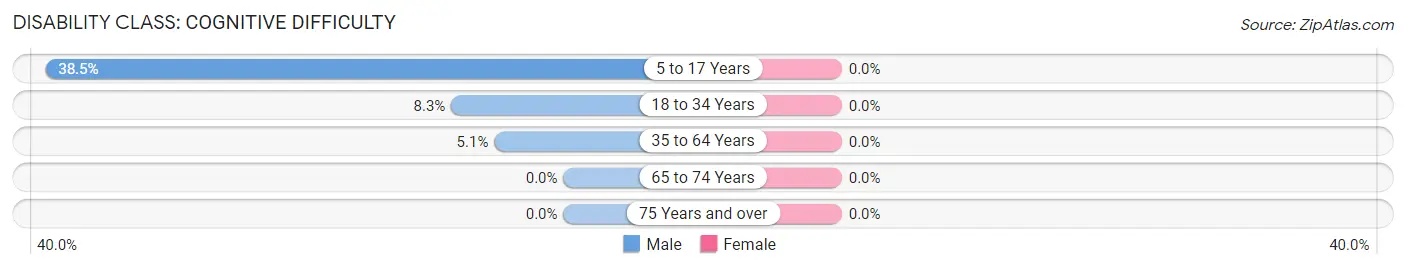
| Age Bracket | Male | Female |
| 5 to 17 Years | 5 (38.5%) | 0 (0.0%) |
| 18 to 34 Years | 1 (8.3%) | 0 (0.0%) |
| 35 to 64 Years | 2 (5.1%) | 0 (0.0%) |
| 65 to 74 Years | 0 (0.0%) | 0 (0.0%) |
| 75 Years and over | 0 (0.0%) | 0 (0.0%) |
Disability Class: Ambulatory Difficulty
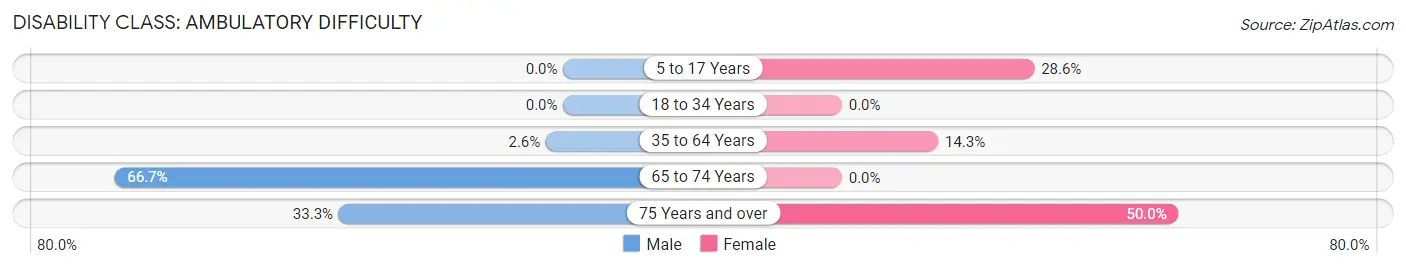
| Age Bracket | Male | Female |
| 5 to 17 Years | 0 (0.0%) | 6 (28.6%) |
| 18 to 34 Years | 0 (0.0%) | 0 (0.0%) |
| 35 to 64 Years | 1 (2.6%) | 6 (14.3%) |
| 65 to 74 Years | 4 (66.7%) | 0 (0.0%) |
| 75 Years and over | 1 (33.3%) | 1 (50.0%) |
Disability Class: Self-Care Difficulty
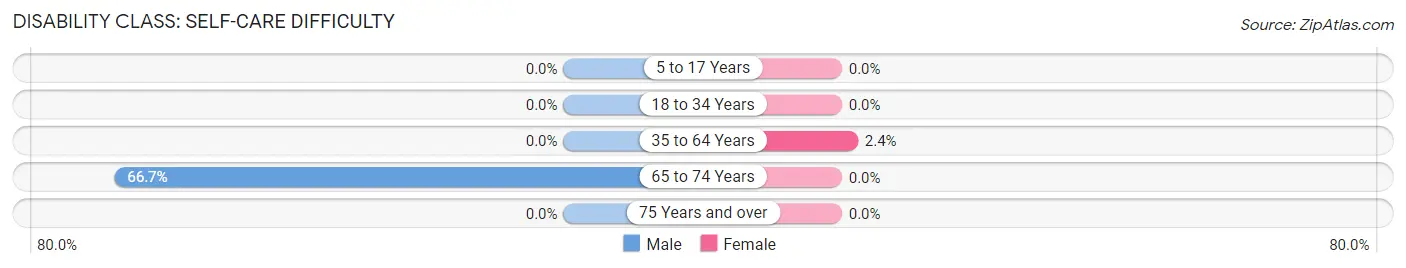
| Age Bracket | Male | Female |
| 5 to 17 Years | 0 (0.0%) | 0 (0.0%) |
| 18 to 34 Years | 0 (0.0%) | 0 (0.0%) |
| 35 to 64 Years | 0 (0.0%) | 1 (2.4%) |
| 65 to 74 Years | 4 (66.7%) | 0 (0.0%) |
| 75 Years and over | 0 (0.0%) | 0 (0.0%) |
Technology Access in Kingsbury
Computing Device Access in Kingsbury
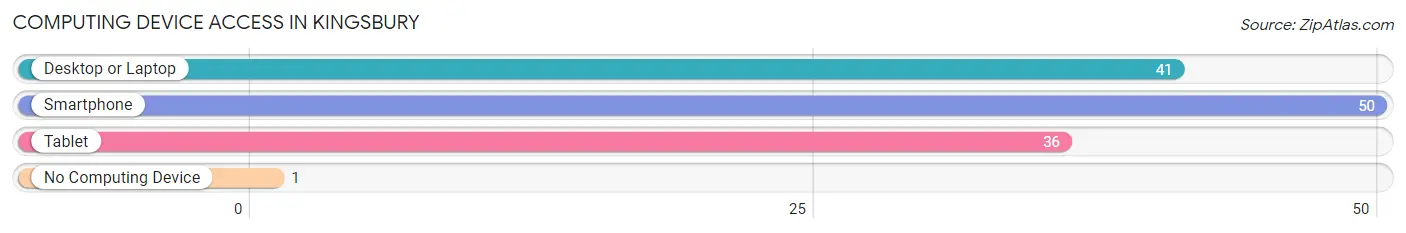
| Device Type | # Households | % Households |
| Desktop or Laptop | 41 | 80.4% |
| Smartphone | 50 | 98.0% |
| Tablet | 36 | 70.6% |
| No Computing Device | 1 | 2.0% |
| Total | 51 | 100.0% |
Internet Access in Kingsbury
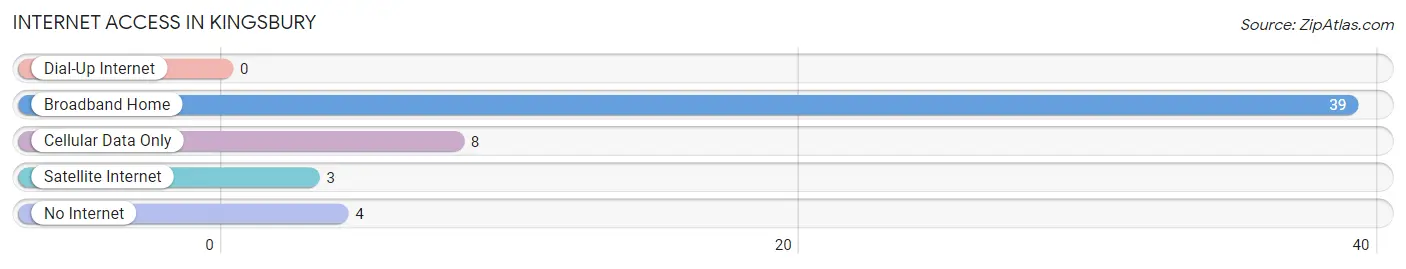
| Internet Type | # Households | % Households |
| Dial-Up Internet | 0 | 0.0% |
| Broadband Home | 39 | 76.5% |
| Cellular Data Only | 8 | 15.7% |
| Satellite Internet | 3 | 5.9% |
| No Internet | 4 | 7.8% |
| Total | 51 | 100.0% |
Kingsbury Summary
History
Kingsbury, Texas is a small unincorporated community located in Guadalupe County, Texas. It is situated about 20 miles east of San Antonio and about 10 miles south of Seguin. The area was first settled in the late 1800s by German immigrants who were attracted to the area by its fertile soil and abundant water supply. The town was named after a local rancher, John Kingsbury, who owned a large ranch in the area.
The town of Kingsbury was officially established in 1891 and was incorporated in 1895. The town quickly grew and by the early 1900s, it had become a thriving agricultural center. The town was home to several cotton gins, a flour mill, a blacksmith shop, and a general store. The town also had a post office, a school, and a church.
In the early 1900s, the town began to decline as the railroad bypassed it and the population began to move away. By the mid-1900s, the town had become a ghost town. However, in the late 1990s, the town began to experience a resurgence as people began to move back to the area. Today, Kingsbury is a small, rural community with a population of about 500 people.
Geography
Kingsbury is located in Guadalupe County, Texas, about 20 miles east of San Antonio and 10 miles south of Seguin. The town is situated on the banks of the Guadalupe River and is surrounded by rolling hills and farmland. The area is known for its fertile soil and abundant water supply, which has made it an ideal location for farming and ranching.
The climate in Kingsbury is generally mild, with hot summers and cool winters. The average annual temperature is around 70 degrees Fahrenheit. The area receives an average of 33 inches of rain per year.
Economy
The economy of Kingsbury is largely based on agriculture. The area is known for its fertile soil and abundant water supply, which has made it an ideal location for farming and ranching. The town is home to several farms and ranches, as well as a few small businesses.
The town also has a few tourist attractions, including the Kingsbury Historical Museum, which houses artifacts from the town’s past. The town also hosts several festivals throughout the year, including the Kingsbury County Fair and the Kingsbury Music Festival.
Demographics
As of the 2010 census, the population of Kingsbury was 498. The racial makeup of the town was 94.2% White, 0.2% African American, 0.2% Native American, 0.2% Asian, 0.2% Pacific Islander, 3.2% from other races, and 1.8% from two or more races. Hispanic or Latino of any race were 6.2% of the population.
The median income for a household in Kingsbury was $37,500, and the median income for a family was $41,250. The per capita income for the town was $17,845. About 11.2% of families and 13.2% of the population were below the poverty line, including 16.2% of those under age 18 and 8.2% of those age 65 or over.
Common Questions
What is Per Capita Income in Kingsbury?
Per Capita income in Kingsbury is $27,332.
What is the Median Family Income in Kingsbury?
Median Family Income in Kingsbury is $76,250.
What is the Median Household income in Kingsbury?
Median Household Income in Kingsbury is $75,956.
What is Inequality or Gini Index in Kingsbury?
Inequality or Gini Index in Kingsbury is 0.30.
What is the Total Population of Kingsbury?
Total Population of Kingsbury is 157.
What is the Total Male Population of Kingsbury?
Total Male Population of Kingsbury is 73.
What is the Total Female Population of Kingsbury?
Total Female Population of Kingsbury is 84.
What is the Ratio of Males per 100 Females in Kingsbury?
There are 86.90 Males per 100 Females in Kingsbury.
What is the Ratio of Females per 100 Males in Kingsbury?
There are 115.07 Females per 100 Males in Kingsbury.
What is the Median Population Age in Kingsbury?
Median Population Age in Kingsbury is 42.8 Years.
What is the Average Family Size in Kingsbury
Average Family Size in Kingsbury is 2.8 People.
What is the Average Household Size in Kingsbury
Average Household Size in Kingsbury is 3.1 People.
How Large is the Labor Force in Kingsbury?
There are 72 People in the Labor Forcein in Kingsbury.
What is the Percentage of People in the Labor Force in Kingsbury?
55.8% of People are in the Labor Force in Kingsbury.
What is the Unemployment Rate in Kingsbury?
Unemployment Rate in Kingsbury is 5.6%.