Cities with the Highest Percentage of Population Employed in Health Diagnosing & Treating in Texas
RELATED REPORTS & OPTIONS
Health Diagnosing & Treating
Texas
Compare Cities
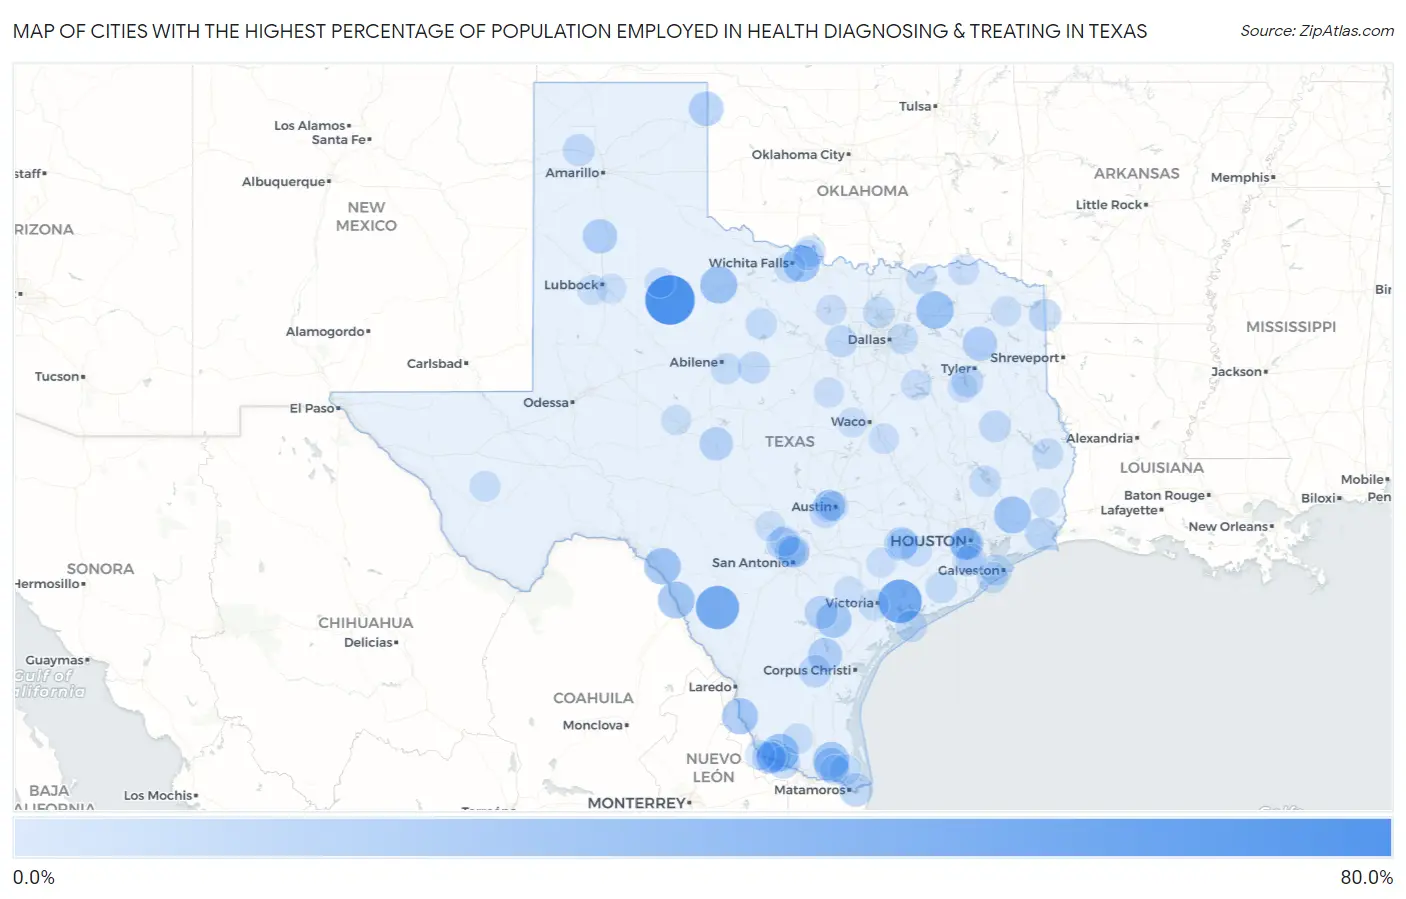
Map of Cities with the Highest Percentage of Population Employed in Health Diagnosing & Treating in Texas
0.0%
80.0%
Cities with the Highest Percentage of Population Employed in Health Diagnosing & Treating in Texas
| City | % Employed | vs State | vs National | |
| 1. | Girard | 75.0% | 5.5%(+69.5)#1 | 6.2%(+68.8)#27 |
| 2. | Mccaulley | 69.2% | 5.5%(+63.7)#2 | 6.2%(+63.0)#30 |
| 3. | Vanderbilt | 55.3% | 5.5%(+49.8)#3 | 6.2%(+49.1)#56 |
| 4. | Loma Grande | 54.3% | 5.5%(+48.7)#4 | 6.2%(+48.0)#60 |
| 5. | Neylandville | 35.7% | 5.5%(+30.2)#5 | 6.2%(+29.5)#189 |
| 6. | El Brazil | 35.3% | 5.5%(+29.8)#6 | 6.2%(+29.0)#198 |
| 7. | Benjamin | 34.5% | 5.5%(+29.0)#7 | 6.2%(+28.2)#211 |
| 8. | Hull | 33.7% | 5.5%(+28.2)#8 | 6.2%(+27.5)#219 |
| 9. | Radar Base | 33.3% | 5.5%(+27.8)#9 | 6.2%(+27.1)#232 |
| 10. | Laughlin Afb | 33.0% | 5.5%(+27.5)#10 | 6.2%(+26.7)#244 |
| 11. | Jolly | 32.4% | 5.5%(+26.9)#11 | 6.2%(+26.2)#255 |
| 12. | Sylvester | 31.6% | 5.5%(+26.1)#12 | 6.2%(+25.3)#282 |
| 13. | San Ygnacio | 31.0% | 5.5%(+25.4)#13 | 6.2%(+24.7)#291 |
| 14. | Zapata Ranch | 30.7% | 5.5%(+25.2)#14 | 6.2%(+24.4)#294 |
| 15. | Normanna | 30.0% | 5.5%(+24.5)#15 | 6.2%(+23.8)#306 |
| 16. | Higgins | 26.6% | 5.5%(+21.1)#16 | 6.2%(+20.4)#385 |
| 17. | Tierra Bonita | 26.6% | 5.5%(+21.0)#17 | 6.2%(+20.3)#388 |
| 18. | Edmonson | 26.4% | 5.5%(+20.9)#18 | 6.2%(+20.2)#391 |
| 19. | Holly Lake Ranch | 25.5% | 5.5%(+19.9)#19 | 6.2%(+19.2)#423 |
| 20. | K Bar Ranch | 24.8% | 5.5%(+19.3)#20 | 6.2%(+18.5)#456 |
| 21. | Glidden | 24.1% | 5.5%(+18.5)#21 | 6.2%(+17.8)#490 |
| 22. | Airport Heights | 23.9% | 5.5%(+18.4)#22 | 6.2%(+17.7)#499 |
| 23. | Rice Tracts | 23.7% | 5.5%(+18.2)#23 | 6.2%(+17.5)#508 |
| 24. | Eden | 22.8% | 5.5%(+17.3)#24 | 6.2%(+16.6)#562 |
| 25. | South Point | 22.7% | 5.5%(+17.2)#25 | 6.2%(+16.5)#564 |
| 26. | South Frydek | 22.6% | 5.5%(+17.0)#26 | 6.2%(+16.3)#576 |
| 27. | Pawnee | 22.0% | 5.5%(+16.4)#27 | 6.2%(+15.7)#605 |
| 28. | Southside Place | 21.1% | 5.5%(+15.6)#28 | 6.2%(+14.8)#654 |
| 29. | Los Barreras | 20.8% | 5.5%(+15.3)#29 | 6.2%(+14.6)#675 |
| 30. | Valle Vista | 20.3% | 5.5%(+14.8)#30 | 6.2%(+14.0)#721 |
| 31. | Taylor Landing | 19.8% | 5.5%(+14.3)#31 | 6.2%(+13.6)#765 |
| 32. | Rancho Alegre | 19.7% | 5.5%(+14.2)#32 | 6.2%(+13.5)#780 |
| 33. | Scenic Oaks | 19.5% | 5.5%(+14.0)#33 | 6.2%(+13.3)#793 |
| 34. | Bloomburg | 19.1% | 5.5%(+13.6)#34 | 6.2%(+12.9)#828 |
| 35. | Bear Creek Ranch | 19.0% | 5.5%(+13.5)#35 | 6.2%(+12.8)#840 |
| 36. | Cedar Creek | 18.8% | 5.5%(+13.3)#36 | 6.2%(+12.5)#860 |
| 37. | Hollywood Park | 18.7% | 5.5%(+13.2)#37 | 6.2%(+12.4)#875 |
| 38. | Barton Creek | 18.5% | 5.5%(+13.0)#38 | 6.2%(+12.3)#896 |
| 39. | Emerald Bay | 18.4% | 5.5%(+12.9)#39 | 6.2%(+12.2)#903 |
| 40. | Willow Park | 18.3% | 5.5%(+12.8)#40 | 6.2%(+12.0)#918 |
| 41. | Putnam | 18.2% | 5.5%(+12.7)#41 | 6.2%(+11.9)#937 |
| 42. | Boys Ranch | 17.9% | 5.5%(+12.4)#42 | 6.2%(+11.7)#960 |
| 43. | West University Place | 17.6% | 5.5%(+12.0)#43 | 6.2%(+11.3)#1,002 |
| 44. | Wells | 17.5% | 5.5%(+12.0)#44 | 6.2%(+11.3)#1,008 |
| 45. | Cape Royale | 17.1% | 5.5%(+11.6)#45 | 6.2%(+10.9)#1,060 |
| 46. | Port O Connor | 17.1% | 5.5%(+11.6)#46 | 6.2%(+10.9)#1,068 |
| 47. | Bellaire | 17.1% | 5.5%(+11.6)#47 | 6.2%(+10.9)#1,070 |
| 48. | Van Vleck | 17.0% | 5.5%(+11.5)#48 | 6.2%(+10.8)#1,078 |
| 49. | Oak Point | 16.9% | 5.5%(+11.4)#49 | 6.2%(+10.7)#1,096 |
| 50. | Ben Bolt | 16.9% | 5.5%(+11.4)#50 | 6.2%(+10.7)#1,097 |
| 51. | Woodson | 16.9% | 5.5%(+11.3)#51 | 6.2%(+10.6)#1,113 |
| 52. | Tiki Island | 16.5% | 5.5%(+11.0)#52 | 6.2%(+10.3)#1,175 |
| 53. | Neches | 16.5% | 5.5%(+11.0)#53 | 6.2%(+10.2)#1,178 |
| 54. | Jamaica Beach | 16.5% | 5.5%(+11.0)#54 | 6.2%(+10.2)#1,182 |
| 55. | Villa Del Sol | 16.4% | 5.5%(+10.9)#55 | 6.2%(+10.2)#1,189 |
| 56. | Bushland | 16.3% | 5.5%(+10.8)#56 | 6.2%(+10.1)#1,208 |
| 57. | Byers | 16.1% | 5.5%(+10.6)#57 | 6.2%(+9.83)#1,274 |
| 58. | Shavano Park | 16.0% | 5.5%(+10.5)#58 | 6.2%(+9.80)#1,279 |
| 59. | Potosi | 16.0% | 5.5%(+10.4)#59 | 6.2%(+9.72)#1,290 |
| 60. | Bear Creek | 15.6% | 5.5%(+10.1)#60 | 6.2%(+9.34)#1,372 |
| 61. | Lakeside City | 15.5% | 5.5%(+9.98)#61 | 6.2%(+9.25)#1,394 |
| 62. | Sam Rayburn | 15.5% | 5.5%(+9.95)#62 | 6.2%(+9.22)#1,401 |
| 63. | Sunnyvale | 15.4% | 5.5%(+9.88)#63 | 6.2%(+9.16)#1,413 |
| 64. | Ravenna | 15.2% | 5.5%(+9.63)#64 | 6.2%(+8.91)#1,472 |
| 65. | Beaver Creek | 15.0% | 5.5%(+9.50)#65 | 6.2%(+8.78)#1,499 |
| 66. | Quail Creek | 14.9% | 5.5%(+9.37)#66 | 6.2%(+8.64)#1,532 |
| 67. | Fort Davis | 14.8% | 5.5%(+9.29)#67 | 6.2%(+8.56)#1,555 |
| 68. | Lost Creek | 14.8% | 5.5%(+9.27)#68 | 6.2%(+8.54)#1,557 |
| 69. | Eagle Lake | 14.6% | 5.5%(+9.11)#69 | 6.2%(+8.39)#1,606 |
| 70. | Hill Country Village | 14.6% | 5.5%(+9.09)#70 | 6.2%(+8.36)#1,614 |
| 71. | Rockwell Place | 14.5% | 5.5%(+8.99)#71 | 6.2%(+8.27)#1,642 |
| 72. | Delmita | 14.5% | 5.5%(+8.95)#72 | 6.2%(+8.23)#1,657 |
| 73. | Iowa Colony | 14.5% | 5.5%(+8.95)#73 | 6.2%(+8.22)#1,660 |
| 74. | Fair Oaks Ranch | 14.1% | 5.5%(+8.53)#74 | 6.2%(+7.81)#1,791 |
| 75. | Powell | 14.0% | 5.5%(+8.52)#75 | 6.2%(+7.79)#1,799 |
| 76. | Forest Heights | 13.9% | 5.5%(+8.42)#76 | 6.2%(+7.69)#1,821 |
| 77. | Powderly | 13.9% | 5.5%(+8.39)#77 | 6.2%(+7.67)#1,825 |
| 78. | Columbus | 13.9% | 5.5%(+8.39)#78 | 6.2%(+7.66)#1,828 |
| 79. | Petrolia | 13.8% | 5.5%(+8.33)#79 | 6.2%(+7.60)#1,849 |
| 80. | Mi Ranchito Estate | 13.8% | 5.5%(+8.27)#80 | 6.2%(+7.54)#1,877 |
| 81. | Lake Bridgeport | 13.8% | 5.5%(+8.24)#81 | 6.2%(+7.51)#1,886 |
| 82. | Marlin | 13.6% | 5.5%(+8.12)#82 | 6.2%(+7.40)#1,930 |
| 83. | Stockton Bend | 13.5% | 5.5%(+8.02)#83 | 6.2%(+7.30)#1,965 |
| 84. | Omaha | 13.5% | 5.5%(+7.99)#84 | 6.2%(+7.26)#1,980 |
| 85. | Grape Creek | 13.5% | 5.5%(+7.98)#85 | 6.2%(+7.25)#1,981 |
| 86. | Iredell | 13.4% | 5.5%(+7.87)#86 | 6.2%(+7.14)#2,030 |
| 87. | Fronton | 13.3% | 5.5%(+7.81)#87 | 6.2%(+7.09)#2,046 |
| 88. | Manvel | 13.3% | 5.5%(+7.78)#88 | 6.2%(+7.05)#2,065 |
| 89. | Wolfforth | 13.3% | 5.5%(+7.78)#89 | 6.2%(+7.05)#2,066 |
| 90. | Dickens | 13.2% | 5.5%(+7.72)#90 | 6.2%(+6.99)#2,088 |
| 91. | Poetry | 13.1% | 5.5%(+7.57)#91 | 6.2%(+6.84)#2,143 |
| 92. | Comfort | 13.1% | 5.5%(+7.57)#92 | 6.2%(+6.84)#2,145 |
| 93. | Rollingwood | 13.0% | 5.5%(+7.51)#93 | 6.2%(+6.79)#2,172 |
| 94. | Ransom Canyon | 12.9% | 5.5%(+7.37)#94 | 6.2%(+6.65)#2,248 |
| 95. | Yorktown | 12.9% | 5.5%(+7.35)#95 | 6.2%(+6.63)#2,254 |
| 96. | Evadale | 12.9% | 5.5%(+7.34)#96 | 6.2%(+6.61)#2,259 |
| 97. | Palm Valley | 12.8% | 5.5%(+7.26)#97 | 6.2%(+6.54)#2,294 |
| 98. | Frankston | 12.8% | 5.5%(+7.26)#98 | 6.2%(+6.54)#2,296 |
| 99. | Crawford | 12.8% | 5.5%(+7.25)#99 | 6.2%(+6.53)#2,297 |
| 100. | Hallettsville | 12.7% | 5.5%(+7.17)#100 | 6.2%(+6.45)#2,338 |
Common Questions
What are the Top 10 Cities with the Highest Percentage of Population Employed in Health Diagnosing & Treating in Texas?
Top 10 Cities with the Highest Percentage of Population Employed in Health Diagnosing & Treating in Texas are:
#1
75.0%
#2
55.3%
#3
54.3%
#4
35.7%
#5
35.3%
#6
34.5%
#7
33.7%
#8
33.3%
#9
33.0%
#10
32.4%
What city has the Highest Percentage of Population Employed in Health Diagnosing & Treating in Texas?
Girard has the Highest Percentage of Population Employed in Health Diagnosing & Treating in Texas with 75.0%.
What is the Percentage of Population Employed in Health Diagnosing & Treating in the State of Texas?
Percentage of Population Employed in Health Diagnosing & Treating in Texas is 5.5%.
What is the Percentage of Population Employed in Health Diagnosing & Treating in the United States?
Percentage of Population Employed in Health Diagnosing & Treating in the United States is 6.2%.