Highlands, TX Map & Demographics
Highlands Map
Highlands Overview
$30,300
PER CAPITA INCOME
$72,738
AVG FAMILY INCOME
$64,343
AVG HOUSEHOLD INCOME
37.8%
WAGE / INCOME GAP [ % ]
62.2¢/ $1
WAGE / INCOME GAP [ $ ]
$16,546
FAMILY INCOME DEFICIT
0.46
INEQUALITY / GINI INDEX
7,359
TOTAL POPULATION
3,637
MALE POPULATION
3,722
FEMALE POPULATION
97.72
MALES / 100 FEMALES
102.34
FEMALES / 100 MALES
34.5
MEDIAN AGE
3.6
AVG FAMILY SIZE
3.0
AVG HOUSEHOLD SIZE
3,122
LABOR FORCE [ PEOPLE ]
57.0%
PERCENT IN LABOR FORCE
8.0%
UNEMPLOYMENT RATE
Highlands Zip Codes
Income in Highlands
Income Overview in Highlands
Per Capita Income in Highlands is $30,300, while median incomes of families and households are $72,738 and $64,343 respectively.
| Characteristic | Number | Measure |
| Per Capita Income | 7,359 | $30,300 |
| Median Family Income | 1,846 | $72,738 |
| Mean Family Income | 1,846 | $101,420 |
| Median Household Income | 2,416 | $64,343 |
| Mean Household Income | 2,416 | $88,306 |
| Income Deficit | 1,846 | $16,546 |
| Wage / Income Gap (%) | 7,359 | 37.85% |
| Wage / Income Gap ($) | 7,359 | 62.15¢ per $1 |
| Gini / Inequality Index | 7,359 | 0.46 |
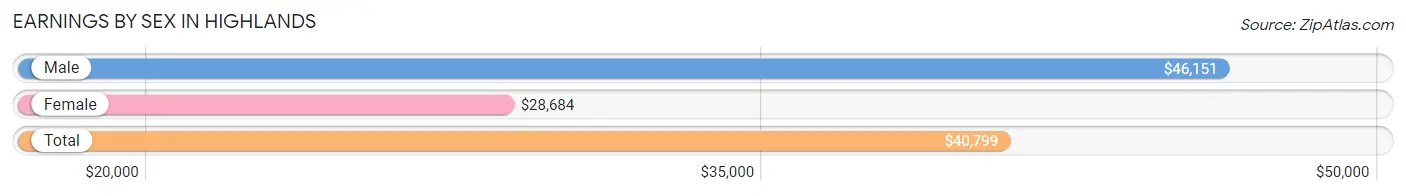
Earnings by Sex in Highlands
Average Earnings in Highlands are $40,799, $46,151 for men and $28,684 for women, a difference of 37.9%.
| Sex | Number | Average Earnings |
| Male | 1,670 (53.3%) | $46,151 |
| Female | 1,464 (46.7%) | $28,684 |
| Total | 3,134 (100.0%) | $40,799 |
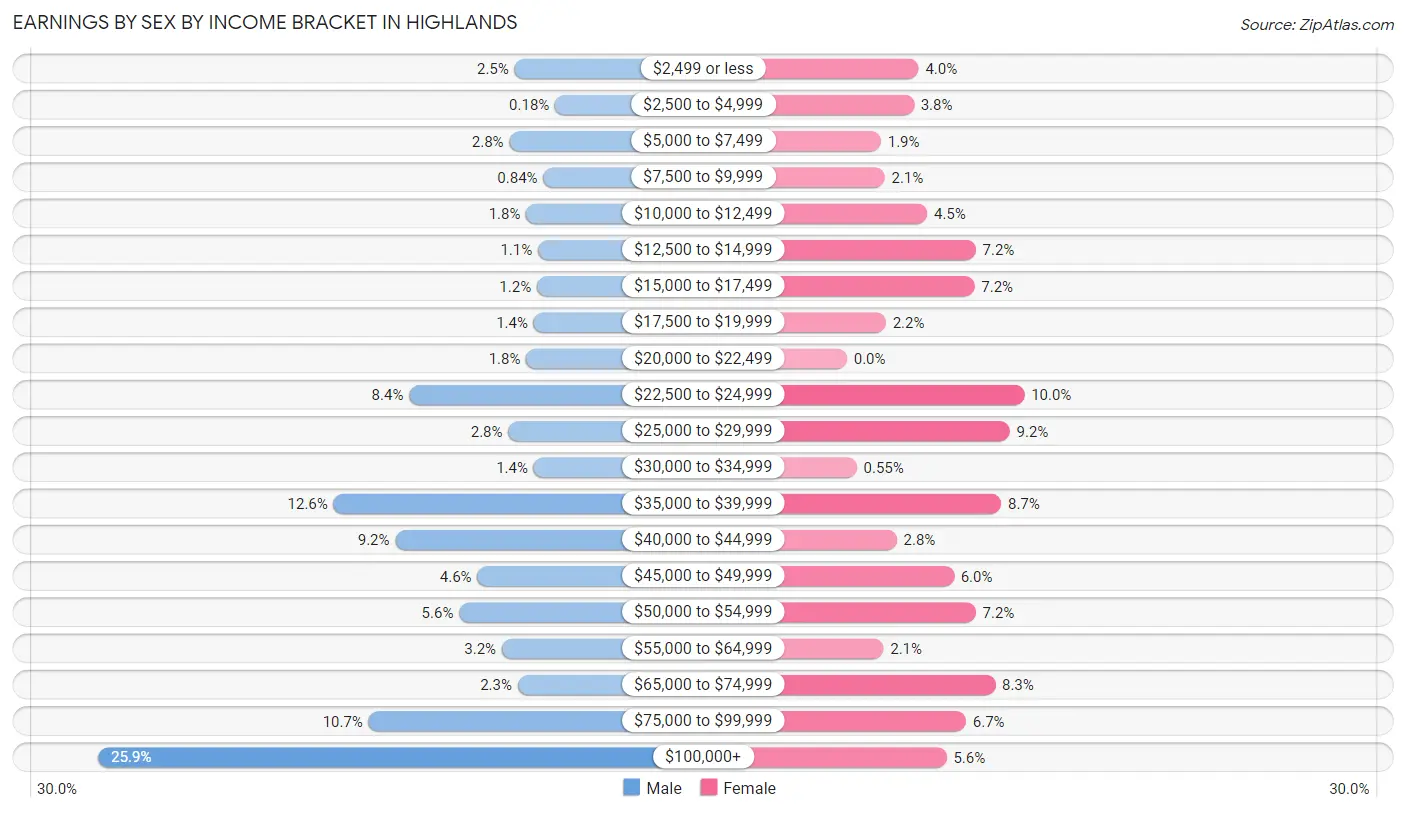
Earnings by Sex by Income Bracket in Highlands
The most common earnings brackets in Highlands are $100,000+ for men (432 | 25.9%) and $22,500 to $24,999 for women (146 | 10.0%).
| Income | Male | Female |
| $2,499 or less | 41 (2.5%) | 59 (4.0%) |
| $2,500 to $4,999 | 3 (0.2%) | 55 (3.8%) |
| $5,000 to $7,499 | 46 (2.8%) | 28 (1.9%) |
| $7,500 to $9,999 | 14 (0.8%) | 31 (2.1%) |
| $10,000 to $12,499 | 30 (1.8%) | 66 (4.5%) |
| $12,500 to $14,999 | 19 (1.1%) | 106 (7.2%) |
| $15,000 to $17,499 | 20 (1.2%) | 105 (7.2%) |
| $17,500 to $19,999 | 23 (1.4%) | 32 (2.2%) |
| $20,000 to $22,499 | 30 (1.8%) | 0 (0.0%) |
| $22,500 to $24,999 | 140 (8.4%) | 146 (10.0%) |
| $25,000 to $29,999 | 47 (2.8%) | 134 (9.1%) |
| $30,000 to $34,999 | 23 (1.4%) | 8 (0.5%) |
| $35,000 to $39,999 | 211 (12.6%) | 127 (8.7%) |
| $40,000 to $44,999 | 153 (9.2%) | 41 (2.8%) |
| $45,000 to $49,999 | 76 (4.5%) | 88 (6.0%) |
| $50,000 to $54,999 | 93 (5.6%) | 106 (7.2%) |
| $55,000 to $64,999 | 53 (3.2%) | 30 (2.1%) |
| $65,000 to $74,999 | 38 (2.3%) | 122 (8.3%) |
| $75,000 to $99,999 | 178 (10.7%) | 98 (6.7%) |
| $100,000+ | 432 (25.9%) | 82 (5.6%) |
| Total | 1,670 (100.0%) | 1,464 (100.0%) |
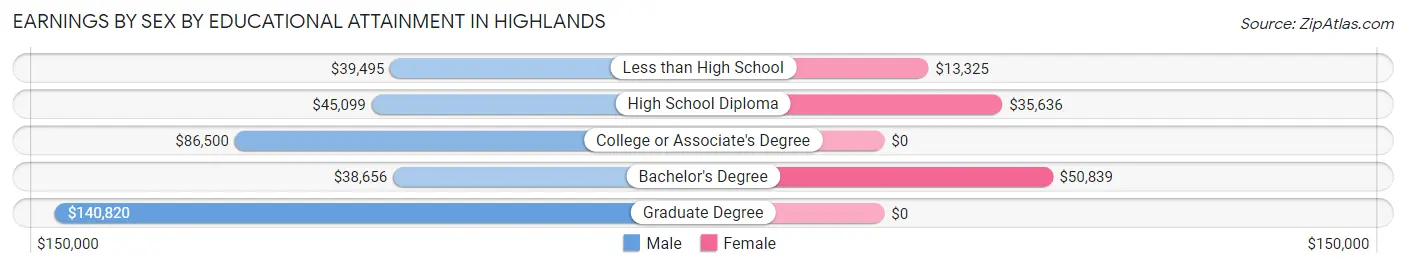
Earnings by Sex by Educational Attainment in Highlands
Average earnings in Highlands are $51,557 for men and $36,230 for women, a difference of 29.7%. Men with an educational attainment of graduate degree enjoy the highest average annual earnings of $140,820, while those with bachelor's degree education earn the least with $38,656. Women with an educational attainment of bachelor's degree earn the most with the average annual earnings of $50,839, while those with less than high school education have the smallest earnings of $13,325.
| Educational Attainment | Male Income | Female Income |
| Less than High School | $39,495 | $13,325 |
| High School Diploma | $45,099 | $35,636 |
| College or Associate's Degree | $86,500 | $0 |
| Bachelor's Degree | $38,656 | $50,839 |
| Graduate Degree | $140,820 | $0 |
| Total | $51,557 | $36,230 |
Family Income in Highlands
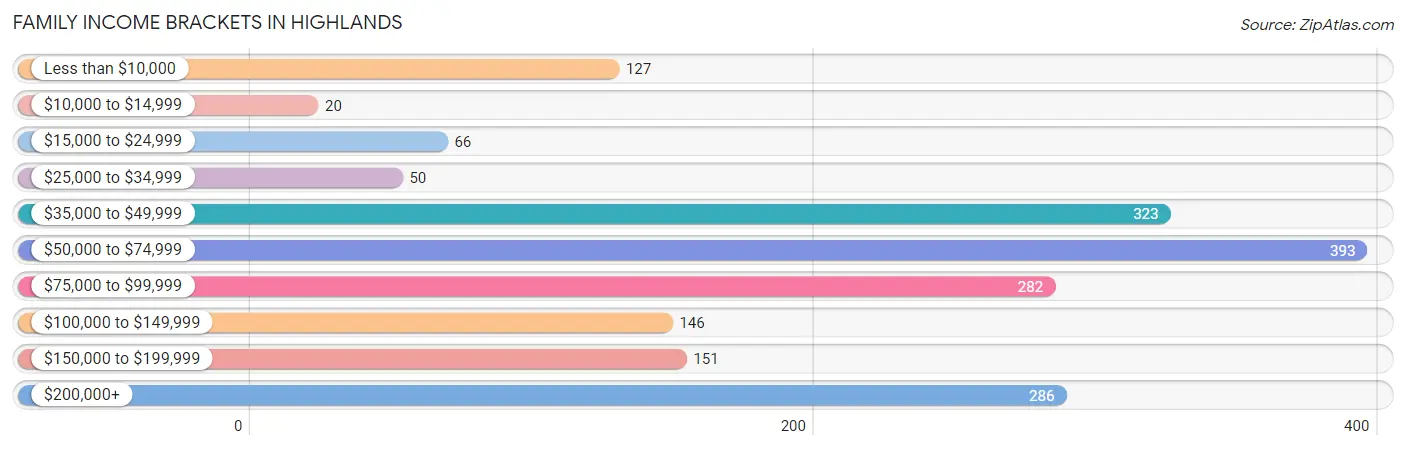
Family Income Brackets in Highlands
According to the Highlands family income data, there are 393 families falling into the $50,000 to $74,999 income range, which is the most common income bracket and makes up 21.3% of all families. Conversely, the $10,000 to $14,999 income bracket is the least frequent group with only 20 families (1.1%) belonging to this category.
| Income Bracket | # Families | % Families |
| Less than $10,000 | 127 | 6.9% |
| $10,000 to $14,999 | 20 | 1.1% |
| $15,000 to $24,999 | 66 | 3.6% |
| $25,000 to $34,999 | 50 | 2.7% |
| $35,000 to $49,999 | 323 | 17.5% |
| $50,000 to $74,999 | 393 | 21.3% |
| $75,000 to $99,999 | 282 | 15.3% |
| $100,000 to $149,999 | 146 | 7.9% |
| $150,000 to $199,999 | 151 | 8.2% |
| $200,000+ | 286 | 15.5% |
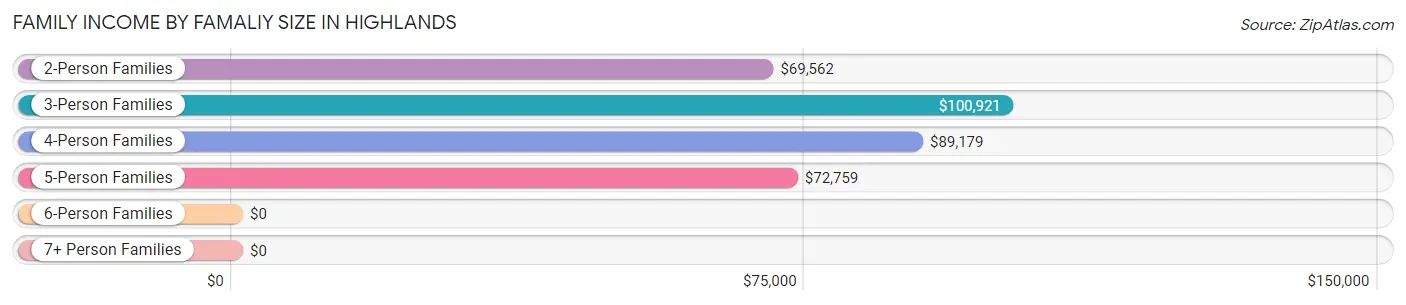
Family Income by Famaliy Size in Highlands
3-person families (294 | 15.9%) account for the highest median family income in Highlands with $100,921 per family, while 2-person families (912 | 49.4%) have the highest median income of $34,781 per family member.
| Income Bracket | # Families | Median Income |
| 2-Person Families | 912 (49.4%) | $69,562 |
| 3-Person Families | 294 (15.9%) | $100,921 |
| 4-Person Families | 376 (20.4%) | $89,179 |
| 5-Person Families | 138 (7.5%) | $72,759 |
| 6-Person Families | 67 (3.6%) | $0 |
| 7+ Person Families | 59 (3.2%) | $0 |
| Total | 1,846 (100.0%) | $72,738 |
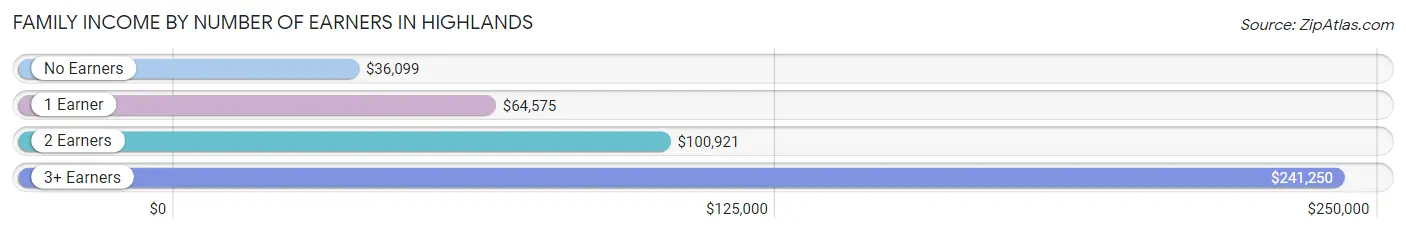
Family Income by Number of Earners in Highlands
The median family income in Highlands is $72,738, with families comprising 3+ earners (180) having the highest median family income of $241,250, while families with no earners (306) have the lowest median family income of $36,099, accounting for 9.8% and 16.6% of families, respectively.
| Number of Earners | # Families | Median Income |
| No Earners | 306 (16.6%) | $36,099 |
| 1 Earner | 774 (41.9%) | $64,575 |
| 2 Earners | 586 (31.7%) | $100,921 |
| 3+ Earners | 180 (9.8%) | $241,250 |
| Total | 1,846 (100.0%) | $72,738 |
Household Income in Highlands
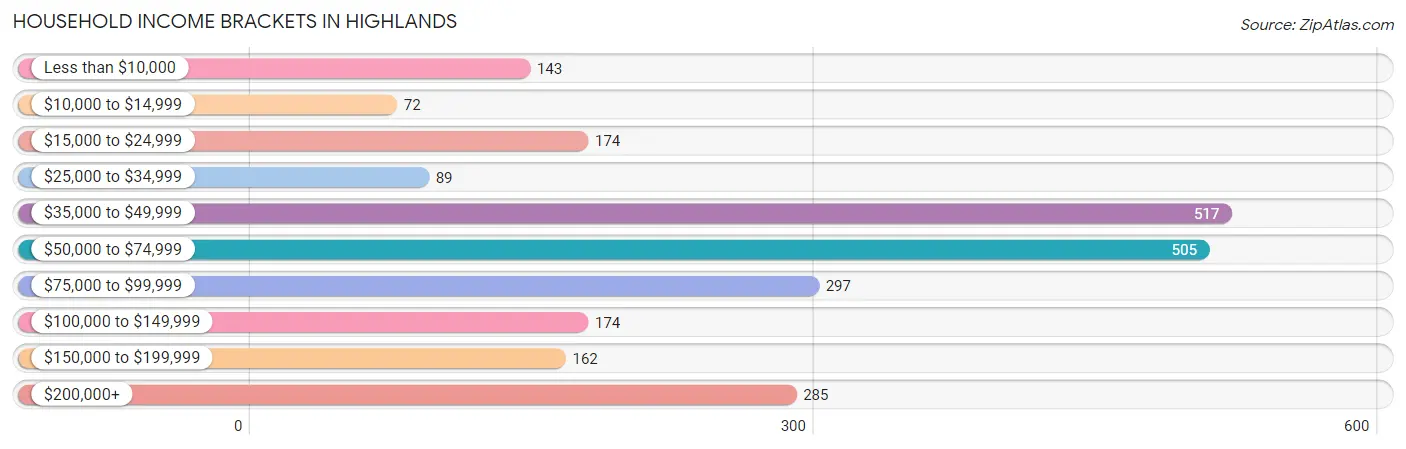
Household Income Brackets in Highlands
With 517 households falling in the category, the $35,000 to $49,999 income range is the most frequent in Highlands, accounting for 21.4% of all households. In contrast, only 72 households (3.0%) fall into the $10,000 to $14,999 income bracket, making it the least populous group.
| Income Bracket | # Households | % Households |
| Less than $10,000 | 143 | 5.9% |
| $10,000 to $14,999 | 72 | 3.0% |
| $15,000 to $24,999 | 174 | 7.2% |
| $25,000 to $34,999 | 89 | 3.7% |
| $35,000 to $49,999 | 517 | 21.4% |
| $50,000 to $74,999 | 505 | 20.9% |
| $75,000 to $99,999 | 297 | 12.3% |
| $100,000 to $149,999 | 174 | 7.2% |
| $150,000 to $199,999 | 162 | 6.7% |
| $200,000+ | 285 | 11.8% |
Household Income by Householder Age in Highlands
The median household income in Highlands is $64,343, with the highest median household income of $69,321 found in the 45 to 64 years age bracket for the primary householder. A total of 889 households (36.8%) fall into this category. Meanwhile, the 15 to 24 years age bracket for the primary householder has the lowest median household income of $7,455, with 108 households (4.5%) in this group.
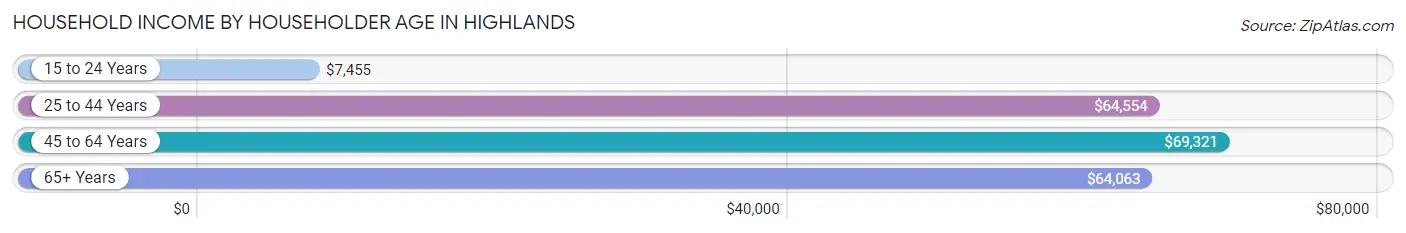
| Income Bracket | # Households | Median Income |
| 15 to 24 Years | 108 (4.5%) | $7,455 |
| 25 to 44 Years | 657 (27.2%) | $64,554 |
| 45 to 64 Years | 889 (36.8%) | $69,321 |
| 65+ Years | 762 (31.5%) | $64,063 |
| Total | 2,416 (100.0%) | $64,343 |
Poverty in Highlands
Income Below Poverty by Sex and Age in Highlands
With 12.9% poverty level for males and 17.4% for females among the residents of Highlands, under 5 year old males and 6 to 11 year old females are the most vulnerable to poverty, with 225 males (63.7%) and 99 females (52.9%) in their respective age groups living below the poverty level.
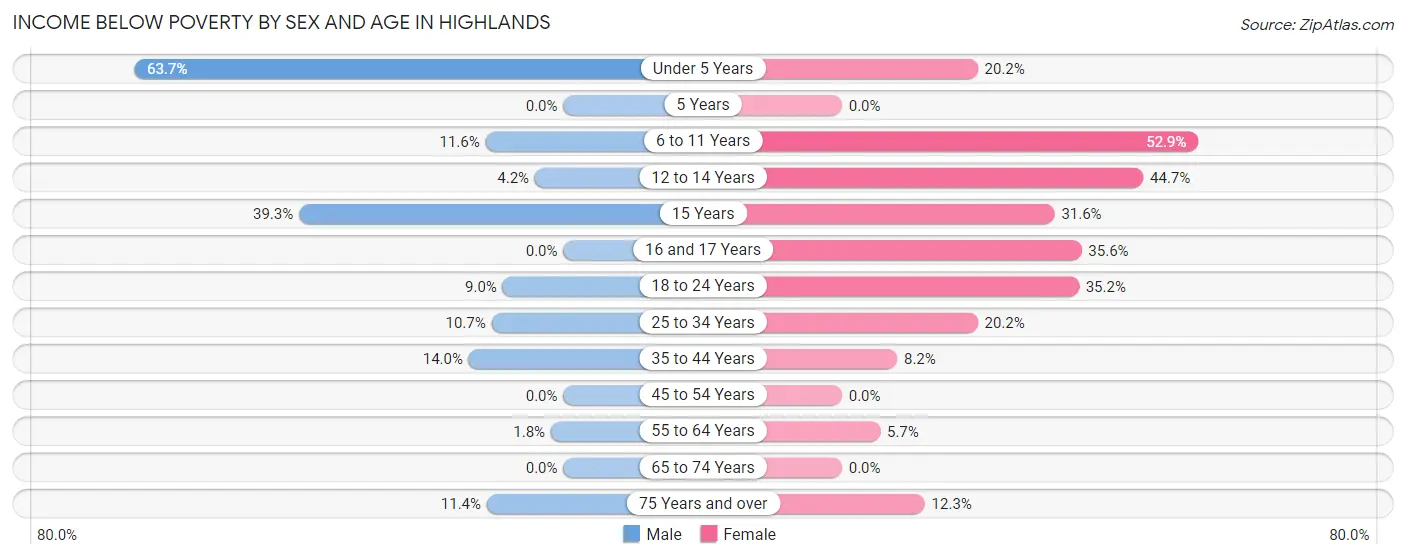
| Age Bracket | Male | Female |
| Under 5 Years | 225 (63.7%) | 93 (20.2%) |
| 5 Years | 0 (0.0%) | 0 (0.0%) |
| 6 to 11 Years | 35 (11.6%) | 99 (52.9%) |
| 12 to 14 Years | 7 (4.2%) | 68 (44.7%) |
| 15 Years | 42 (39.3%) | 12 (31.6%) |
| 16 and 17 Years | 0 (0.0%) | 37 (35.6%) |
| 18 to 24 Years | 21 (9.0%) | 146 (35.2%) |
| 25 to 34 Years | 47 (10.7%) | 123 (20.2%) |
| 35 to 44 Years | 66 (14.0%) | 26 (8.2%) |
| 45 to 54 Years | 0 (0.0%) | 0 (0.0%) |
| 55 to 64 Years | 8 (1.8%) | 29 (5.7%) |
| 65 to 74 Years | 0 (0.0%) | 0 (0.0%) |
| 75 Years and over | 15 (11.4%) | 15 (12.3%) |
| Total | 466 (12.9%) | 648 (17.4%) |
Income Above Poverty by Sex and Age in Highlands
According to the poverty statistics in Highlands, males aged 5 years and females aged 45 to 54 years are the age groups that are most secure financially, with 100.0% of males and 100.0% of females in these age groups living above the poverty line.
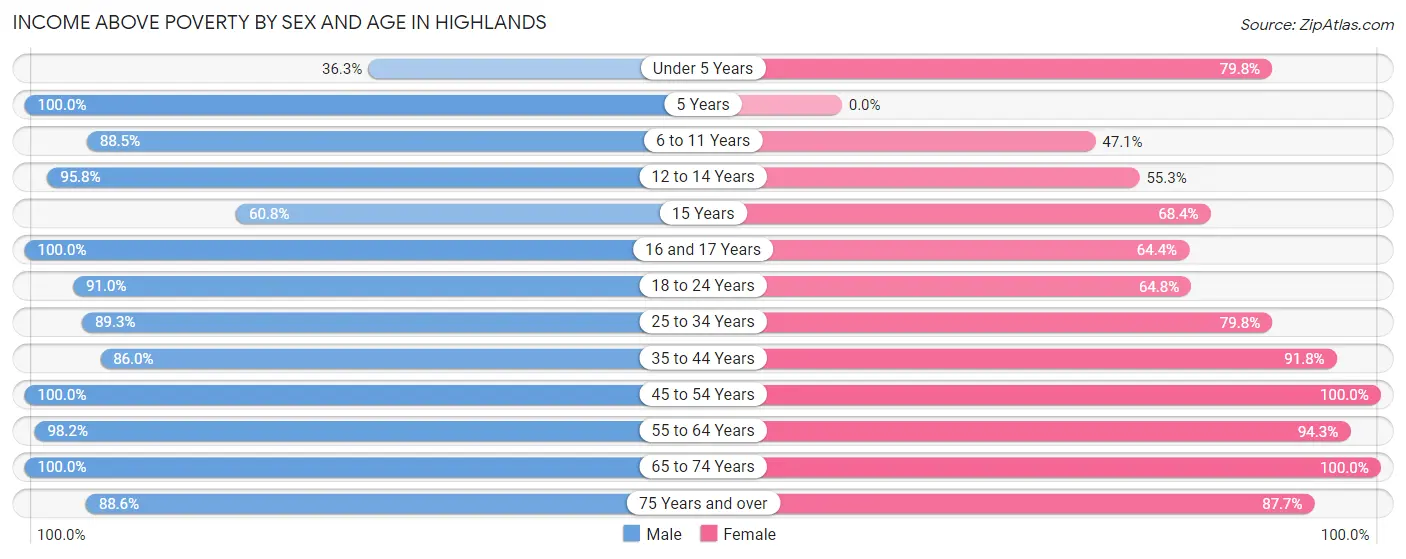
| Age Bracket | Male | Female |
| Under 5 Years | 128 (36.3%) | 368 (79.8%) |
| 5 Years | 114 (100.0%) | 0 (0.0%) |
| 6 to 11 Years | 268 (88.4%) | 88 (47.1%) |
| 12 to 14 Years | 159 (95.8%) | 84 (55.3%) |
| 15 Years | 65 (60.8%) | 26 (68.4%) |
| 16 and 17 Years | 47 (100.0%) | 67 (64.4%) |
| 18 to 24 Years | 212 (91.0%) | 269 (64.8%) |
| 25 to 34 Years | 394 (89.3%) | 487 (79.8%) |
| 35 to 44 Years | 404 (86.0%) | 291 (91.8%) |
| 45 to 54 Years | 257 (100.0%) | 358 (100.0%) |
| 55 to 64 Years | 427 (98.2%) | 482 (94.3%) |
| 65 to 74 Years | 561 (100.0%) | 442 (100.0%) |
| 75 Years and over | 117 (88.6%) | 107 (87.7%) |
| Total | 3,153 (87.1%) | 3,069 (82.6%) |
Income Below Poverty Among Married-Couple Families in Highlands
The poverty statistics for married-couple families in Highlands show that 4.6% or 67 of the total 1,447 families live below the poverty line. Families with 5 or more children have the highest poverty rate of 100.0%, comprising of 31 families. On the other hand, families with no children have the lowest poverty rate of 0.0%, which includes 0 families.
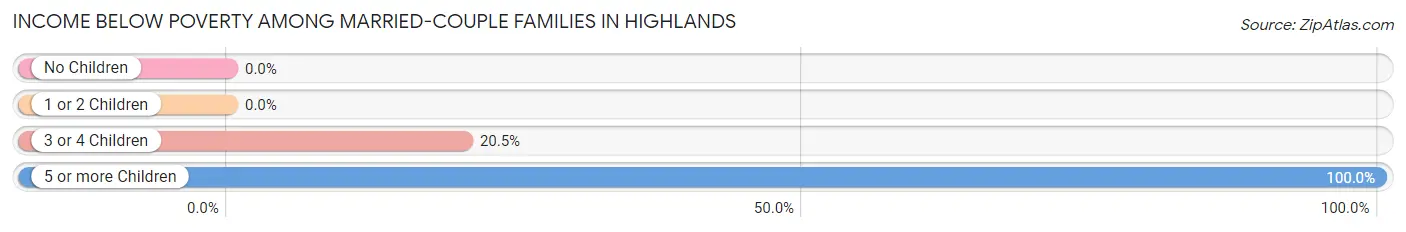
| Children | Above Poverty | Below Poverty |
| No Children | 925 (100.0%) | 0 (0.0%) |
| 1 or 2 Children | 315 (100.0%) | 0 (0.0%) |
| 3 or 4 Children | 140 (79.5%) | 36 (20.4%) |
| 5 or more Children | 0 (0.0%) | 31 (100.0%) |
| Total | 1,380 (95.4%) | 67 (4.6%) |
Income Below Poverty Among Single-Parent Households in Highlands
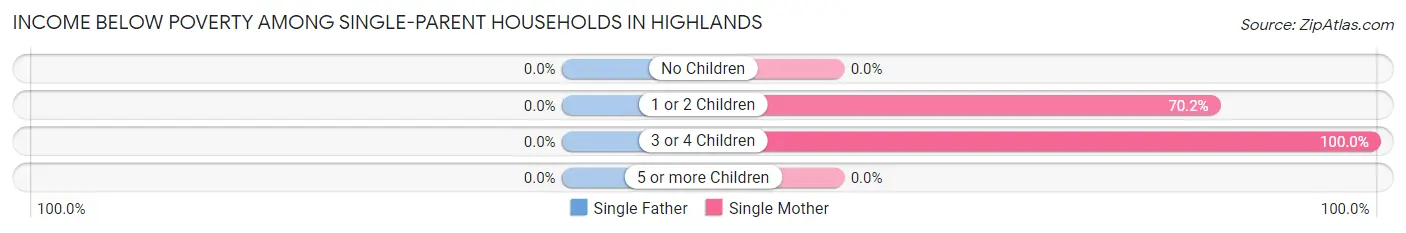
| Children | Single Father | Single Mother |
| No Children | 0 (0.0%) | 0 (0.0%) |
| 1 or 2 Children | 0 (0.0%) | 127 (70.2%) |
| 3 or 4 Children | 0 (0.0%) | 11 (100.0%) |
| 5 or more Children | 0 (0.0%) | 0 (0.0%) |
| Total | 0 (0.0%) | 138 (61.1%) |
Income Below Poverty Among Married-Couple vs Single-Parent Households in Highlands
The poverty data for Highlands shows that 67 of the married-couple family households (4.6%) and 138 of the single-parent households (34.6%) are living below the poverty level. Within the married-couple family households, those with 5 or more children have the highest poverty rate, with 31 households (100.0%) falling below the poverty line. Among the single-parent households, those with 3 or 4 children have the highest poverty rate, with 11 household (100.0%) living below poverty.
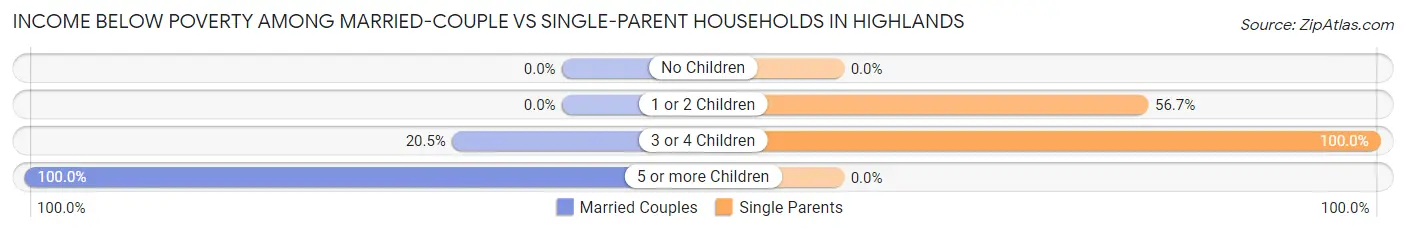
| Children | Married-Couple Families | Single-Parent Households |
| No Children | 0 (0.0%) | 0 (0.0%) |
| 1 or 2 Children | 0 (0.0%) | 127 (56.7%) |
| 3 or 4 Children | 36 (20.4%) | 11 (100.0%) |
| 5 or more Children | 31 (100.0%) | 0 (0.0%) |
| Total | 67 (4.6%) | 138 (34.6%) |
Race in Highlands
The most populous races in Highlands are White / Caucasian (5,558 | 75.5%), Hispanic or Latino (2,854 | 38.8%), and Two or more Races (909 | 12.3%).
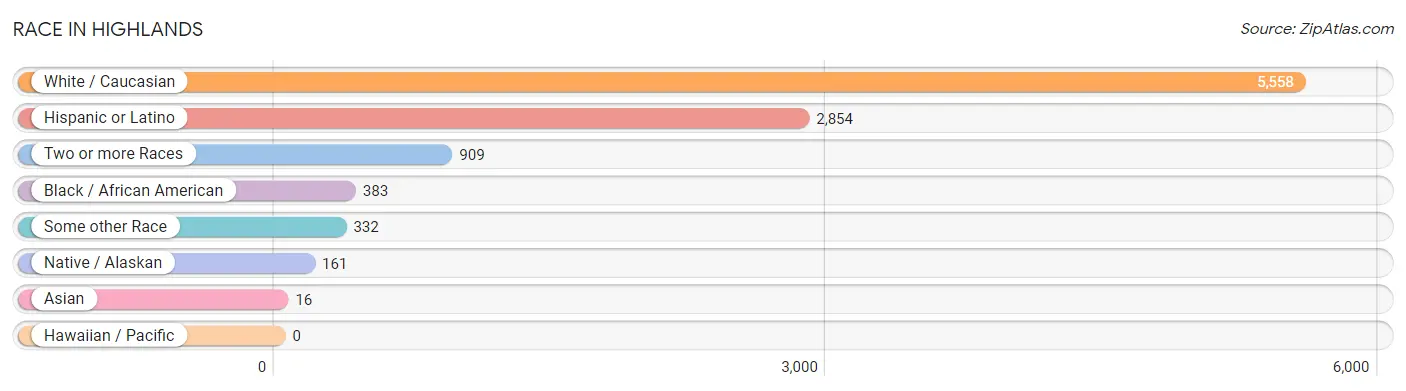
| Race | # Population | % Population |
| Asian | 16 | 0.2% |
| Black / African American | 383 | 5.2% |
| Hawaiian / Pacific | 0 | 0.0% |
| Hispanic or Latino | 2,854 | 38.8% |
| Native / Alaskan | 161 | 2.2% |
| White / Caucasian | 5,558 | 75.5% |
| Two or more Races | 909 | 12.3% |
| Some other Race | 332 | 4.5% |
| Total | 7,359 | 100.0% |
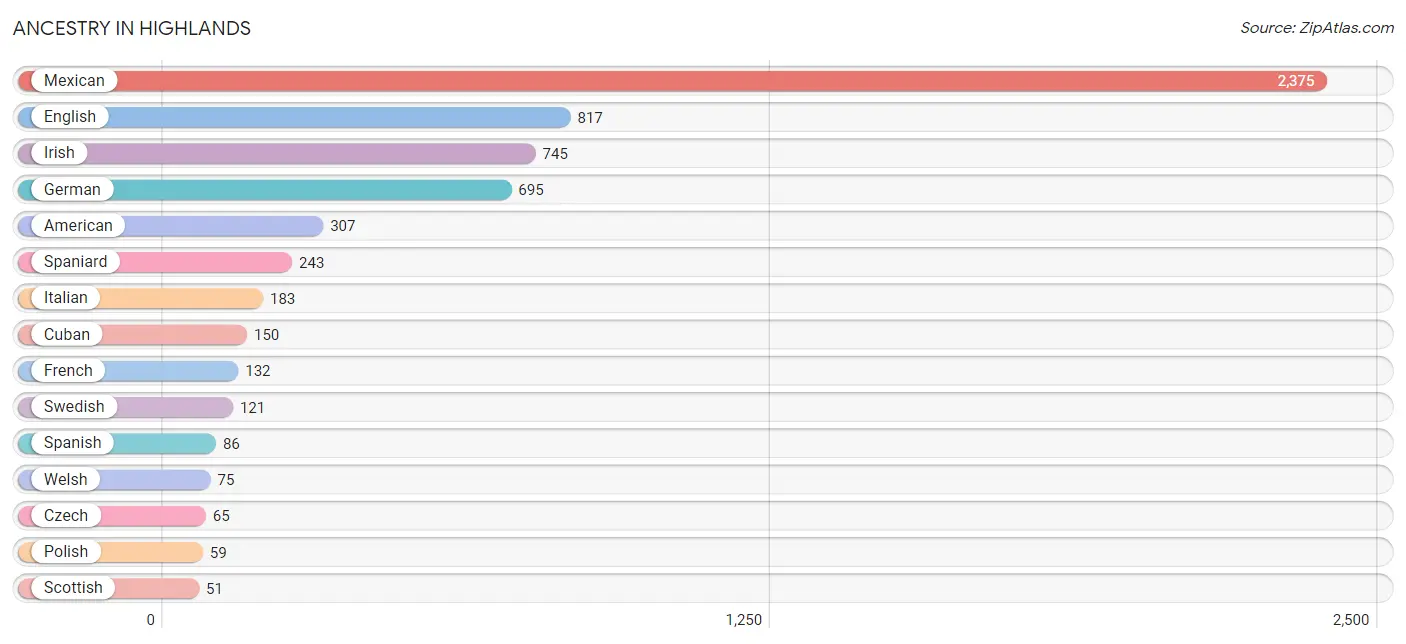
Ancestry in Highlands
The most populous ancestries reported in Highlands are Mexican (2,375 | 32.3%), English (817 | 11.1%), Irish (745 | 10.1%), German (695 | 9.4%), and American (307 | 4.2%), together accounting for 67.1% of all Highlands residents.
| Ancestry | # Population | % Population |
| American | 307 | 4.2% |
| Armenian | 12 | 0.2% |
| Belizean | 20 | 0.3% |
| British | 47 | 0.6% |
| Cuban | 150 | 2.0% |
| Czech | 65 | 0.9% |
| Dutch | 31 | 0.4% |
| English | 817 | 11.1% |
| European | 33 | 0.4% |
| French | 132 | 1.8% |
| German | 695 | 9.4% |
| Indian (Asian) | 16 | 0.2% |
| Irish | 745 | 10.1% |
| Italian | 183 | 2.5% |
| Mexican | 2,375 | 32.3% |
| Polish | 59 | 0.8% |
| Portuguese | 16 | 0.2% |
| Scandinavian | 16 | 0.2% |
| Scotch-Irish | 29 | 0.4% |
| Scottish | 51 | 0.7% |
| Spaniard | 243 | 3.3% |
| Spanish | 86 | 1.2% |
| Swedish | 121 | 1.6% |
| Welsh | 75 | 1.0% | View All 24 Rows |
Immigrants in Highlands
The most numerous immigrant groups reported in Highlands came from Latin America (1,147 | 15.6%), Central America (864 | 11.7%), Mexico (864 | 11.7%), Caribbean (175 | 2.4%), and Cuba (150 | 2.0%), together accounting for 43.5% of all Highlands residents.
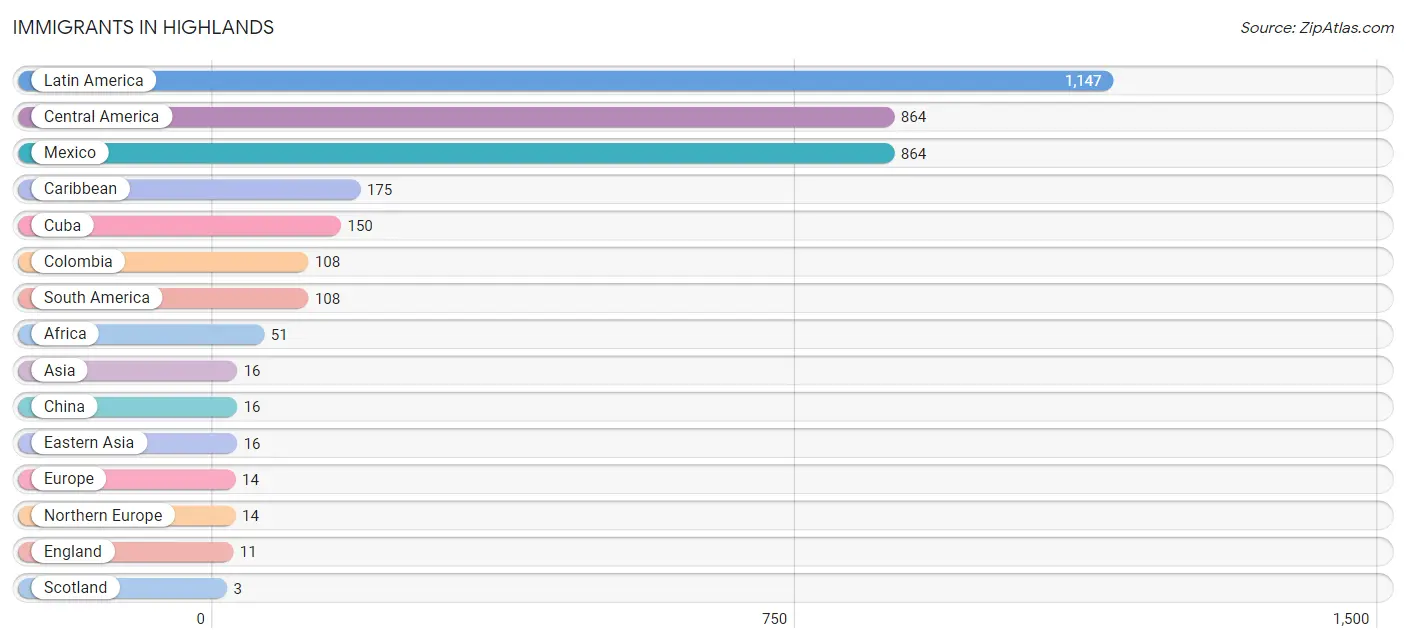
| Immigration Origin | # Population | % Population |
| Africa | 51 | 0.7% |
| Asia | 16 | 0.2% |
| Caribbean | 175 | 2.4% |
| Central America | 864 | 11.7% |
| China | 16 | 0.2% |
| Colombia | 108 | 1.5% |
| Cuba | 150 | 2.0% |
| Eastern Asia | 16 | 0.2% |
| England | 11 | 0.2% |
| Europe | 14 | 0.2% |
| Latin America | 1,147 | 15.6% |
| Mexico | 864 | 11.7% |
| Northern Europe | 14 | 0.2% |
| Scotland | 3 | 0.0% |
| South America | 108 | 1.5% | View All 15 Rows |
Sex and Age in Highlands
Sex and Age in Highlands
The most populous age groups in Highlands are 10 to 14 Years (413 | 11.4%) for men and Under 5 Years (461 | 12.4%) for women.
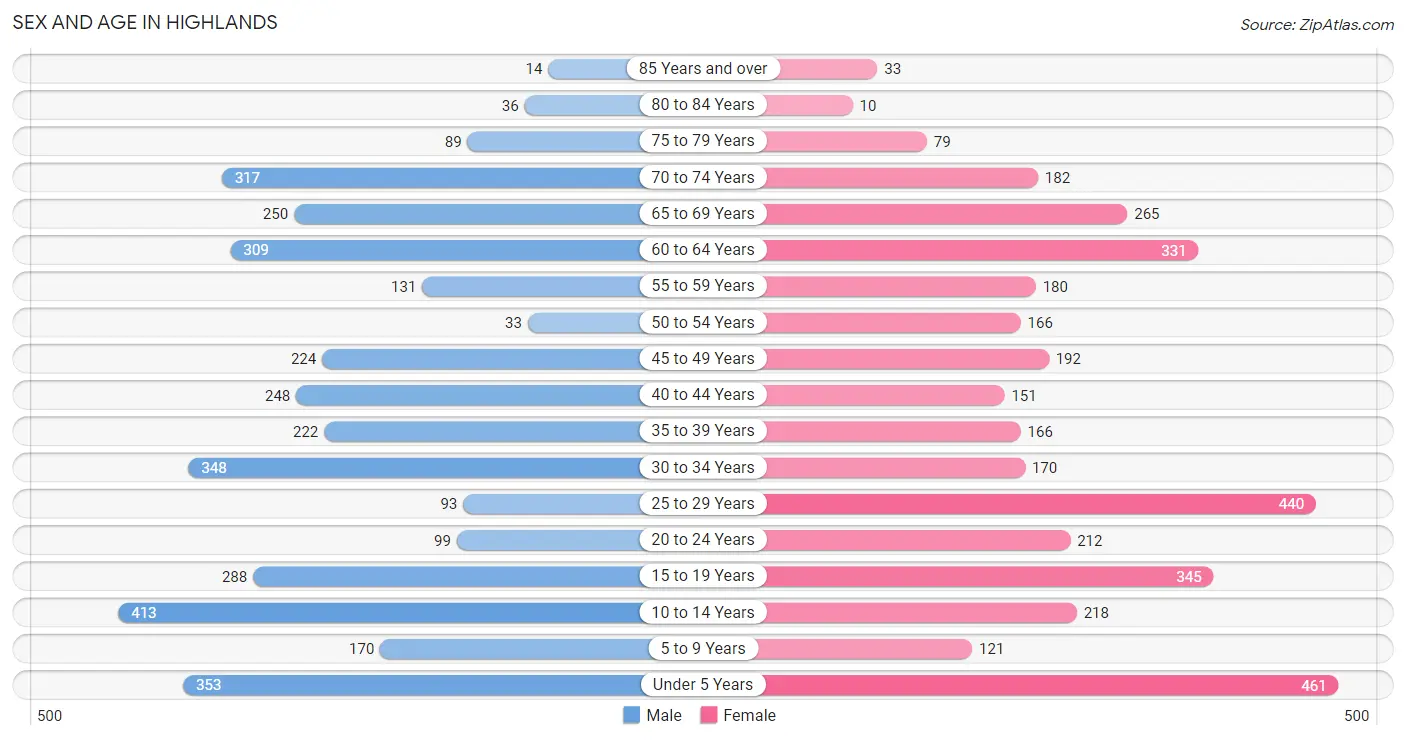
| Age Bracket | Male | Female |
| Under 5 Years | 353 (9.7%) | 461 (12.4%) |
| 5 to 9 Years | 170 (4.7%) | 121 (3.3%) |
| 10 to 14 Years | 413 (11.4%) | 218 (5.9%) |
| 15 to 19 Years | 288 (7.9%) | 345 (9.3%) |
| 20 to 24 Years | 99 (2.7%) | 212 (5.7%) |
| 25 to 29 Years | 93 (2.6%) | 440 (11.8%) |
| 30 to 34 Years | 348 (9.6%) | 170 (4.6%) |
| 35 to 39 Years | 222 (6.1%) | 166 (4.5%) |
| 40 to 44 Years | 248 (6.8%) | 151 (4.1%) |
| 45 to 49 Years | 224 (6.2%) | 192 (5.2%) |
| 50 to 54 Years | 33 (0.9%) | 166 (4.5%) |
| 55 to 59 Years | 131 (3.6%) | 180 (4.8%) |
| 60 to 64 Years | 309 (8.5%) | 331 (8.9%) |
| 65 to 69 Years | 250 (6.9%) | 265 (7.1%) |
| 70 to 74 Years | 317 (8.7%) | 182 (4.9%) |
| 75 to 79 Years | 89 (2.5%) | 79 (2.1%) |
| 80 to 84 Years | 36 (1.0%) | 10 (0.3%) |
| 85 Years and over | 14 (0.4%) | 33 (0.9%) |
| Total | 3,637 (100.0%) | 3,722 (100.0%) |
Families and Households in Highlands
Median Family Size in Highlands
The median family size in Highlands is 3.56 persons per family, with married-couple families (1,447 | 78.4%) accounting for the largest median family size of 3.66 persons per family. On the other hand, single female/mother families (226 | 12.2%) represent the smallest median family size with 2.97 persons per family.
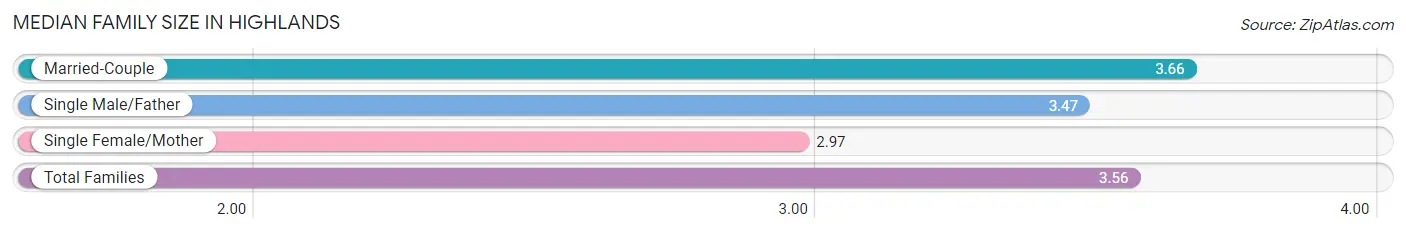
| Family Type | # Families | Family Size |
| Married-Couple | 1,447 (78.4%) | 3.66 |
| Single Male/Father | 173 (9.4%) | 3.47 |
| Single Female/Mother | 226 (12.2%) | 2.97 |
| Total Families | 1,846 (100.0%) | 3.56 |
Median Household Size in Highlands
The median household size in Highlands is 3.04 persons per household, with married-couple households (1,447 | 59.9%) accounting for the largest median household size of 3.66 persons per household. non-family households (570 | 23.6%) represent the smallest median household size with 1.15 persons per household.
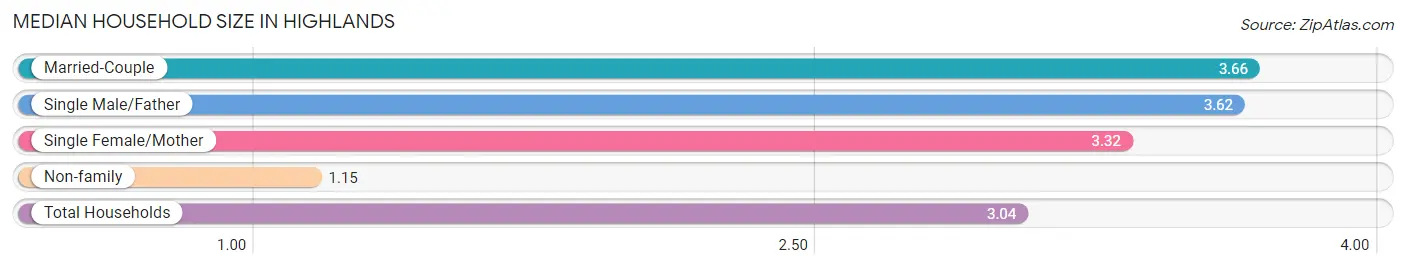
| Household Type | # Households | Household Size |
| Married-Couple | 1,447 (59.9%) | 3.66 |
| Single Male/Father | 173 (7.2%) | 3.62 |
| Single Female/Mother | 226 (9.3%) | 3.32 |
| Non-family | 570 (23.6%) | 1.15 |
| Total Households | 2,416 (100.0%) | 3.04 |
Household Size by Marriage Status in Highlands
Out of a total of 2,416 households in Highlands, 1,846 (76.4%) are family households, while 570 (23.6%) are nonfamily households. The most numerous type of family households are 2-person households, comprising 900, and the most common type of nonfamily households are 1-person households, comprising 503.
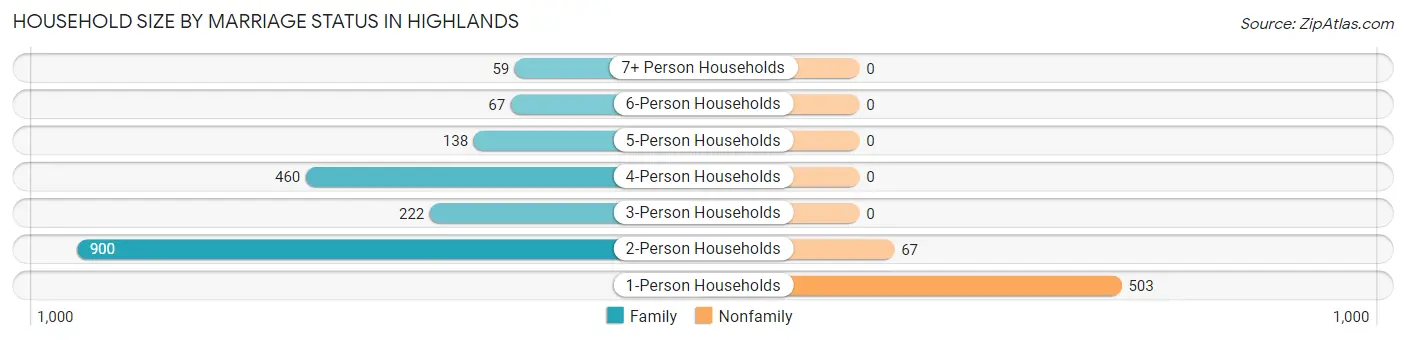
| Household Size | Family Households | Nonfamily Households |
| 1-Person Households | - | 503 (20.8%) |
| 2-Person Households | 900 (37.2%) | 67 (2.8%) |
| 3-Person Households | 222 (9.2%) | 0 (0.0%) |
| 4-Person Households | 460 (19.0%) | 0 (0.0%) |
| 5-Person Households | 138 (5.7%) | 0 (0.0%) |
| 6-Person Households | 67 (2.8%) | 0 (0.0%) |
| 7+ Person Households | 59 (2.4%) | 0 (0.0%) |
| Total | 1,846 (76.4%) | 570 (23.6%) |
Female Fertility in Highlands
Fertility by Age in Highlands
Average fertility rate in Highlands is 121.0 births per 1,000 women. Women in the age bracket of 20 to 34 years have the highest fertility rate with 223.0 births per 1,000 women. Women in the age bracket of 20 to 34 years acount for 90.6% of all women with births.
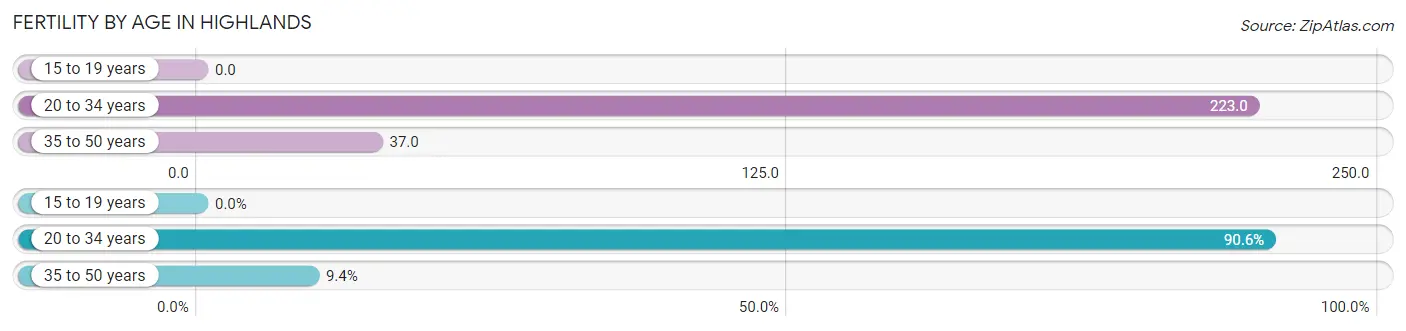
| Age Bracket | Women with Births | Births / 1,000 Women |
| 15 to 19 years | 0 (0.0%) | 0.0 |
| 20 to 34 years | 183 (90.6%) | 223.0 |
| 35 to 50 years | 19 (9.4%) | 37.0 |
| Total | 202 (100.0%) | 121.0 |
Fertility by Age by Marriage Status in Highlands
94.6% of women with births (202) in Highlands are married. The highest percentage of unmarried women with births falls into 35 to 50 years age bracket with 57.9% of them unmarried at the time of birth, while the lowest percentage of unmarried women with births belong to 20 to 34 years age bracket with 0.0% of them unmarried.
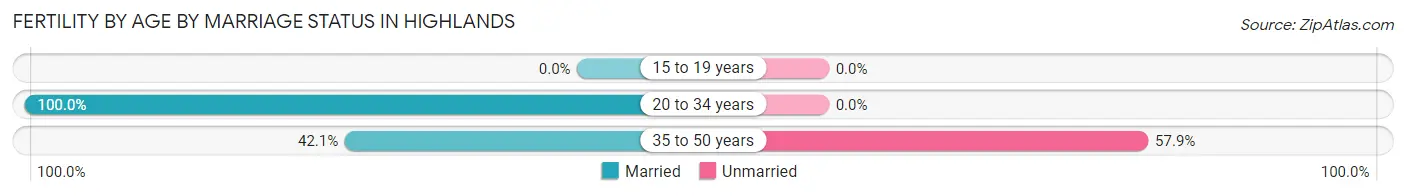
| Age Bracket | Married | Unmarried |
| 15 to 19 years | 0 (0.0%) | 0 (0.0%) |
| 20 to 34 years | 183 (100.0%) | 0 (0.0%) |
| 35 to 50 years | 8 (42.1%) | 11 (57.9%) |
| Total | 191 (94.6%) | 11 (5.4%) |
Fertility by Education in Highlands
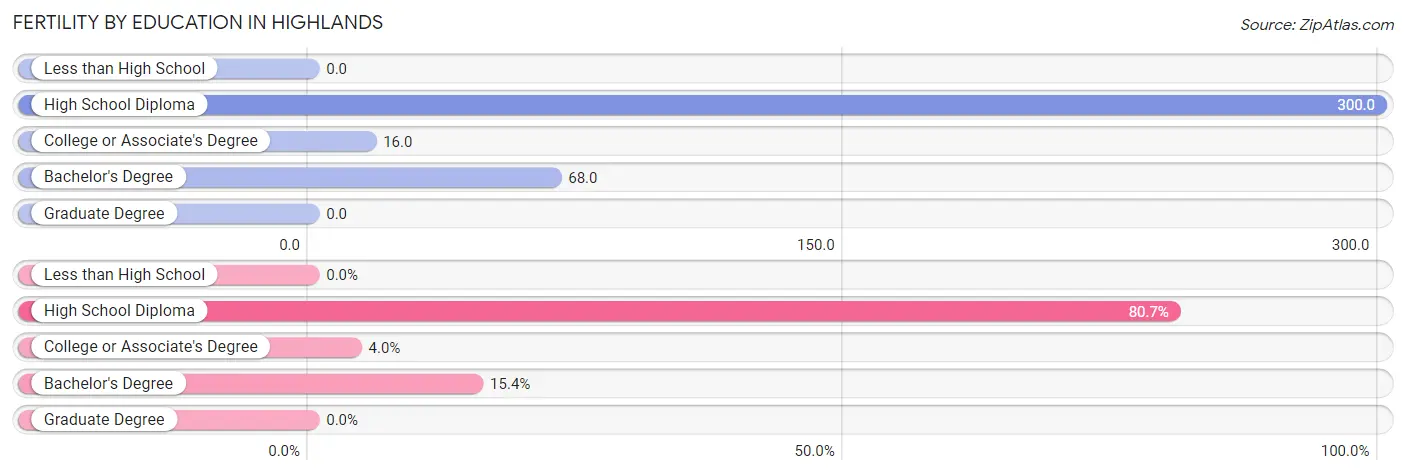
| Educational Attainment | Women with Births | Births / 1,000 Women |
| Less than High School | 0 (0.0%) | 0.0 |
| High School Diploma | 163 (80.7%) | 300.0 |
| College or Associate's Degree | 8 (4.0%) | 16.0 |
| Bachelor's Degree | 31 (15.3%) | 68.0 |
| Graduate Degree | 0 (0.0%) | 0.0 |
| Total | 202 (100.0%) | 121.0 |
Fertility by Education by Marriage Status in Highlands
5.4% of women with births in Highlands are unmarried. Women with the educational attainment of college or associate's degree are most likely to be married with 100.0% of them married at childbirth, while women with the educational attainment of high school diploma are least likely to be married with 6.8% of them unmarried at childbirth.
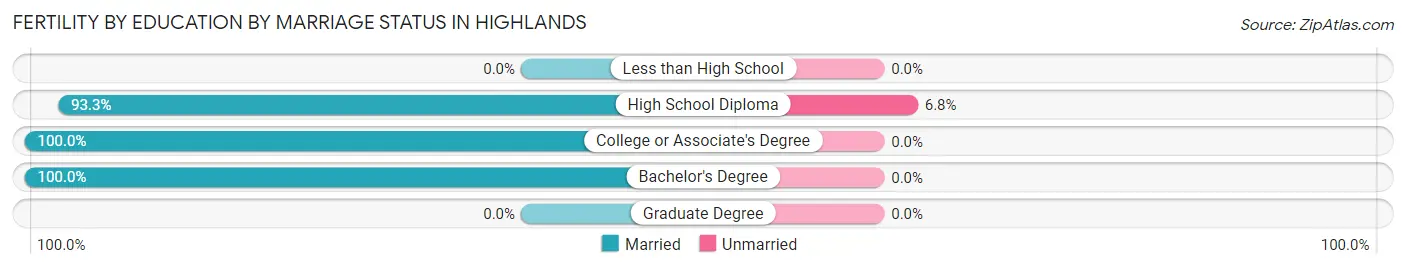
| Educational Attainment | Married | Unmarried |
| Less than High School | 0 (0.0%) | 0 (0.0%) |
| High School Diploma | 152 (93.2%) | 11 (6.8%) |
| College or Associate's Degree | 8 (100.0%) | 0 (0.0%) |
| Bachelor's Degree | 31 (100.0%) | 0 (0.0%) |
| Graduate Degree | 0 (0.0%) | 0 (0.0%) |
| Total | 191 (94.6%) | 11 (5.4%) |
Employment Characteristics in Highlands
Employment by Class of Employer in Highlands
Among the 2,652 employed individuals in Highlands, private company employees (1,810 | 68.2%), not-for-profit organizations (250 | 9.4%), and local government employees (197 | 7.4%) make up the most common classes of employment.
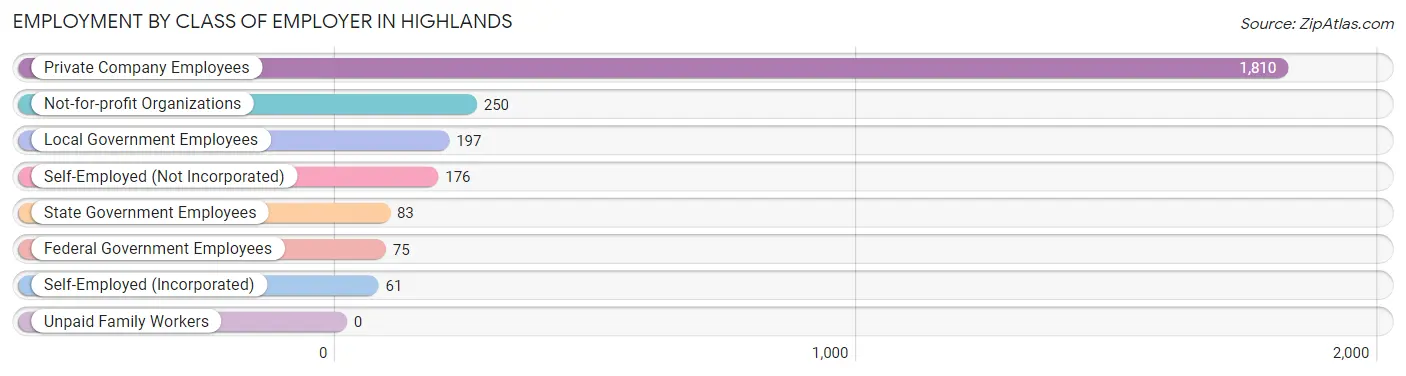
| Employer Class | # Employees | % Employees |
| Private Company Employees | 1,810 | 68.2% |
| Self-Employed (Incorporated) | 61 | 2.3% |
| Self-Employed (Not Incorporated) | 176 | 6.6% |
| Not-for-profit Organizations | 250 | 9.4% |
| Local Government Employees | 197 | 7.4% |
| State Government Employees | 83 | 3.1% |
| Federal Government Employees | 75 | 2.8% |
| Unpaid Family Workers | 0 | 0.0% |
| Total | 2,652 | 100.0% |
Employment Status by Age in Highlands
According to the labor force statistics for Highlands, out of the total population over 16 years of age (5,478), 57.0% or 3,122 individuals are in the labor force, with 8.0% or 250 of them unemployed. The age group with the highest labor force participation rate is 55 to 59 years, with 93.2% or 290 individuals in the labor force. Within the labor force, the 20 to 24 years age range has the highest percentage of unemployed individuals, with 30.1% or 80 of them being unemployed.
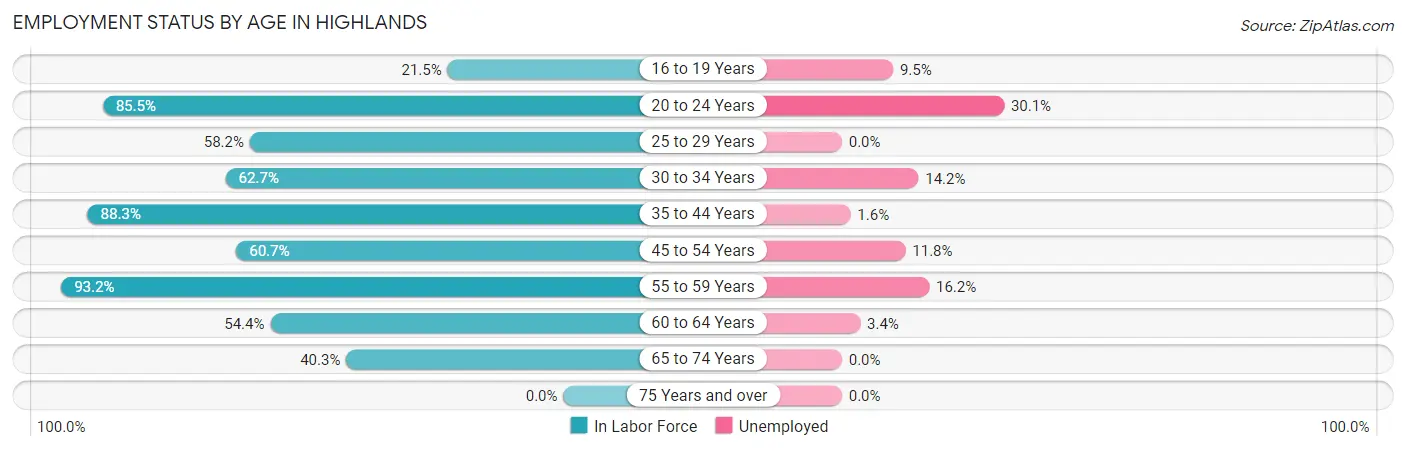
| Age Bracket | In Labor Force | Unemployed |
| 16 to 19 Years | 105 (21.5%) | 10 (9.5%) |
| 20 to 24 Years | 266 (85.5%) | 80 (30.1%) |
| 25 to 29 Years | 310 (58.2%) | 0 (0.0%) |
| 30 to 34 Years | 325 (62.7%) | 46 (14.2%) |
| 35 to 44 Years | 695 (88.3%) | 11 (1.6%) |
| 45 to 54 Years | 373 (60.7%) | 44 (11.8%) |
| 55 to 59 Years | 290 (93.2%) | 47 (16.2%) |
| 60 to 64 Years | 348 (54.4%) | 12 (3.4%) |
| 65 to 74 Years | 409 (40.3%) | 0 (0.0%) |
| 75 Years and over | 0 (0.0%) | 0 (0.0%) |
| Total | 3,122 (57.0%) | 250 (8.0%) |
Employment Status by Educational Attainment in Highlands
According to labor force statistics for Highlands, 68.8% of individuals (2,342) out of the total population between 25 and 64 years of age (3,404) are in the labor force, with 6.8% or 159 of them being unemployed. The group with the highest labor force participation rate are those with the educational attainment of bachelor's degree or higher, with 77.9% or 447 individuals in the labor force. Within the labor force, individuals with college / associate degree education have the highest percentage of unemployment, with 11.6% or 102 of them being unemployed.
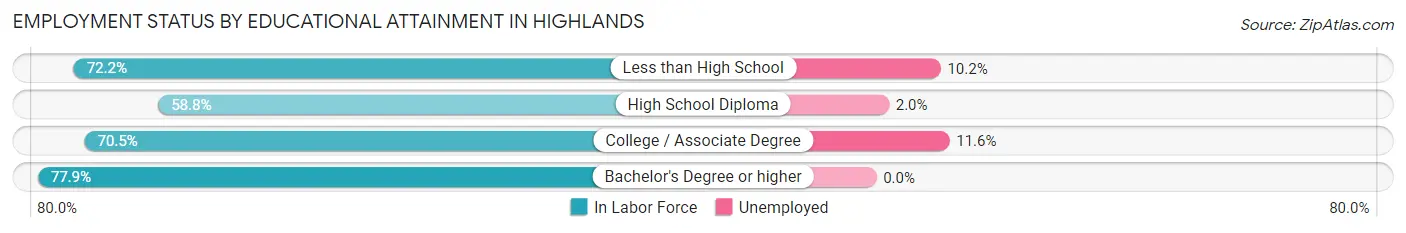
| Educational Attainment | In Labor Force | Unemployed |
| Less than High School | 459 (72.2%) | 65 (10.2%) |
| High School Diploma | 559 (58.8%) | 19 (2.0%) |
| College / Associate Degree | 876 (70.5%) | 144 (11.6%) |
| Bachelor's Degree or higher | 447 (77.9%) | 0 (0.0%) |
| Total | 2,342 (68.8%) | 231 (6.8%) |
Employment Occupations by Sex in Highlands
Management, Business, Science and Arts Occupations
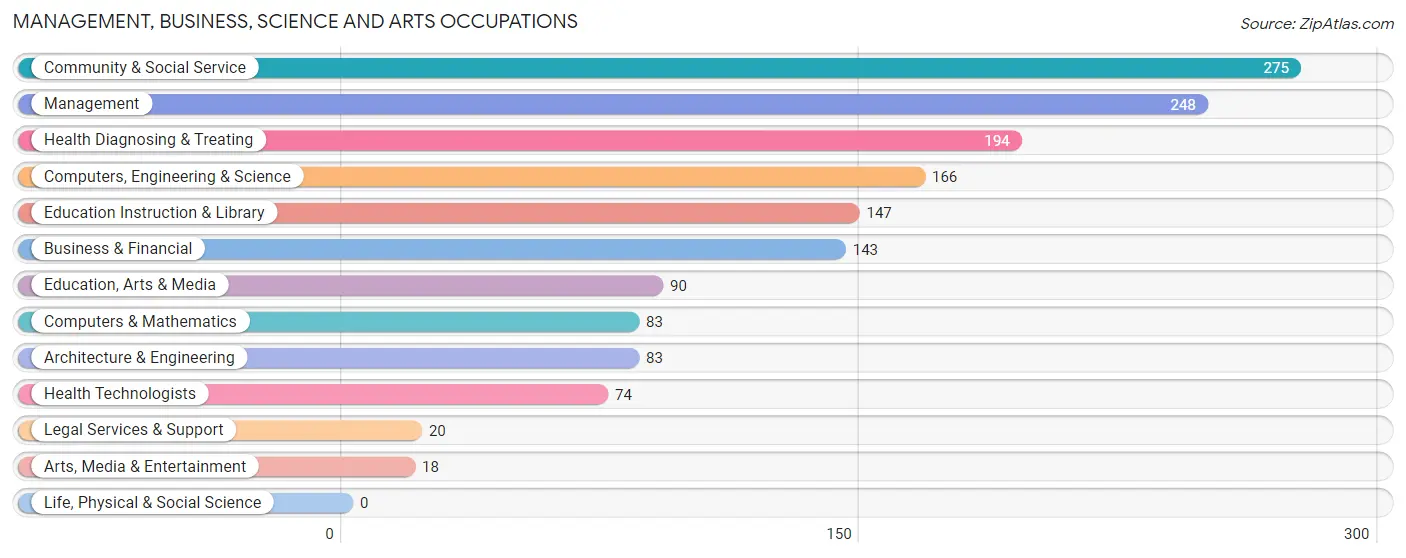
The most common Management, Business, Science and Arts occupations in Highlands are Community & Social Service (275 | 9.6%), Management (248 | 8.6%), Health Diagnosing & Treating (194 | 6.8%), Computers, Engineering & Science (166 | 5.8%), and Education Instruction & Library (147 | 5.1%).
Management, Business, Science and Arts Occupations by Sex
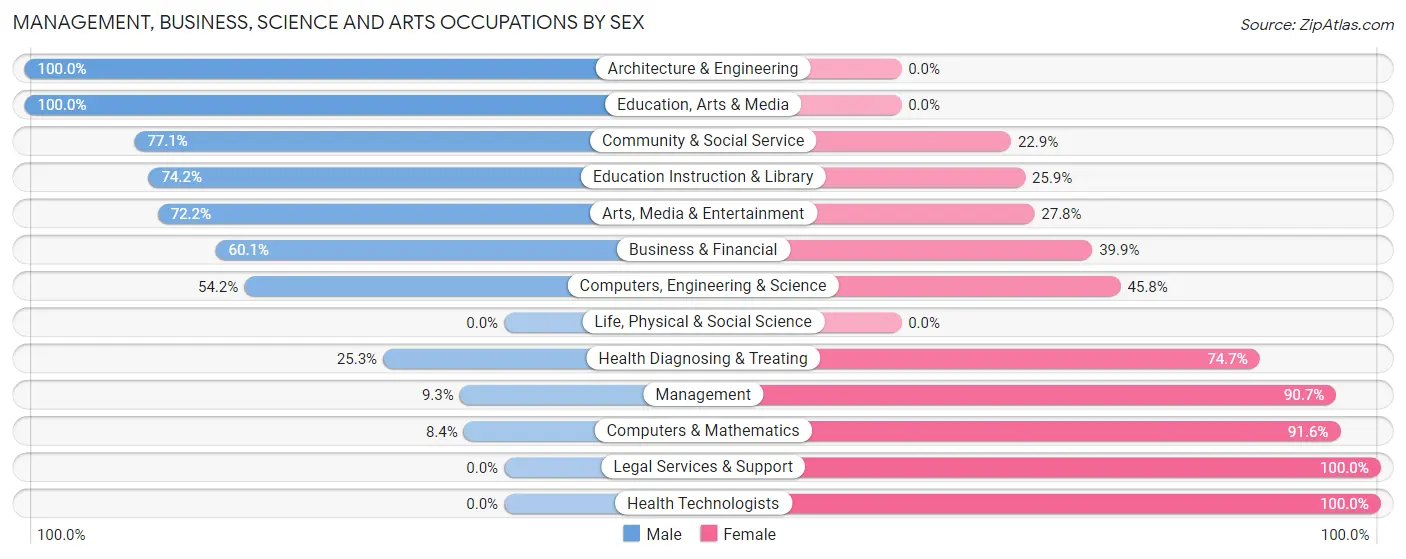
Within the Management, Business, Science and Arts occupations in Highlands, the most male-oriented occupations are Architecture & Engineering (100.0%), Education, Arts & Media (100.0%), and Community & Social Service (77.1%), while the most female-oriented occupations are Legal Services & Support (100.0%), Health Technologists (100.0%), and Computers & Mathematics (91.6%).
| Occupation | Male | Female |
| Management | 23 (9.3%) | 225 (90.7%) |
| Business & Financial | 86 (60.1%) | 57 (39.9%) |
| Computers, Engineering & Science | 90 (54.2%) | 76 (45.8%) |
| Computers & Mathematics | 7 (8.4%) | 76 (91.6%) |
| Architecture & Engineering | 83 (100.0%) | 0 (0.0%) |
| Life, Physical & Social Science | 0 (0.0%) | 0 (0.0%) |
| Community & Social Service | 212 (77.1%) | 63 (22.9%) |
| Education, Arts & Media | 90 (100.0%) | 0 (0.0%) |
| Legal Services & Support | 0 (0.0%) | 20 (100.0%) |
| Education Instruction & Library | 109 (74.2%) | 38 (25.9%) |
| Arts, Media & Entertainment | 13 (72.2%) | 5 (27.8%) |
| Health Diagnosing & Treating | 49 (25.3%) | 145 (74.7%) |
| Health Technologists | 0 (0.0%) | 74 (100.0%) |
| Total (Category) | 460 (44.8%) | 566 (55.2%) |
| Total (Overall) | 1,586 (55.2%) | 1,285 (44.8%) |
Services Occupations
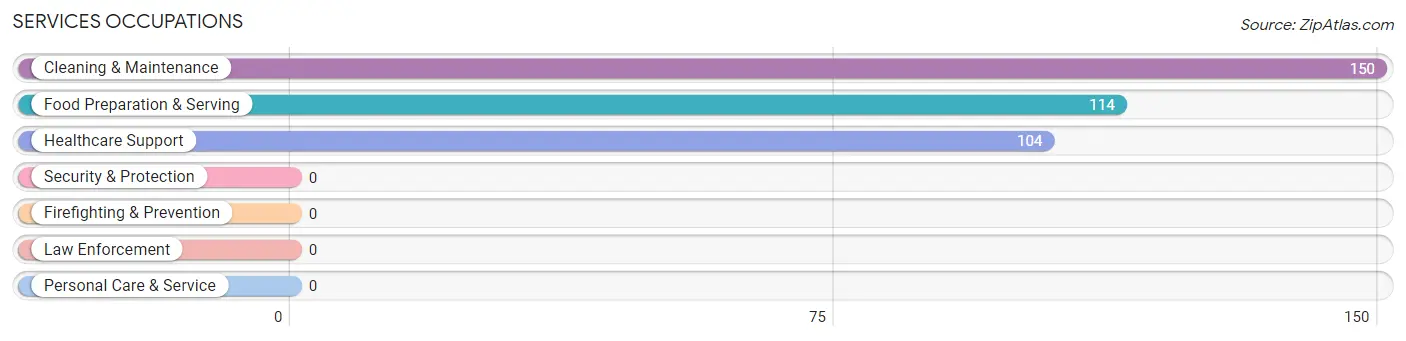
The most common Services occupations in Highlands are Cleaning & Maintenance (150 | 5.2%), Food Preparation & Serving (114 | 4.0%), and Healthcare Support (104 | 3.6%).
Services Occupations by Sex
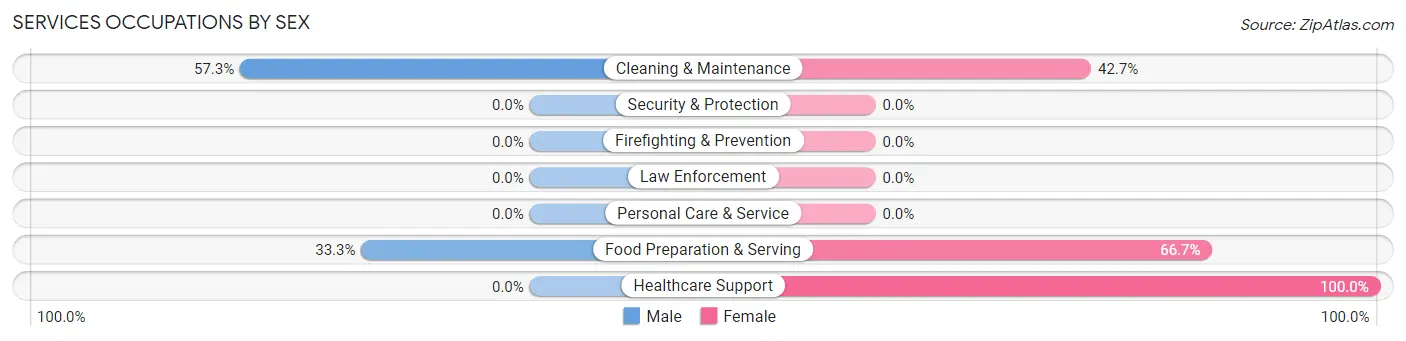
Within the Services occupations in Highlands, the most male-oriented occupations are Cleaning & Maintenance (57.3%), and Food Preparation & Serving (33.3%), while the most female-oriented occupations are Healthcare Support (100.0%), Food Preparation & Serving (66.7%), and Cleaning & Maintenance (42.7%).
| Occupation | Male | Female |
| Healthcare Support | 0 (0.0%) | 104 (100.0%) |
| Security & Protection | 0 (0.0%) | 0 (0.0%) |
| Firefighting & Prevention | 0 (0.0%) | 0 (0.0%) |
| Law Enforcement | 0 (0.0%) | 0 (0.0%) |
| Food Preparation & Serving | 38 (33.3%) | 76 (66.7%) |
| Cleaning & Maintenance | 86 (57.3%) | 64 (42.7%) |
| Personal Care & Service | 0 (0.0%) | 0 (0.0%) |
| Total (Category) | 124 (33.7%) | 244 (66.3%) |
| Total (Overall) | 1,586 (55.2%) | 1,285 (44.8%) |
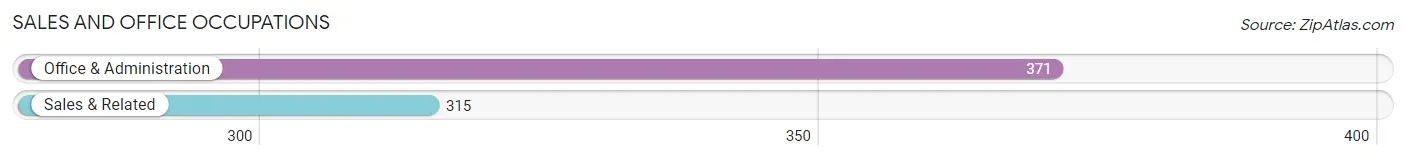
Sales and Office Occupations
The most common Sales and Office occupations in Highlands are Office & Administration (371 | 12.9%), and Sales & Related (315 | 11.0%).
Sales and Office Occupations by Sex
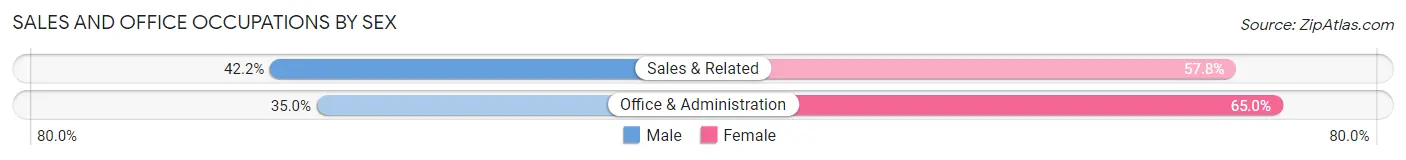
| Occupation | Male | Female |
| Sales & Related | 133 (42.2%) | 182 (57.8%) |
| Office & Administration | 130 (35.0%) | 241 (65.0%) |
| Total (Category) | 263 (38.3%) | 423 (61.7%) |
| Total (Overall) | 1,586 (55.2%) | 1,285 (44.8%) |
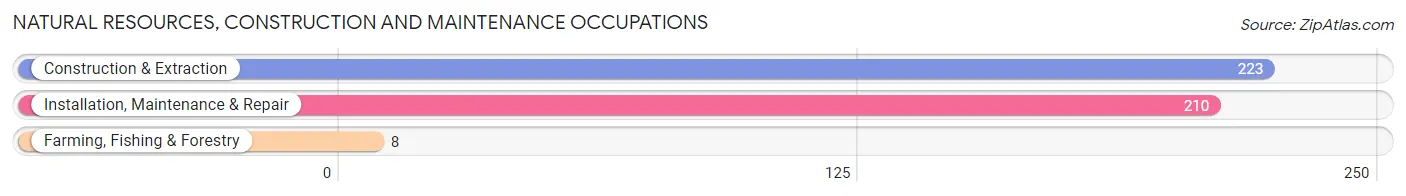
Natural Resources, Construction and Maintenance Occupations
The most common Natural Resources, Construction and Maintenance occupations in Highlands are Construction & Extraction (223 | 7.8%), Installation, Maintenance & Repair (210 | 7.3%), and Farming, Fishing & Forestry (8 | 0.3%).
Natural Resources, Construction and Maintenance Occupations by Sex
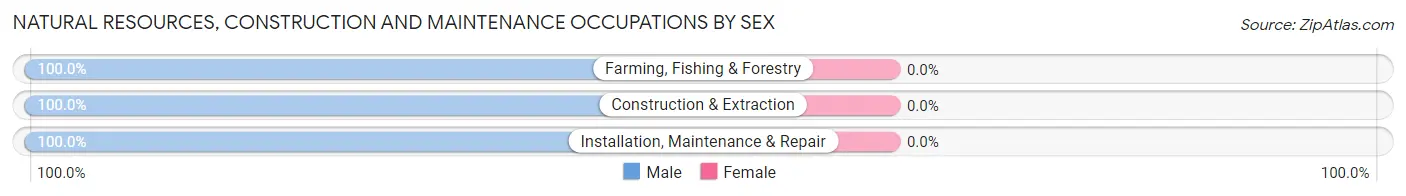
| Occupation | Male | Female |
| Farming, Fishing & Forestry | 8 (100.0%) | 0 (0.0%) |
| Construction & Extraction | 223 (100.0%) | 0 (0.0%) |
| Installation, Maintenance & Repair | 210 (100.0%) | 0 (0.0%) |
| Total (Category) | 441 (100.0%) | 0 (0.0%) |
| Total (Overall) | 1,586 (55.2%) | 1,285 (44.8%) |
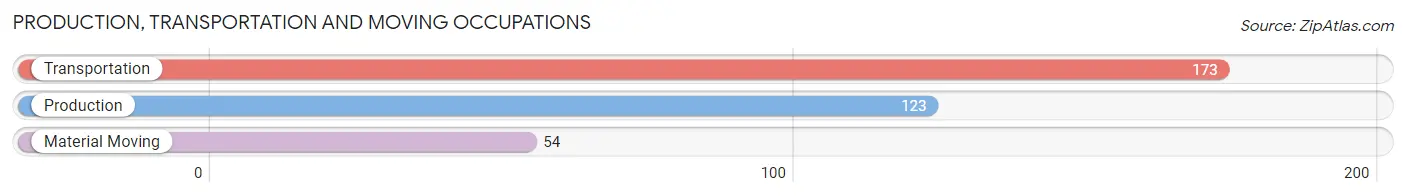
Production, Transportation and Moving Occupations
The most common Production, Transportation and Moving occupations in Highlands are Transportation (173 | 6.0%), Production (123 | 4.3%), and Material Moving (54 | 1.9%).
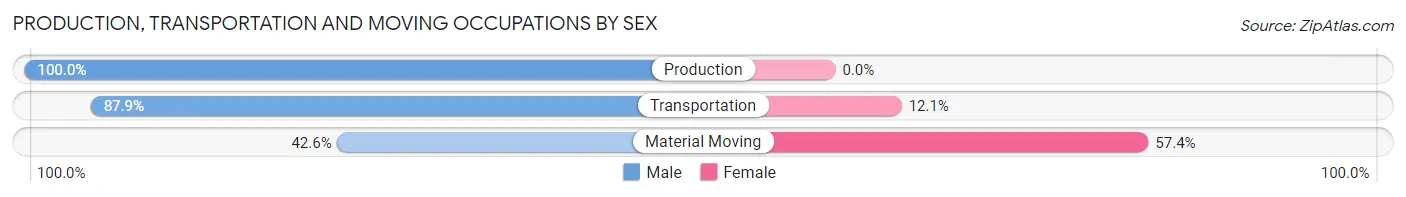
Production, Transportation and Moving Occupations by Sex
| Occupation | Male | Female |
| Production | 123 (100.0%) | 0 (0.0%) |
| Transportation | 152 (87.9%) | 21 (12.1%) |
| Material Moving | 23 (42.6%) | 31 (57.4%) |
| Total (Category) | 298 (85.1%) | 52 (14.9%) |
| Total (Overall) | 1,586 (55.2%) | 1,285 (44.8%) |
Employment Industries by Sex in Highlands
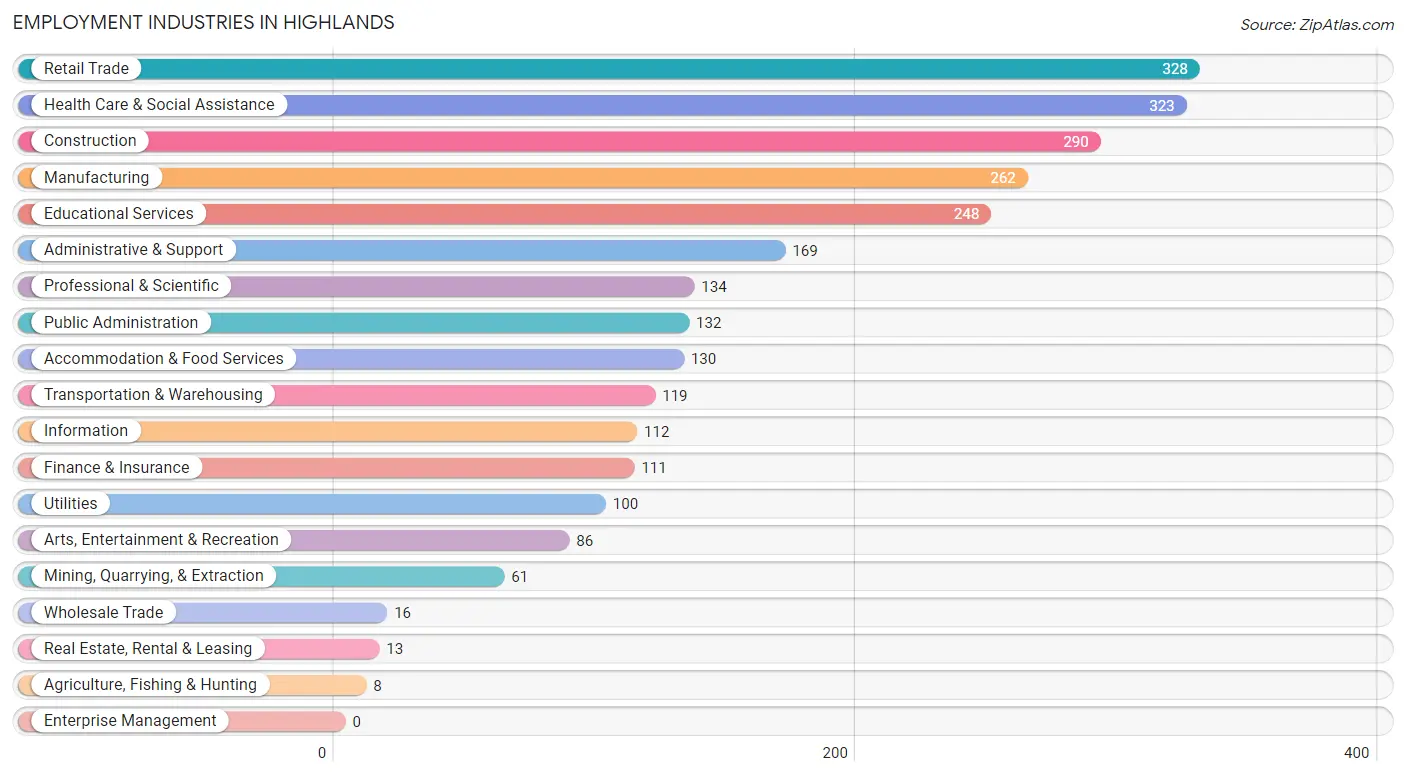
Employment Industries in Highlands
The major employment industries in Highlands include Retail Trade (328 | 11.4%), Health Care & Social Assistance (323 | 11.3%), Construction (290 | 10.1%), Manufacturing (262 | 9.1%), and Educational Services (248 | 8.6%).
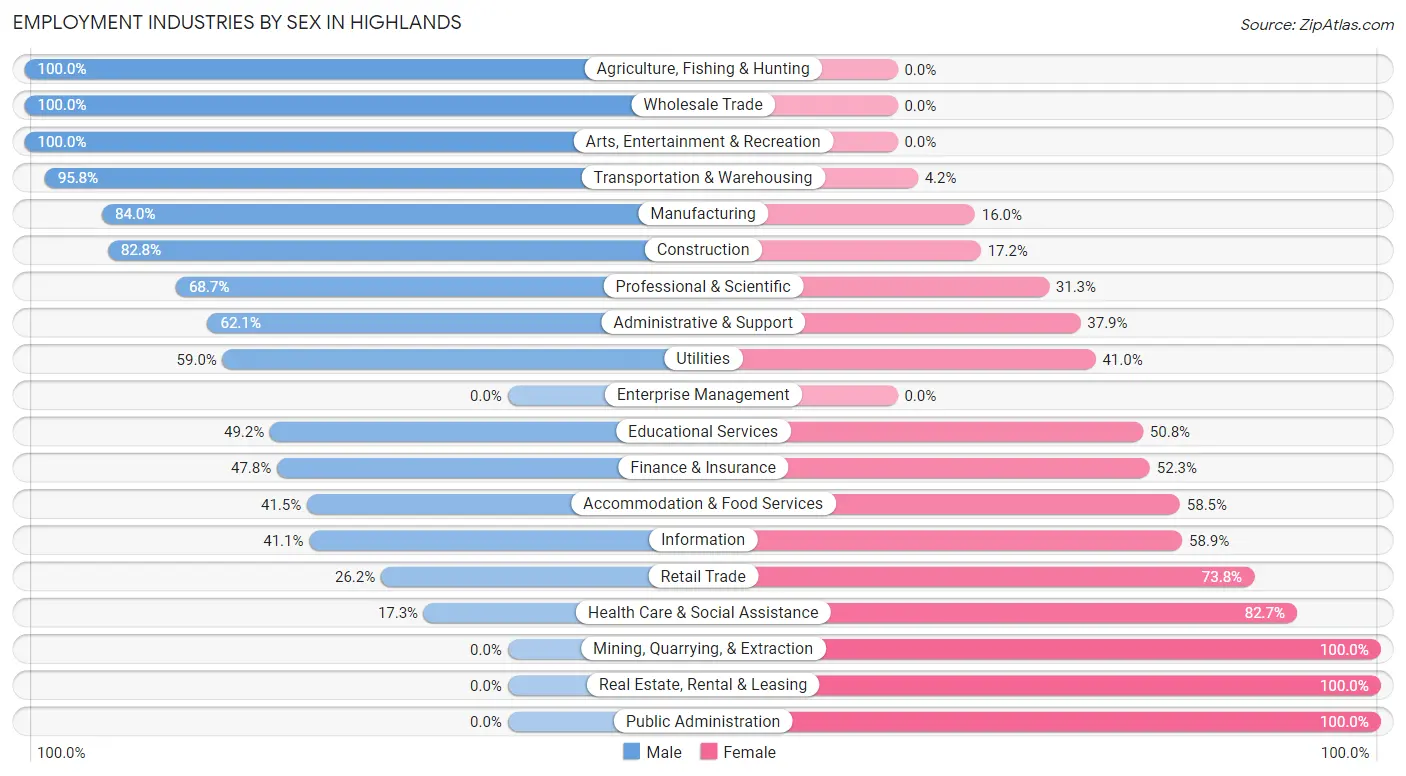
Employment Industries by Sex in Highlands
The Highlands industries that see more men than women are Agriculture, Fishing & Hunting (100.0%), Wholesale Trade (100.0%), and Arts, Entertainment & Recreation (100.0%), whereas the industries that tend to have a higher number of women are Mining, Quarrying, & Extraction (100.0%), Real Estate, Rental & Leasing (100.0%), and Public Administration (100.0%).
| Industry | Male | Female |
| Agriculture, Fishing & Hunting | 8 (100.0%) | 0 (0.0%) |
| Mining, Quarrying, & Extraction | 0 (0.0%) | 61 (100.0%) |
| Construction | 240 (82.8%) | 50 (17.2%) |
| Manufacturing | 220 (84.0%) | 42 (16.0%) |
| Wholesale Trade | 16 (100.0%) | 0 (0.0%) |
| Retail Trade | 86 (26.2%) | 242 (73.8%) |
| Transportation & Warehousing | 114 (95.8%) | 5 (4.2%) |
| Utilities | 59 (59.0%) | 41 (41.0%) |
| Information | 46 (41.1%) | 66 (58.9%) |
| Finance & Insurance | 53 (47.7%) | 58 (52.2%) |
| Real Estate, Rental & Leasing | 0 (0.0%) | 13 (100.0%) |
| Professional & Scientific | 92 (68.7%) | 42 (31.3%) |
| Enterprise Management | 0 (0.0%) | 0 (0.0%) |
| Administrative & Support | 105 (62.1%) | 64 (37.9%) |
| Educational Services | 122 (49.2%) | 126 (50.8%) |
| Health Care & Social Assistance | 56 (17.3%) | 267 (82.7%) |
| Arts, Entertainment & Recreation | 86 (100.0%) | 0 (0.0%) |
| Accommodation & Food Services | 54 (41.5%) | 76 (58.5%) |
| Public Administration | 0 (0.0%) | 132 (100.0%) |
| Total | 1,586 (55.2%) | 1,285 (44.8%) |
Education in Highlands
School Enrollment in Highlands
The most common levels of schooling among the 1,973 students in Highlands are middle school (625 | 31.7%), high school (460 | 23.3%), and college / undergraduate (341 | 17.3%).
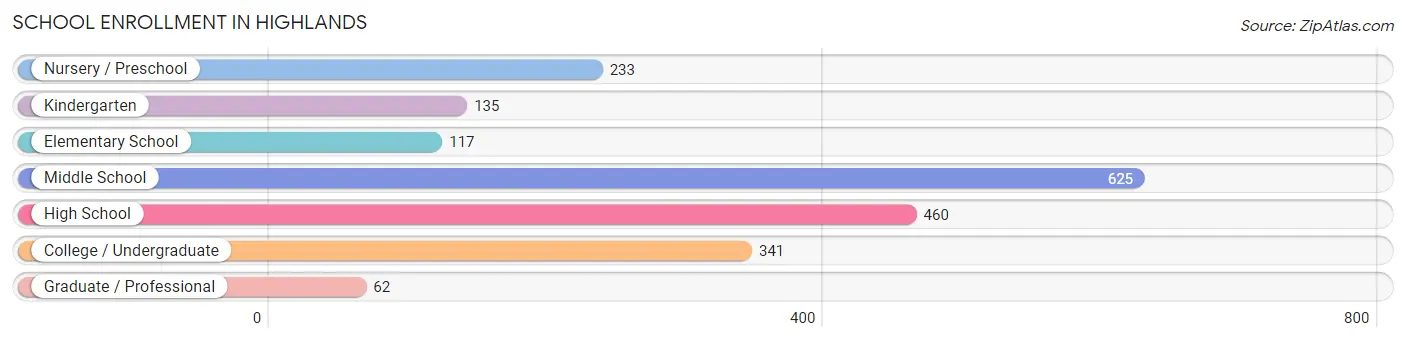
| School Level | # Students | % Students |
| Nursery / Preschool | 233 | 11.8% |
| Kindergarten | 135 | 6.8% |
| Elementary School | 117 | 5.9% |
| Middle School | 625 | 31.7% |
| High School | 460 | 23.3% |
| College / Undergraduate | 341 | 17.3% |
| Graduate / Professional | 62 | 3.1% |
| Total | 1,973 | 100.0% |
School Enrollment by Age by Funding Source in Highlands
Out of a total of 1,973 students who are enrolled in schools in Highlands, 347 (17.6%) attend a private institution, while the remaining 1,626 (82.4%) are enrolled in public schools. The age group of 20 to 24 year olds has the highest likelihood of being enrolled in private schools, with 48 (45.3% in the age bracket) enrolled. Conversely, the age group of 15 to 17 year olds has the lowest likelihood of being enrolled in a private school, with 293 (100.0% in the age bracket) attending a public institution.
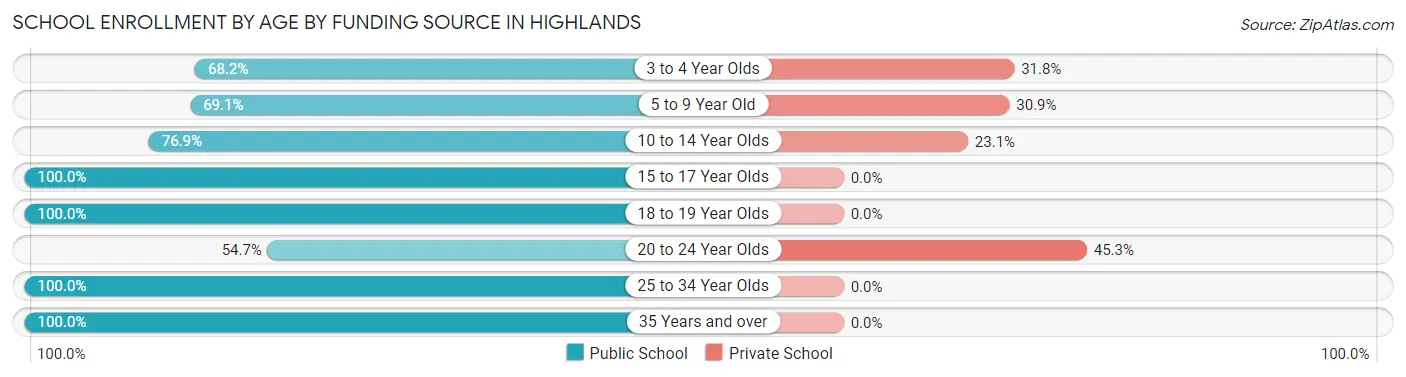
| Age Bracket | Public School | Private School |
| 3 to 4 Year Olds | 159 (68.2%) | 74 (31.8%) |
| 5 to 9 Year Old | 177 (69.1%) | 79 (30.9%) |
| 10 to 14 Year Olds | 485 (76.9%) | 146 (23.1%) |
| 15 to 17 Year Olds | 293 (100.0%) | 0 (0.0%) |
| 18 to 19 Year Olds | 291 (100.0%) | 0 (0.0%) |
| 20 to 24 Year Olds | 58 (54.7%) | 48 (45.3%) |
| 25 to 34 Year Olds | 129 (100.0%) | 0 (0.0%) |
| 35 Years and over | 34 (100.0%) | 0 (0.0%) |
| Total | 1,626 (82.4%) | 347 (17.6%) |
Educational Attainment by Field of Study in Highlands
Science & technology (125 | 16.8%), business (119 | 16.0%), literature & languages (96 | 12.9%), liberal arts & history (93 | 12.5%), and psychology (80 | 10.8%) are the most common fields of study among 743 individuals in Highlands who have obtained a bachelor's degree or higher.
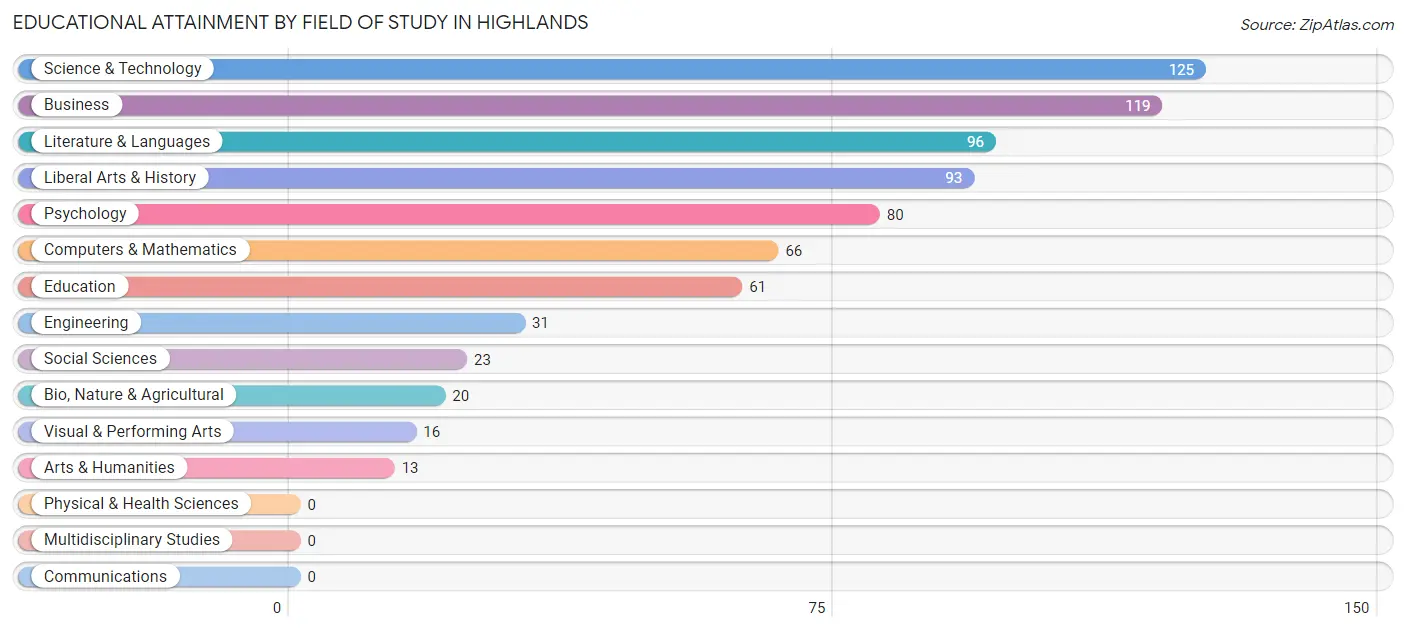
| Field of Study | # Graduates | % Graduates |
| Computers & Mathematics | 66 | 8.9% |
| Bio, Nature & Agricultural | 20 | 2.7% |
| Physical & Health Sciences | 0 | 0.0% |
| Psychology | 80 | 10.8% |
| Social Sciences | 23 | 3.1% |
| Engineering | 31 | 4.2% |
| Multidisciplinary Studies | 0 | 0.0% |
| Science & Technology | 125 | 16.8% |
| Business | 119 | 16.0% |
| Education | 61 | 8.2% |
| Literature & Languages | 96 | 12.9% |
| Liberal Arts & History | 93 | 12.5% |
| Visual & Performing Arts | 16 | 2.1% |
| Communications | 0 | 0.0% |
| Arts & Humanities | 13 | 1.8% |
| Total | 743 | 100.0% |
Transportation & Commute in Highlands
Vehicle Availability by Sex in Highlands
The most prevalent vehicle ownership categories in Highlands are males with 2 vehicles (714, accounting for 47.3%) and females with 2 vehicles (472, making up 62.5%).
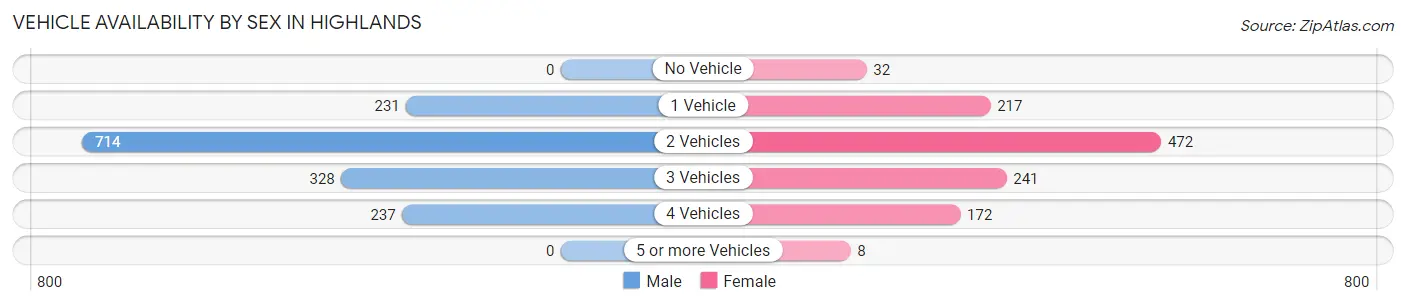
| Vehicles Available | Male | Female |
| No Vehicle | 0 (0.0%) | 32 (2.8%) |
| 1 Vehicle | 231 (15.3%) | 217 (19.0%) |
| 2 Vehicles | 714 (47.3%) | 472 (41.3%) |
| 3 Vehicles | 328 (21.7%) | 241 (21.1%) |
| 4 Vehicles | 237 (15.7%) | 172 (15.1%) |
| 5 or more Vehicles | 0 (0.0%) | 8 (0.7%) |
| Total | 1,510 (100.0%) | 1,142 (100.0%) |
Commute Time in Highlands
The most frequently occuring commute durations in Highlands are 30 to 34 minutes (522 commuters, 19.8%), 15 to 19 minutes (379 commuters, 14.4%), and 45 to 59 minutes (364 commuters, 13.8%).
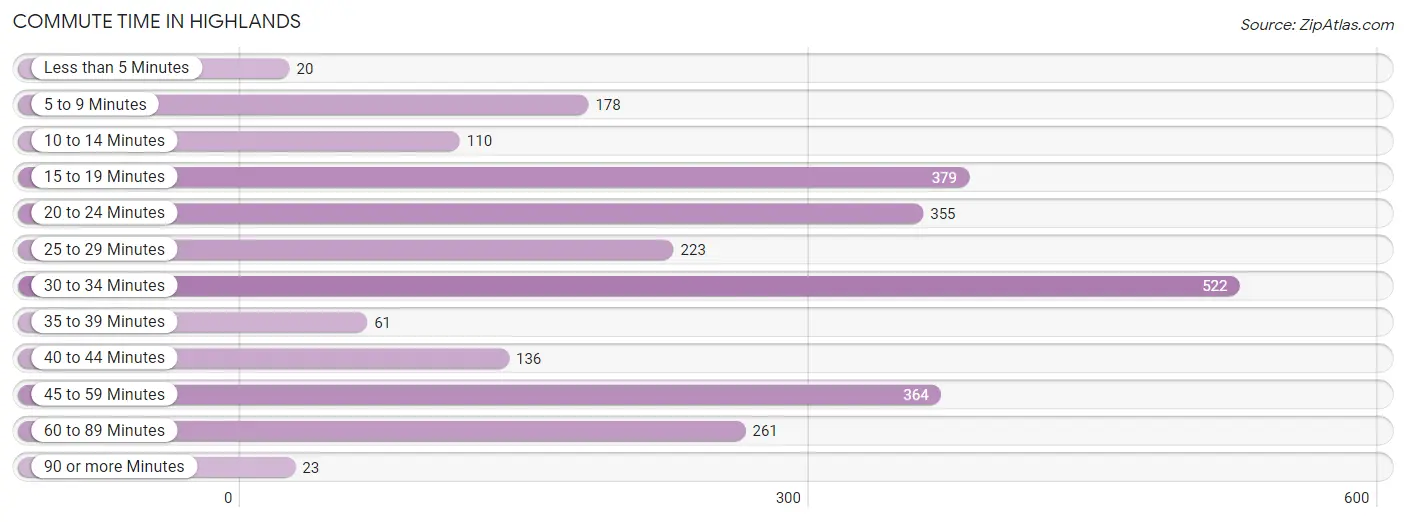
| Commute Time | # Commuters | % Commuters |
| Less than 5 Minutes | 20 | 0.8% |
| 5 to 9 Minutes | 178 | 6.8% |
| 10 to 14 Minutes | 110 | 4.2% |
| 15 to 19 Minutes | 379 | 14.4% |
| 20 to 24 Minutes | 355 | 13.5% |
| 25 to 29 Minutes | 223 | 8.5% |
| 30 to 34 Minutes | 522 | 19.8% |
| 35 to 39 Minutes | 61 | 2.3% |
| 40 to 44 Minutes | 136 | 5.2% |
| 45 to 59 Minutes | 364 | 13.8% |
| 60 to 89 Minutes | 261 | 9.9% |
| 90 or more Minutes | 23 | 0.9% |
Commute Time by Sex in Highlands
The most common commute times in Highlands are 30 to 34 minutes (299 commuters, 20.1%) for males and 30 to 34 minutes (223 commuters, 19.5%) for females.
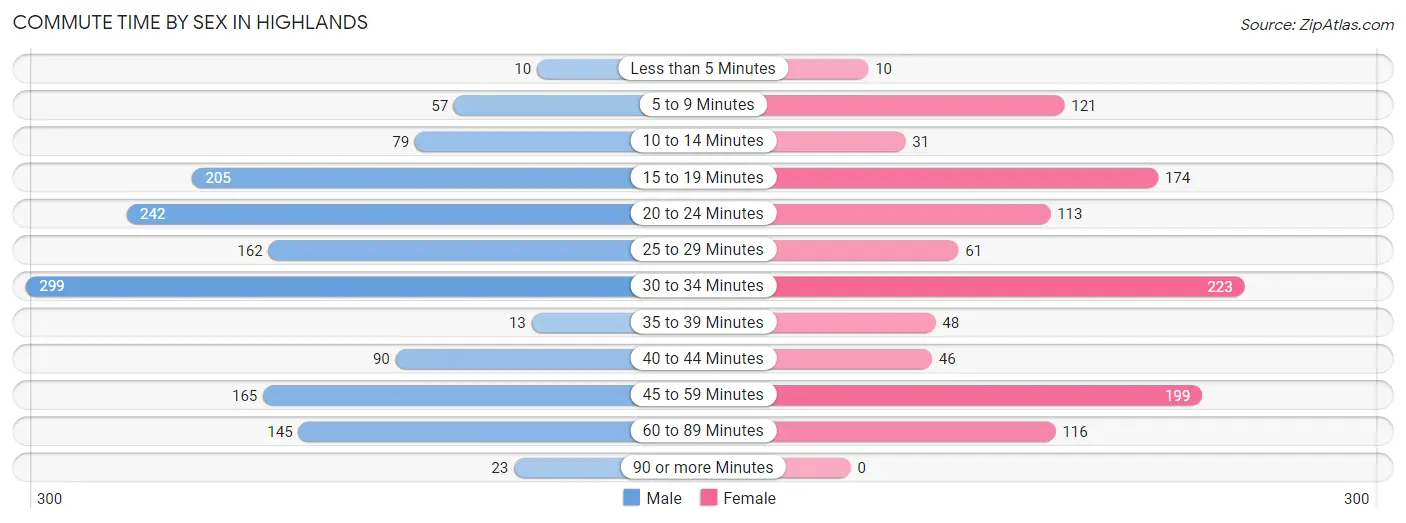
| Commute Time | Male | Female |
| Less than 5 Minutes | 10 (0.7%) | 10 (0.9%) |
| 5 to 9 Minutes | 57 (3.8%) | 121 (10.6%) |
| 10 to 14 Minutes | 79 (5.3%) | 31 (2.7%) |
| 15 to 19 Minutes | 205 (13.8%) | 174 (15.2%) |
| 20 to 24 Minutes | 242 (16.2%) | 113 (9.9%) |
| 25 to 29 Minutes | 162 (10.9%) | 61 (5.3%) |
| 30 to 34 Minutes | 299 (20.1%) | 223 (19.5%) |
| 35 to 39 Minutes | 13 (0.9%) | 48 (4.2%) |
| 40 to 44 Minutes | 90 (6.0%) | 46 (4.0%) |
| 45 to 59 Minutes | 165 (11.1%) | 199 (17.4%) |
| 60 to 89 Minutes | 145 (9.7%) | 116 (10.2%) |
| 90 or more Minutes | 23 (1.5%) | 0 (0.0%) |
Time of Departure to Work by Sex in Highlands
The most frequent times of departure to work in Highlands are 7:00 AM to 7:29 AM (316, 21.2%) for males and 9:00 AM to 9:59 AM (199, 17.4%) for females.
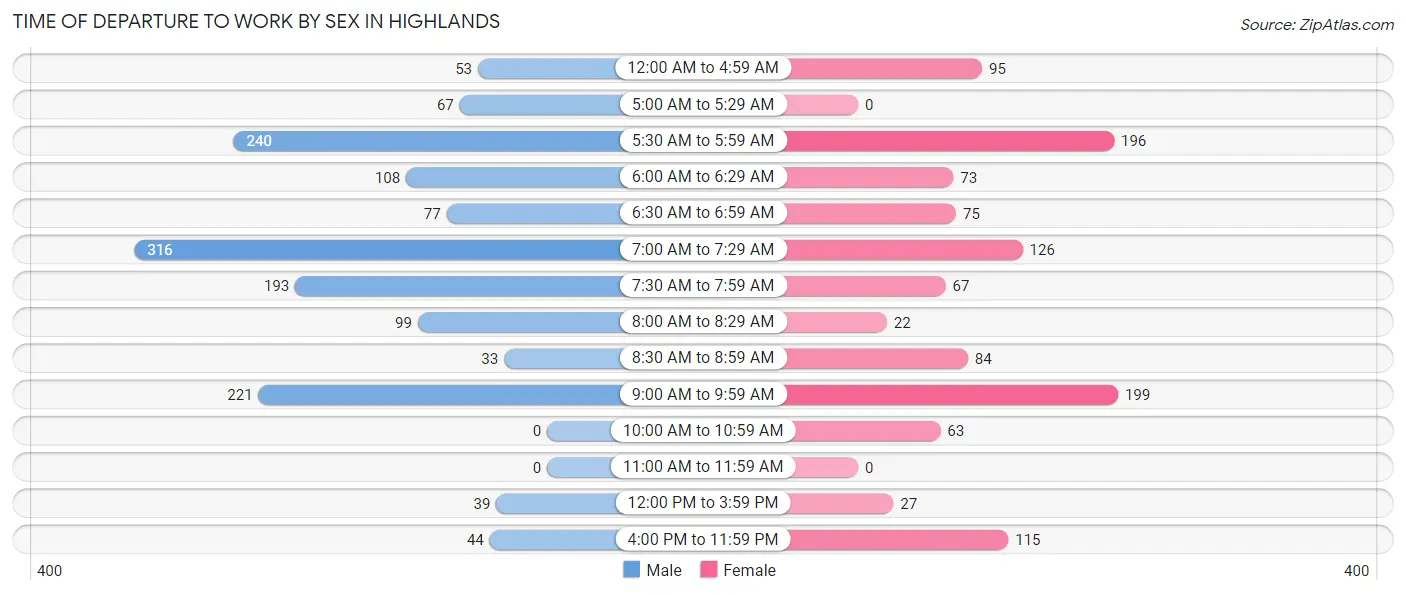
| Time of Departure | Male | Female |
| 12:00 AM to 4:59 AM | 53 (3.6%) | 95 (8.3%) |
| 5:00 AM to 5:29 AM | 67 (4.5%) | 0 (0.0%) |
| 5:30 AM to 5:59 AM | 240 (16.1%) | 196 (17.2%) |
| 6:00 AM to 6:29 AM | 108 (7.2%) | 73 (6.4%) |
| 6:30 AM to 6:59 AM | 77 (5.2%) | 75 (6.6%) |
| 7:00 AM to 7:29 AM | 316 (21.2%) | 126 (11.0%) |
| 7:30 AM to 7:59 AM | 193 (13.0%) | 67 (5.9%) |
| 8:00 AM to 8:29 AM | 99 (6.6%) | 22 (1.9%) |
| 8:30 AM to 8:59 AM | 33 (2.2%) | 84 (7.4%) |
| 9:00 AM to 9:59 AM | 221 (14.8%) | 199 (17.4%) |
| 10:00 AM to 10:59 AM | 0 (0.0%) | 63 (5.5%) |
| 11:00 AM to 11:59 AM | 0 (0.0%) | 0 (0.0%) |
| 12:00 PM to 3:59 PM | 39 (2.6%) | 27 (2.4%) |
| 4:00 PM to 11:59 PM | 44 (2.9%) | 115 (10.1%) |
| Total | 1,490 (100.0%) | 1,142 (100.0%) |
Housing Occupancy in Highlands
Occupancy by Ownership in Highlands
Of the total 2,416 dwellings in Highlands, owner-occupied units account for 1,858 (76.9%), while renter-occupied units make up 558 (23.1%).
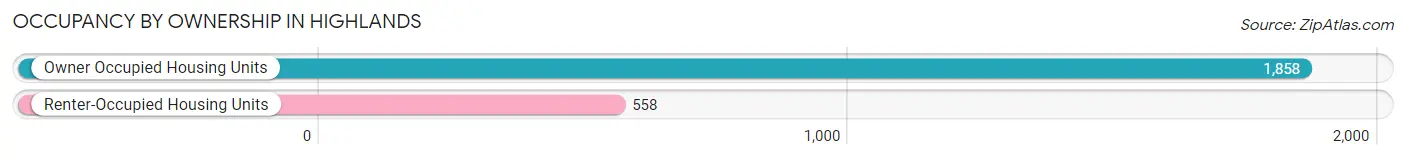
| Occupancy | # Housing Units | % Housing Units |
| Owner Occupied Housing Units | 1,858 | 76.9% |
| Renter-Occupied Housing Units | 558 | 23.1% |
| Total Occupied Housing Units | 2,416 | 100.0% |
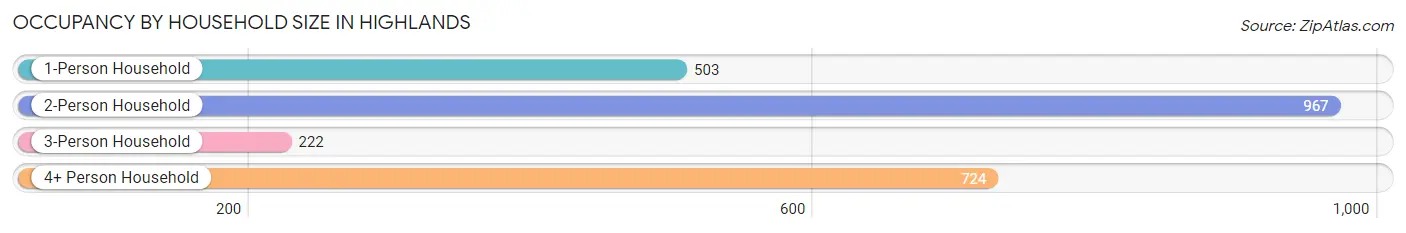
Occupancy by Household Size in Highlands
| Household Size | # Housing Units | % Housing Units |
| 1-Person Household | 503 | 20.8% |
| 2-Person Household | 967 | 40.0% |
| 3-Person Household | 222 | 9.2% |
| 4+ Person Household | 724 | 30.0% |
| Total Housing Units | 2,416 | 100.0% |
Occupancy by Ownership by Household Size in Highlands
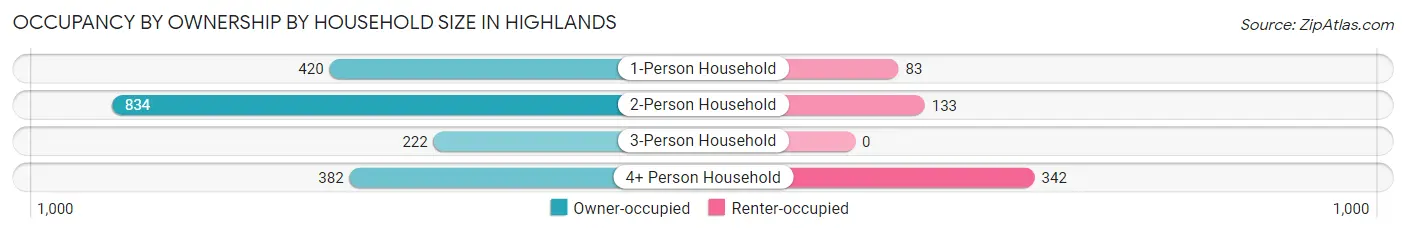
| Household Size | Owner-occupied | Renter-occupied |
| 1-Person Household | 420 (83.5%) | 83 (16.5%) |
| 2-Person Household | 834 (86.3%) | 133 (13.8%) |
| 3-Person Household | 222 (100.0%) | 0 (0.0%) |
| 4+ Person Household | 382 (52.8%) | 342 (47.2%) |
| Total Housing Units | 1,858 (76.9%) | 558 (23.1%) |
Occupancy by Educational Attainment in Highlands
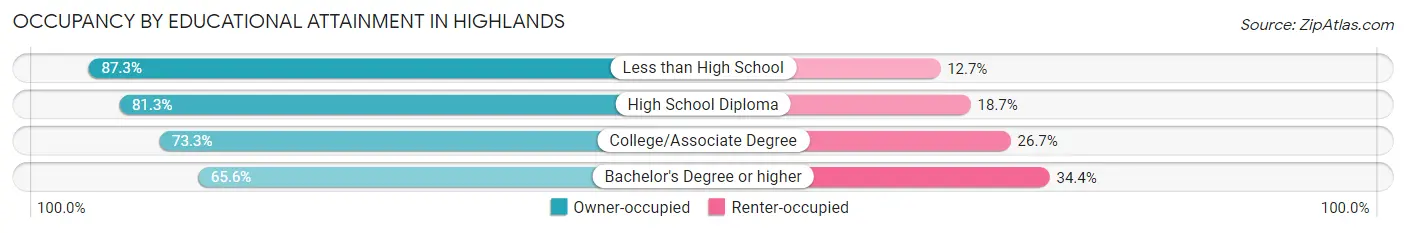
| Household Size | Owner-occupied | Renter-occupied |
| Less than High School | 344 (87.3%) | 50 (12.7%) |
| High School Diploma | 573 (81.3%) | 132 (18.7%) |
| College/Associate Degree | 729 (73.3%) | 265 (26.7%) |
| Bachelor's Degree or higher | 212 (65.6%) | 111 (34.4%) |
Occupancy by Age of Householder in Highlands
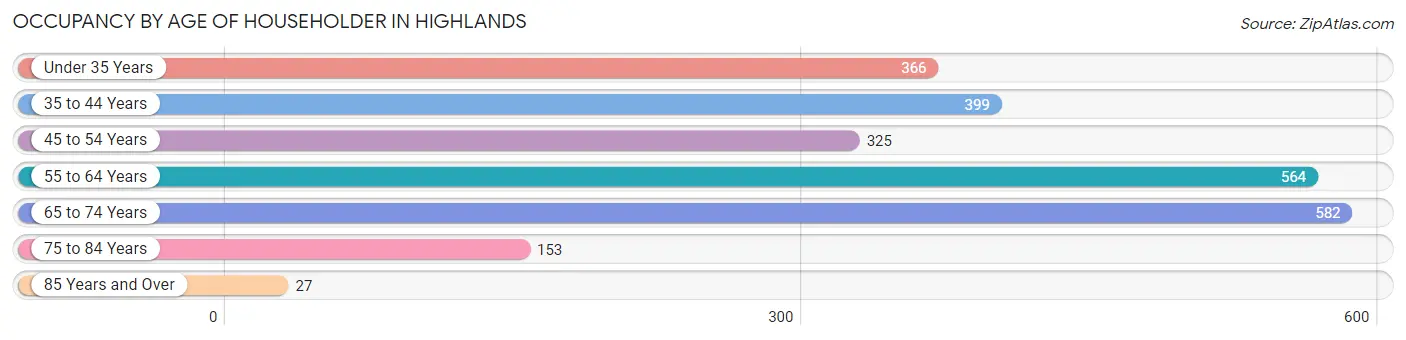
| Age Bracket | # Households | % Households |
| Under 35 Years | 366 | 15.1% |
| 35 to 44 Years | 399 | 16.5% |
| 45 to 54 Years | 325 | 13.5% |
| 55 to 64 Years | 564 | 23.3% |
| 65 to 74 Years | 582 | 24.1% |
| 75 to 84 Years | 153 | 6.3% |
| 85 Years and Over | 27 | 1.1% |
| Total | 2,416 | 100.0% |
Housing Finances in Highlands
Median Income by Occupancy in Highlands
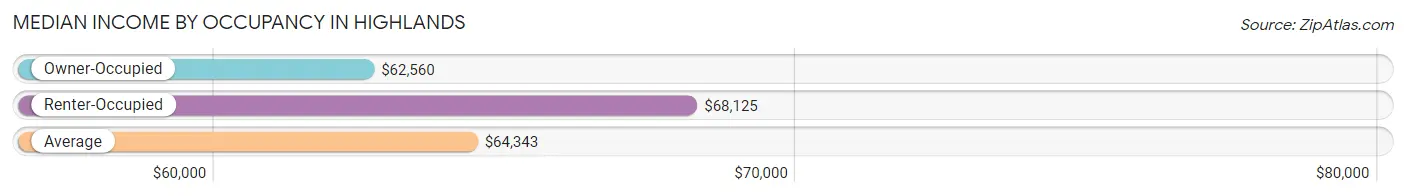
| Occupancy Type | # Households | Median Income |
| Owner-Occupied | 1,858 (76.9%) | $62,560 |
| Renter-Occupied | 558 (23.1%) | $68,125 |
| Average | 2,416 (100.0%) | $64,343 |
Occupancy by Householder Income Bracket in Highlands
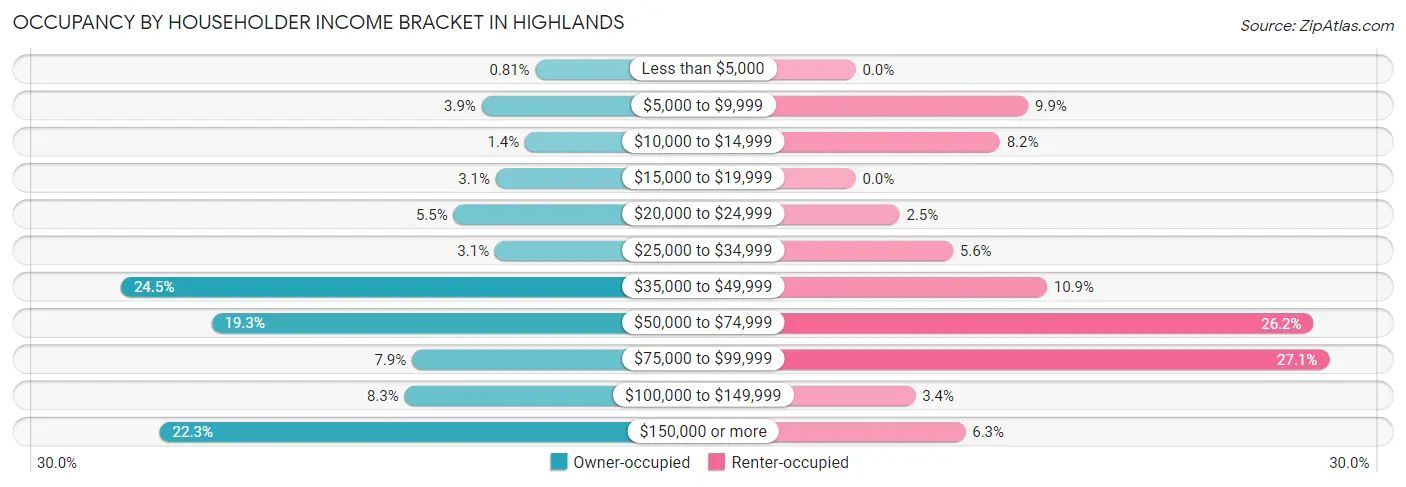
| Income Bracket | Owner-occupied | Renter-occupied |
| Less than $5,000 | 15 (0.8%) | 0 (0.0%) |
| $5,000 to $9,999 | 72 (3.9%) | 55 (9.9%) |
| $10,000 to $14,999 | 26 (1.4%) | 46 (8.2%) |
| $15,000 to $19,999 | 57 (3.1%) | 0 (0.0%) |
| $20,000 to $24,999 | 102 (5.5%) | 14 (2.5%) |
| $25,000 to $34,999 | 58 (3.1%) | 31 (5.6%) |
| $35,000 to $49,999 | 455 (24.5%) | 61 (10.9%) |
| $50,000 to $74,999 | 359 (19.3%) | 146 (26.2%) |
| $75,000 to $99,999 | 146 (7.9%) | 151 (27.1%) |
| $100,000 to $149,999 | 154 (8.3%) | 19 (3.4%) |
| $150,000 or more | 414 (22.3%) | 35 (6.3%) |
| Total | 1,858 (100.0%) | 558 (100.0%) |
Monthly Housing Cost Tiers in Highlands
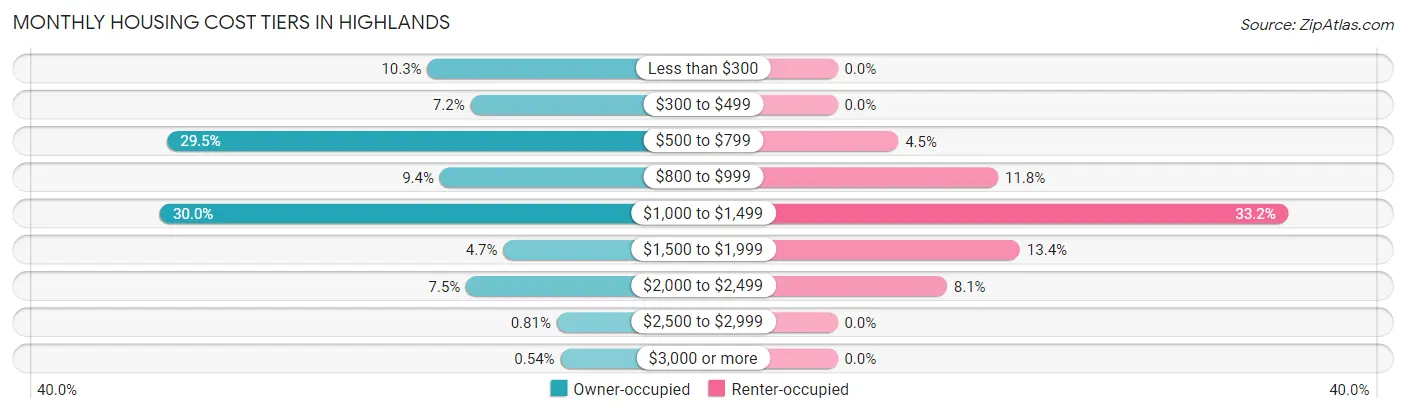
| Monthly Cost | Owner-occupied | Renter-occupied |
| Less than $300 | 192 (10.3%) | 0 (0.0%) |
| $300 to $499 | 133 (7.2%) | 0 (0.0%) |
| $500 to $799 | 548 (29.5%) | 25 (4.5%) |
| $800 to $999 | 175 (9.4%) | 66 (11.8%) |
| $1,000 to $1,499 | 558 (30.0%) | 185 (33.2%) |
| $1,500 to $1,999 | 88 (4.7%) | 75 (13.4%) |
| $2,000 to $2,499 | 139 (7.5%) | 45 (8.1%) |
| $2,500 to $2,999 | 15 (0.8%) | 0 (0.0%) |
| $3,000 or more | 10 (0.5%) | 0 (0.0%) |
| Total | 1,858 (100.0%) | 558 (100.0%) |
Physical Housing Characteristics in Highlands
Housing Structures in Highlands
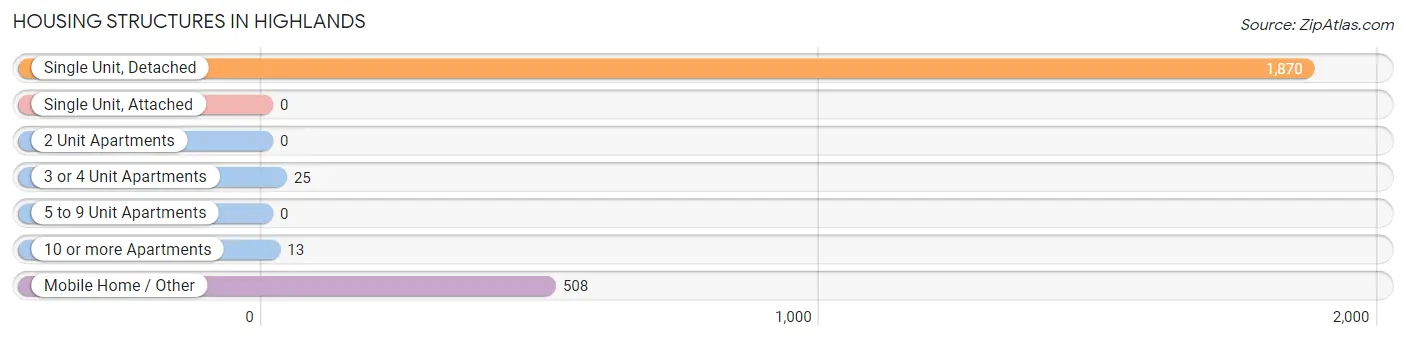
| Structure Type | # Housing Units | % Housing Units |
| Single Unit, Detached | 1,870 | 77.4% |
| Single Unit, Attached | 0 | 0.0% |
| 2 Unit Apartments | 0 | 0.0% |
| 3 or 4 Unit Apartments | 25 | 1.0% |
| 5 to 9 Unit Apartments | 0 | 0.0% |
| 10 or more Apartments | 13 | 0.5% |
| Mobile Home / Other | 508 | 21.0% |
| Total | 2,416 | 100.0% |
Housing Structures by Occupancy in Highlands
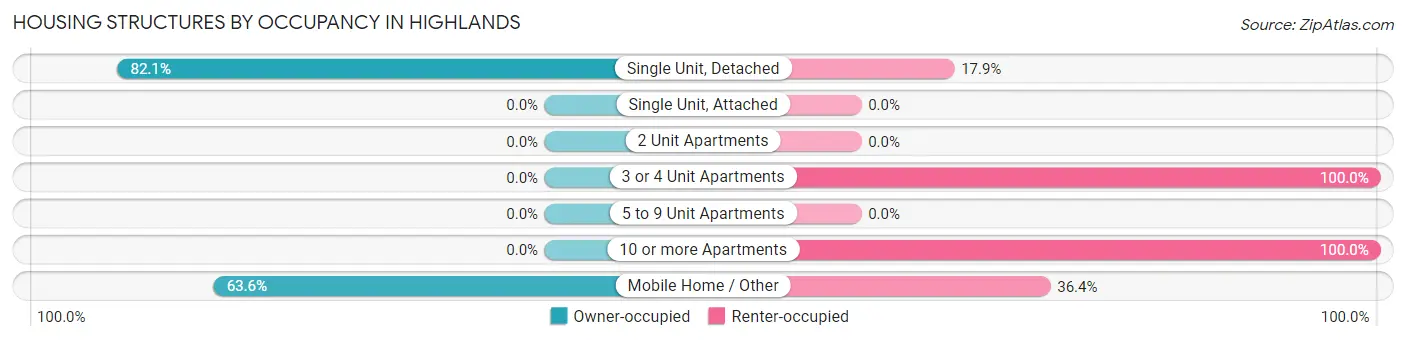
| Structure Type | Owner-occupied | Renter-occupied |
| Single Unit, Detached | 1,535 (82.1%) | 335 (17.9%) |
| Single Unit, Attached | 0 (0.0%) | 0 (0.0%) |
| 2 Unit Apartments | 0 (0.0%) | 0 (0.0%) |
| 3 or 4 Unit Apartments | 0 (0.0%) | 25 (100.0%) |
| 5 to 9 Unit Apartments | 0 (0.0%) | 0 (0.0%) |
| 10 or more Apartments | 0 (0.0%) | 13 (100.0%) |
| Mobile Home / Other | 323 (63.6%) | 185 (36.4%) |
| Total | 1,858 (76.9%) | 558 (23.1%) |
Housing Structures by Number of Rooms in Highlands
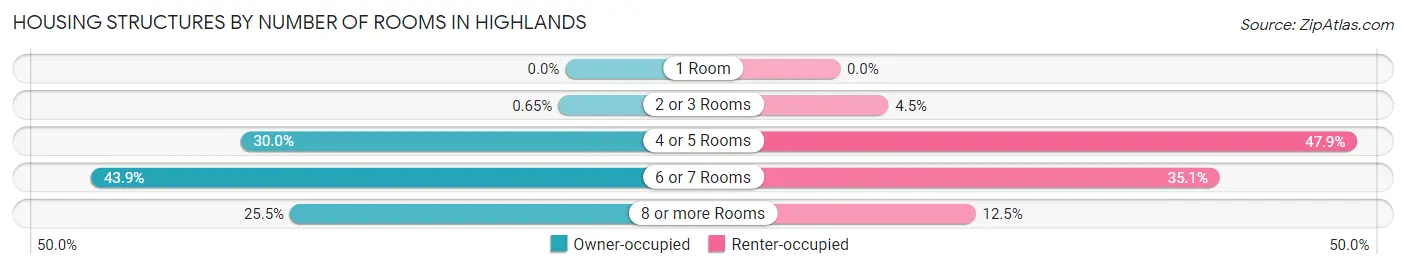
| Number of Rooms | Owner-occupied | Renter-occupied |
| 1 Room | 0 (0.0%) | 0 (0.0%) |
| 2 or 3 Rooms | 12 (0.6%) | 25 (4.5%) |
| 4 or 5 Rooms | 558 (30.0%) | 267 (47.8%) |
| 6 or 7 Rooms | 815 (43.9%) | 196 (35.1%) |
| 8 or more Rooms | 473 (25.5%) | 70 (12.5%) |
| Total | 1,858 (100.0%) | 558 (100.0%) |
Housing Structure by Heating Type in Highlands
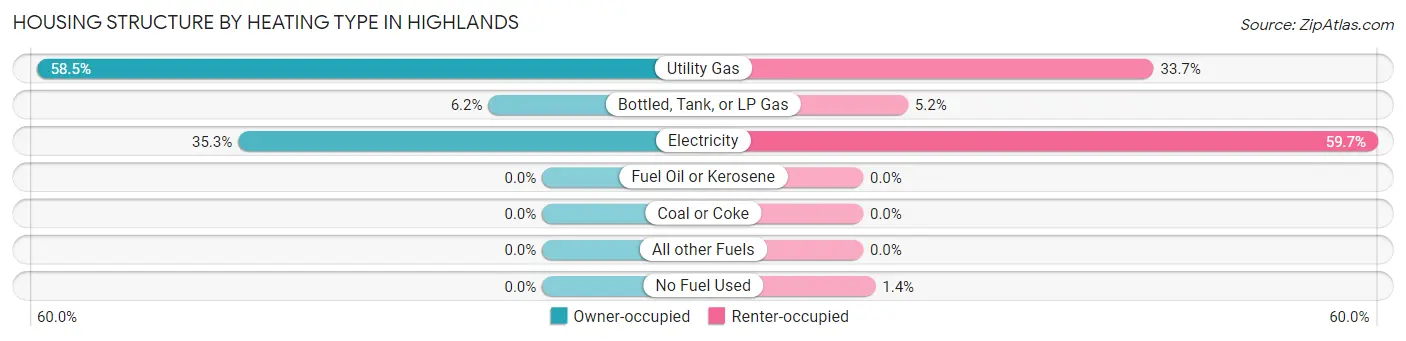
| Heating Type | Owner-occupied | Renter-occupied |
| Utility Gas | 1,087 (58.5%) | 188 (33.7%) |
| Bottled, Tank, or LP Gas | 116 (6.2%) | 29 (5.2%) |
| Electricity | 655 (35.2%) | 333 (59.7%) |
| Fuel Oil or Kerosene | 0 (0.0%) | 0 (0.0%) |
| Coal or Coke | 0 (0.0%) | 0 (0.0%) |
| All other Fuels | 0 (0.0%) | 0 (0.0%) |
| No Fuel Used | 0 (0.0%) | 8 (1.4%) |
| Total | 1,858 (100.0%) | 558 (100.0%) |
Household Vehicle Usage in Highlands
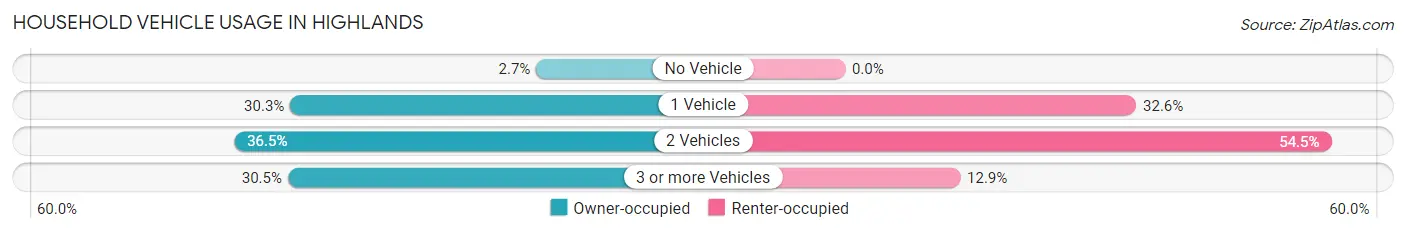
| Vehicles per Household | Owner-occupied | Renter-occupied |
| No Vehicle | 50 (2.7%) | 0 (0.0%) |
| 1 Vehicle | 562 (30.2%) | 182 (32.6%) |
| 2 Vehicles | 679 (36.5%) | 304 (54.5%) |
| 3 or more Vehicles | 567 (30.5%) | 72 (12.9%) |
| Total | 1,858 (100.0%) | 558 (100.0%) |
Real Estate & Mortgages in Highlands
Real Estate and Mortgage Overview in Highlands
| Characteristic | Without Mortgage | With Mortgage |
| Housing Units | 1,146 | 712 |
| Median Property Value | $194,200 | $166,500 |
| Median Household Income | $52,406 | $216 |
| Monthly Housing Costs | $682 | $10 |
| Real Estate Taxes | $2,753 | $32 |
Property Value by Mortgage Status in Highlands
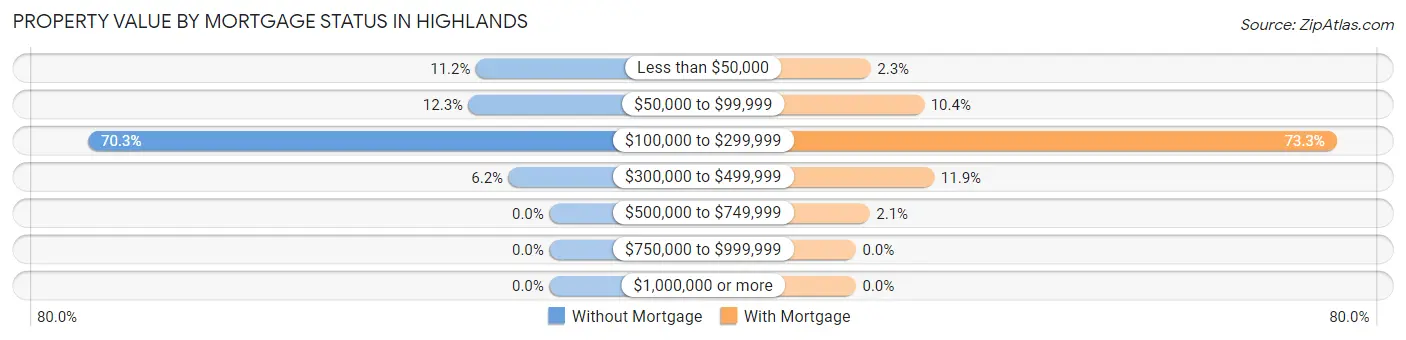
| Property Value | Without Mortgage | With Mortgage |
| Less than $50,000 | 128 (11.2%) | 16 (2.2%) |
| $50,000 to $99,999 | 141 (12.3%) | 74 (10.4%) |
| $100,000 to $299,999 | 806 (70.3%) | 522 (73.3%) |
| $300,000 to $499,999 | 71 (6.2%) | 85 (11.9%) |
| $500,000 to $749,999 | 0 (0.0%) | 15 (2.1%) |
| $750,000 to $999,999 | 0 (0.0%) | 0 (0.0%) |
| $1,000,000 or more | 0 (0.0%) | 0 (0.0%) |
| Total | 1,146 (100.0%) | 712 (100.0%) |
Household Income by Mortgage Status in Highlands
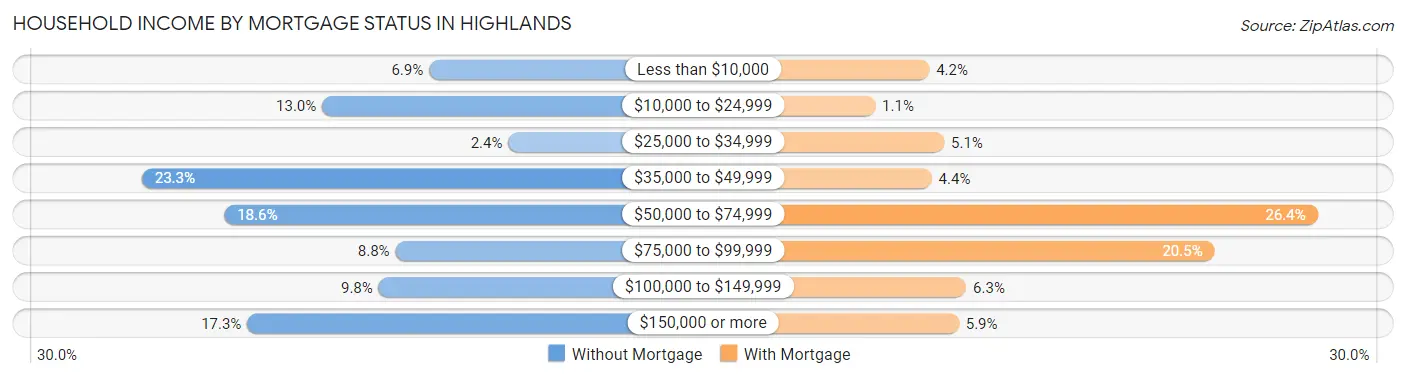
| Household Income | Without Mortgage | With Mortgage |
| Less than $10,000 | 79 (6.9%) | 30 (4.2%) |
| $10,000 to $24,999 | 149 (13.0%) | 8 (1.1%) |
| $25,000 to $34,999 | 27 (2.4%) | 36 (5.1%) |
| $35,000 to $49,999 | 267 (23.3%) | 31 (4.3%) |
| $50,000 to $74,999 | 213 (18.6%) | 188 (26.4%) |
| $75,000 to $99,999 | 101 (8.8%) | 146 (20.5%) |
| $100,000 to $149,999 | 112 (9.8%) | 45 (6.3%) |
| $150,000 or more | 198 (17.3%) | 42 (5.9%) |
| Total | 1,146 (100.0%) | 712 (100.0%) |
Property Value to Household Income Ratio in Highlands
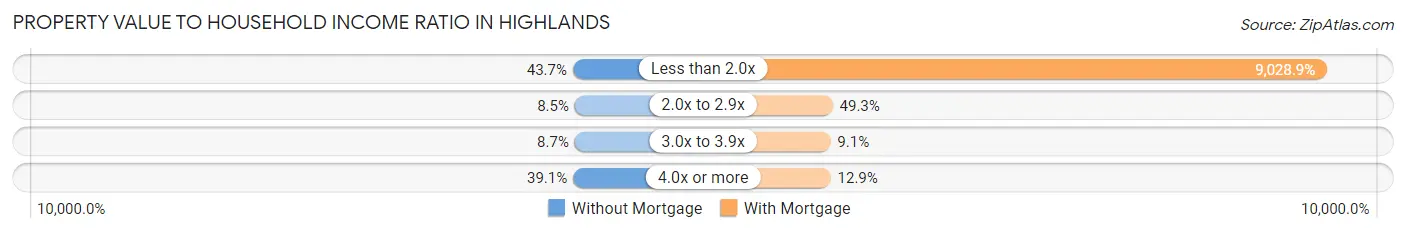
| Value-to-Income Ratio | Without Mortgage | With Mortgage |
| Less than 2.0x | 501 (43.7%) | 64,286 (9,028.9%) |
| 2.0x to 2.9x | 97 (8.5%) | 351 (49.3%) |
| 3.0x to 3.9x | 100 (8.7%) | 65 (9.1%) |
| 4.0x or more | 448 (39.1%) | 92 (12.9%) |
| Total | 1,146 (100.0%) | 712 (100.0%) |
Real Estate Taxes by Mortgage Status in Highlands
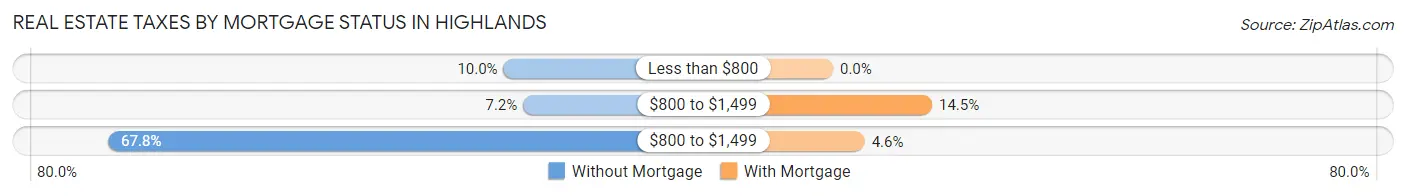
| Property Taxes | Without Mortgage | With Mortgage |
| Less than $800 | 115 (10.0%) | 0 (0.0%) |
| $800 to $1,499 | 82 (7.2%) | 103 (14.5%) |
| $800 to $1,499 | 777 (67.8%) | 33 (4.6%) |
| Total | 1,146 (100.0%) | 712 (100.0%) |
Health & Disability in Highlands
Health Insurance Coverage by Age in Highlands
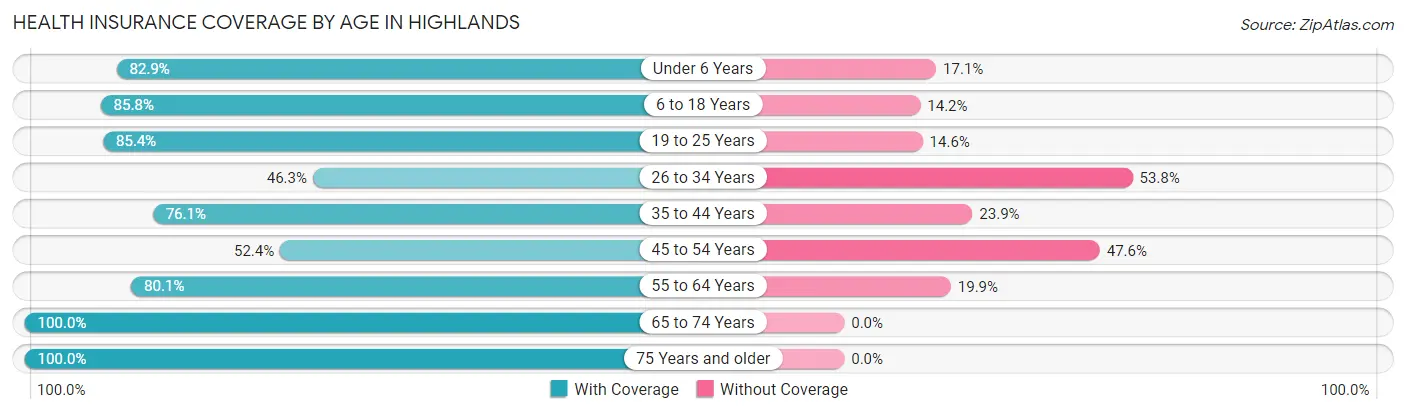
| Age Bracket | With Coverage | Without Coverage |
| Under 6 Years | 769 (82.9%) | 159 (17.1%) |
| 6 to 18 Years | 1,108 (85.8%) | 183 (14.2%) |
| 19 to 25 Years | 573 (85.4%) | 98 (14.6%) |
| 26 to 34 Years | 389 (46.3%) | 452 (53.7%) |
| 35 to 44 Years | 599 (76.1%) | 188 (23.9%) |
| 45 to 54 Years | 322 (52.4%) | 293 (47.6%) |
| 55 to 64 Years | 758 (80.1%) | 188 (19.9%) |
| 65 to 74 Years | 1,003 (100.0%) | 0 (0.0%) |
| 75 Years and older | 254 (100.0%) | 0 (0.0%) |
| Total | 5,775 (78.7%) | 1,561 (21.3%) |
Health Insurance Coverage by Citizenship Status in Highlands
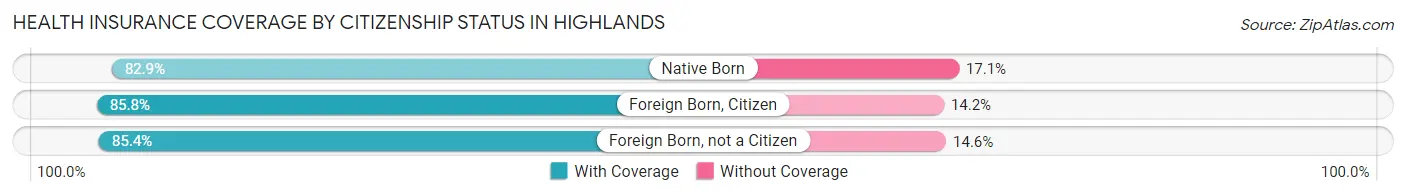
| Citizenship Status | With Coverage | Without Coverage |
| Native Born | 769 (82.9%) | 159 (17.1%) |
| Foreign Born, Citizen | 1,108 (85.8%) | 183 (14.2%) |
| Foreign Born, not a Citizen | 573 (85.4%) | 98 (14.6%) |
Health Insurance Coverage by Household Income in Highlands
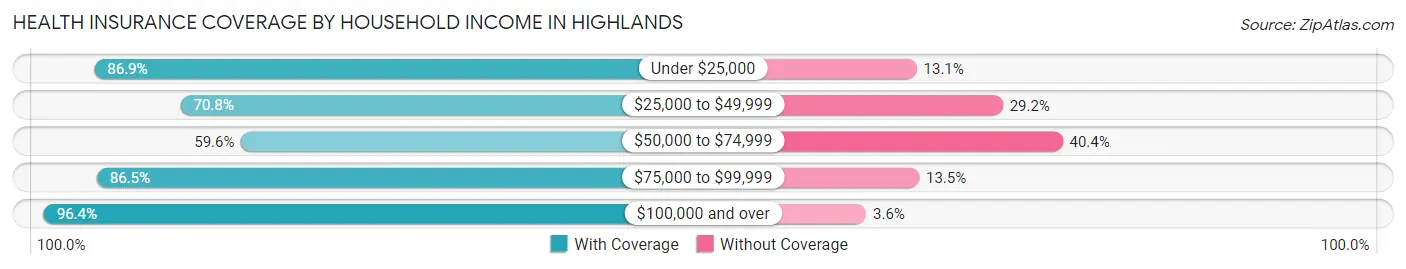
| Household Income | With Coverage | Without Coverage |
| Under $25,000 | 671 (86.9%) | 101 (13.1%) |
| $25,000 to $49,999 | 1,340 (70.8%) | 553 (29.2%) |
| $50,000 to $74,999 | 1,017 (59.6%) | 690 (40.4%) |
| $75,000 to $99,999 | 959 (86.5%) | 150 (13.5%) |
| $100,000 and over | 1,787 (96.4%) | 67 (3.6%) |
Public vs Private Health Insurance Coverage by Age in Highlands
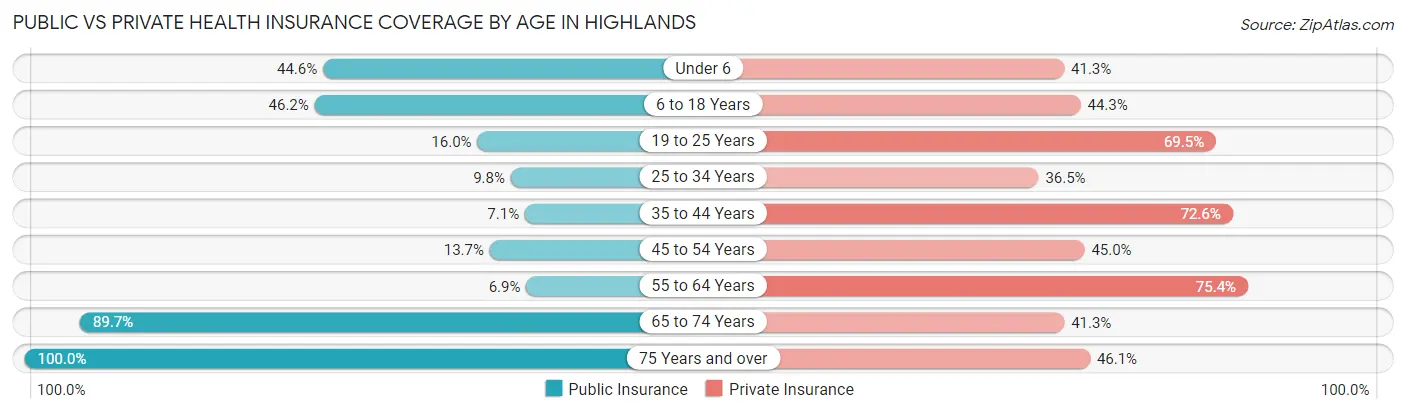
| Age Bracket | Public Insurance | Private Insurance |
| Under 6 | 414 (44.6%) | 383 (41.3%) |
| 6 to 18 Years | 596 (46.2%) | 572 (44.3%) |
| 19 to 25 Years | 107 (16.0%) | 466 (69.5%) |
| 25 to 34 Years | 82 (9.8%) | 307 (36.5%) |
| 35 to 44 Years | 56 (7.1%) | 571 (72.6%) |
| 45 to 54 Years | 84 (13.7%) | 277 (45.0%) |
| 55 to 64 Years | 65 (6.9%) | 713 (75.4%) |
| 65 to 74 Years | 900 (89.7%) | 414 (41.3%) |
| 75 Years and over | 254 (100.0%) | 117 (46.1%) |
| Total | 2,558 (34.9%) | 3,820 (52.1%) |
Disability Status by Sex by Age in Highlands
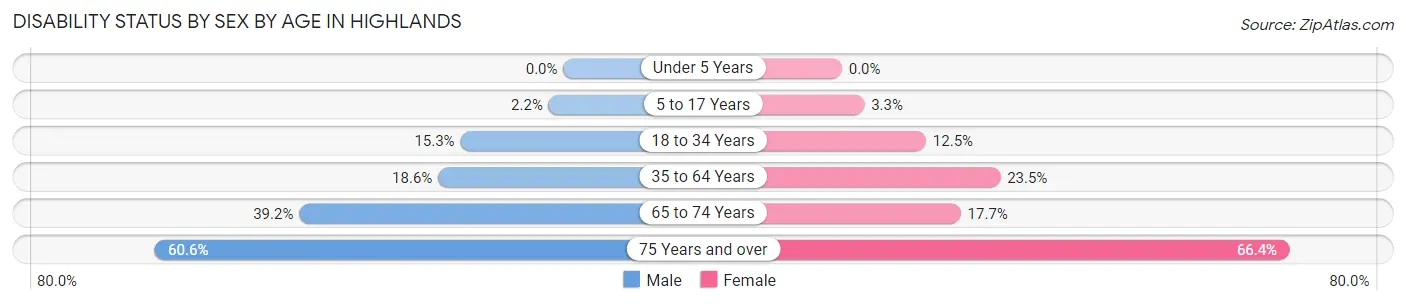
| Age Bracket | Male | Female |
| Under 5 Years | 0 (0.0%) | 0 (0.0%) |
| 5 to 17 Years | 16 (2.2%) | 16 (3.3%) |
| 18 to 34 Years | 103 (15.3%) | 128 (12.5%) |
| 35 to 64 Years | 216 (18.6%) | 279 (23.5%) |
| 65 to 74 Years | 220 (39.2%) | 78 (17.6%) |
| 75 Years and over | 80 (60.6%) | 81 (66.4%) |
Disability Class by Sex by Age in Highlands
Disability Class: Hearing Difficulty
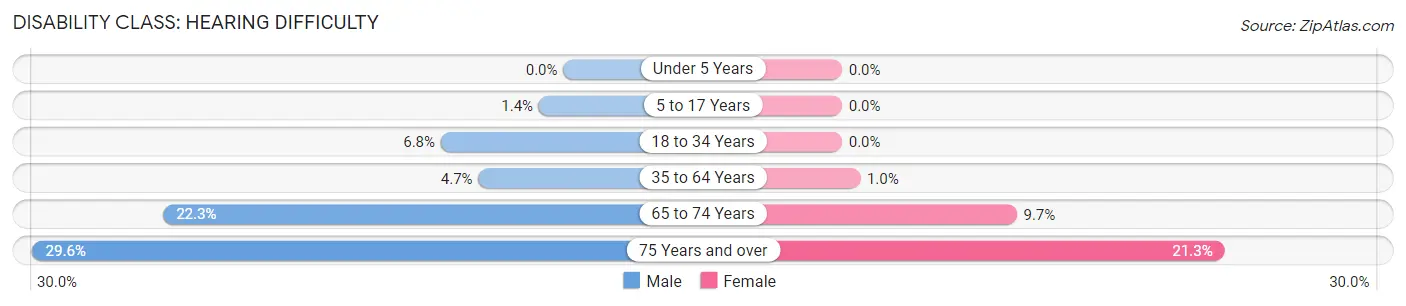
| Age Bracket | Male | Female |
| Under 5 Years | 0 (0.0%) | 0 (0.0%) |
| 5 to 17 Years | 10 (1.4%) | 0 (0.0%) |
| 18 to 34 Years | 46 (6.8%) | 0 (0.0%) |
| 35 to 64 Years | 55 (4.7%) | 12 (1.0%) |
| 65 to 74 Years | 125 (22.3%) | 43 (9.7%) |
| 75 Years and over | 39 (29.5%) | 26 (21.3%) |
Disability Class: Vision Difficulty
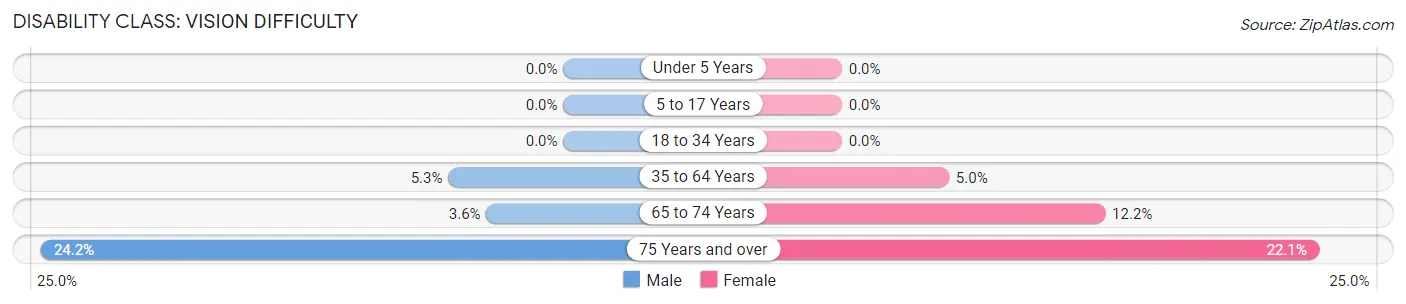
| Age Bracket | Male | Female |
| Under 5 Years | 0 (0.0%) | 0 (0.0%) |
| 5 to 17 Years | 0 (0.0%) | 0 (0.0%) |
| 18 to 34 Years | 0 (0.0%) | 0 (0.0%) |
| 35 to 64 Years | 62 (5.3%) | 59 (5.0%) |
| 65 to 74 Years | 20 (3.6%) | 54 (12.2%) |
| 75 Years and over | 32 (24.2%) | 27 (22.1%) |
Disability Class: Cognitive Difficulty
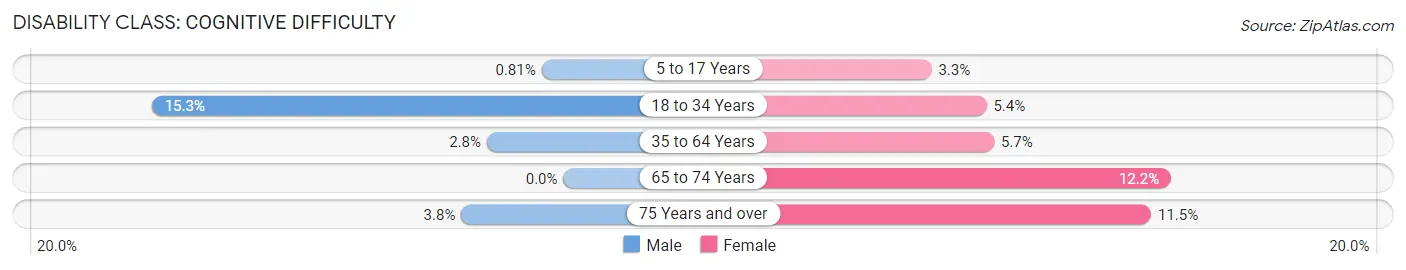
| Age Bracket | Male | Female |
| 5 to 17 Years | 6 (0.8%) | 16 (3.3%) |
| 18 to 34 Years | 103 (15.3%) | 55 (5.4%) |
| 35 to 64 Years | 33 (2.8%) | 67 (5.7%) |
| 65 to 74 Years | 0 (0.0%) | 54 (12.2%) |
| 75 Years and over | 5 (3.8%) | 14 (11.5%) |
Disability Class: Ambulatory Difficulty
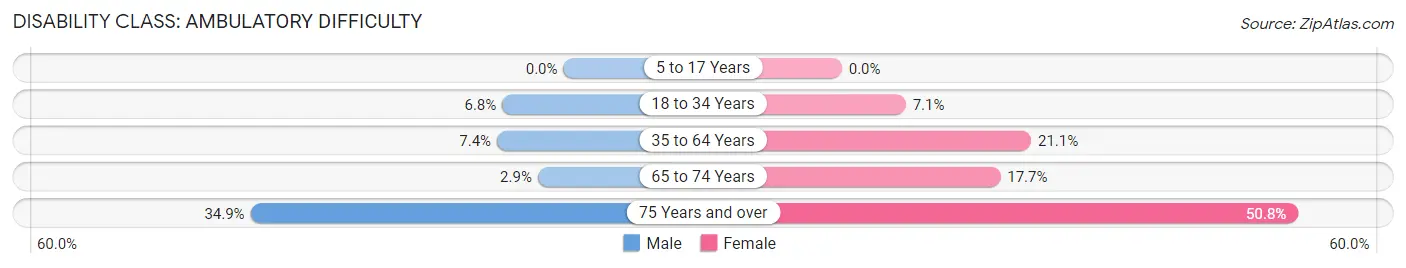
| Age Bracket | Male | Female |
| 5 to 17 Years | 0 (0.0%) | 0 (0.0%) |
| 18 to 34 Years | 46 (6.8%) | 73 (7.1%) |
| 35 to 64 Years | 86 (7.4%) | 250 (21.1%) |
| 65 to 74 Years | 16 (2.9%) | 78 (17.6%) |
| 75 Years and over | 46 (34.8%) | 62 (50.8%) |
Disability Class: Self-Care Difficulty
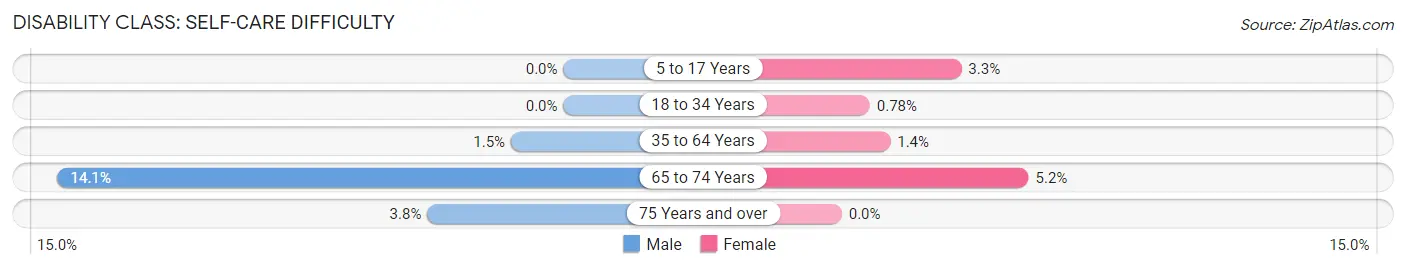
| Age Bracket | Male | Female |
| 5 to 17 Years | 0 (0.0%) | 16 (3.3%) |
| 18 to 34 Years | 0 (0.0%) | 8 (0.8%) |
| 35 to 64 Years | 17 (1.5%) | 16 (1.3%) |
| 65 to 74 Years | 79 (14.1%) | 23 (5.2%) |
| 75 Years and over | 5 (3.8%) | 0 (0.0%) |
Technology Access in Highlands
Computing Device Access in Highlands
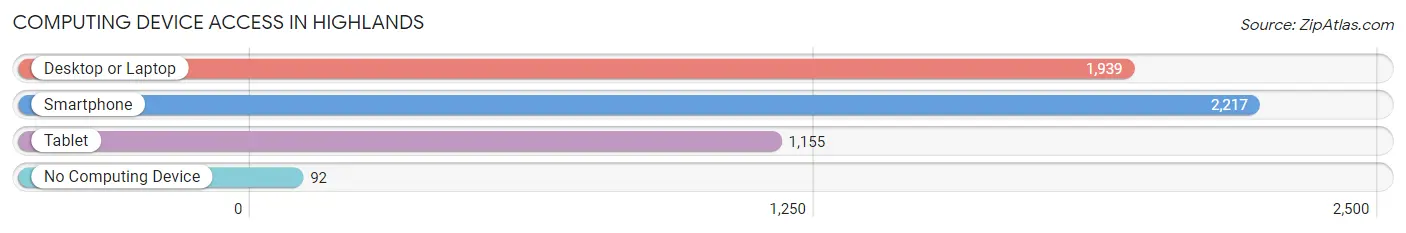
| Device Type | # Households | % Households |
| Desktop or Laptop | 1,939 | 80.3% |
| Smartphone | 2,217 | 91.8% |
| Tablet | 1,155 | 47.8% |
| No Computing Device | 92 | 3.8% |
| Total | 2,416 | 100.0% |
Internet Access in Highlands
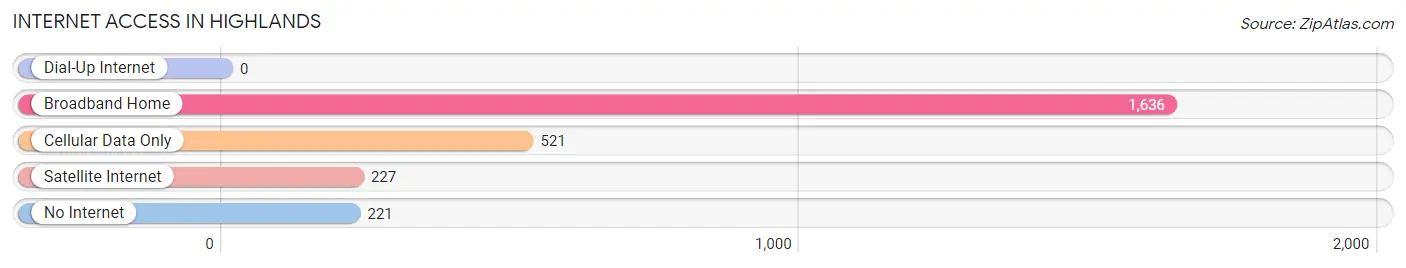
| Internet Type | # Households | % Households |
| Dial-Up Internet | 0 | 0.0% |
| Broadband Home | 1,636 | 67.7% |
| Cellular Data Only | 521 | 21.6% |
| Satellite Internet | 227 | 9.4% |
| No Internet | 221 | 9.1% |
| Total | 2,416 | 100.0% |
Highlands Summary
Highlands, Texas is a small town located in the southeastern part of Harris County, Texas. It is situated on the banks of the San Jacinto River, about 25 miles east of downtown Houston. The town was founded in 1891 and incorporated in 1948. As of the 2010 census, the population of Highlands was 3,722.
Geography
Highlands is located at 29°45'25" North, 95°2'25" West (29.756944, -95.040278). It is situated on the banks of the San Jacinto River, about 25 miles east of downtown Houston. The town is located in the southeastern part of Harris County, Texas. The total area of the town is 4.2 square miles, all of which is land.
Climate
Highlands has a humid subtropical climate, with hot summers and mild winters. The average annual temperature is 68°F, with an average high of 90°F in the summer and an average low of 46°F in the winter. The average annual precipitation is 48 inches.
Demographics
As of the 2010 census, the population of Highlands was 3,722. The racial makeup of the town was 79.2% White, 11.2% African American, 0.3% Native American, 0.7% Asian, 0.1% Pacific Islander, 6.3% from other races, and 2.4% from two or more races. Hispanic or Latino of any race were 18.2% of the population.
Economy
Highlands is a small town with a limited economy. The town is home to several small businesses, including a grocery store, a hardware store, a gas station, and a few restaurants. The town also has a few manufacturing plants, including a paper mill and a plastics factory. The town is also home to a few oil and gas companies.
The median household income in Highlands is $45,813, and the median family income is $51,945. The per capita income is $20,945. The unemployment rate is 5.2%.
History
Highlands was founded in 1891 by a group of settlers from the nearby town of Crosby. The town was named after the highlands of Scotland, and the settlers hoped to create a similar atmosphere in their new home. The town was incorporated in 1948.
Highlands has a long history of oil and gas production. The first oil well was drilled in the town in 1901, and the first natural gas well was drilled in 1906. The town has been home to several oil and gas companies over the years, and the industry continues to be an important part of the local economy.
Highlands is also home to a paper mill, which was built in the 1950s. The mill is still in operation today, and it is one of the town’s largest employers.
Conclusion
Highlands, Texas is a small town located in the southeastern part of Harris County, Texas. It is situated on the banks of the San Jacinto River, about 25 miles east of downtown Houston. The town was founded in 1891 and incorporated in 1948. As of the 2010 census, the population of Highlands was 3,722. The town has a humid subtropical climate, with hot summers and mild winters. The economy of Highlands is largely based on oil and gas production, as well as a paper mill and a few other small businesses. The median household income in Highlands is $45,813, and the median family income is $51,945. The per capita income is $20,945. The unemployment rate is 5.2%. Highlands is a small town with a long history, and it continues to be an important part of the local economy.
Common Questions
What is Per Capita Income in Highlands?
Per Capita income in Highlands is $30,300.
What is the Median Family Income in Highlands?
Median Family Income in Highlands is $72,738.
What is the Median Household income in Highlands?
Median Household Income in Highlands is $64,343.
What is Income or Wage Gap in Highlands?
Income or Wage Gap in Highlands is 37.8%.
Women in Highlands earn 62.2 cents for every dollar earned by a man.
What is Family Income Deficit in Highlands?
Family Income Deficit in Highlands is $16,546.
Families that are below poverty line in Highlands earn $16,546 less on average than the poverty threshold level.
What is Inequality or Gini Index in Highlands?
Inequality or Gini Index in Highlands is 0.46.
What is the Total Population of Highlands?
Total Population of Highlands is 7,359.
What is the Total Male Population of Highlands?
Total Male Population of Highlands is 3,637.
What is the Total Female Population of Highlands?
Total Female Population of Highlands is 3,722.
What is the Ratio of Males per 100 Females in Highlands?
There are 97.72 Males per 100 Females in Highlands.
What is the Ratio of Females per 100 Males in Highlands?
There are 102.34 Females per 100 Males in Highlands.
What is the Median Population Age in Highlands?
Median Population Age in Highlands is 34.5 Years.
What is the Average Family Size in Highlands
Average Family Size in Highlands is 3.6 People.
What is the Average Household Size in Highlands
Average Household Size in Highlands is 3.0 People.
How Large is the Labor Force in Highlands?
There are 3,122 People in the Labor Forcein in Highlands.
What is the Percentage of People in the Labor Force in Highlands?
57.0% of People are in the Labor Force in Highlands.
What is the Unemployment Rate in Highlands?
Unemployment Rate in Highlands is 8.0%.