Elgin, TX Map & Demographics
Elgin Map
Elgin Overview
$33,552
PER CAPITA INCOME
$79,762
AVG FAMILY INCOME
$85,014
AVG HOUSEHOLD INCOME
1.0%
WAGE / INCOME GAP [ % ]
99.0¢/ $1
WAGE / INCOME GAP [ $ ]
0.40
INEQUALITY / GINI INDEX
10,043
TOTAL POPULATION
4,792
MALE POPULATION
5,251
FEMALE POPULATION
91.26
MALES / 100 FEMALES
109.58
FEMALES / 100 MALES
36.9
MEDIAN AGE
3.3
AVG FAMILY SIZE
2.9
AVG HOUSEHOLD SIZE
5,621
LABOR FORCE [ PEOPLE ]
71.5%
PERCENT IN LABOR FORCE
6.2%
UNEMPLOYMENT RATE
Elgin Zip Codes
Income in Elgin
Income Overview in Elgin
Per Capita Income in Elgin is $33,552, while median incomes of families and households are $79,762 and $85,014 respectively.
| Characteristic | Number | Measure |
| Per Capita Income | 10,043 | $33,552 |
| Median Family Income | 2,486 | $79,762 |
| Mean Family Income | 2,486 | $92,141 |
| Median Household Income | 3,455 | $85,014 |
| Mean Household Income | 3,455 | $95,406 |
| Income Deficit | 2,486 | $0 |
| Wage / Income Gap (%) | 10,043 | 1.03% |
| Wage / Income Gap ($) | 10,043 | 98.97¢ per $1 |
| Gini / Inequality Index | 10,043 | 0.40 |
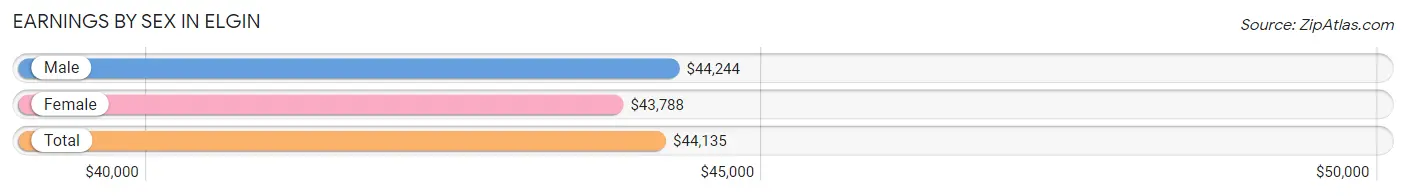
Earnings by Sex in Elgin
Average Earnings in Elgin are $44,135, $44,244 for men and $43,788 for women, a difference of 1.0%.
| Sex | Number | Average Earnings |
| Male | 2,683 (47.7%) | $44,244 |
| Female | 2,944 (52.3%) | $43,788 |
| Total | 5,627 (100.0%) | $44,135 |
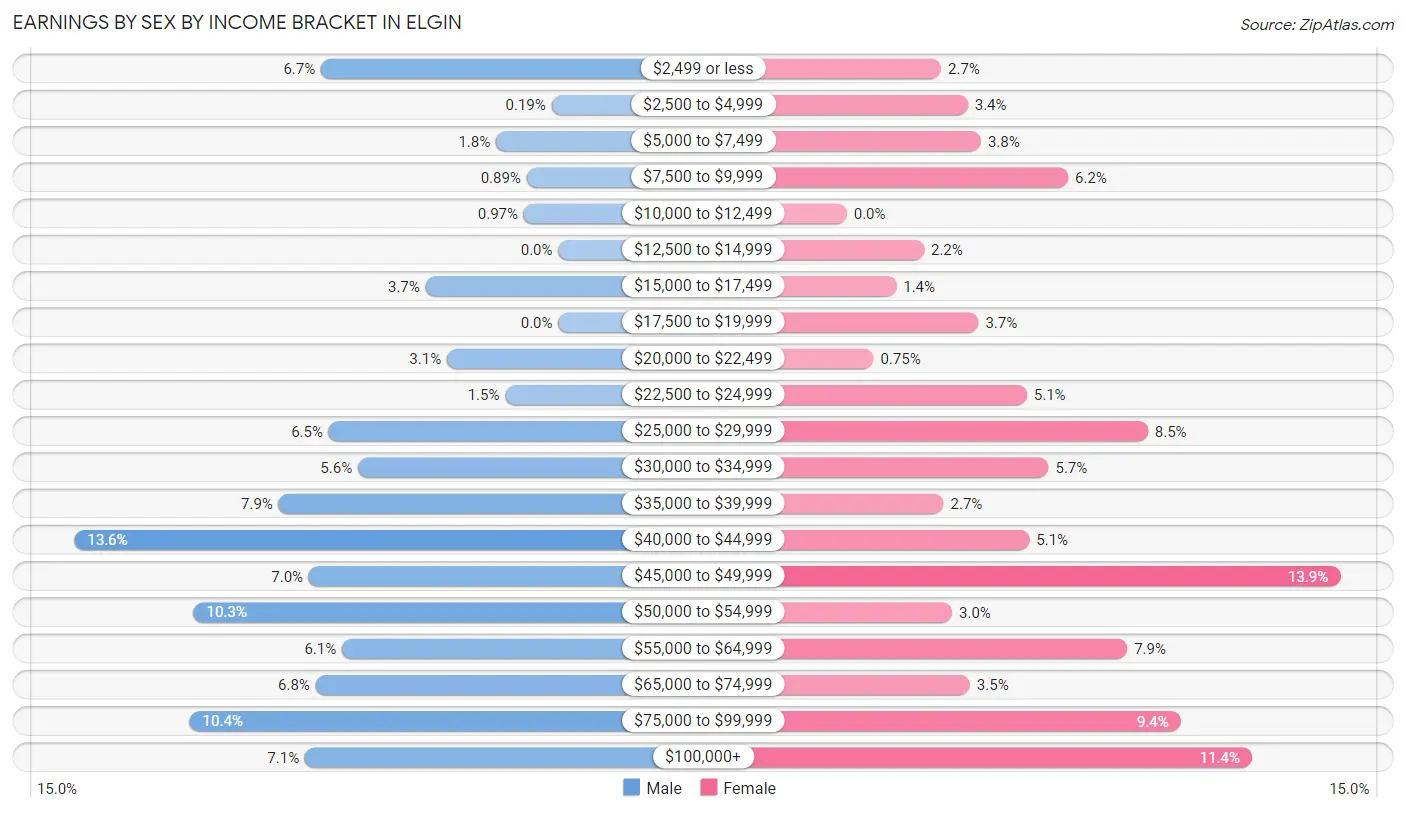
Earnings by Sex by Income Bracket in Elgin
The most common earnings brackets in Elgin are $40,000 to $44,999 for men (365 | 13.6%) and $45,000 to $49,999 for women (408 | 13.9%).
| Income | Male | Female |
| $2,499 or less | 179 (6.7%) | 78 (2.6%) |
| $2,500 to $4,999 | 5 (0.2%) | 100 (3.4%) |
| $5,000 to $7,499 | 47 (1.8%) | 111 (3.8%) |
| $7,500 to $9,999 | 24 (0.9%) | 183 (6.2%) |
| $10,000 to $12,499 | 26 (1.0%) | 0 (0.0%) |
| $12,500 to $14,999 | 0 (0.0%) | 64 (2.2%) |
| $15,000 to $17,499 | 100 (3.7%) | 41 (1.4%) |
| $17,500 to $19,999 | 0 (0.0%) | 109 (3.7%) |
| $20,000 to $22,499 | 84 (3.1%) | 22 (0.7%) |
| $22,500 to $24,999 | 40 (1.5%) | 149 (5.1%) |
| $25,000 to $29,999 | 173 (6.5%) | 249 (8.5%) |
| $30,000 to $34,999 | 151 (5.6%) | 167 (5.7%) |
| $35,000 to $39,999 | 211 (7.9%) | 80 (2.7%) |
| $40,000 to $44,999 | 365 (13.6%) | 151 (5.1%) |
| $45,000 to $49,999 | 188 (7.0%) | 408 (13.9%) |
| $50,000 to $54,999 | 275 (10.2%) | 87 (3.0%) |
| $55,000 to $64,999 | 163 (6.1%) | 232 (7.9%) |
| $65,000 to $74,999 | 183 (6.8%) | 102 (3.5%) |
| $75,000 to $99,999 | 278 (10.4%) | 276 (9.4%) |
| $100,000+ | 191 (7.1%) | 335 (11.4%) |
| Total | 2,683 (100.0%) | 2,944 (100.0%) |
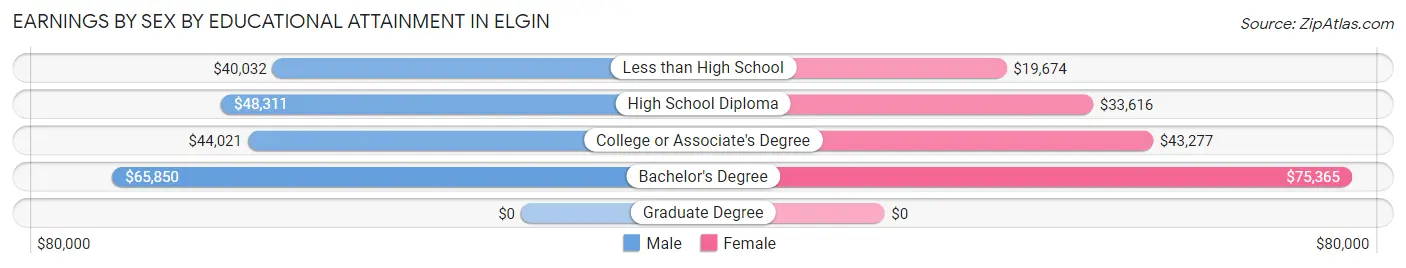
Earnings by Sex by Educational Attainment in Elgin
Average earnings in Elgin are $44,677 for men and $45,466 for women, a difference of 1.7%. Men with an educational attainment of bachelor's degree enjoy the highest average annual earnings of $65,850, while those with less than high school education earn the least with $40,032. Women with an educational attainment of bachelor's degree earn the most with the average annual earnings of $75,365, while those with less than high school education have the smallest earnings of $19,674.
| Educational Attainment | Male Income | Female Income |
| Less than High School | $40,032 | $19,674 |
| High School Diploma | $48,311 | $33,616 |
| College or Associate's Degree | $44,021 | $43,277 |
| Bachelor's Degree | $65,850 | $75,365 |
| Graduate Degree | - | - |
| Total | $44,677 | $45,466 |
Family Income in Elgin
Family Income Brackets in Elgin
According to the Elgin family income data, there are 584 families falling into the $100,000 to $149,999 income range, which is the most common income bracket and makes up 23.5% of all families. Conversely, the $10,000 to $14,999 income bracket is the least frequent group with only 15 families (0.6%) belonging to this category.
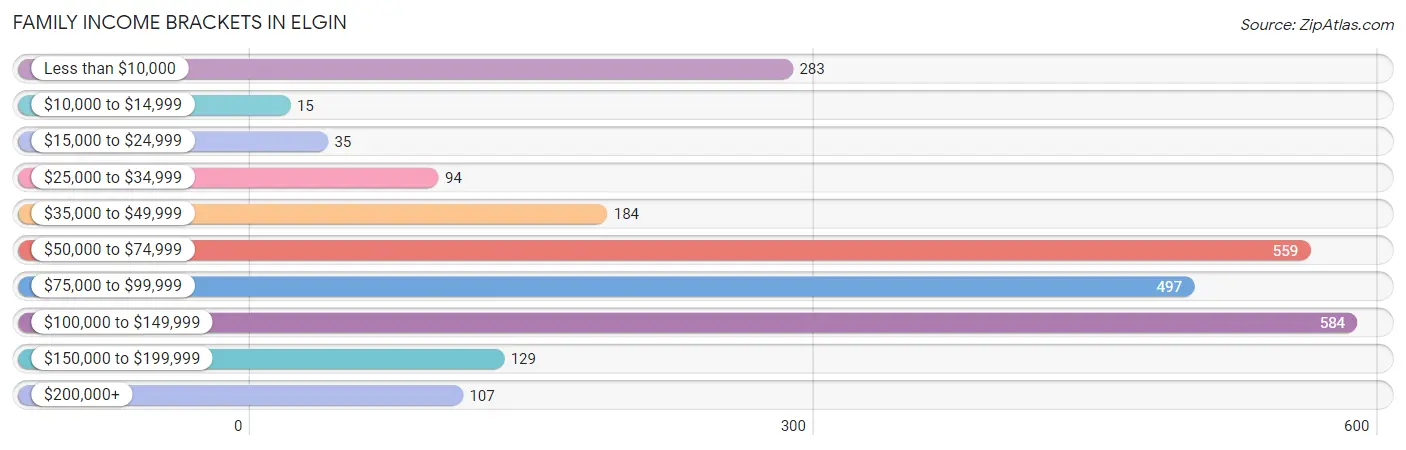
| Income Bracket | # Families | % Families |
| Less than $10,000 | 283 | 11.4% |
| $10,000 to $14,999 | 15 | 0.6% |
| $15,000 to $24,999 | 35 | 1.4% |
| $25,000 to $34,999 | 94 | 3.8% |
| $35,000 to $49,999 | 184 | 7.4% |
| $50,000 to $74,999 | 559 | 22.5% |
| $75,000 to $99,999 | 497 | 20.0% |
| $100,000 to $149,999 | 584 | 23.5% |
| $150,000 to $199,999 | 129 | 5.2% |
| $200,000+ | 107 | 4.3% |
Family Income by Famaliy Size in Elgin
4-person families (451 | 18.1%) account for the highest median family income in Elgin with $116,188 per family, while 2-person families (1,116 | 44.9%) have the highest median income of $36,294 per family member.
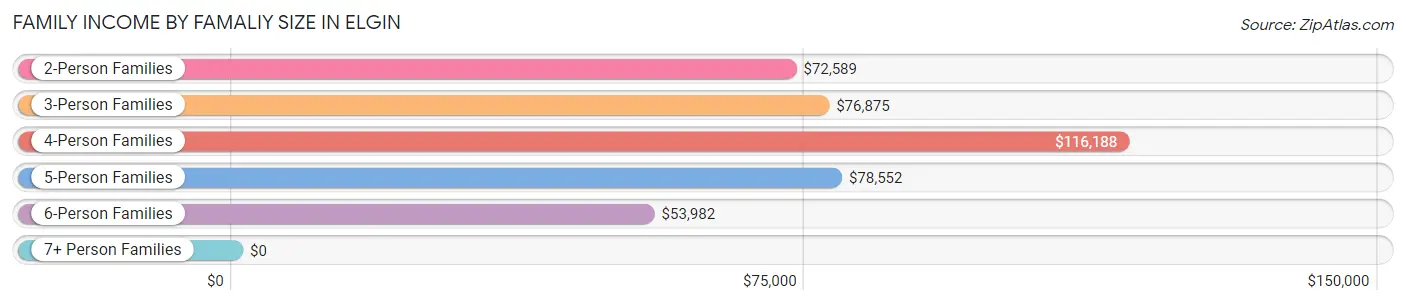
| Income Bracket | # Families | Median Income |
| 2-Person Families | 1,116 (44.9%) | $72,589 |
| 3-Person Families | 452 (18.2%) | $76,875 |
| 4-Person Families | 451 (18.1%) | $116,188 |
| 5-Person Families | 249 (10.0%) | $78,552 |
| 6-Person Families | 189 (7.6%) | $53,982 |
| 7+ Person Families | 29 (1.2%) | $0 |
| Total | 2,486 (100.0%) | $79,762 |
Family Income by Number of Earners in Elgin
The median family income in Elgin is $79,762, with families comprising 3+ earners (310) having the highest median family income of $115,667, while families with no earners (347) have the lowest median family income of $2,499, accounting for 12.5% and 14.0% of families, respectively.
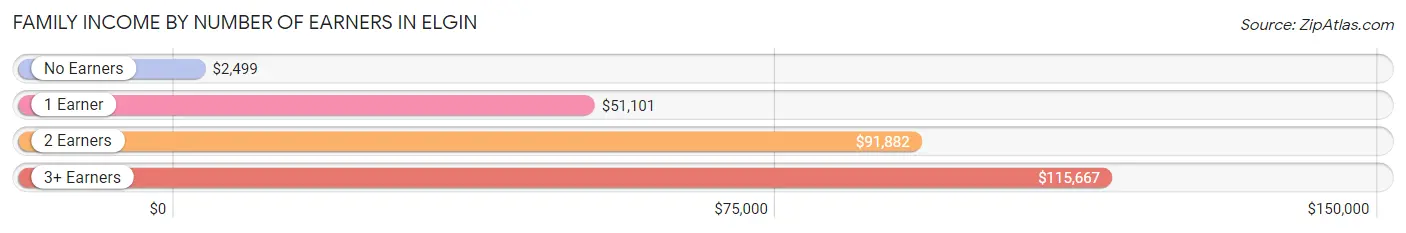
| Number of Earners | # Families | Median Income |
| No Earners | 347 (14.0%) | $2,499 |
| 1 Earner | 545 (21.9%) | $51,101 |
| 2 Earners | 1,284 (51.6%) | $91,882 |
| 3+ Earners | 310 (12.5%) | $115,667 |
| Total | 2,486 (100.0%) | $79,762 |
Household Income in Elgin
Household Income Brackets in Elgin
With 698 households falling in the category, the $100,000 to $149,999 income range is the most frequent in Elgin, accounting for 20.2% of all households. In contrast, only 66 households (1.9%) fall into the $10,000 to $14,999 income bracket, making it the least populous group.
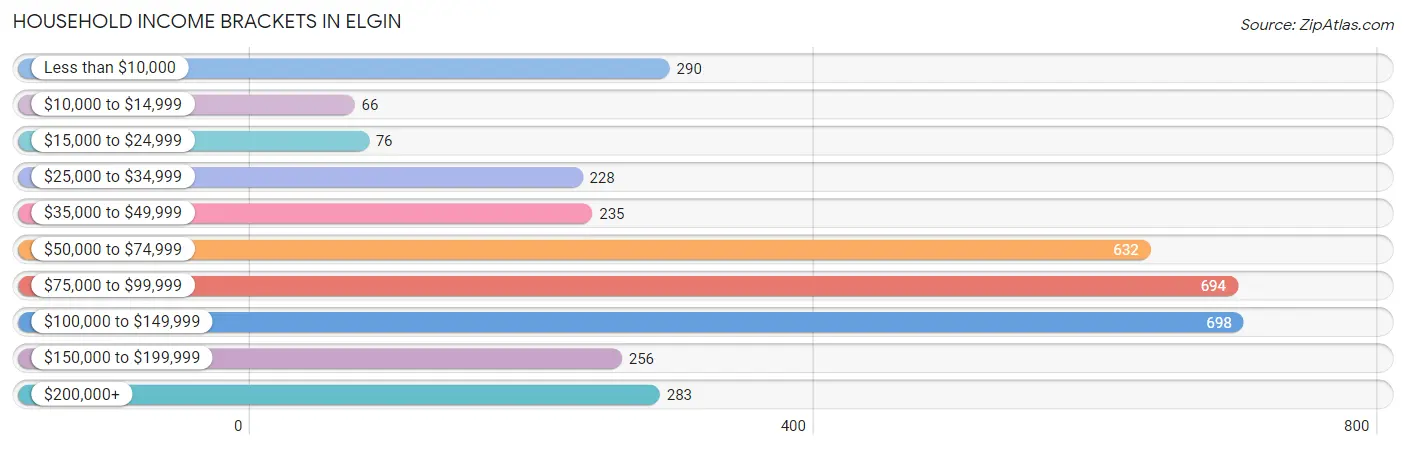
| Income Bracket | # Households | % Households |
| Less than $10,000 | 290 | 8.4% |
| $10,000 to $14,999 | 66 | 1.9% |
| $15,000 to $24,999 | 76 | 2.2% |
| $25,000 to $34,999 | 228 | 6.6% |
| $35,000 to $49,999 | 235 | 6.8% |
| $50,000 to $74,999 | 632 | 18.3% |
| $75,000 to $99,999 | 694 | 20.1% |
| $100,000 to $149,999 | 698 | 20.2% |
| $150,000 to $199,999 | 256 | 7.4% |
| $200,000+ | 283 | 8.2% |
Household Income by Householder Age in Elgin
The median household income in Elgin is $85,014, with the highest median household income of $96,334 found in the 45 to 64 years age bracket for the primary householder. A total of 1,771 households (51.3%) fall into this category. Meanwhile, the 15 to 24 years age bracket for the primary householder has the lowest median household income of $0, with 81 households (2.3%) in this group.
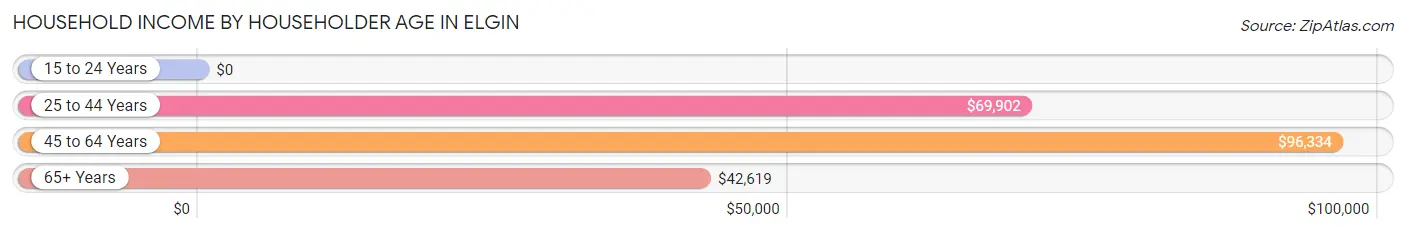
| Income Bracket | # Households | Median Income |
| 15 to 24 Years | 81 (2.3%) | $0 |
| 25 to 44 Years | 1,015 (29.4%) | $69,902 |
| 45 to 64 Years | 1,771 (51.3%) | $96,334 |
| 65+ Years | 588 (17.0%) | $42,619 |
| Total | 3,455 (100.0%) | $85,014 |
Poverty in Elgin
Income Below Poverty by Sex and Age in Elgin
With 10.3% poverty level for males and 10.1% for females among the residents of Elgin, 75 year old and over males and 15 year old females are the most vulnerable to poverty, with 22 males (36.1%) and 59 females (52.7%) in their respective age groups living below the poverty level.
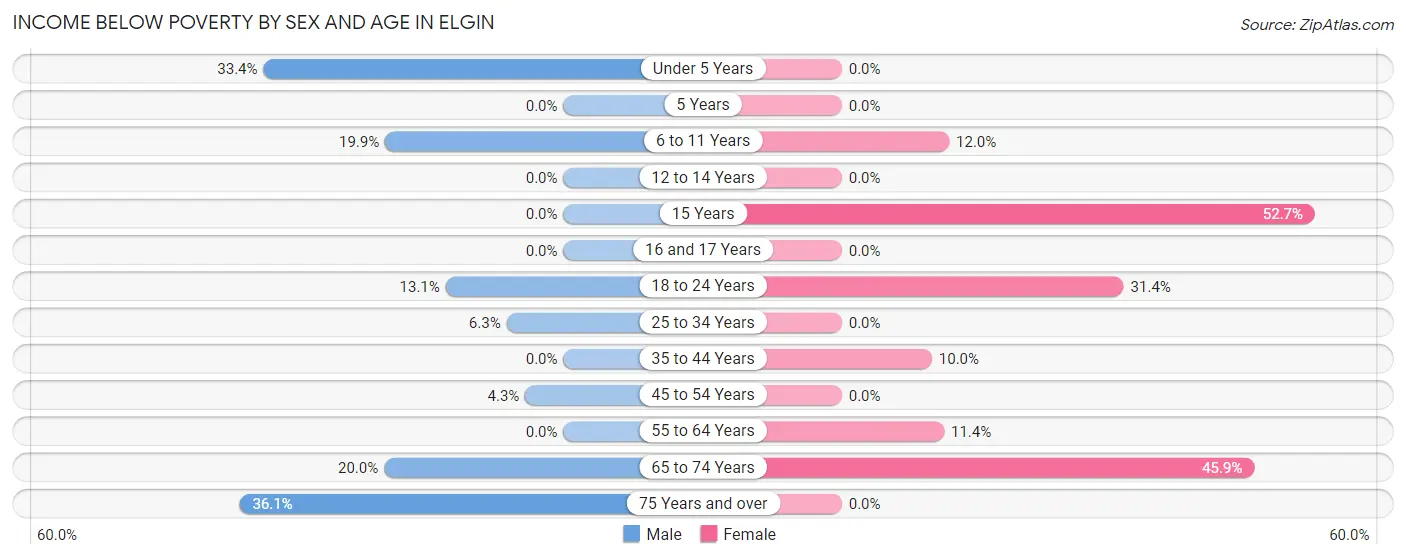
| Age Bracket | Male | Female |
| Under 5 Years | 146 (33.4%) | 0 (0.0%) |
| 5 Years | 0 (0.0%) | 0 (0.0%) |
| 6 to 11 Years | 58 (19.9%) | 52 (11.9%) |
| 12 to 14 Years | 0 (0.0%) | 0 (0.0%) |
| 15 Years | 0 (0.0%) | 59 (52.7%) |
| 16 and 17 Years | 0 (0.0%) | 0 (0.0%) |
| 18 to 24 Years | 81 (13.1%) | 97 (31.4%) |
| 25 to 34 Years | 30 (6.3%) | 0 (0.0%) |
| 35 to 44 Years | 0 (0.0%) | 58 (10.0%) |
| 45 to 54 Years | 25 (4.3%) | 0 (0.0%) |
| 55 to 64 Years | 0 (0.0%) | 96 (11.4%) |
| 65 to 74 Years | 116 (20.0%) | 158 (45.9%) |
| 75 Years and over | 22 (36.1%) | 0 (0.0%) |
| Total | 478 (10.3%) | 520 (10.1%) |
Income Above Poverty by Sex and Age in Elgin
According to the poverty statistics in Elgin, males aged 5 years and females aged under 5 years are the age groups that are most secure financially, with 100.0% of males and 100.0% of females in these age groups living above the poverty line.
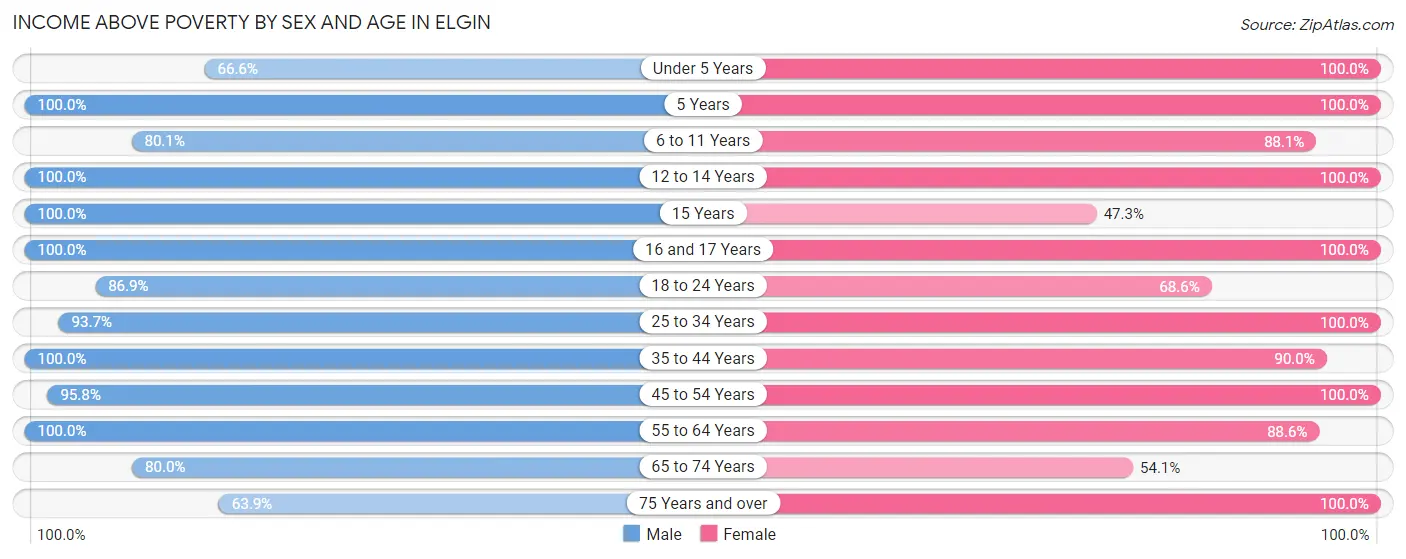
| Age Bracket | Male | Female |
| Under 5 Years | 291 (66.6%) | 98 (100.0%) |
| 5 Years | 127 (100.0%) | 96 (100.0%) |
| 6 to 11 Years | 234 (80.1%) | 383 (88.0%) |
| 12 to 14 Years | 300 (100.0%) | 154 (100.0%) |
| 15 Years | 11 (100.0%) | 53 (47.3%) |
| 16 and 17 Years | 93 (100.0%) | 243 (100.0%) |
| 18 to 24 Years | 537 (86.9%) | 212 (68.6%) |
| 25 to 34 Years | 444 (93.7%) | 838 (100.0%) |
| 35 to 44 Years | 638 (100.0%) | 520 (90.0%) |
| 45 to 54 Years | 563 (95.8%) | 945 (100.0%) |
| 55 to 64 Years | 425 (100.0%) | 747 (88.6%) |
| 65 to 74 Years | 465 (80.0%) | 186 (54.1%) |
| 75 Years and over | 39 (63.9%) | 166 (100.0%) |
| Total | 4,167 (89.7%) | 4,641 (89.9%) |
Income Below Poverty Among Married-Couple Families in Elgin
The poverty statistics for married-couple families in Elgin show that 7.3% or 116 of the total 1,595 families live below the poverty line. Families with no children have the highest poverty rate of 14.5%, comprising of 116 families. On the other hand, families with 1 or 2 children have the lowest poverty rate of 0.0%, which includes 0 families.
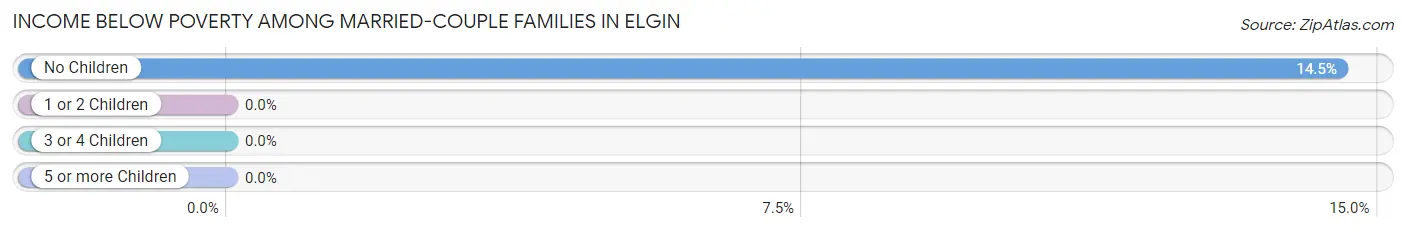
| Children | Above Poverty | Below Poverty |
| No Children | 684 (85.5%) | 116 (14.5%) |
| 1 or 2 Children | 610 (100.0%) | 0 (0.0%) |
| 3 or 4 Children | 185 (100.0%) | 0 (0.0%) |
| 5 or more Children | 0 (0.0%) | 0 (0.0%) |
| Total | 1,479 (92.7%) | 116 (7.3%) |
Income Below Poverty Among Single-Parent Households in Elgin
According to the poverty data in Elgin, 62.3% or 81 single-father households and 13.3% or 101 single-mother households are living below the poverty line. Among single-father households, those with 1 or 2 children have the highest poverty rate, with 81 households (70.4%) experiencing poverty. Likewise, among single-mother households, those with 3 or 4 children have the highest poverty rate, with 58 households (45.3%) falling below the poverty line.
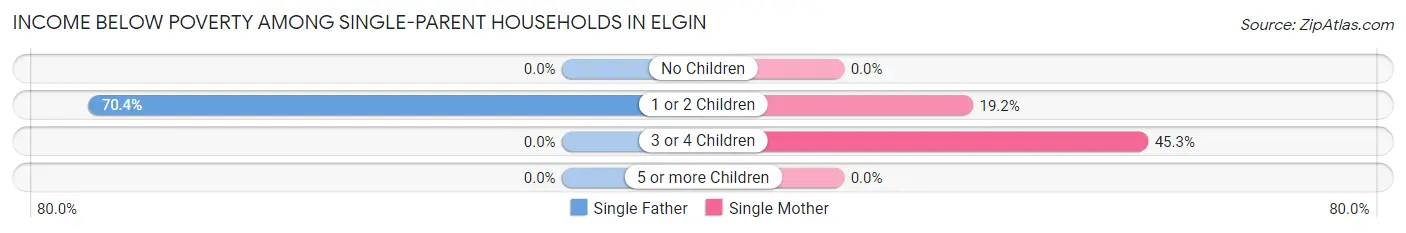
| Children | Single Father | Single Mother |
| No Children | 0 (0.0%) | 0 (0.0%) |
| 1 or 2 Children | 81 (70.4%) | 43 (19.2%) |
| 3 or 4 Children | 0 (0.0%) | 58 (45.3%) |
| 5 or more Children | 0 (0.0%) | 0 (0.0%) |
| Total | 81 (62.3%) | 101 (13.3%) |
Income Below Poverty Among Married-Couple vs Single-Parent Households in Elgin
The poverty data for Elgin shows that 116 of the married-couple family households (7.3%) and 182 of the single-parent households (20.4%) are living below the poverty level. Within the married-couple family households, those with no children have the highest poverty rate, with 116 households (14.5%) falling below the poverty line. Among the single-parent households, those with 3 or 4 children have the highest poverty rate, with 58 household (45.3%) living below poverty.
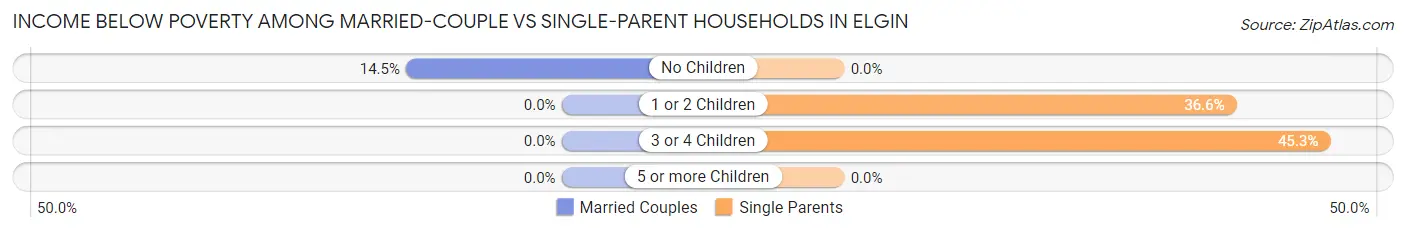
| Children | Married-Couple Families | Single-Parent Households |
| No Children | 116 (14.5%) | 0 (0.0%) |
| 1 or 2 Children | 0 (0.0%) | 124 (36.6%) |
| 3 or 4 Children | 0 (0.0%) | 58 (45.3%) |
| 5 or more Children | 0 (0.0%) | 0 (0.0%) |
| Total | 116 (7.3%) | 182 (20.4%) |
Race in Elgin
The most populous races in Elgin are Hispanic or Latino (5,304 | 52.8%), White / Caucasian (5,018 | 50.0%), and Some other Race (2,310 | 23.0%).
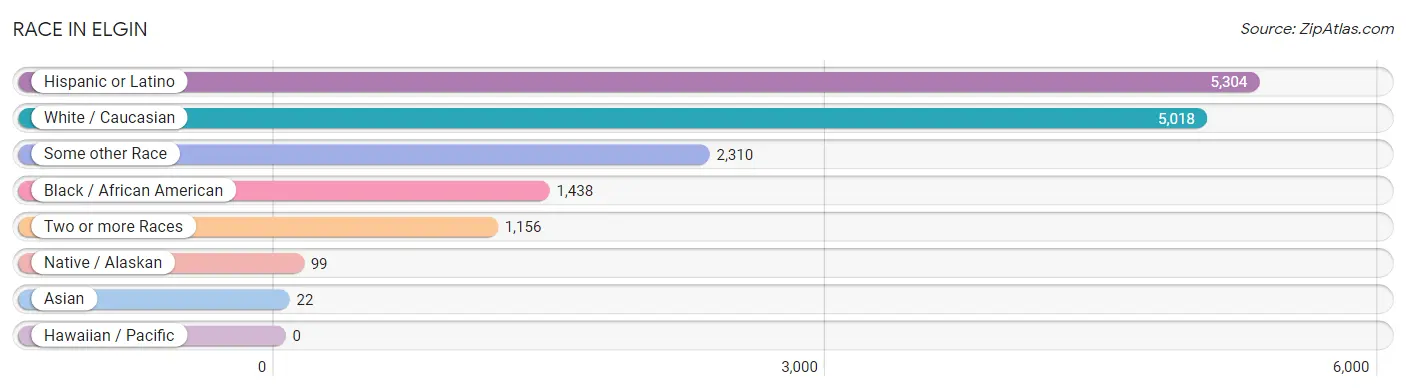
| Race | # Population | % Population |
| Asian | 22 | 0.2% |
| Black / African American | 1,438 | 14.3% |
| Hawaiian / Pacific | 0 | 0.0% |
| Hispanic or Latino | 5,304 | 52.8% |
| Native / Alaskan | 99 | 1.0% |
| White / Caucasian | 5,018 | 50.0% |
| Two or more Races | 1,156 | 11.5% |
| Some other Race | 2,310 | 23.0% |
| Total | 10,043 | 100.0% |
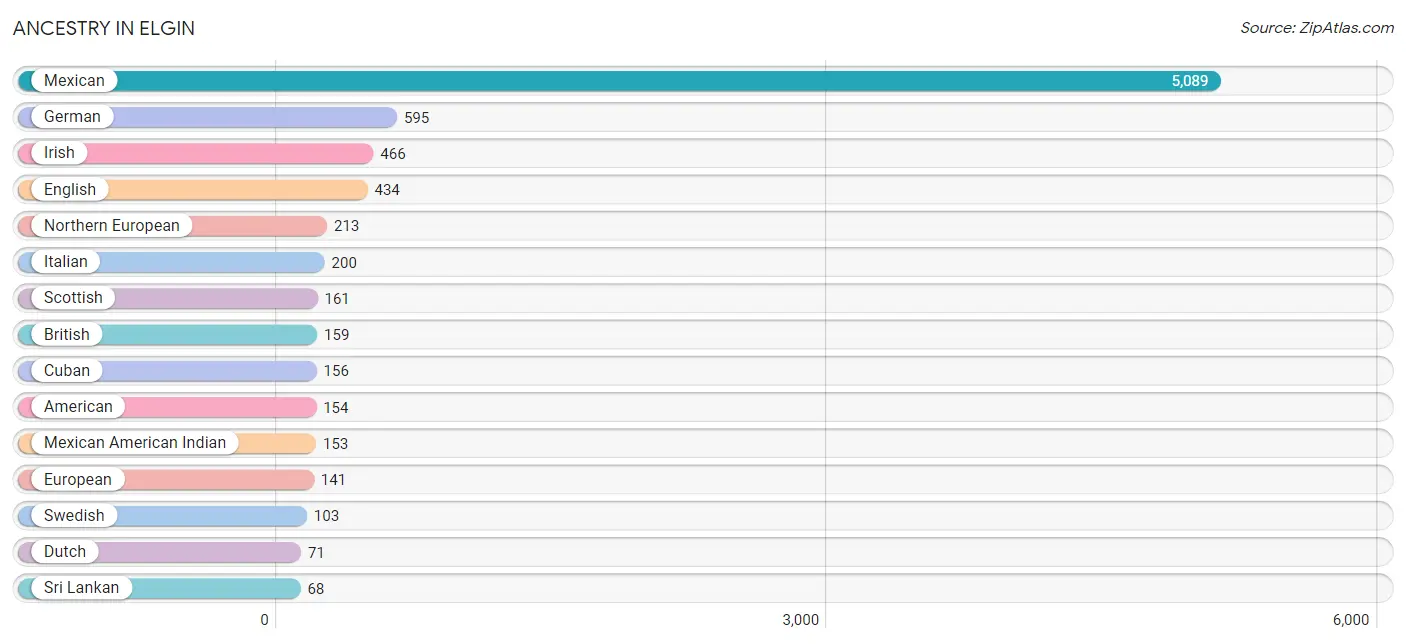
Ancestry in Elgin
The most populous ancestries reported in Elgin are Mexican (5,089 | 50.7%), German (595 | 5.9%), Irish (466 | 4.6%), English (434 | 4.3%), and Northern European (213 | 2.1%), together accounting for 67.7% of all Elgin residents.
| Ancestry | # Population | % Population |
| American | 154 | 1.5% |
| British | 159 | 1.6% |
| Burmese | 17 | 0.2% |
| Central American | 8 | 0.1% |
| Creek | 5 | 0.1% |
| Cuban | 156 | 1.5% |
| Czech | 18 | 0.2% |
| Czechoslovakian | 11 | 0.1% |
| Danish | 18 | 0.2% |
| Dutch | 71 | 0.7% |
| Eastern European | 63 | 0.6% |
| English | 434 | 4.3% |
| European | 141 | 1.4% |
| French | 55 | 0.5% |
| French Canadian | 20 | 0.2% |
| German | 595 | 5.9% |
| Greek | 15 | 0.2% |
| Guatemalan | 3 | 0.0% |
| Irish | 466 | 4.6% |
| Italian | 200 | 2.0% |
| Jamaican | 22 | 0.2% |
| Mexican | 5,089 | 50.7% |
| Mexican American Indian | 153 | 1.5% |
| Nicaraguan | 5 | 0.1% |
| Northern European | 213 | 2.1% |
| Norwegian | 54 | 0.5% |
| Peruvian | 10 | 0.1% |
| Polish | 59 | 0.6% |
| Portuguese | 9 | 0.1% |
| Russian | 67 | 0.7% |
| Scotch-Irish | 35 | 0.4% |
| Scottish | 161 | 1.6% |
| Slovene | 19 | 0.2% |
| South American | 10 | 0.1% |
| Spaniard | 13 | 0.1% |
| Spanish | 17 | 0.2% |
| Sri Lankan | 68 | 0.7% |
| Swedish | 103 | 1.0% |
| Welsh | 62 | 0.6% | View All 39 Rows |
Immigrants in Elgin
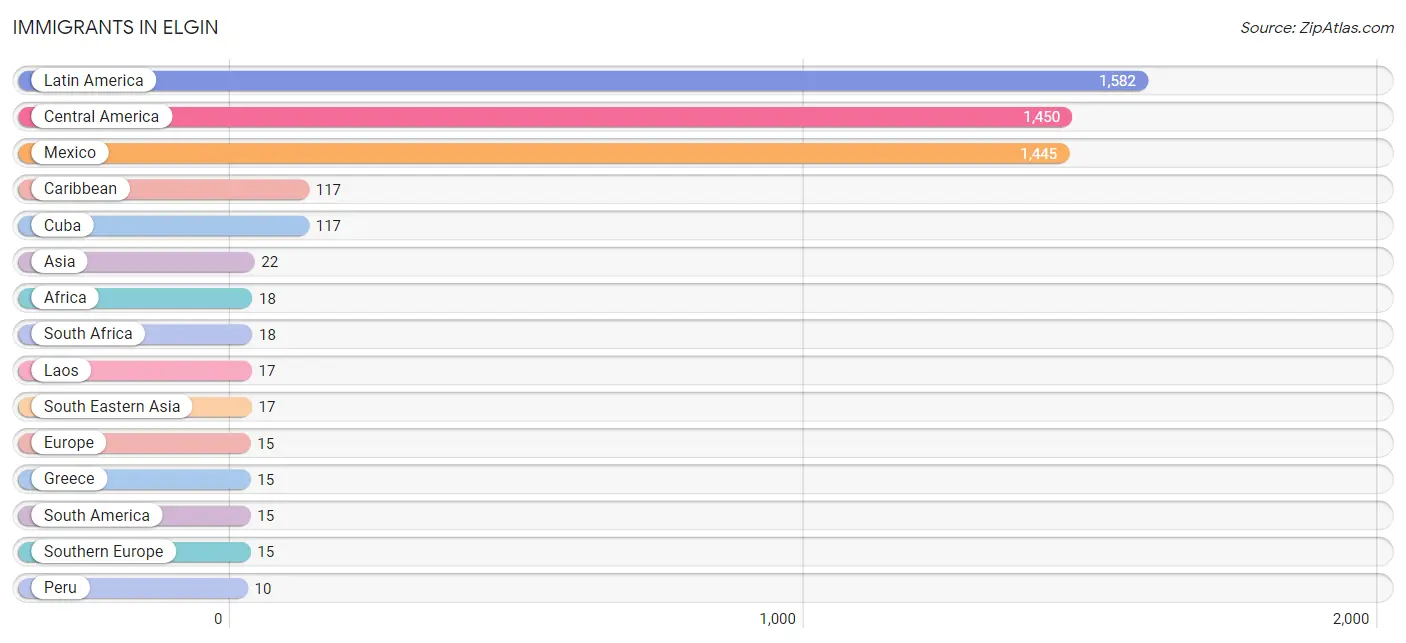
The most numerous immigrant groups reported in Elgin came from Latin America (1,582 | 15.8%), Central America (1,450 | 14.4%), Mexico (1,445 | 14.4%), Caribbean (117 | 1.2%), and Cuba (117 | 1.2%), together accounting for 46.9% of all Elgin residents.
| Immigration Origin | # Population | % Population |
| Africa | 18 | 0.2% |
| Asia | 22 | 0.2% |
| Caribbean | 117 | 1.2% |
| Central America | 1,450 | 14.4% |
| Cuba | 117 | 1.2% |
| Eastern Asia | 5 | 0.1% |
| Europe | 15 | 0.2% |
| Greece | 15 | 0.2% |
| Korea | 5 | 0.1% |
| Laos | 17 | 0.2% |
| Latin America | 1,582 | 15.8% |
| Mexico | 1,445 | 14.4% |
| Nicaragua | 5 | 0.1% |
| Peru | 10 | 0.1% |
| South Africa | 18 | 0.2% |
| South America | 15 | 0.2% |
| South Eastern Asia | 17 | 0.2% |
| Southern Europe | 15 | 0.2% |
| Venezuela | 5 | 0.1% | View All 19 Rows |
Sex and Age in Elgin
Sex and Age in Elgin
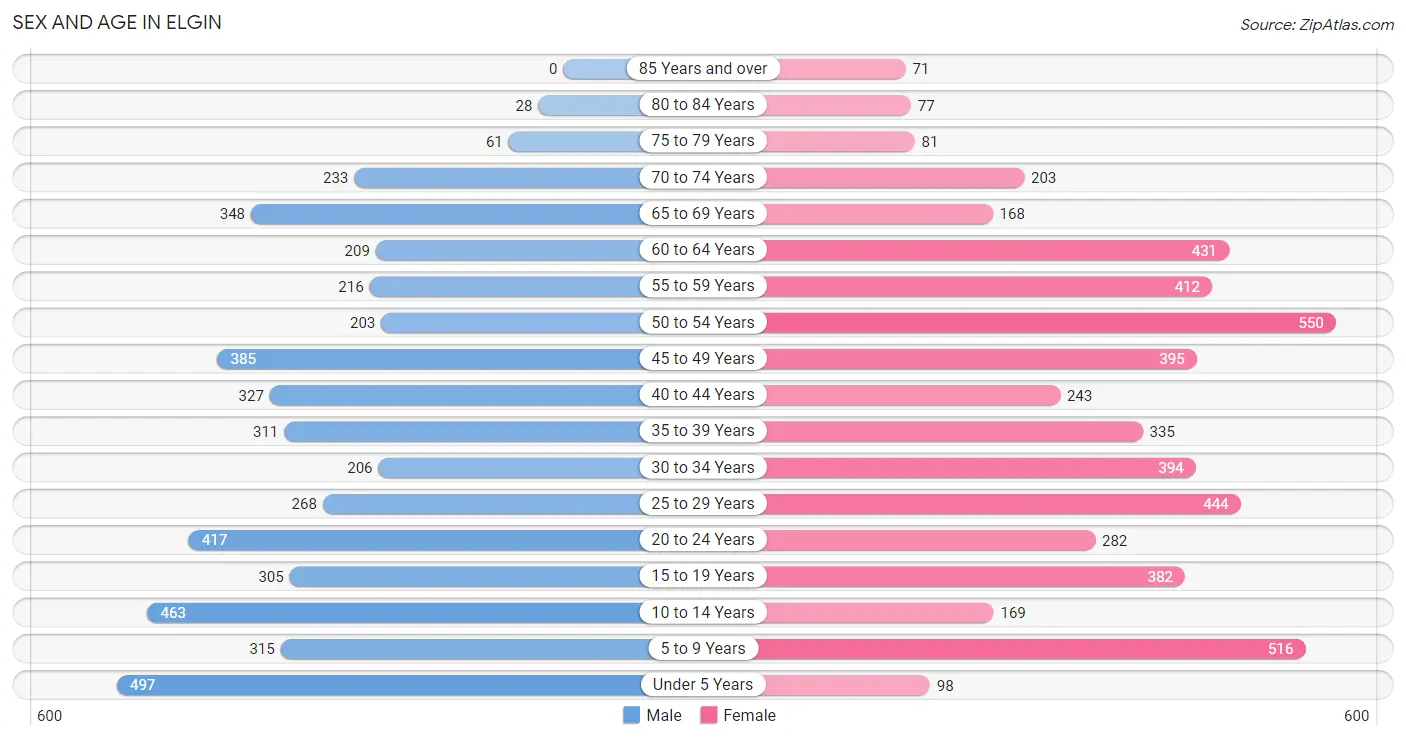
The most populous age groups in Elgin are Under 5 Years (497 | 10.4%) for men and 50 to 54 Years (550 | 10.5%) for women.
| Age Bracket | Male | Female |
| Under 5 Years | 497 (10.4%) | 98 (1.9%) |
| 5 to 9 Years | 315 (6.6%) | 516 (9.8%) |
| 10 to 14 Years | 463 (9.7%) | 169 (3.2%) |
| 15 to 19 Years | 305 (6.4%) | 382 (7.3%) |
| 20 to 24 Years | 417 (8.7%) | 282 (5.4%) |
| 25 to 29 Years | 268 (5.6%) | 444 (8.5%) |
| 30 to 34 Years | 206 (4.3%) | 394 (7.5%) |
| 35 to 39 Years | 311 (6.5%) | 335 (6.4%) |
| 40 to 44 Years | 327 (6.8%) | 243 (4.6%) |
| 45 to 49 Years | 385 (8.0%) | 395 (7.5%) |
| 50 to 54 Years | 203 (4.2%) | 550 (10.5%) |
| 55 to 59 Years | 216 (4.5%) | 412 (7.9%) |
| 60 to 64 Years | 209 (4.4%) | 431 (8.2%) |
| 65 to 69 Years | 348 (7.3%) | 168 (3.2%) |
| 70 to 74 Years | 233 (4.9%) | 203 (3.9%) |
| 75 to 79 Years | 61 (1.3%) | 81 (1.5%) |
| 80 to 84 Years | 28 (0.6%) | 77 (1.5%) |
| 85 Years and over | 0 (0.0%) | 71 (1.3%) |
| Total | 4,792 (100.0%) | 5,251 (100.0%) |
Families and Households in Elgin
Median Family Size in Elgin
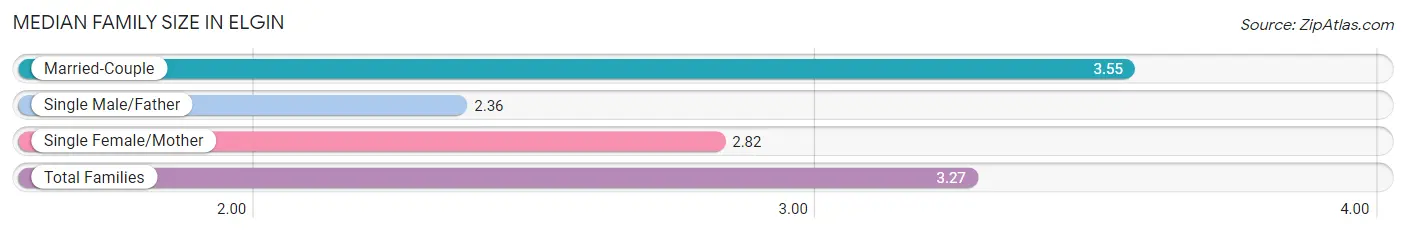
The median family size in Elgin is 3.27 persons per family, with married-couple families (1,595 | 64.2%) accounting for the largest median family size of 3.55 persons per family. On the other hand, single male/father families (130 | 5.2%) represent the smallest median family size with 2.36 persons per family.
| Family Type | # Families | Family Size |
| Married-Couple | 1,595 (64.2%) | 3.55 |
| Single Male/Father | 130 (5.2%) | 2.36 |
| Single Female/Mother | 761 (30.6%) | 2.82 |
| Total Families | 2,486 (100.0%) | 3.27 |
Median Household Size in Elgin
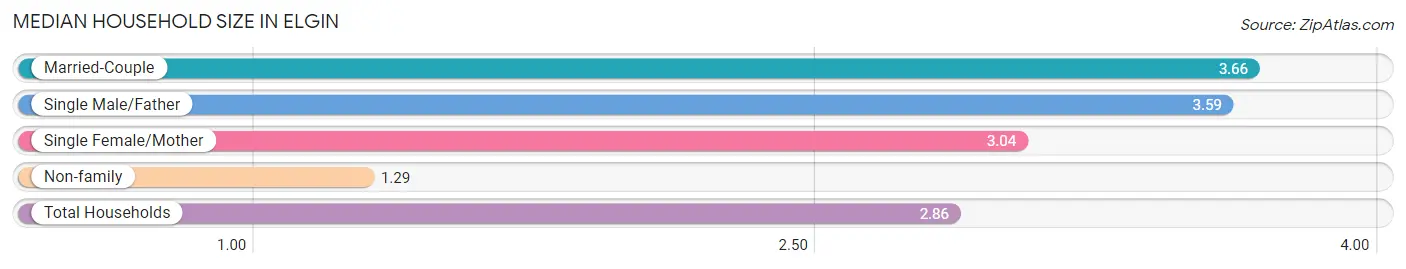
The median household size in Elgin is 2.86 persons per household, with married-couple households (1,595 | 46.2%) accounting for the largest median household size of 3.66 persons per household. non-family households (969 | 28.1%) represent the smallest median household size with 1.29 persons per household.
| Household Type | # Households | Household Size |
| Married-Couple | 1,595 (46.2%) | 3.66 |
| Single Male/Father | 130 (3.8%) | 3.59 |
| Single Female/Mother | 761 (22.0%) | 3.04 |
| Non-family | 969 (28.1%) | 1.29 |
| Total Households | 3,455 (100.0%) | 2.86 |
Household Size by Marriage Status in Elgin
Out of a total of 3,455 households in Elgin, 2,486 (72.0%) are family households, while 969 (28.1%) are nonfamily households. The most numerous type of family households are 2-person households, comprising 1,014, and the most common type of nonfamily households are 1-person households, comprising 759.
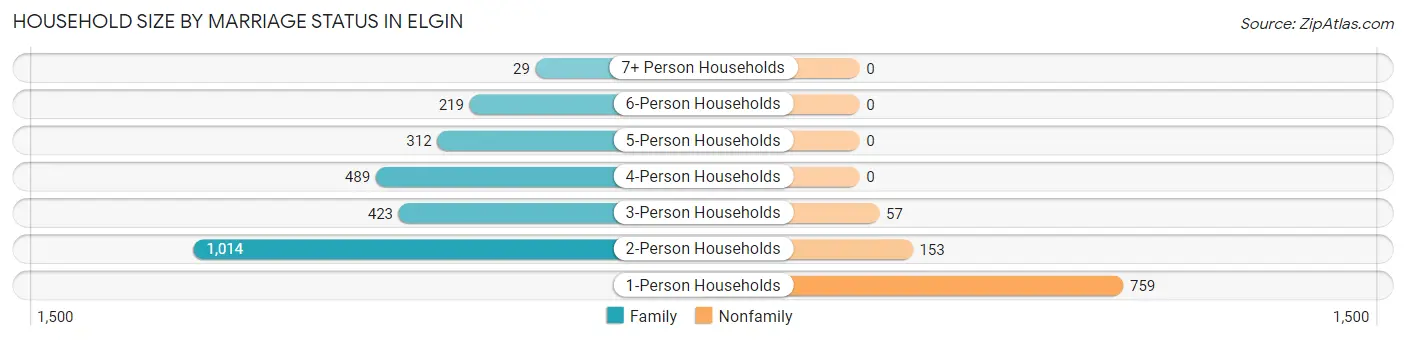
| Household Size | Family Households | Nonfamily Households |
| 1-Person Households | - | 759 (22.0%) |
| 2-Person Households | 1,014 (29.3%) | 153 (4.4%) |
| 3-Person Households | 423 (12.2%) | 57 (1.7%) |
| 4-Person Households | 489 (14.1%) | 0 (0.0%) |
| 5-Person Households | 312 (9.0%) | 0 (0.0%) |
| 6-Person Households | 219 (6.3%) | 0 (0.0%) |
| 7+ Person Households | 29 (0.8%) | 0 (0.0%) |
| Total | 2,486 (72.0%) | 969 (28.1%) |
Female Fertility in Elgin
Fertility by Age in Elgin
Average fertility rate in Elgin is 19.0 births per 1,000 women. Women in the age bracket of 20 to 34 years have the highest fertility rate with 29.0 births per 1,000 women. Women in the age bracket of 20 to 34 years acount for 65.3% of all women with births.
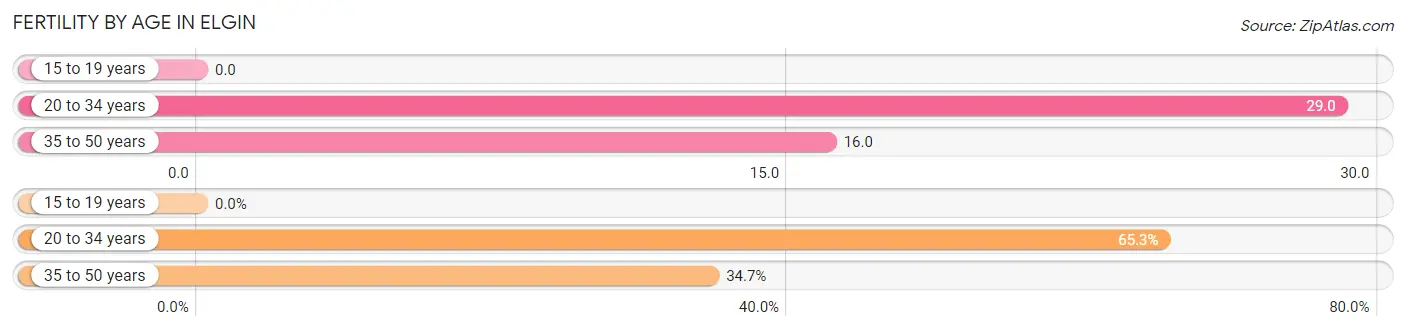
| Age Bracket | Women with Births | Births / 1,000 Women |
| 15 to 19 years | 0 (0.0%) | 0.0 |
| 20 to 34 years | 32 (65.3%) | 29.0 |
| 35 to 50 years | 17 (34.7%) | 16.0 |
| Total | 49 (100.0%) | 19.0 |
Fertility by Age by Marriage Status in Elgin
65.3% of women with births (49) in Elgin are married. The highest percentage of unmarried women with births falls into 35 to 50 years age bracket with 100.0% of them unmarried at the time of birth, while the lowest percentage of unmarried women with births belong to 20 to 34 years age bracket with 0.0% of them unmarried.
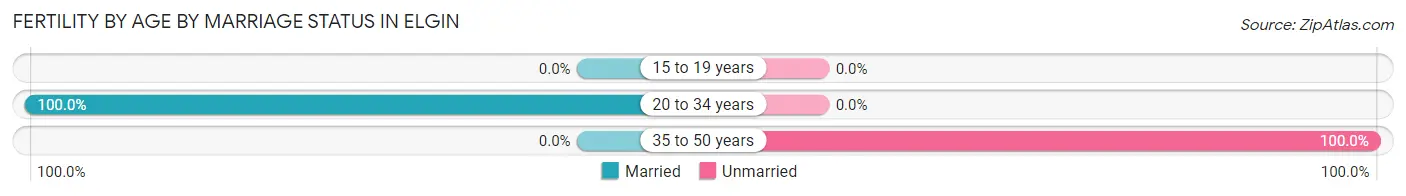
| Age Bracket | Married | Unmarried |
| 15 to 19 years | 0 (0.0%) | 0 (0.0%) |
| 20 to 34 years | 32 (100.0%) | 0 (0.0%) |
| 35 to 50 years | 0 (0.0%) | 17 (100.0%) |
| Total | 32 (65.3%) | 17 (34.7%) |
Fertility by Education in Elgin
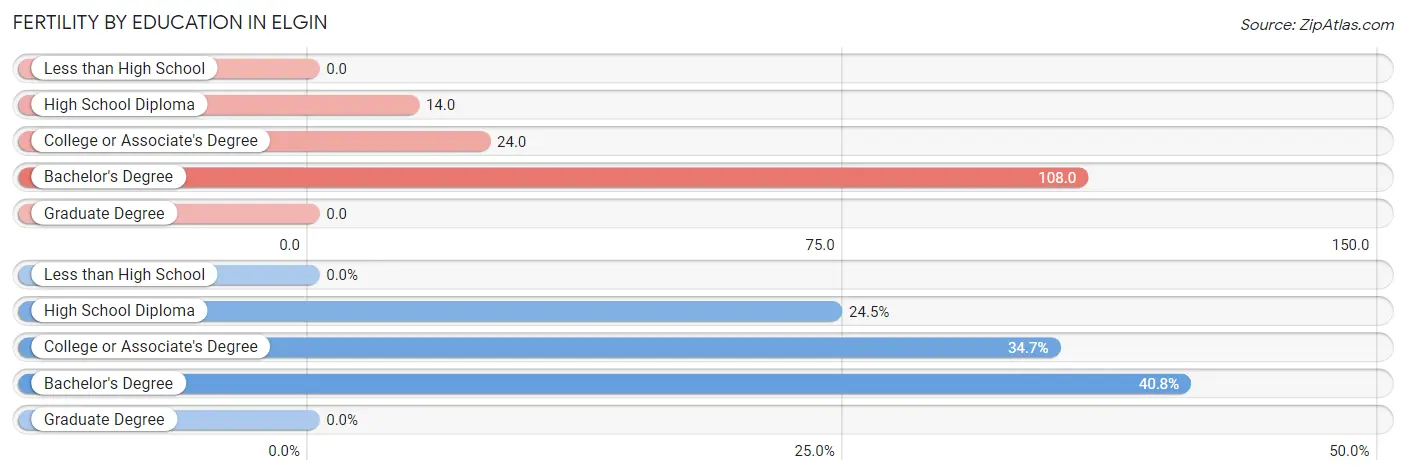
| Educational Attainment | Women with Births | Births / 1,000 Women |
| Less than High School | 0 (0.0%) | 0.0 |
| High School Diploma | 12 (24.5%) | 14.0 |
| College or Associate's Degree | 17 (34.7%) | 24.0 |
| Bachelor's Degree | 20 (40.8%) | 108.0 |
| Graduate Degree | 0 (0.0%) | 0.0 |
| Total | 49 (100.0%) | 19.0 |
Fertility by Education by Marriage Status in Elgin
34.7% of women with births in Elgin are unmarried. Women with the educational attainment of high school diploma are most likely to be married with 100.0% of them married at childbirth, while women with the educational attainment of college or associate's degree are least likely to be married with 100.0% of them unmarried at childbirth.
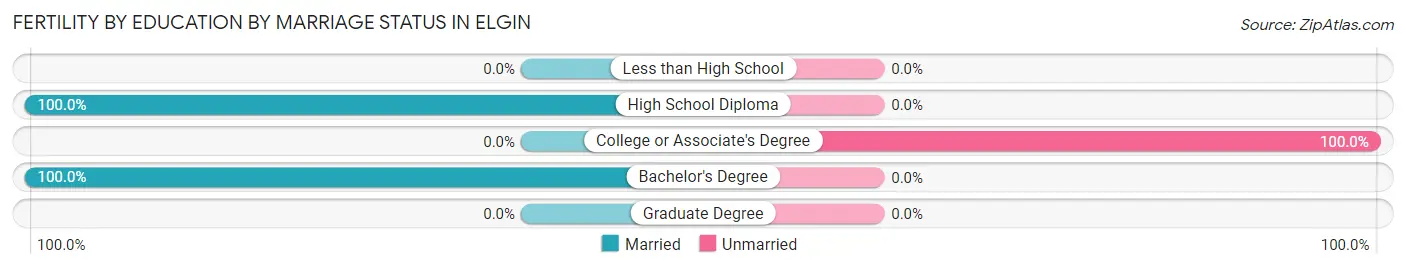
| Educational Attainment | Married | Unmarried |
| Less than High School | 0 (0.0%) | 0 (0.0%) |
| High School Diploma | 12 (100.0%) | 0 (0.0%) |
| College or Associate's Degree | 0 (0.0%) | 17 (100.0%) |
| Bachelor's Degree | 20 (100.0%) | 0 (0.0%) |
| Graduate Degree | 0 (0.0%) | 0 (0.0%) |
| Total | 32 (65.3%) | 17 (34.7%) |
Employment Characteristics in Elgin
Employment by Class of Employer in Elgin
Among the 5,236 employed individuals in Elgin, private company employees (3,426 | 65.4%), state government employees (651 | 12.4%), and local government employees (487 | 9.3%) make up the most common classes of employment.
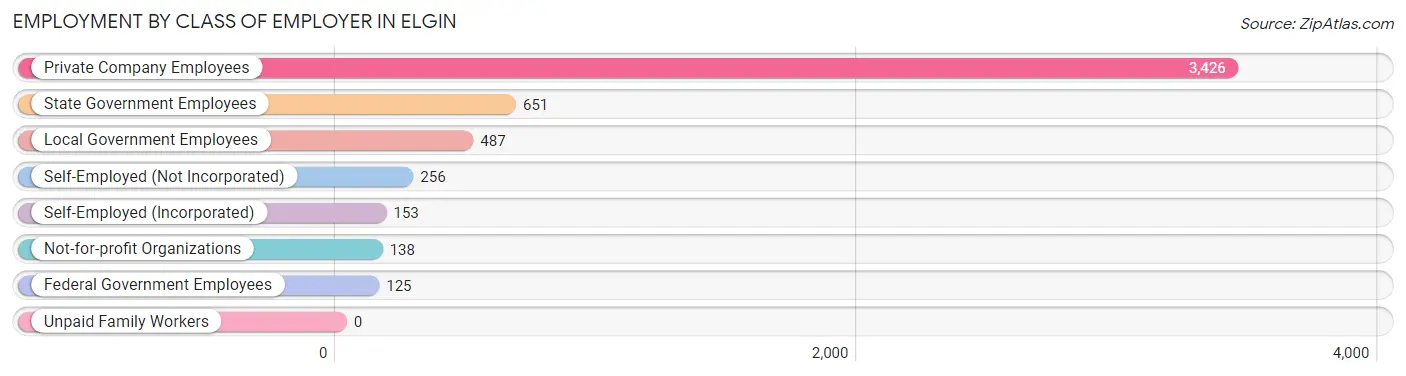
| Employer Class | # Employees | % Employees |
| Private Company Employees | 3,426 | 65.4% |
| Self-Employed (Incorporated) | 153 | 2.9% |
| Self-Employed (Not Incorporated) | 256 | 4.9% |
| Not-for-profit Organizations | 138 | 2.6% |
| Local Government Employees | 487 | 9.3% |
| State Government Employees | 651 | 12.4% |
| Federal Government Employees | 125 | 2.4% |
| Unpaid Family Workers | 0 | 0.0% |
| Total | 5,236 | 100.0% |
Employment Status by Age in Elgin
According to the labor force statistics for Elgin, out of the total population over 16 years of age (7,862), 71.5% or 5,621 individuals are in the labor force, with 6.2% or 349 of them unemployed. The age group with the highest labor force participation rate is 30 to 34 years, with 97.8% or 587 individuals in the labor force. Within the labor force, the 16 to 19 years age range has the highest percentage of unemployed individuals, with 55.2% or 138 of them being unemployed.
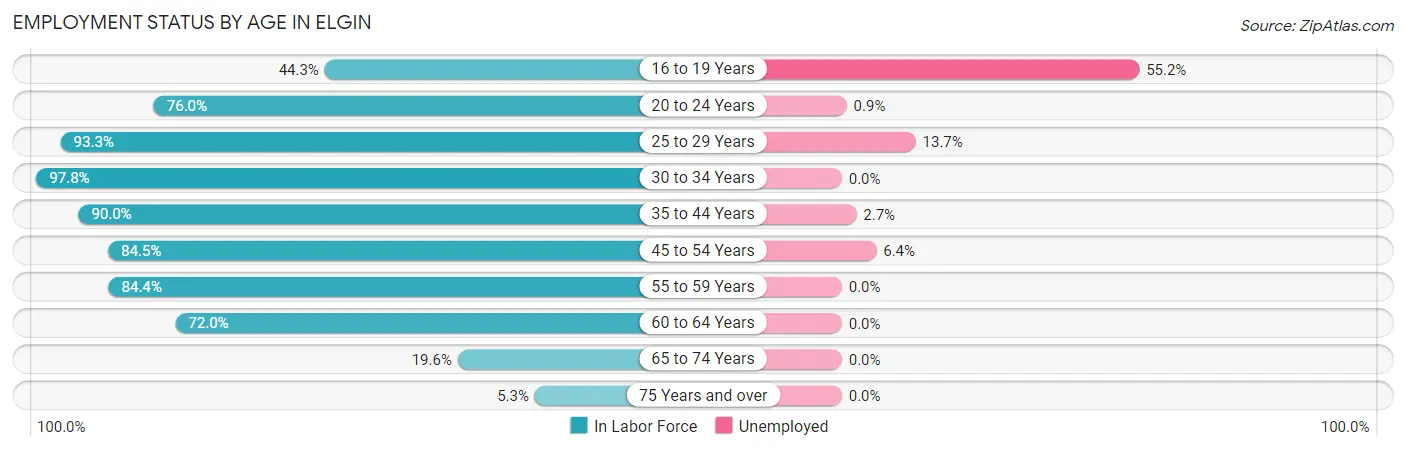
| Age Bracket | In Labor Force | Unemployed |
| 16 to 19 Years | 250 (44.3%) | 138 (55.2%) |
| 20 to 24 Years | 531 (76.0%) | 5 (0.9%) |
| 25 to 29 Years | 664 (93.3%) | 91 (13.7%) |
| 30 to 34 Years | 587 (97.8%) | 0 (0.0%) |
| 35 to 44 Years | 1,094 (90.0%) | 30 (2.7%) |
| 45 to 54 Years | 1,295 (84.5%) | 83 (6.4%) |
| 55 to 59 Years | 530 (84.4%) | 0 (0.0%) |
| 60 to 64 Years | 461 (72.0%) | 0 (0.0%) |
| 65 to 74 Years | 187 (19.6%) | 0 (0.0%) |
| 75 Years and over | 17 (5.3%) | 0 (0.0%) |
| Total | 5,621 (71.5%) | 349 (6.2%) |
Employment Status by Educational Attainment in Elgin
According to labor force statistics for Elgin, 86.9% of individuals (4,631) out of the total population between 25 and 64 years of age (5,329) are in the labor force, with 4.4% or 204 of them being unemployed. The group with the highest labor force participation rate are those with the educational attainment of bachelor's degree or higher, with 96.3% or 934 individuals in the labor force. Within the labor force, individuals with high school diploma education have the highest percentage of unemployment, with 7.2% or 123 of them being unemployed.
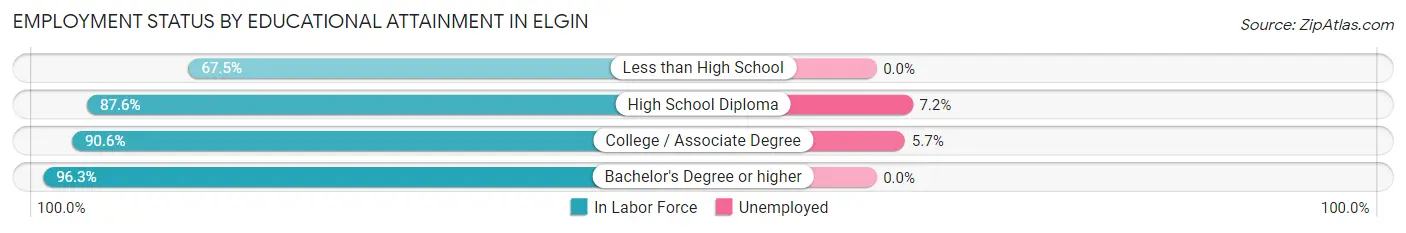
| Educational Attainment | In Labor Force | Unemployed |
| Less than High School | 562 (67.5%) | 0 (0.0%) |
| High School Diploma | 1,706 (87.6%) | 140 (7.2%) |
| College / Associate Degree | 1,431 (90.6%) | 90 (5.7%) |
| Bachelor's Degree or higher | 934 (96.3%) | 0 (0.0%) |
| Total | 4,631 (86.9%) | 234 (4.4%) |
Employment Occupations by Sex in Elgin
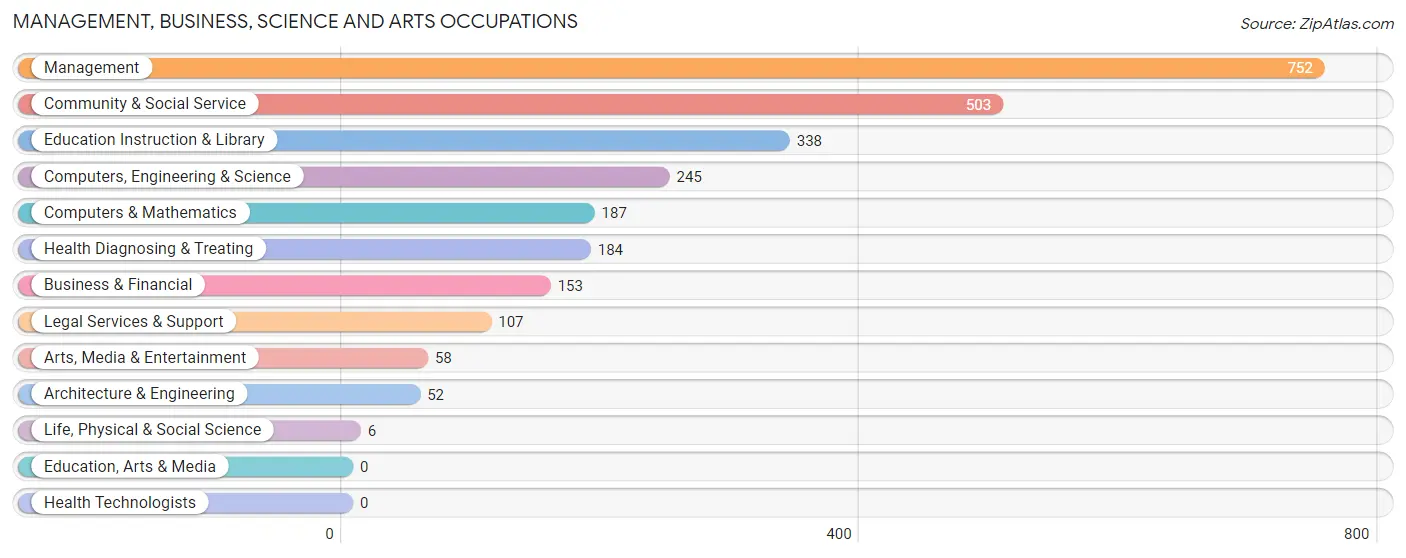
Management, Business, Science and Arts Occupations
The most common Management, Business, Science and Arts occupations in Elgin are Management (752 | 14.3%), Community & Social Service (503 | 9.5%), Education Instruction & Library (338 | 6.4%), Computers, Engineering & Science (245 | 4.6%), and Computers & Mathematics (187 | 3.5%).
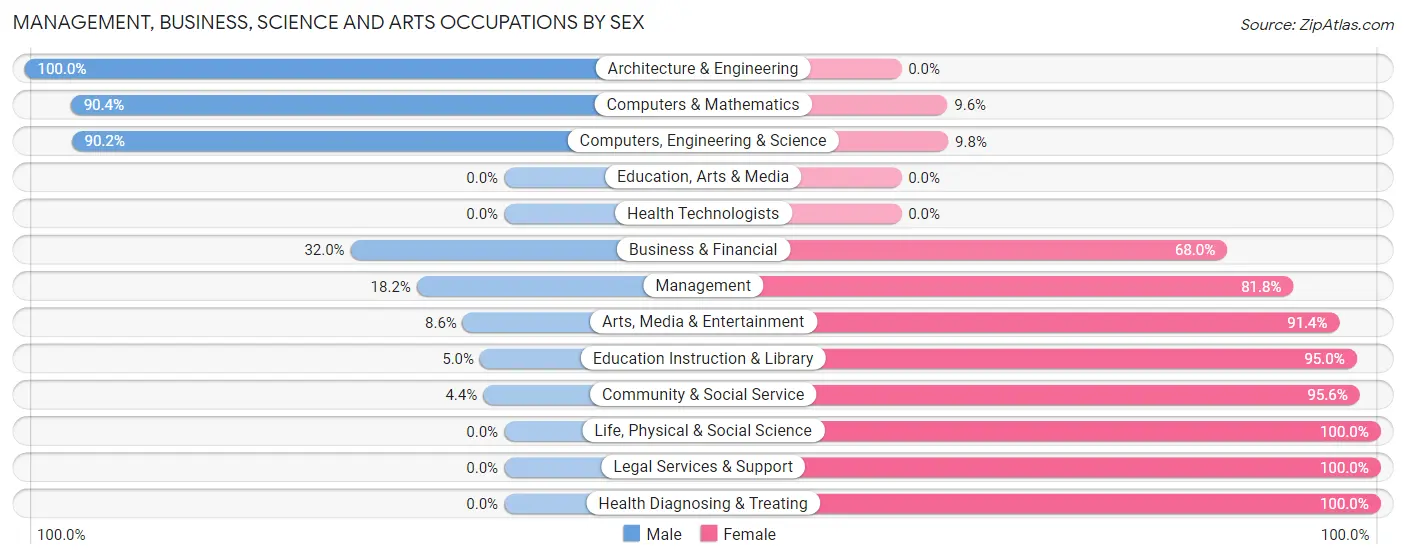
Management, Business, Science and Arts Occupations by Sex
Within the Management, Business, Science and Arts occupations in Elgin, the most male-oriented occupations are Architecture & Engineering (100.0%), Computers & Mathematics (90.4%), and Computers, Engineering & Science (90.2%), while the most female-oriented occupations are Life, Physical & Social Science (100.0%), Legal Services & Support (100.0%), and Health Diagnosing & Treating (100.0%).
| Occupation | Male | Female |
| Management | 137 (18.2%) | 615 (81.8%) |
| Business & Financial | 49 (32.0%) | 104 (68.0%) |
| Computers, Engineering & Science | 221 (90.2%) | 24 (9.8%) |
| Computers & Mathematics | 169 (90.4%) | 18 (9.6%) |
| Architecture & Engineering | 52 (100.0%) | 0 (0.0%) |
| Life, Physical & Social Science | 0 (0.0%) | 6 (100.0%) |
| Community & Social Service | 22 (4.4%) | 481 (95.6%) |
| Education, Arts & Media | 0 (0.0%) | 0 (0.0%) |
| Legal Services & Support | 0 (0.0%) | 107 (100.0%) |
| Education Instruction & Library | 17 (5.0%) | 321 (95.0%) |
| Arts, Media & Entertainment | 5 (8.6%) | 53 (91.4%) |
| Health Diagnosing & Treating | 0 (0.0%) | 184 (100.0%) |
| Health Technologists | 0 (0.0%) | 0 (0.0%) |
| Total (Category) | 429 (23.4%) | 1,408 (76.6%) |
| Total (Overall) | 2,456 (46.6%) | 2,815 (53.4%) |
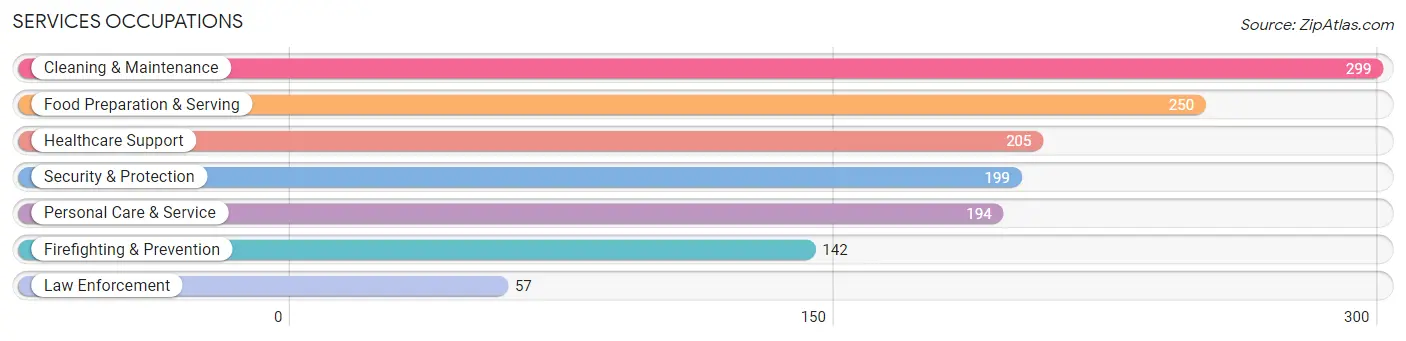
Services Occupations
The most common Services occupations in Elgin are Cleaning & Maintenance (299 | 5.7%), Food Preparation & Serving (250 | 4.7%), Healthcare Support (205 | 3.9%), Security & Protection (199 | 3.8%), and Personal Care & Service (194 | 3.7%).
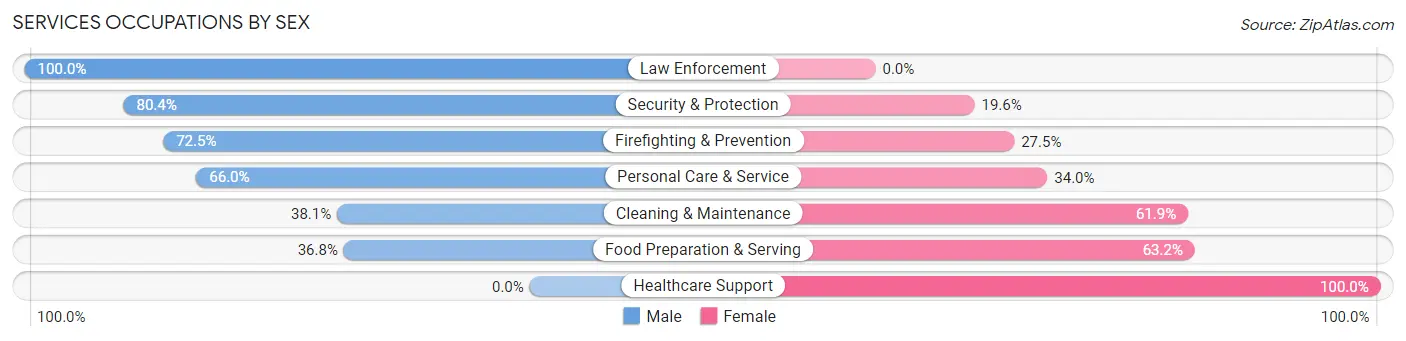
Services Occupations by Sex
Within the Services occupations in Elgin, the most male-oriented occupations are Law Enforcement (100.0%), Security & Protection (80.4%), and Firefighting & Prevention (72.5%), while the most female-oriented occupations are Healthcare Support (100.0%), Food Preparation & Serving (63.2%), and Cleaning & Maintenance (61.9%).
| Occupation | Male | Female |
| Healthcare Support | 0 (0.0%) | 205 (100.0%) |
| Security & Protection | 160 (80.4%) | 39 (19.6%) |
| Firefighting & Prevention | 103 (72.5%) | 39 (27.5%) |
| Law Enforcement | 57 (100.0%) | 0 (0.0%) |
| Food Preparation & Serving | 92 (36.8%) | 158 (63.2%) |
| Cleaning & Maintenance | 114 (38.1%) | 185 (61.9%) |
| Personal Care & Service | 128 (66.0%) | 66 (34.0%) |
| Total (Category) | 494 (43.1%) | 653 (56.9%) |
| Total (Overall) | 2,456 (46.6%) | 2,815 (53.4%) |
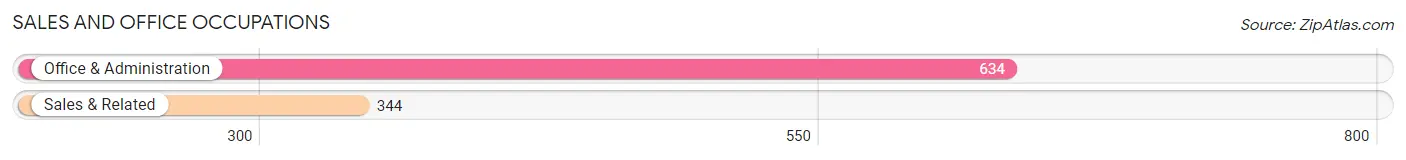
Sales and Office Occupations
The most common Sales and Office occupations in Elgin are Office & Administration (634 | 12.0%), and Sales & Related (344 | 6.5%).
Sales and Office Occupations by Sex
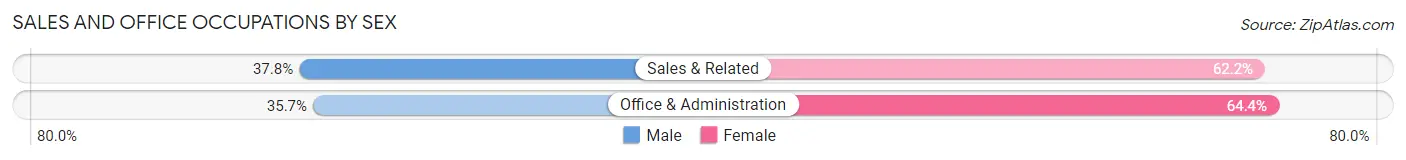
| Occupation | Male | Female |
| Sales & Related | 130 (37.8%) | 214 (62.2%) |
| Office & Administration | 226 (35.6%) | 408 (64.3%) |
| Total (Category) | 356 (36.4%) | 622 (63.6%) |
| Total (Overall) | 2,456 (46.6%) | 2,815 (53.4%) |
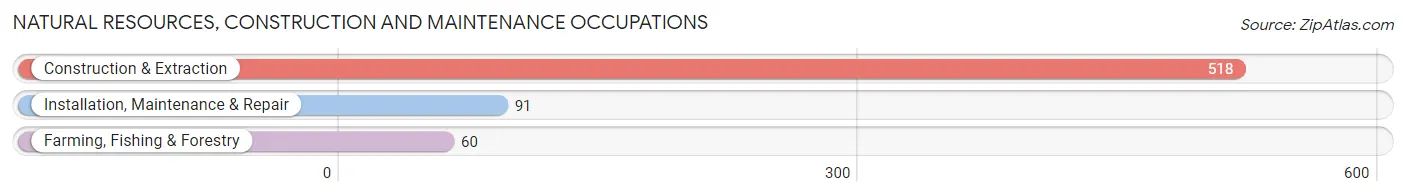
Natural Resources, Construction and Maintenance Occupations
The most common Natural Resources, Construction and Maintenance occupations in Elgin are Construction & Extraction (518 | 9.8%), Installation, Maintenance & Repair (91 | 1.7%), and Farming, Fishing & Forestry (60 | 1.1%).
Natural Resources, Construction and Maintenance Occupations by Sex
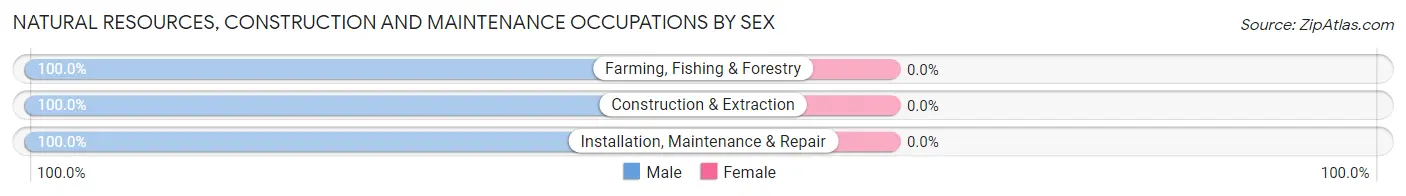
| Occupation | Male | Female |
| Farming, Fishing & Forestry | 60 (100.0%) | 0 (0.0%) |
| Construction & Extraction | 518 (100.0%) | 0 (0.0%) |
| Installation, Maintenance & Repair | 91 (100.0%) | 0 (0.0%) |
| Total (Category) | 669 (100.0%) | 0 (0.0%) |
| Total (Overall) | 2,456 (46.6%) | 2,815 (53.4%) |
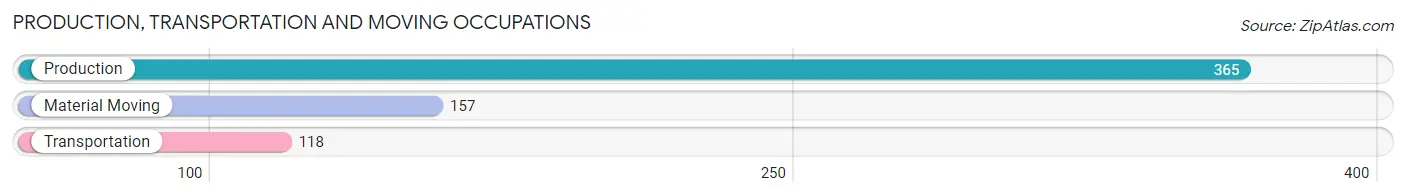
Production, Transportation and Moving Occupations
The most common Production, Transportation and Moving occupations in Elgin are Production (365 | 6.9%), Material Moving (157 | 3.0%), and Transportation (118 | 2.2%).
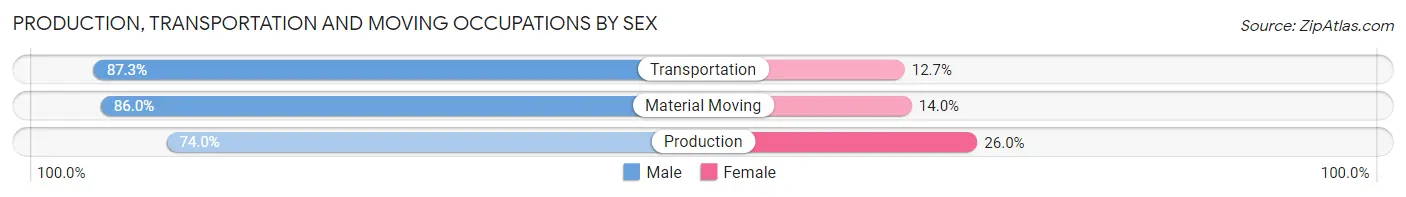
Production, Transportation and Moving Occupations by Sex
| Occupation | Male | Female |
| Production | 270 (74.0%) | 95 (26.0%) |
| Transportation | 103 (87.3%) | 15 (12.7%) |
| Material Moving | 135 (86.0%) | 22 (14.0%) |
| Total (Category) | 508 (79.4%) | 132 (20.6%) |
| Total (Overall) | 2,456 (46.6%) | 2,815 (53.4%) |
Employment Industries by Sex in Elgin
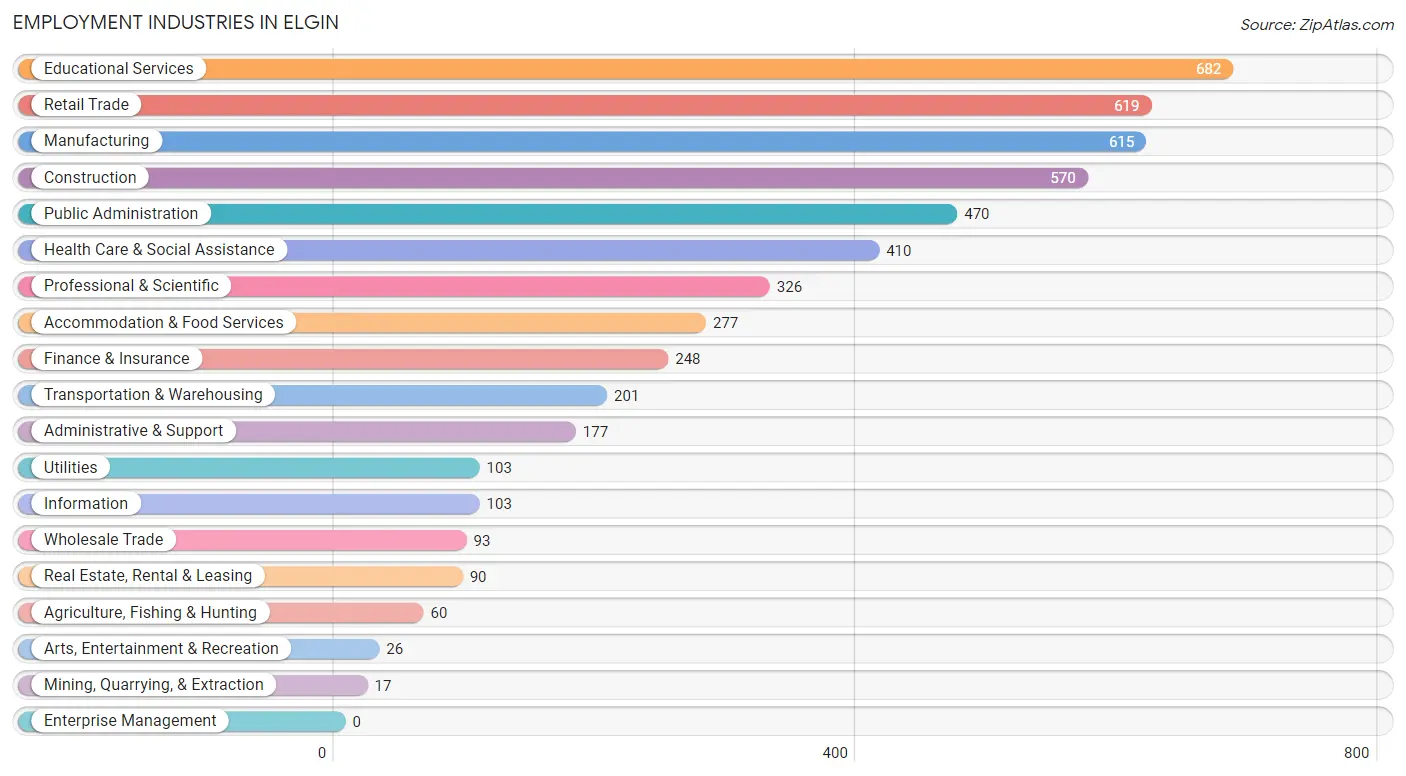
Employment Industries in Elgin
The major employment industries in Elgin include Educational Services (682 | 12.9%), Retail Trade (619 | 11.7%), Manufacturing (615 | 11.7%), Construction (570 | 10.8%), and Public Administration (470 | 8.9%).
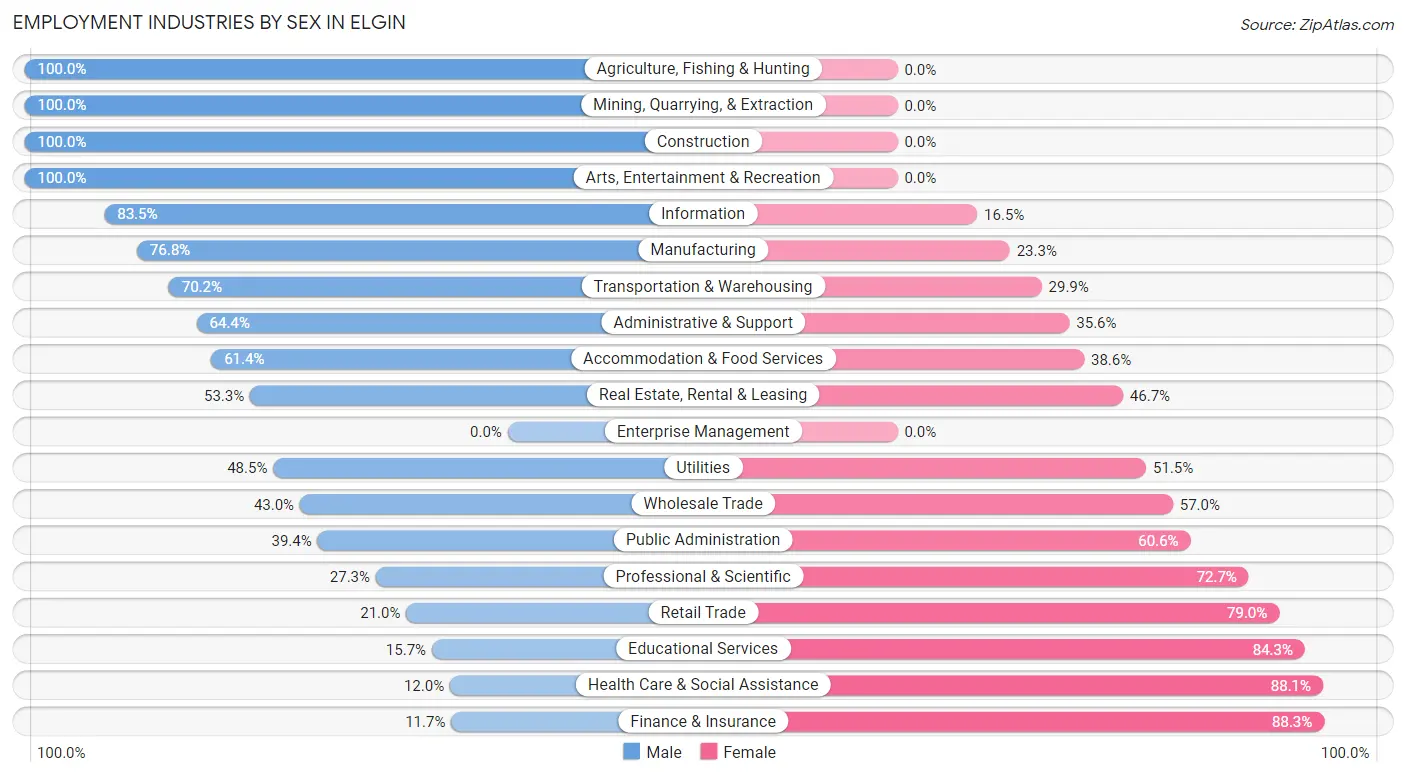
Employment Industries by Sex in Elgin
The Elgin industries that see more men than women are Agriculture, Fishing & Hunting (100.0%), Mining, Quarrying, & Extraction (100.0%), and Construction (100.0%), whereas the industries that tend to have a higher number of women are Finance & Insurance (88.3%), Health Care & Social Assistance (88.0%), and Educational Services (84.3%).
| Industry | Male | Female |
| Agriculture, Fishing & Hunting | 60 (100.0%) | 0 (0.0%) |
| Mining, Quarrying, & Extraction | 17 (100.0%) | 0 (0.0%) |
| Construction | 570 (100.0%) | 0 (0.0%) |
| Manufacturing | 472 (76.7%) | 143 (23.3%) |
| Wholesale Trade | 40 (43.0%) | 53 (57.0%) |
| Retail Trade | 130 (21.0%) | 489 (79.0%) |
| Transportation & Warehousing | 141 (70.2%) | 60 (29.8%) |
| Utilities | 50 (48.5%) | 53 (51.5%) |
| Information | 86 (83.5%) | 17 (16.5%) |
| Finance & Insurance | 29 (11.7%) | 219 (88.3%) |
| Real Estate, Rental & Leasing | 48 (53.3%) | 42 (46.7%) |
| Professional & Scientific | 89 (27.3%) | 237 (72.7%) |
| Enterprise Management | 0 (0.0%) | 0 (0.0%) |
| Administrative & Support | 114 (64.4%) | 63 (35.6%) |
| Educational Services | 107 (15.7%) | 575 (84.3%) |
| Health Care & Social Assistance | 49 (11.9%) | 361 (88.0%) |
| Arts, Entertainment & Recreation | 26 (100.0%) | 0 (0.0%) |
| Accommodation & Food Services | 170 (61.4%) | 107 (38.6%) |
| Public Administration | 185 (39.4%) | 285 (60.6%) |
| Total | 2,456 (46.6%) | 2,815 (53.4%) |
Education in Elgin
School Enrollment in Elgin
The most common levels of schooling among the 2,027 students in Elgin are middle school (554 | 27.3%), elementary school (551 | 27.2%), and high school (500 | 24.7%).
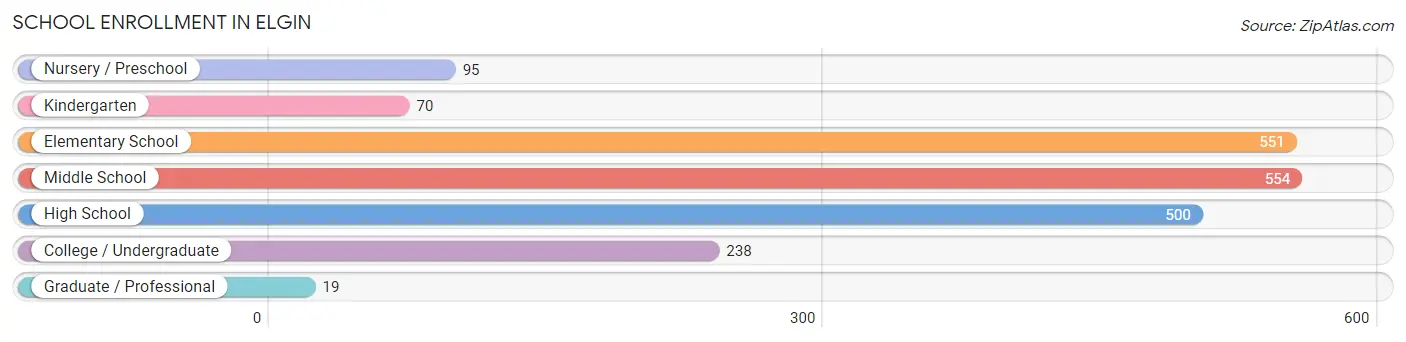
| School Level | # Students | % Students |
| Nursery / Preschool | 95 | 4.7% |
| Kindergarten | 70 | 3.5% |
| Elementary School | 551 | 27.2% |
| Middle School | 554 | 27.3% |
| High School | 500 | 24.7% |
| College / Undergraduate | 238 | 11.7% |
| Graduate / Professional | 19 | 0.9% |
| Total | 2,027 | 100.0% |
School Enrollment by Age by Funding Source in Elgin
Out of a total of 2,027 students who are enrolled in schools in Elgin, 195 (9.6%) attend a private institution, while the remaining 1,832 (90.4%) are enrolled in public schools. The age group of 35 years and over has the highest likelihood of being enrolled in private schools, with 17 (94.4% in the age bracket) enrolled. Conversely, the age group of 3 to 4 year olds has the lowest likelihood of being enrolled in a private school, with 95 (100.0% in the age bracket) attending a public institution.
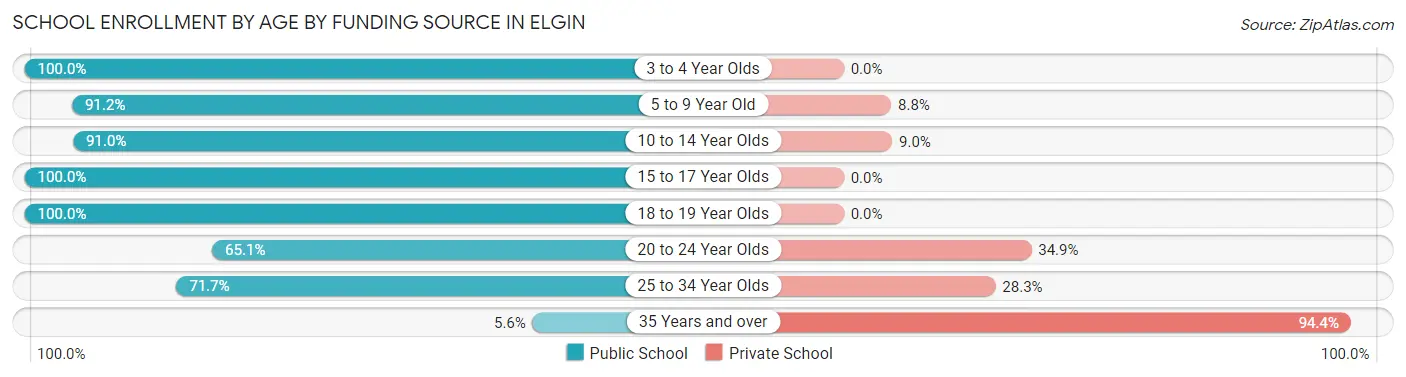
| Age Bracket | Public School | Private School |
| 3 to 4 Year Olds | 95 (100.0%) | 0 (0.0%) |
| 5 to 9 Year Old | 537 (91.2%) | 52 (8.8%) |
| 10 to 14 Year Olds | 555 (91.0%) | 55 (9.0%) |
| 15 to 17 Year Olds | 459 (100.0%) | 0 (0.0%) |
| 18 to 19 Year Olds | 44 (100.0%) | 0 (0.0%) |
| 20 to 24 Year Olds | 108 (65.1%) | 58 (34.9%) |
| 25 to 34 Year Olds | 33 (71.7%) | 13 (28.3%) |
| 35 Years and over | 1 (5.6%) | 17 (94.4%) |
| Total | 1,832 (90.4%) | 195 (9.6%) |
Educational Attainment by Field of Study in Elgin
Business (331 | 27.4%), visual & performing arts (270 | 22.4%), arts & humanities (104 | 8.6%), psychology (98 | 8.1%), and education (98 | 8.1%) are the most common fields of study among 1,208 individuals in Elgin who have obtained a bachelor's degree or higher.
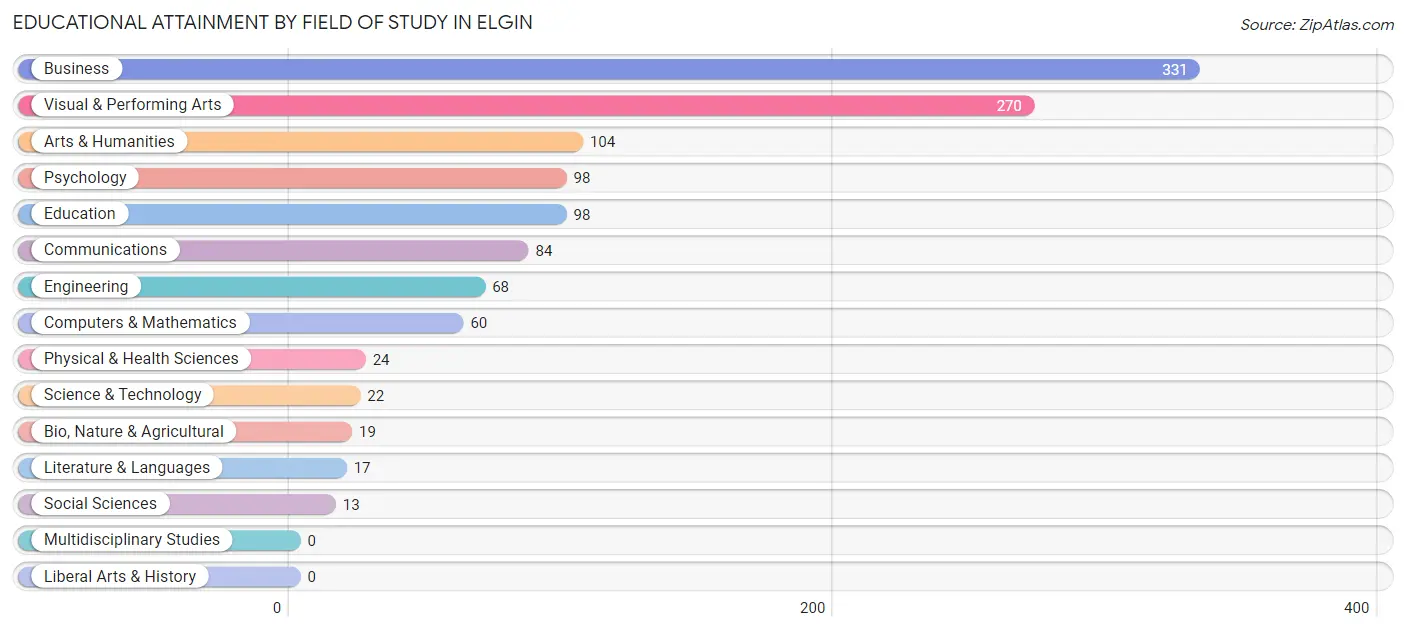
| Field of Study | # Graduates | % Graduates |
| Computers & Mathematics | 60 | 5.0% |
| Bio, Nature & Agricultural | 19 | 1.6% |
| Physical & Health Sciences | 24 | 2.0% |
| Psychology | 98 | 8.1% |
| Social Sciences | 13 | 1.1% |
| Engineering | 68 | 5.6% |
| Multidisciplinary Studies | 0 | 0.0% |
| Science & Technology | 22 | 1.8% |
| Business | 331 | 27.4% |
| Education | 98 | 8.1% |
| Literature & Languages | 17 | 1.4% |
| Liberal Arts & History | 0 | 0.0% |
| Visual & Performing Arts | 270 | 22.4% |
| Communications | 84 | 7.0% |
| Arts & Humanities | 104 | 8.6% |
| Total | 1,208 | 100.0% |
Transportation & Commute in Elgin
Vehicle Availability by Sex in Elgin
The most prevalent vehicle ownership categories in Elgin are males with 2 vehicles (998, accounting for 41.0%) and females with 2 vehicles (888, making up 35.7%).
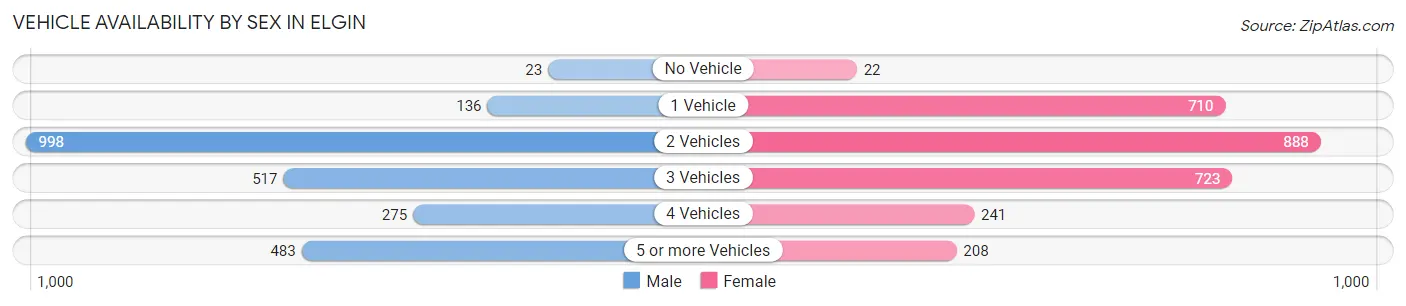
| Vehicles Available | Male | Female |
| No Vehicle | 23 (0.9%) | 22 (0.8%) |
| 1 Vehicle | 136 (5.6%) | 710 (25.4%) |
| 2 Vehicles | 998 (41.0%) | 888 (31.8%) |
| 3 Vehicles | 517 (21.3%) | 723 (25.9%) |
| 4 Vehicles | 275 (11.3%) | 241 (8.6%) |
| 5 or more Vehicles | 483 (19.9%) | 208 (7.4%) |
| Total | 2,432 (100.0%) | 2,792 (100.0%) |
Commute Time in Elgin
The most frequently occuring commute durations in Elgin are 45 to 59 minutes (1,000 commuters, 21.6%), 30 to 34 minutes (903 commuters, 19.5%), and 60 to 89 minutes (466 commuters, 10.1%).
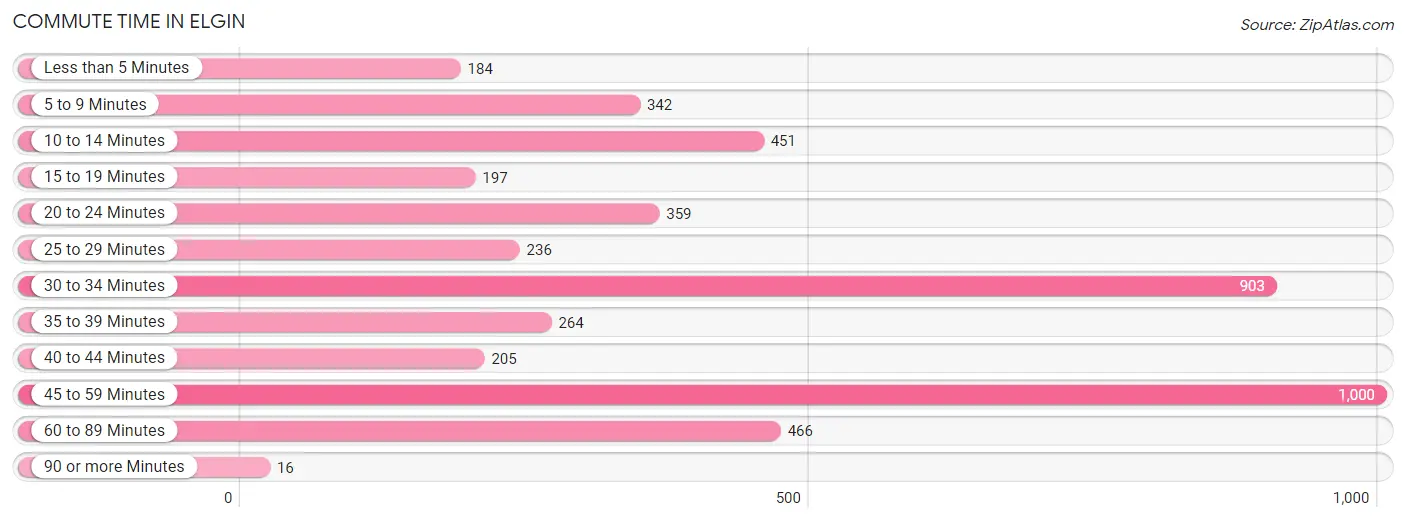
| Commute Time | # Commuters | % Commuters |
| Less than 5 Minutes | 184 | 4.0% |
| 5 to 9 Minutes | 342 | 7.4% |
| 10 to 14 Minutes | 451 | 9.8% |
| 15 to 19 Minutes | 197 | 4.3% |
| 20 to 24 Minutes | 359 | 7.8% |
| 25 to 29 Minutes | 236 | 5.1% |
| 30 to 34 Minutes | 903 | 19.5% |
| 35 to 39 Minutes | 264 | 5.7% |
| 40 to 44 Minutes | 205 | 4.4% |
| 45 to 59 Minutes | 1,000 | 21.6% |
| 60 to 89 Minutes | 466 | 10.1% |
| 90 or more Minutes | 16 | 0.4% |
Commute Time by Sex in Elgin
The most common commute times in Elgin are 45 to 59 minutes (776 commuters, 36.3%) for males and 30 to 34 minutes (395 commuters, 15.9%) for females.
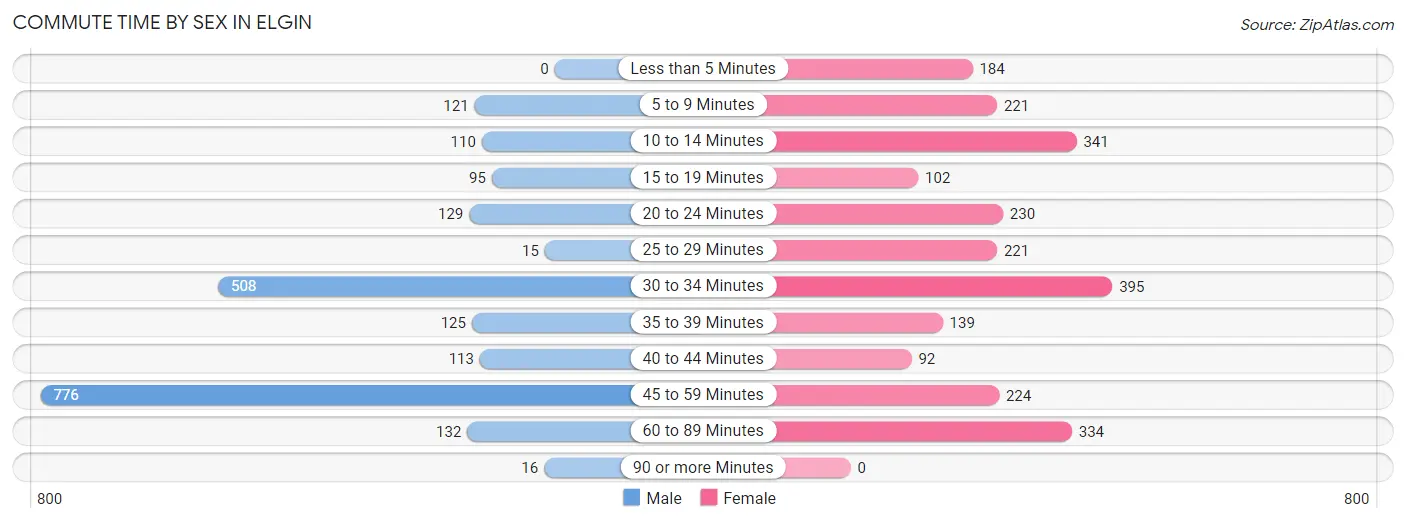
| Commute Time | Male | Female |
| Less than 5 Minutes | 0 (0.0%) | 184 (7.4%) |
| 5 to 9 Minutes | 121 (5.7%) | 221 (8.9%) |
| 10 to 14 Minutes | 110 (5.1%) | 341 (13.7%) |
| 15 to 19 Minutes | 95 (4.4%) | 102 (4.1%) |
| 20 to 24 Minutes | 129 (6.0%) | 230 (9.3%) |
| 25 to 29 Minutes | 15 (0.7%) | 221 (8.9%) |
| 30 to 34 Minutes | 508 (23.7%) | 395 (15.9%) |
| 35 to 39 Minutes | 125 (5.8%) | 139 (5.6%) |
| 40 to 44 Minutes | 113 (5.3%) | 92 (3.7%) |
| 45 to 59 Minutes | 776 (36.3%) | 224 (9.0%) |
| 60 to 89 Minutes | 132 (6.2%) | 334 (13.5%) |
| 90 or more Minutes | 16 (0.7%) | 0 (0.0%) |
Time of Departure to Work by Sex in Elgin
The most frequent times of departure to work in Elgin are 6:00 AM to 6:29 AM (511, 23.9%) for males and 12:00 AM to 4:59 AM (399, 16.1%) for females.
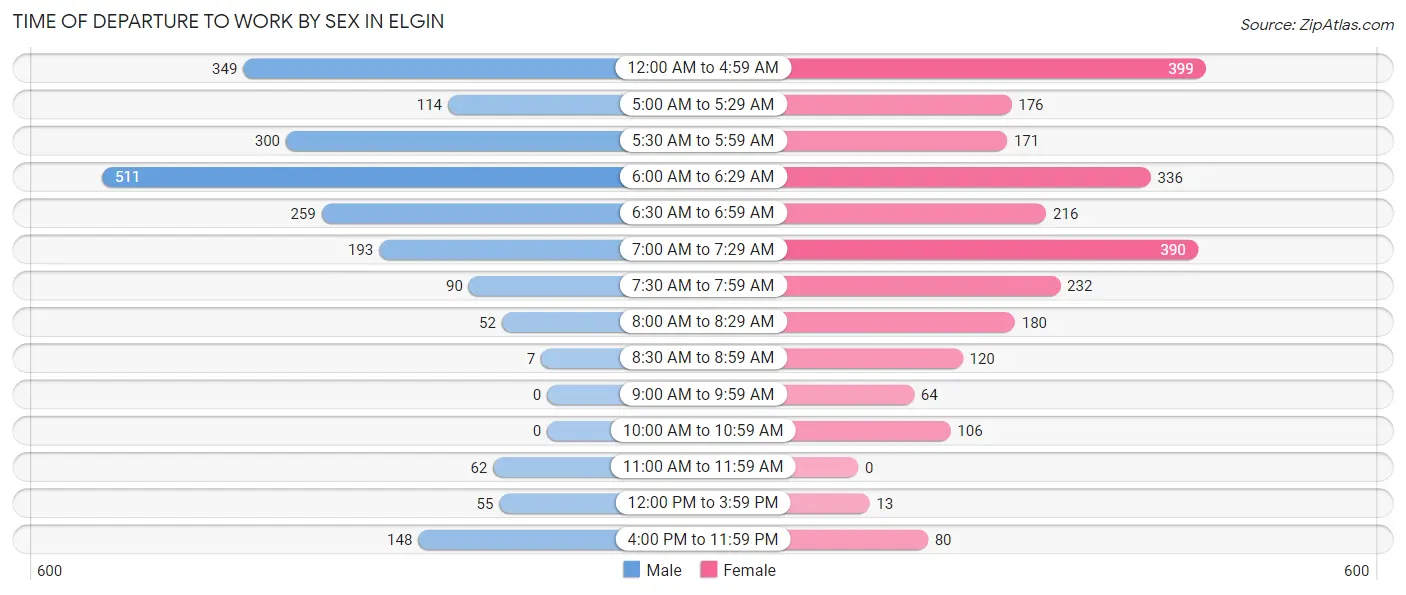
| Time of Departure | Male | Female |
| 12:00 AM to 4:59 AM | 349 (16.3%) | 399 (16.1%) |
| 5:00 AM to 5:29 AM | 114 (5.3%) | 176 (7.1%) |
| 5:30 AM to 5:59 AM | 300 (14.0%) | 171 (6.9%) |
| 6:00 AM to 6:29 AM | 511 (23.9%) | 336 (13.5%) |
| 6:30 AM to 6:59 AM | 259 (12.1%) | 216 (8.7%) |
| 7:00 AM to 7:29 AM | 193 (9.0%) | 390 (15.7%) |
| 7:30 AM to 7:59 AM | 90 (4.2%) | 232 (9.3%) |
| 8:00 AM to 8:29 AM | 52 (2.4%) | 180 (7.2%) |
| 8:30 AM to 8:59 AM | 7 (0.3%) | 120 (4.8%) |
| 9:00 AM to 9:59 AM | 0 (0.0%) | 64 (2.6%) |
| 10:00 AM to 10:59 AM | 0 (0.0%) | 106 (4.3%) |
| 11:00 AM to 11:59 AM | 62 (2.9%) | 0 (0.0%) |
| 12:00 PM to 3:59 PM | 55 (2.6%) | 13 (0.5%) |
| 4:00 PM to 11:59 PM | 148 (6.9%) | 80 (3.2%) |
| Total | 2,140 (100.0%) | 2,483 (100.0%) |
Housing Occupancy in Elgin
Occupancy by Ownership in Elgin
Of the total 3,455 dwellings in Elgin, owner-occupied units account for 2,175 (62.9%), while renter-occupied units make up 1,280 (37.0%).
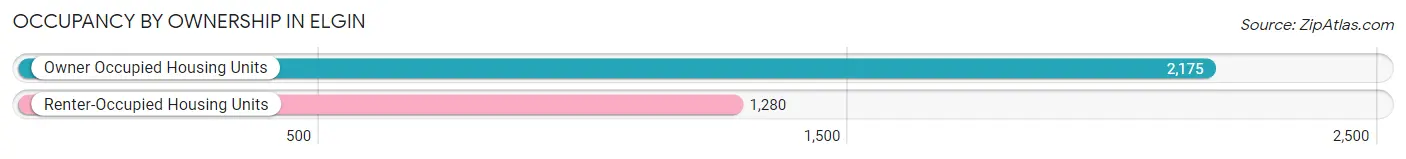
| Occupancy | # Housing Units | % Housing Units |
| Owner Occupied Housing Units | 2,175 | 62.9% |
| Renter-Occupied Housing Units | 1,280 | 37.0% |
| Total Occupied Housing Units | 3,455 | 100.0% |
Occupancy by Household Size in Elgin
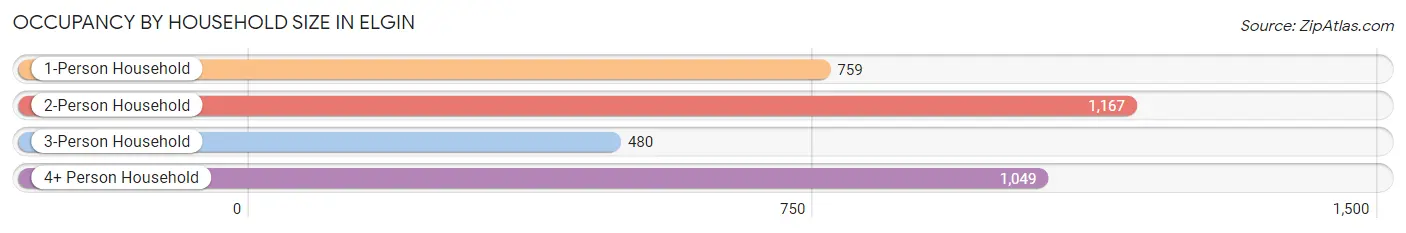
| Household Size | # Housing Units | % Housing Units |
| 1-Person Household | 759 | 22.0% |
| 2-Person Household | 1,167 | 33.8% |
| 3-Person Household | 480 | 13.9% |
| 4+ Person Household | 1,049 | 30.4% |
| Total Housing Units | 3,455 | 100.0% |
Occupancy by Ownership by Household Size in Elgin
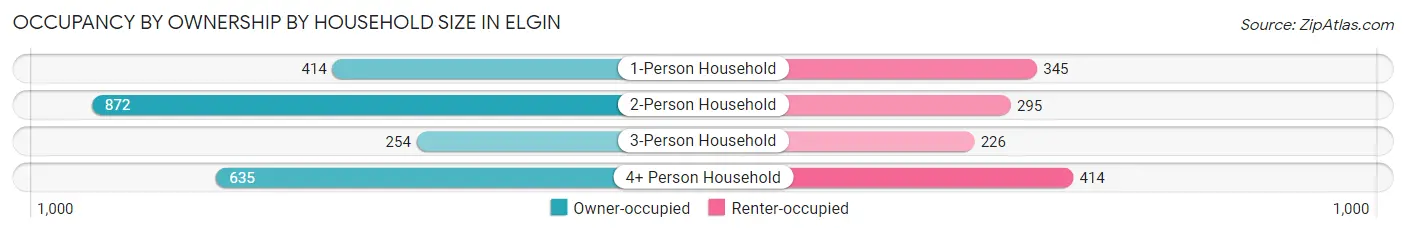
| Household Size | Owner-occupied | Renter-occupied |
| 1-Person Household | 414 (54.5%) | 345 (45.5%) |
| 2-Person Household | 872 (74.7%) | 295 (25.3%) |
| 3-Person Household | 254 (52.9%) | 226 (47.1%) |
| 4+ Person Household | 635 (60.5%) | 414 (39.5%) |
| Total Housing Units | 2,175 (62.9%) | 1,280 (37.0%) |
Occupancy by Educational Attainment in Elgin
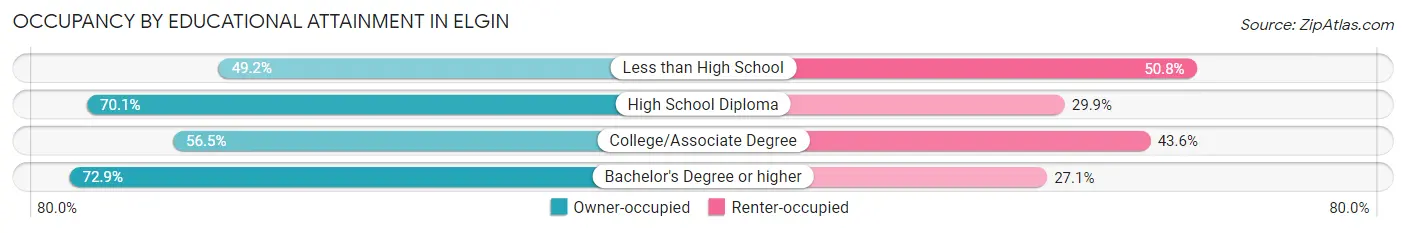
| Household Size | Owner-occupied | Renter-occupied |
| Less than High School | 279 (49.2%) | 288 (50.8%) |
| High School Diploma | 632 (70.1%) | 270 (29.9%) |
| College/Associate Degree | 630 (56.5%) | 486 (43.5%) |
| Bachelor's Degree or higher | 634 (72.9%) | 236 (27.1%) |
Occupancy by Age of Householder in Elgin
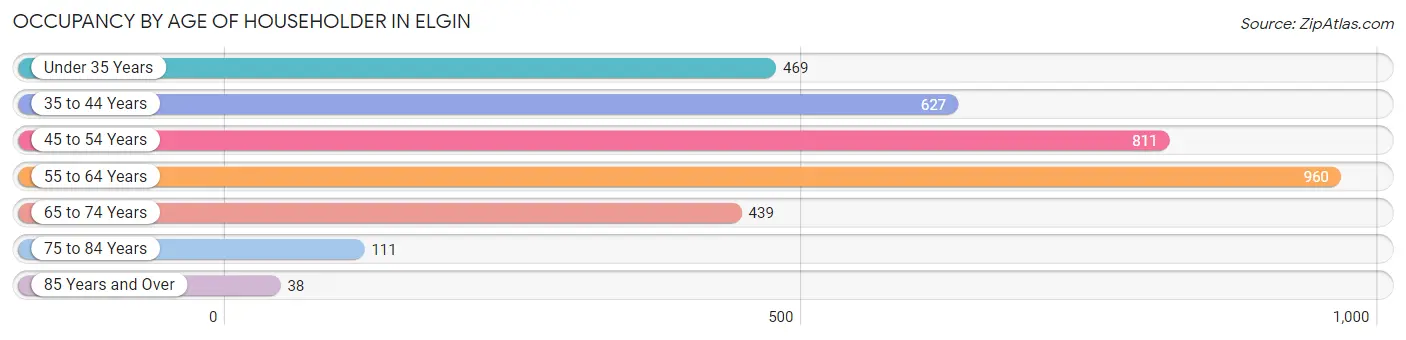
| Age Bracket | # Households | % Households |
| Under 35 Years | 469 | 13.6% |
| 35 to 44 Years | 627 | 18.1% |
| 45 to 54 Years | 811 | 23.5% |
| 55 to 64 Years | 960 | 27.8% |
| 65 to 74 Years | 439 | 12.7% |
| 75 to 84 Years | 111 | 3.2% |
| 85 Years and Over | 38 | 1.1% |
| Total | 3,455 | 100.0% |
Housing Finances in Elgin
Median Income by Occupancy in Elgin
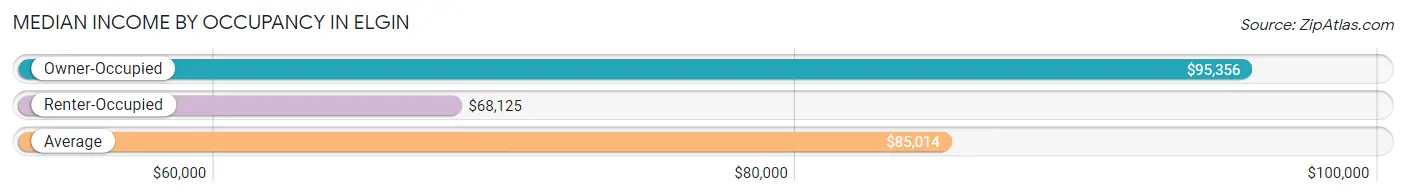
| Occupancy Type | # Households | Median Income |
| Owner-Occupied | 2,175 (62.9%) | $95,356 |
| Renter-Occupied | 1,280 (37.0%) | $68,125 |
| Average | 3,455 (100.0%) | $85,014 |
Occupancy by Householder Income Bracket in Elgin
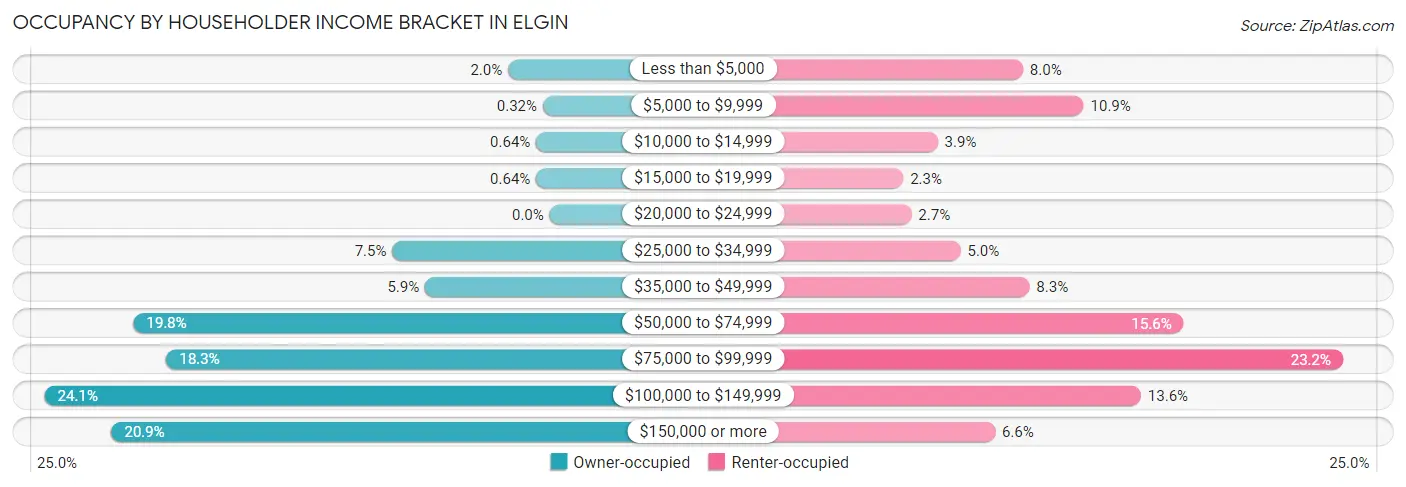
| Income Bracket | Owner-occupied | Renter-occupied |
| Less than $5,000 | 43 (2.0%) | 102 (8.0%) |
| $5,000 to $9,999 | 7 (0.3%) | 139 (10.9%) |
| $10,000 to $14,999 | 14 (0.6%) | 50 (3.9%) |
| $15,000 to $19,999 | 14 (0.6%) | 29 (2.3%) |
| $20,000 to $24,999 | 0 (0.0%) | 34 (2.7%) |
| $25,000 to $34,999 | 163 (7.5%) | 64 (5.0%) |
| $35,000 to $49,999 | 129 (5.9%) | 106 (8.3%) |
| $50,000 to $74,999 | 431 (19.8%) | 200 (15.6%) |
| $75,000 to $99,999 | 397 (18.2%) | 297 (23.2%) |
| $100,000 to $149,999 | 523 (24.0%) | 174 (13.6%) |
| $150,000 or more | 454 (20.9%) | 85 (6.6%) |
| Total | 2,175 (100.0%) | 1,280 (100.0%) |
Monthly Housing Cost Tiers in Elgin
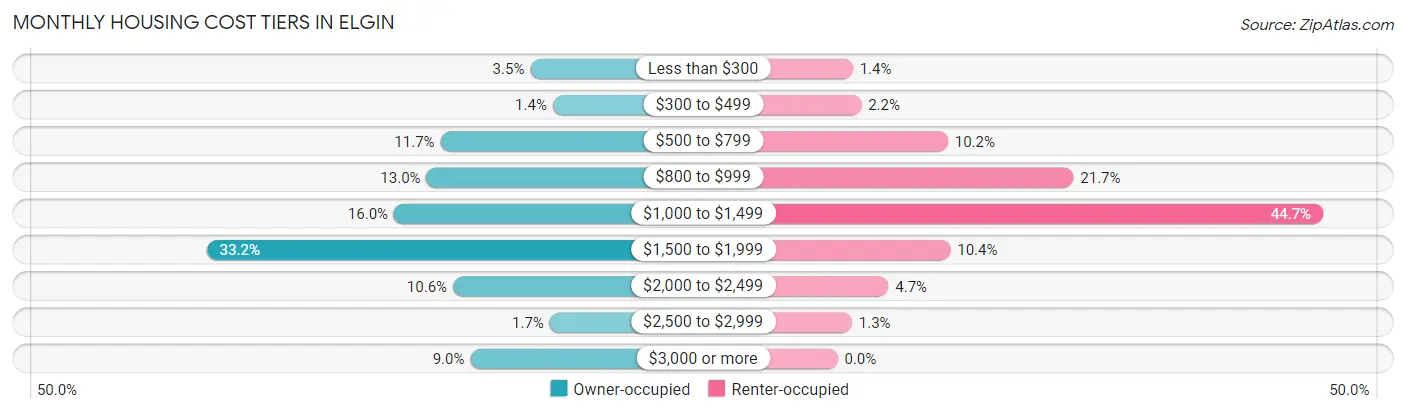
| Monthly Cost | Owner-occupied | Renter-occupied |
| Less than $300 | 75 (3.5%) | 18 (1.4%) |
| $300 to $499 | 30 (1.4%) | 28 (2.2%) |
| $500 to $799 | 255 (11.7%) | 130 (10.2%) |
| $800 to $999 | 283 (13.0%) | 278 (21.7%) |
| $1,000 to $1,499 | 348 (16.0%) | 572 (44.7%) |
| $1,500 to $1,999 | 723 (33.2%) | 133 (10.4%) |
| $2,000 to $2,499 | 230 (10.6%) | 60 (4.7%) |
| $2,500 to $2,999 | 36 (1.7%) | 17 (1.3%) |
| $3,000 or more | 195 (9.0%) | 0 (0.0%) |
| Total | 2,175 (100.0%) | 1,280 (100.0%) |
Physical Housing Characteristics in Elgin
Housing Structures in Elgin
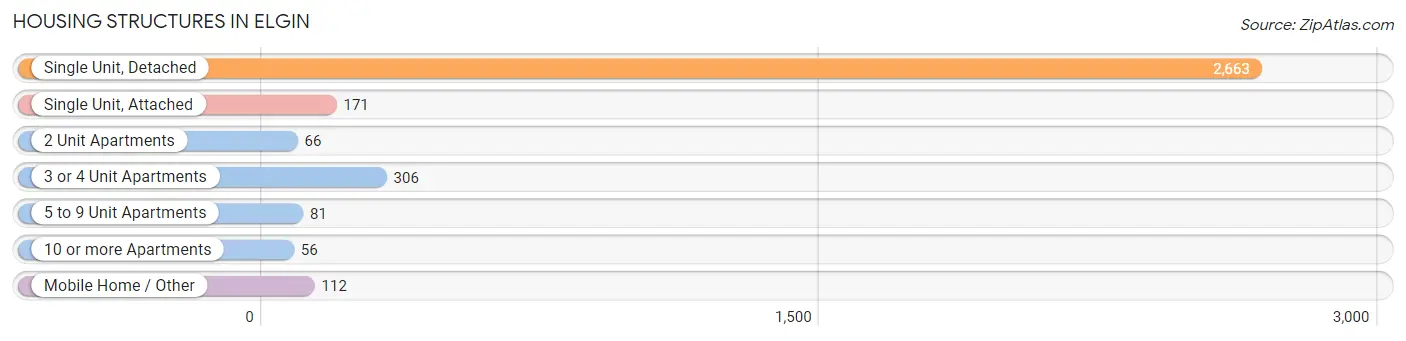
| Structure Type | # Housing Units | % Housing Units |
| Single Unit, Detached | 2,663 | 77.1% |
| Single Unit, Attached | 171 | 5.0% |
| 2 Unit Apartments | 66 | 1.9% |
| 3 or 4 Unit Apartments | 306 | 8.9% |
| 5 to 9 Unit Apartments | 81 | 2.3% |
| 10 or more Apartments | 56 | 1.6% |
| Mobile Home / Other | 112 | 3.2% |
| Total | 3,455 | 100.0% |
Housing Structures by Occupancy in Elgin

| Structure Type | Owner-occupied | Renter-occupied |
| Single Unit, Detached | 1,860 (69.9%) | 803 (30.1%) |
| Single Unit, Attached | 171 (100.0%) | 0 (0.0%) |
| 2 Unit Apartments | 0 (0.0%) | 66 (100.0%) |
| 3 or 4 Unit Apartments | 0 (0.0%) | 306 (100.0%) |
| 5 to 9 Unit Apartments | 0 (0.0%) | 81 (100.0%) |
| 10 or more Apartments | 32 (57.1%) | 24 (42.9%) |
| Mobile Home / Other | 112 (100.0%) | 0 (0.0%) |
| Total | 2,175 (62.9%) | 1,280 (37.0%) |
Housing Structures by Number of Rooms in Elgin
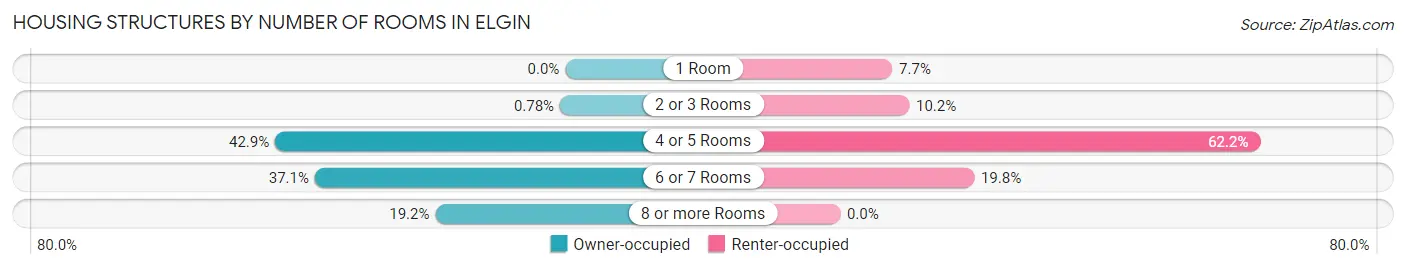
| Number of Rooms | Owner-occupied | Renter-occupied |
| 1 Room | 0 (0.0%) | 99 (7.7%) |
| 2 or 3 Rooms | 17 (0.8%) | 131 (10.2%) |
| 4 or 5 Rooms | 934 (42.9%) | 796 (62.2%) |
| 6 or 7 Rooms | 806 (37.1%) | 254 (19.8%) |
| 8 or more Rooms | 418 (19.2%) | 0 (0.0%) |
| Total | 2,175 (100.0%) | 1,280 (100.0%) |
Housing Structure by Heating Type in Elgin
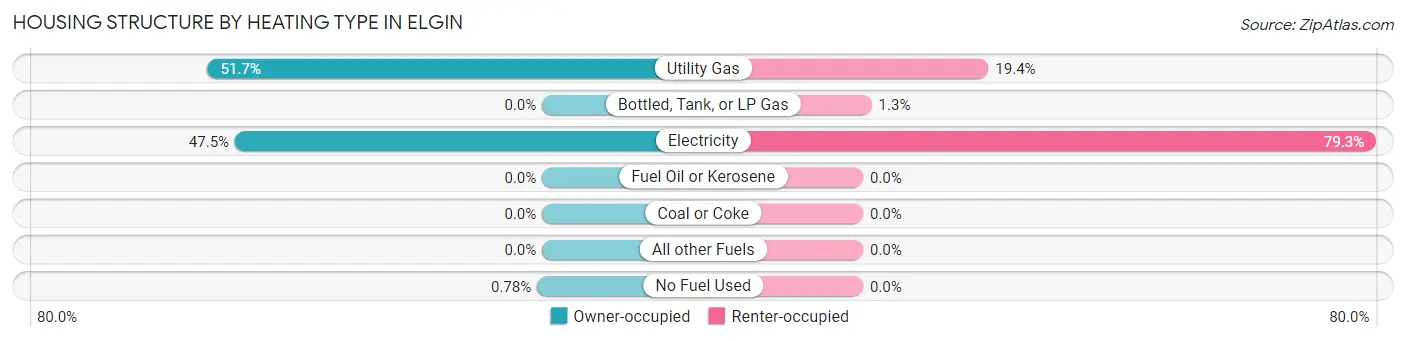
| Heating Type | Owner-occupied | Renter-occupied |
| Utility Gas | 1,125 (51.7%) | 248 (19.4%) |
| Bottled, Tank, or LP Gas | 0 (0.0%) | 17 (1.3%) |
| Electricity | 1,033 (47.5%) | 1,015 (79.3%) |
| Fuel Oil or Kerosene | 0 (0.0%) | 0 (0.0%) |
| Coal or Coke | 0 (0.0%) | 0 (0.0%) |
| All other Fuels | 0 (0.0%) | 0 (0.0%) |
| No Fuel Used | 17 (0.8%) | 0 (0.0%) |
| Total | 2,175 (100.0%) | 1,280 (100.0%) |
Household Vehicle Usage in Elgin
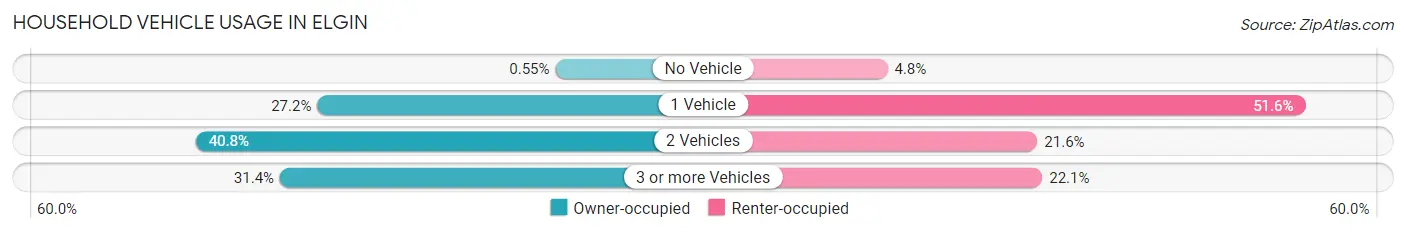
| Vehicles per Household | Owner-occupied | Renter-occupied |
| No Vehicle | 12 (0.5%) | 61 (4.8%) |
| 1 Vehicle | 592 (27.2%) | 660 (51.6%) |
| 2 Vehicles | 888 (40.8%) | 276 (21.6%) |
| 3 or more Vehicles | 683 (31.4%) | 283 (22.1%) |
| Total | 2,175 (100.0%) | 1,280 (100.0%) |
Real Estate & Mortgages in Elgin
Real Estate and Mortgage Overview in Elgin
| Characteristic | Without Mortgage | With Mortgage |
| Housing Units | 564 | 1,611 |
| Median Property Value | $227,600 | $243,700 |
| Median Household Income | $116,500 | $336 |
| Monthly Housing Costs | $678 | $195 |
| Real Estate Taxes | $3,222 | $182 |
Property Value by Mortgage Status in Elgin
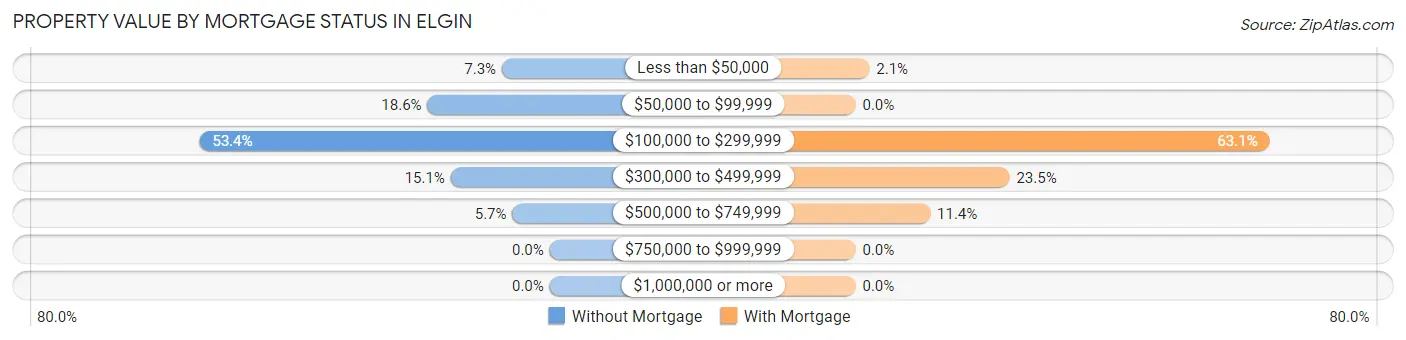
| Property Value | Without Mortgage | With Mortgage |
| Less than $50,000 | 41 (7.3%) | 34 (2.1%) |
| $50,000 to $99,999 | 105 (18.6%) | 0 (0.0%) |
| $100,000 to $299,999 | 301 (53.4%) | 1,016 (63.1%) |
| $300,000 to $499,999 | 85 (15.1%) | 378 (23.5%) |
| $500,000 to $749,999 | 32 (5.7%) | 183 (11.4%) |
| $750,000 to $999,999 | 0 (0.0%) | 0 (0.0%) |
| $1,000,000 or more | 0 (0.0%) | 0 (0.0%) |
| Total | 564 (100.0%) | 1,611 (100.0%) |
Household Income by Mortgage Status in Elgin
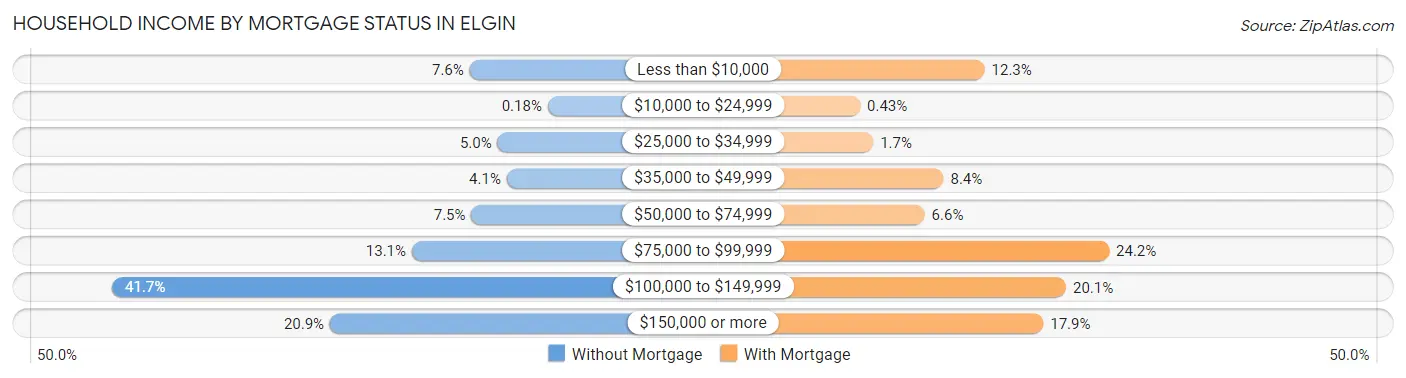
| Household Income | Without Mortgage | With Mortgage |
| Less than $10,000 | 43 (7.6%) | 198 (12.3%) |
| $10,000 to $24,999 | 1 (0.2%) | 7 (0.4%) |
| $25,000 to $34,999 | 28 (5.0%) | 27 (1.7%) |
| $35,000 to $49,999 | 23 (4.1%) | 135 (8.4%) |
| $50,000 to $74,999 | 42 (7.4%) | 106 (6.6%) |
| $75,000 to $99,999 | 74 (13.1%) | 389 (24.1%) |
| $100,000 to $149,999 | 235 (41.7%) | 323 (20.1%) |
| $150,000 or more | 118 (20.9%) | 288 (17.9%) |
| Total | 564 (100.0%) | 1,611 (100.0%) |
Property Value to Household Income Ratio in Elgin
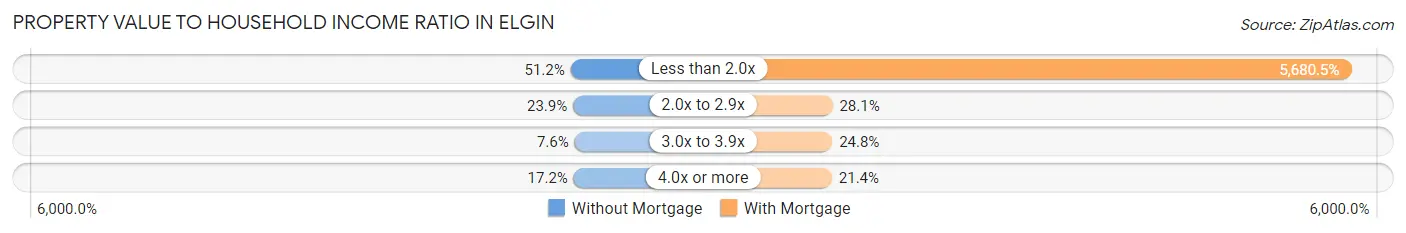
| Value-to-Income Ratio | Without Mortgage | With Mortgage |
| Less than 2.0x | 289 (51.2%) | 91,512 (5,680.4%) |
| 2.0x to 2.9x | 135 (23.9%) | 452 (28.1%) |
| 3.0x to 3.9x | 43 (7.6%) | 399 (24.8%) |
| 4.0x or more | 97 (17.2%) | 345 (21.4%) |
| Total | 564 (100.0%) | 1,611 (100.0%) |
Real Estate Taxes by Mortgage Status in Elgin
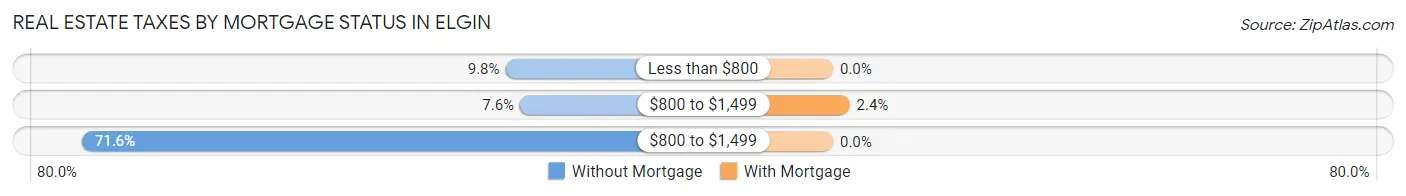
| Property Taxes | Without Mortgage | With Mortgage |
| Less than $800 | 55 (9.8%) | 0 (0.0%) |
| $800 to $1,499 | 43 (7.6%) | 39 (2.4%) |
| $800 to $1,499 | 404 (71.6%) | 0 (0.0%) |
| Total | 564 (100.0%) | 1,611 (100.0%) |
Health & Disability in Elgin
Health Insurance Coverage by Age in Elgin
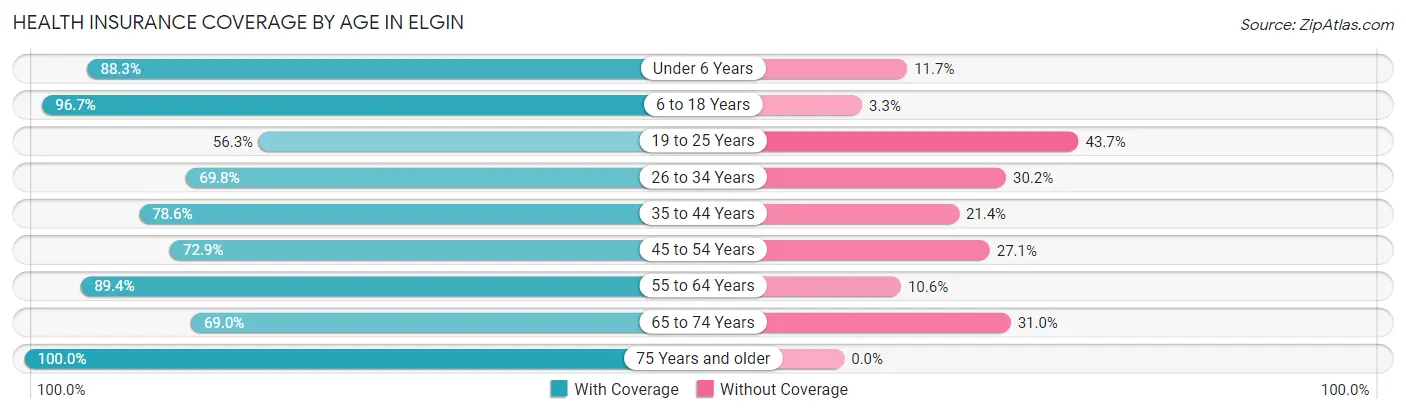
| Age Bracket | With Coverage | Without Coverage |
| Under 6 Years | 722 (88.3%) | 96 (11.7%) |
| 6 to 18 Years | 1,685 (96.7%) | 58 (3.3%) |
| 19 to 25 Years | 620 (56.3%) | 481 (43.7%) |
| 26 to 34 Years | 764 (69.8%) | 330 (30.2%) |
| 35 to 44 Years | 956 (78.6%) | 260 (21.4%) |
| 45 to 54 Years | 1,117 (72.9%) | 416 (27.1%) |
| 55 to 64 Years | 1,134 (89.4%) | 134 (10.6%) |
| 65 to 74 Years | 638 (69.0%) | 287 (31.0%) |
| 75 Years and older | 227 (100.0%) | 0 (0.0%) |
| Total | 7,863 (79.2%) | 2,062 (20.8%) |
Health Insurance Coverage by Citizenship Status in Elgin
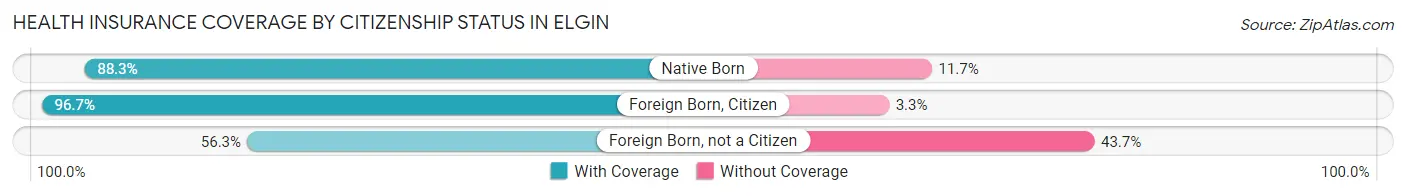
| Citizenship Status | With Coverage | Without Coverage |
| Native Born | 722 (88.3%) | 96 (11.7%) |
| Foreign Born, Citizen | 1,685 (96.7%) | 58 (3.3%) |
| Foreign Born, not a Citizen | 620 (56.3%) | 481 (43.7%) |
Health Insurance Coverage by Household Income in Elgin
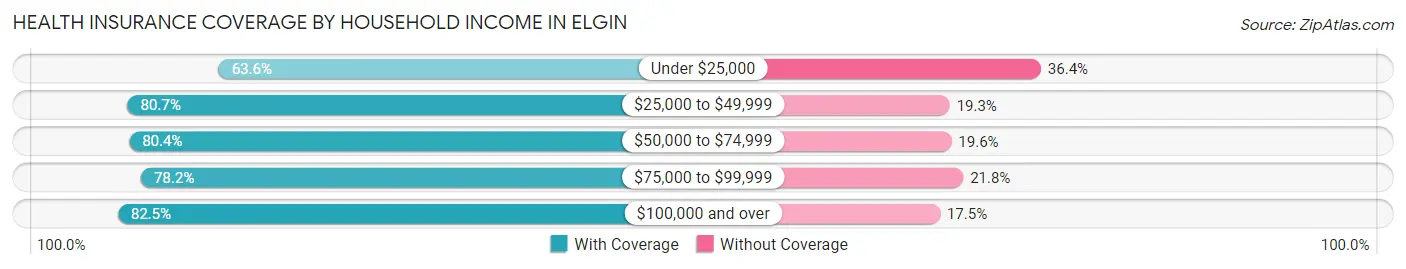
| Household Income | With Coverage | Without Coverage |
| Under $25,000 | 656 (63.6%) | 375 (36.4%) |
| $25,000 to $49,999 | 833 (80.7%) | 199 (19.3%) |
| $50,000 to $74,999 | 1,473 (80.4%) | 359 (19.6%) |
| $75,000 to $99,999 | 1,488 (78.2%) | 415 (21.8%) |
| $100,000 and over | 3,360 (82.5%) | 711 (17.5%) |
Public vs Private Health Insurance Coverage by Age in Elgin
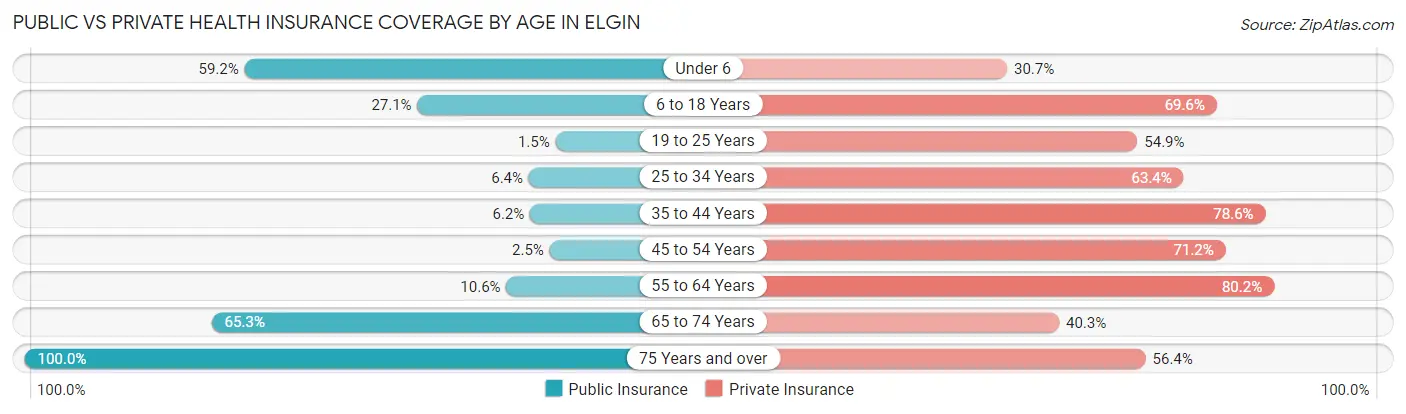
| Age Bracket | Public Insurance | Private Insurance |
| Under 6 | 484 (59.2%) | 251 (30.7%) |
| 6 to 18 Years | 472 (27.1%) | 1,213 (69.6%) |
| 19 to 25 Years | 16 (1.5%) | 604 (54.9%) |
| 25 to 34 Years | 70 (6.4%) | 694 (63.4%) |
| 35 to 44 Years | 75 (6.2%) | 956 (78.6%) |
| 45 to 54 Years | 39 (2.5%) | 1,092 (71.2%) |
| 55 to 64 Years | 134 (10.6%) | 1,017 (80.2%) |
| 65 to 74 Years | 604 (65.3%) | 373 (40.3%) |
| 75 Years and over | 227 (100.0%) | 128 (56.4%) |
| Total | 2,121 (21.4%) | 6,328 (63.8%) |
Disability Status by Sex by Age in Elgin
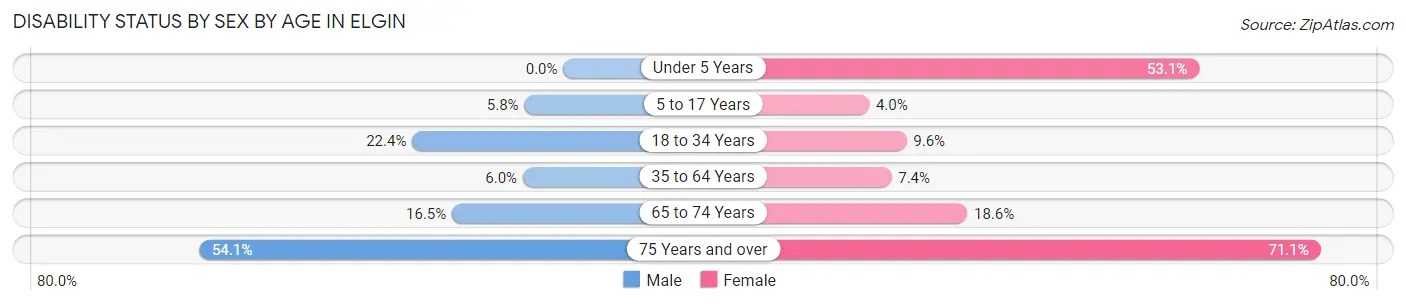
| Age Bracket | Male | Female |
| Under 5 Years | 0 (0.0%) | 52 (53.1%) |
| 5 to 17 Years | 51 (5.8%) | 42 (4.0%) |
| 18 to 34 Years | 245 (22.4%) | 110 (9.6%) |
| 35 to 64 Years | 99 (6.0%) | 174 (7.3%) |
| 65 to 74 Years | 96 (16.5%) | 64 (18.6%) |
| 75 Years and over | 33 (54.1%) | 118 (71.1%) |
Disability Class by Sex by Age in Elgin
Disability Class: Hearing Difficulty
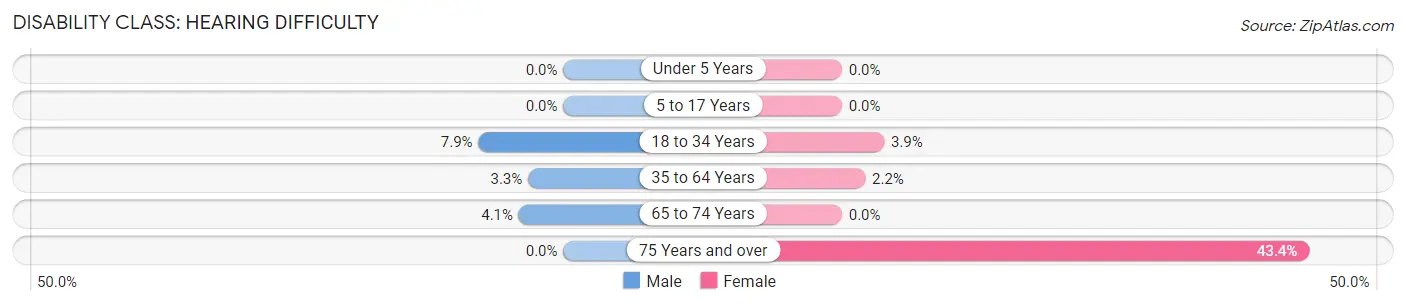
| Age Bracket | Male | Female |
| Under 5 Years | 0 (0.0%) | 0 (0.0%) |
| 5 to 17 Years | 0 (0.0%) | 0 (0.0%) |
| 18 to 34 Years | 86 (7.9%) | 45 (3.9%) |
| 35 to 64 Years | 54 (3.3%) | 51 (2.2%) |
| 65 to 74 Years | 24 (4.1%) | 0 (0.0%) |
| 75 Years and over | 0 (0.0%) | 72 (43.4%) |
Disability Class: Vision Difficulty
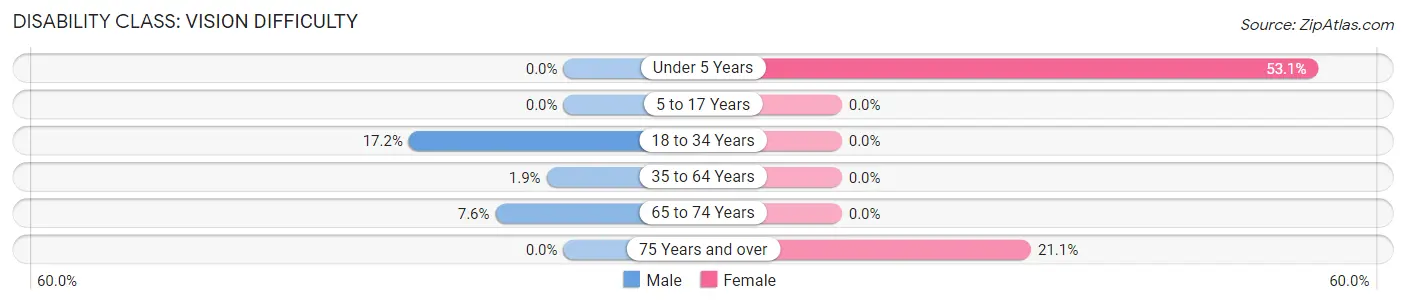
| Age Bracket | Male | Female |
| Under 5 Years | 0 (0.0%) | 52 (53.1%) |
| 5 to 17 Years | 0 (0.0%) | 0 (0.0%) |
| 18 to 34 Years | 188 (17.2%) | 0 (0.0%) |
| 35 to 64 Years | 31 (1.9%) | 0 (0.0%) |
| 65 to 74 Years | 44 (7.6%) | 0 (0.0%) |
| 75 Years and over | 0 (0.0%) | 35 (21.1%) |
Disability Class: Cognitive Difficulty
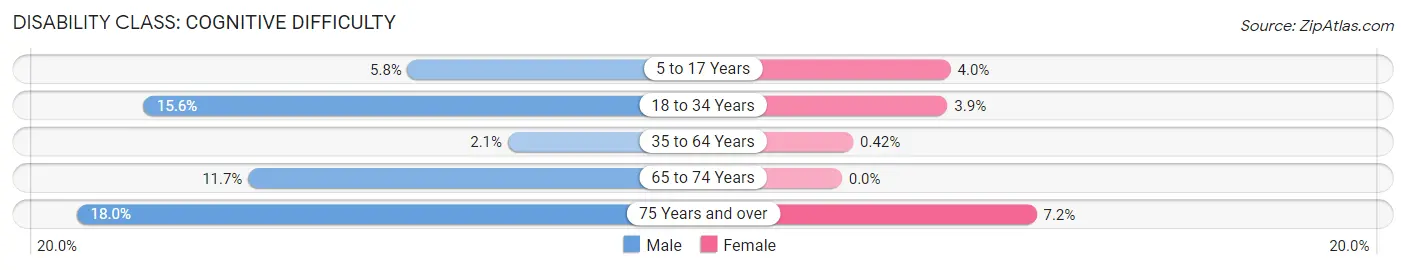
| Age Bracket | Male | Female |
| 5 to 17 Years | 51 (5.8%) | 42 (4.0%) |
| 18 to 34 Years | 170 (15.6%) | 45 (3.9%) |
| 35 to 64 Years | 34 (2.1%) | 10 (0.4%) |
| 65 to 74 Years | 68 (11.7%) | 0 (0.0%) |
| 75 Years and over | 11 (18.0%) | 12 (7.2%) |
Disability Class: Ambulatory Difficulty
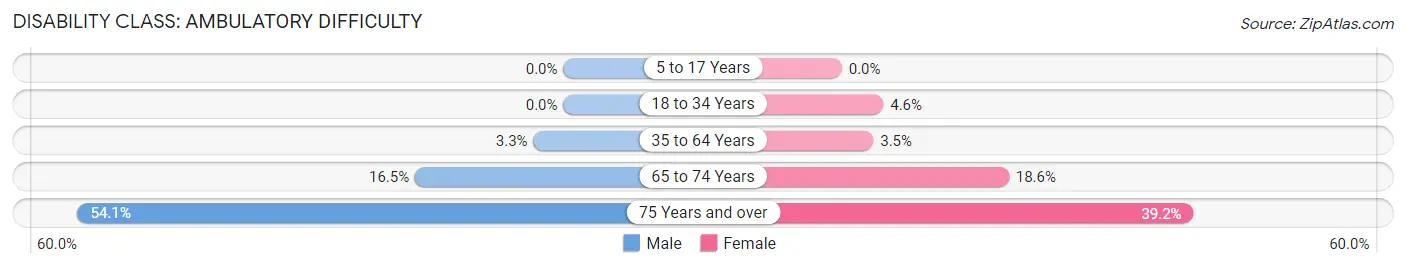
| Age Bracket | Male | Female |
| 5 to 17 Years | 0 (0.0%) | 0 (0.0%) |
| 18 to 34 Years | 0 (0.0%) | 53 (4.6%) |
| 35 to 64 Years | 55 (3.3%) | 83 (3.5%) |
| 65 to 74 Years | 96 (16.5%) | 64 (18.6%) |
| 75 Years and over | 33 (54.1%) | 65 (39.2%) |
Disability Class: Self-Care Difficulty
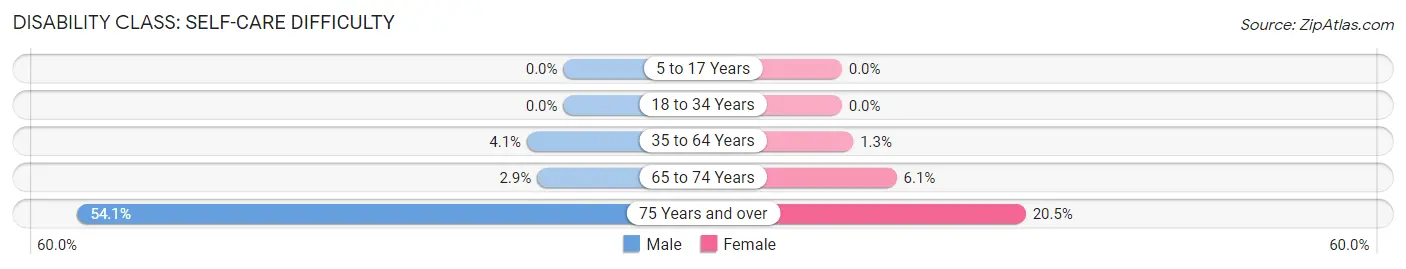
| Age Bracket | Male | Female |
| 5 to 17 Years | 0 (0.0%) | 0 (0.0%) |
| 18 to 34 Years | 0 (0.0%) | 0 (0.0%) |
| 35 to 64 Years | 67 (4.1%) | 30 (1.3%) |
| 65 to 74 Years | 17 (2.9%) | 21 (6.1%) |
| 75 Years and over | 33 (54.1%) | 34 (20.5%) |
Technology Access in Elgin
Computing Device Access in Elgin
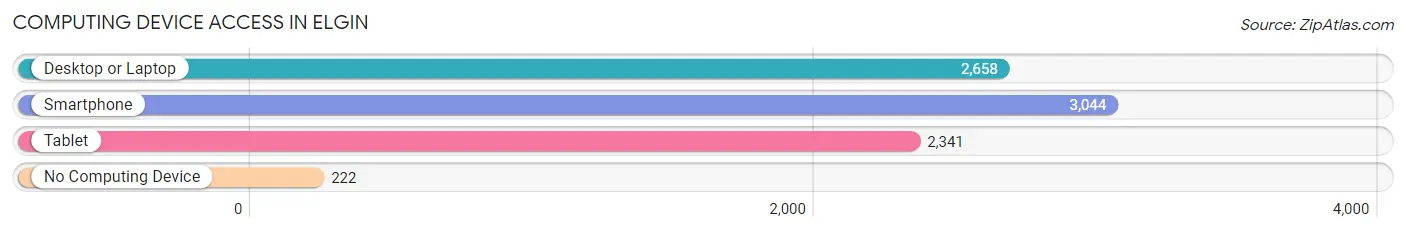
| Device Type | # Households | % Households |
| Desktop or Laptop | 2,658 | 76.9% |
| Smartphone | 3,044 | 88.1% |
| Tablet | 2,341 | 67.8% |
| No Computing Device | 222 | 6.4% |
| Total | 3,455 | 100.0% |
Internet Access in Elgin
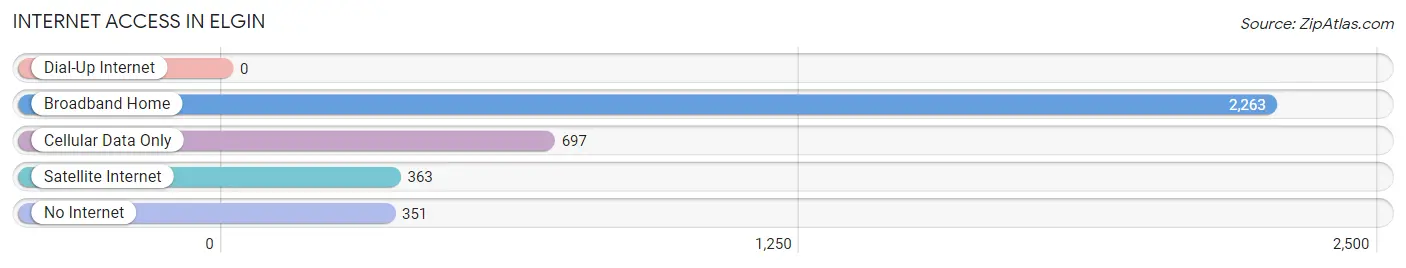
| Internet Type | # Households | % Households |
| Dial-Up Internet | 0 | 0.0% |
| Broadband Home | 2,263 | 65.5% |
| Cellular Data Only | 697 | 20.2% |
| Satellite Internet | 363 | 10.5% |
| No Internet | 351 | 10.2% |
| Total | 3,455 | 100.0% |
Elgin Summary
Elgin, Texas is a city located in Bastrop and Travis Counties in the state of Texas. It is part of the Greater Austin metropolitan area and is located about 20 miles east of Austin. The city has a population of 8,135 as of the 2010 census and is the largest city in Bastrop County.
History
Elgin was founded in 1872 by the International-Great Northern Railroad. The city was named after Robert Morris Elgin, the railroad's land commissioner. The city was incorporated in 1873 and was the first city in Bastrop County to be incorporated.
The city was a major center for cotton production and processing in the late 19th and early 20th centuries. The city was also home to the first cotton gin in the county, which was built in 1873.
Geography
Elgin is located at 30°17'45"N 97°23'45"W (30.295833, -97.395833). The city is situated at the intersection of U.S. Highway 290 and State Highway 95.
The city has a total area of 5.3 square miles, all of which is land. The city is located in the Colorado River basin and is part of the Blackland Prairie region of Texas.
Economy
Elgin is a major center for the production and processing of cotton. The city is home to the Elgin Cotton Oil Mill, which is the largest cottonseed oil mill in the world. The city is also home to the Elgin National Bank, which is the oldest continuously operating bank in Texas.
The city is also home to several manufacturing companies, including Elgin Sweeper Company, which produces street sweepers, and Elgin Industries, which produces automotive parts.
Demographics
As of the 2010 census, Elgin had a population of 8,135. The racial makeup of the city was 73.3% White, 11.2% African American, 0.7% Native American, 0.5% Asian, 0.1% Pacific Islander, 11.7% from other races, and 2.5% from two or more races. Hispanic or Latino of any race were 24.3% of the population.
The median income for a household in Elgin was $41,945, and the median income for a family was $50,945. The per capita income for the city was $20,845. About 17.2% of families and 21.2% of the population were below the poverty line, including 28.3% of those under age 18 and 11.2% of those age 65 or over.
Elgin is served by the Elgin Independent School District. The city is home to Elgin High School, which is the only high school in the district.
Common Questions
What is Per Capita Income in Elgin?
Per Capita income in Elgin is $33,552.
What is the Median Family Income in Elgin?
Median Family Income in Elgin is $79,762.
What is the Median Household income in Elgin?
Median Household Income in Elgin is $85,014.
What is Income or Wage Gap in Elgin?
Income or Wage Gap in Elgin is 1.0%.
Women in Elgin earn 99.0 cents for every dollar earned by a man.
What is Inequality or Gini Index in Elgin?
Inequality or Gini Index in Elgin is 0.40.
What is the Total Population of Elgin?
Total Population of Elgin is 10,043.
What is the Total Male Population of Elgin?
Total Male Population of Elgin is 4,792.
What is the Total Female Population of Elgin?
Total Female Population of Elgin is 5,251.
What is the Ratio of Males per 100 Females in Elgin?
There are 91.26 Males per 100 Females in Elgin.
What is the Ratio of Females per 100 Males in Elgin?
There are 109.58 Females per 100 Males in Elgin.
What is the Median Population Age in Elgin?
Median Population Age in Elgin is 36.9 Years.
What is the Average Family Size in Elgin
Average Family Size in Elgin is 3.3 People.
What is the Average Household Size in Elgin
Average Household Size in Elgin is 2.9 People.
How Large is the Labor Force in Elgin?
There are 5,621 People in the Labor Forcein in Elgin.
What is the Percentage of People in the Labor Force in Elgin?
71.5% of People are in the Labor Force in Elgin.
What is the Unemployment Rate in Elgin?
Unemployment Rate in Elgin is 6.2%.