Cities with the Most Immigrants from Lebanon in Texas
RELATED REPORTS & OPTIONS
Lebanon
Texas
Compare Cities
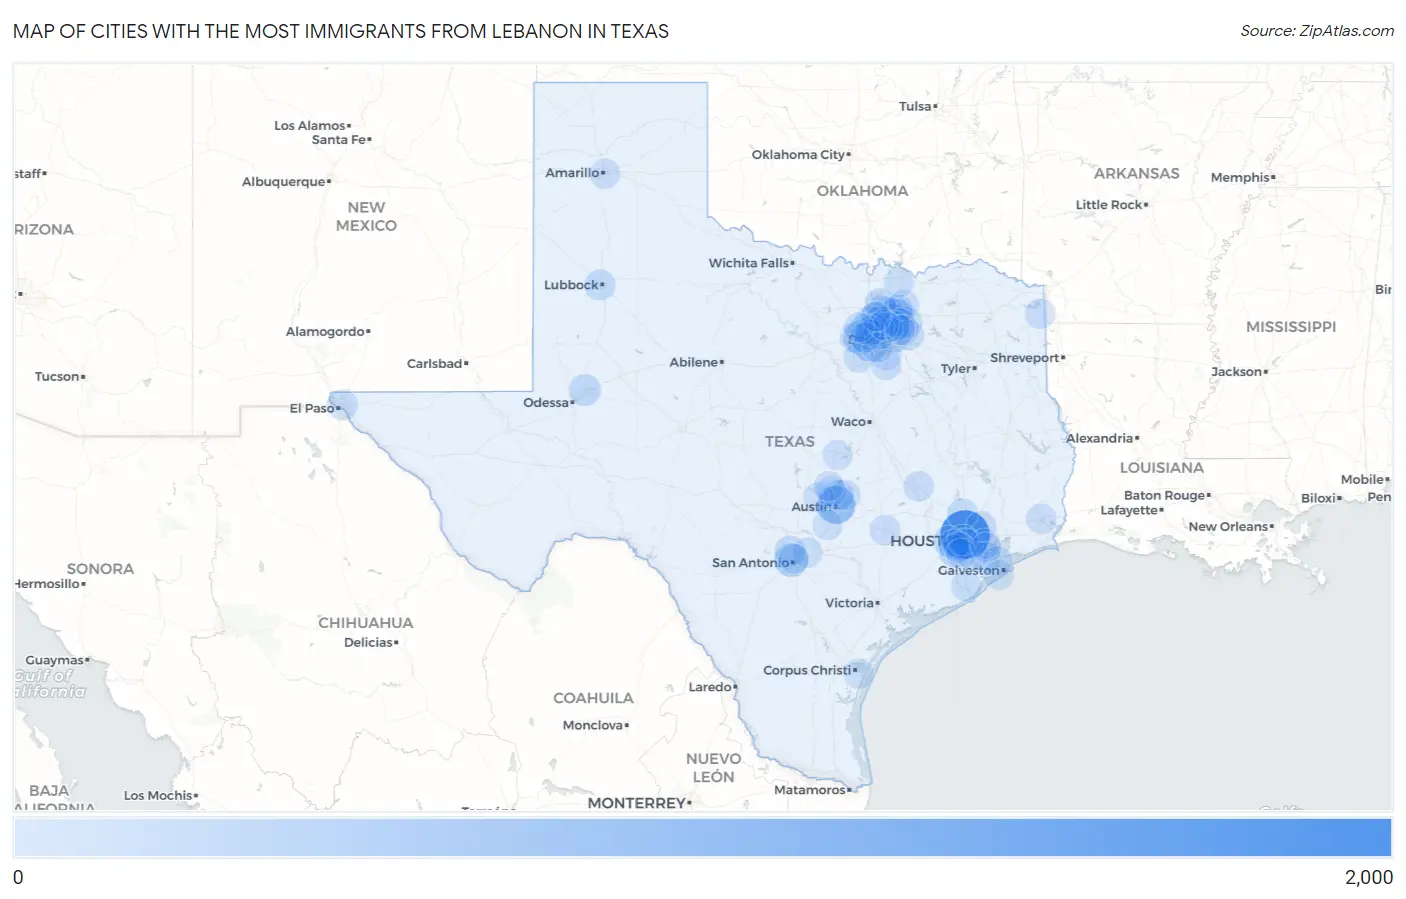
Map of Cities with the Most Immigrants from Lebanon in Texas
0
2,000
Cities with the Most Immigrants from Lebanon in Texas
| City | Lebanon | vs State | vs National | |
| 1. | Houston | 1,821 | 9,332(19.51%)#1 | 133,021(1.37%)#6 |
| 2. | Austin | 714 | 9,332(7.65%)#2 | 133,021(0.54%)#12 |
| 3. | Allen | 411 | 9,332(4.40%)#3 | 133,021(0.31%)#27 |
| 4. | San Antonio | 320 | 9,332(3.43%)#4 | 133,021(0.24%)#42 |
| 5. | Fort Worth | 304 | 9,332(3.26%)#5 | 133,021(0.23%)#47 |
| 6. | Arlington | 303 | 9,332(3.25%)#6 | 133,021(0.23%)#48 |
| 7. | Frisco | 239 | 9,332(2.56%)#7 | 133,021(0.18%)#70 |
| 8. | Dallas | 234 | 9,332(2.51%)#8 | 133,021(0.18%)#74 |
| 9. | Plano | 211 | 9,332(2.26%)#9 | 133,021(0.16%)#86 |
| 10. | Sugar Land | 208 | 9,332(2.23%)#10 | 133,021(0.16%)#88 |
| 11. | Pearland | 181 | 9,332(1.94%)#11 | 133,021(0.14%)#100 |
| 12. | Midland | 147 | 9,332(1.58%)#12 | 133,021(0.11%)#130 |
| 13. | Wylie | 139 | 9,332(1.49%)#13 | 133,021(0.10%)#135 |
| 14. | Cinco Ranch | 112 | 9,332(1.20%)#14 | 133,021(0.08%)#169 |
| 15. | League City | 81 | 9,332(0.87%)#15 | 133,021(0.06%)#254 |
| 16. | Little Elm | 79 | 9,332(0.85%)#16 | 133,021(0.06%)#262 |
| 17. | Lubbock | 78 | 9,332(0.84%)#17 | 133,021(0.06%)#265 |
| 18. | Aubrey | 78 | 9,332(0.84%)#18 | 133,021(0.06%)#270 |
| 19. | Shavano Park | 78 | 9,332(0.84%)#19 | 133,021(0.06%)#271 |
| 20. | Irving | 76 | 9,332(0.81%)#20 | 133,021(0.06%)#276 |
| 21. | El Paso | 74 | 9,332(0.79%)#21 | 133,021(0.06%)#289 |
| 22. | The Woodlands | 74 | 9,332(0.79%)#22 | 133,021(0.06%)#290 |
| 23. | Pflugerville | 61 | 9,332(0.65%)#23 | 133,021(0.05%)#356 |
| 24. | Mckinney | 46 | 9,332(0.49%)#24 | 133,021(0.03%)#448 |
| 25. | Heath | 46 | 9,332(0.49%)#25 | 133,021(0.03%)#454 |
| 26. | Flower Mound | 43 | 9,332(0.46%)#26 | 133,021(0.03%)#473 |
| 27. | Murphy | 43 | 9,332(0.46%)#27 | 133,021(0.03%)#481 |
| 28. | Beaumont | 40 | 9,332(0.43%)#28 | 133,021(0.03%)#504 |
| 29. | West University Place | 39 | 9,332(0.42%)#29 | 133,021(0.03%)#525 |
| 30. | Bellaire | 38 | 9,332(0.41%)#30 | 133,021(0.03%)#533 |
| 31. | College Station | 36 | 9,332(0.39%)#31 | 133,021(0.03%)#547 |
| 32. | Lewisville | 35 | 9,332(0.38%)#32 | 133,021(0.03%)#558 |
| 33. | Sienna | 35 | 9,332(0.38%)#33 | 133,021(0.03%)#566 |
| 34. | Sansom Park | 33 | 9,332(0.35%)#34 | 133,021(0.02%)#602 |
| 35. | Highland Village | 32 | 9,332(0.34%)#35 | 133,021(0.02%)#620 |
| 36. | Mission Bend | 31 | 9,332(0.33%)#36 | 133,021(0.02%)#636 |
| 37. | Glenn Heights | 30 | 9,332(0.32%)#37 | 133,021(0.02%)#651 |
| 38. | Atascocita | 29 | 9,332(0.31%)#38 | 133,021(0.02%)#661 |
| 39. | Piney Point Village | 26 | 9,332(0.28%)#39 | 133,021(0.02%)#725 |
| 40. | Melissa | 25 | 9,332(0.27%)#40 | 133,021(0.02%)#746 |
| 41. | Richardson | 24 | 9,332(0.26%)#41 | 133,021(0.02%)#753 |
| 42. | Lake Jackson | 24 | 9,332(0.26%)#42 | 133,021(0.02%)#761 |
| 43. | Wells Branch | 22 | 9,332(0.24%)#43 | 133,021(0.02%)#808 |
| 44. | Grapevine | 21 | 9,332(0.23%)#44 | 133,021(0.02%)#822 |
| 45. | La Grange | 21 | 9,332(0.23%)#45 | 133,021(0.02%)#838 |
| 46. | Coppell | 20 | 9,332(0.21%)#46 | 133,021(0.02%)#847 |
| 47. | Rowlett | 19 | 9,332(0.20%)#47 | 133,021(0.01%)#868 |
| 48. | Bedford | 19 | 9,332(0.20%)#48 | 133,021(0.01%)#871 |
| 49. | Burleson | 19 | 9,332(0.20%)#49 | 133,021(0.01%)#872 |
| 50. | Addison | 19 | 9,332(0.20%)#50 | 133,021(0.01%)#886 |
| 51. | Amarillo | 18 | 9,332(0.19%)#51 | 133,021(0.01%)#893 |
| 52. | Colleyville | 18 | 9,332(0.19%)#52 | 133,021(0.01%)#911 |
| 53. | Queen City | 18 | 9,332(0.19%)#53 | 133,021(0.01%)#933 |
| 54. | Briarcliff | 17 | 9,332(0.18%)#54 | 133,021(0.01%)#961 |
| 55. | Keller | 16 | 9,332(0.17%)#55 | 133,021(0.01%)#976 |
| 56. | Richland Hills | 16 | 9,332(0.17%)#56 | 133,021(0.01%)#993 |
| 57. | Waxahachie | 15 | 9,332(0.16%)#57 | 133,021(0.01%)#1,004 |
| 58. | Corpus Christi | 14 | 9,332(0.15%)#58 | 133,021(0.01%)#1,031 |
| 59. | Cedar Park | 14 | 9,332(0.15%)#59 | 133,021(0.01%)#1,034 |
| 60. | Grand Prairie | 11 | 9,332(0.12%)#60 | 133,021(0.01%)#1,130 |
| 61. | Sherman | 11 | 9,332(0.12%)#61 | 133,021(0.01%)#1,139 |
| 62. | Deer Park | 11 | 9,332(0.12%)#62 | 133,021(0.01%)#1,142 |
| 63. | Meadows Place | 11 | 9,332(0.12%)#63 | 133,021(0.01%)#1,174 |
| 64. | Texas City | 10 | 9,332(0.11%)#64 | 133,021(0.01%)#1,191 |
| 65. | Schertz | 10 | 9,332(0.11%)#65 | 133,021(0.01%)#1,196 |
| 66. | Carrollton | 9 | 9,332(0.10%)#66 | 133,021(0.01%)#1,245 |
| 67. | Galveston | 9 | 9,332(0.10%)#67 | 133,021(0.01%)#1,256 |
| 68. | Kyle | 9 | 9,332(0.10%)#68 | 133,021(0.01%)#1,257 |
| 69. | Hickory Creek | 9 | 9,332(0.10%)#69 | 133,021(0.01%)#1,282 |
| 70. | Haslet | 9 | 9,332(0.10%)#70 | 133,021(0.01%)#1,283 |
| 71. | Missouri City | 8 | 9,332(0.09%)#71 | 133,021(0.01%)#1,287 |
| 72. | Leander | 6 | 9,332(0.06%)#72 | 133,021(0.00%)#1,388 |
| 73. | Killeen | 4 | 9,332(0.04%)#73 | 133,021(0.00%)#1,447 |
| 74. | Olmos Park | 4 | 9,332(0.04%)#74 | 133,021(0.00%)#1,471 |
| 75. | Pasadena | 2 | 9,332(0.02%)#75 | 133,021(0.00%)#1,516 |
| 76. | Garland | 1 | 9,332(0.01%)#76 | 133,021(0.00%)#1,535 |
Common Questions
What are the Top 10 Cities with the Most Immigrants from Lebanon in Texas?
Top 10 Cities with the Most Immigrants from Lebanon in Texas are:
#1
1,821
#2
714
#3
411
#4
320
#5
304
#6
303
#7
239
#8
234
#9
211
#10
208
What city has the Most Immigrants from Lebanon in Texas?
Houston has the Most Immigrants from Lebanon in Texas with 1,821.
What is the Total Immigrants from Lebanon in the State of Texas?
Total Immigrants from Lebanon in Texas is 9,332.
What is the Total Immigrants from Lebanon in the United States?
Total Immigrants from Lebanon in the United States is 133,021.