Universal City, TX Map & Demographics
Universal City Map
Universal City Overview
$36,828
PER CAPITA INCOME
$80,949
AVG FAMILY INCOME
$71,287
AVG HOUSEHOLD INCOME
2.3%
WAGE / INCOME GAP [ % ]
97.7¢/ $1
WAGE / INCOME GAP [ $ ]
0.41
INEQUALITY / GINI INDEX
19,798
TOTAL POPULATION
9,975
MALE POPULATION
9,823
FEMALE POPULATION
101.55
MALES / 100 FEMALES
98.48
FEMALES / 100 MALES
37.2
MEDIAN AGE
3.0
AVG FAMILY SIZE
2.6
AVG HOUSEHOLD SIZE
10,538
LABOR FORCE [ PEOPLE ]
68.0%
PERCENT IN LABOR FORCE
5.1%
UNEMPLOYMENT RATE
Universal City Zip Codes
Universal City Area Codes
Income in Universal City
Income Overview in Universal City
Per Capita Income in Universal City is $36,828, while median incomes of families and households are $80,949 and $71,287 respectively.
| Characteristic | Number | Measure |
| Per Capita Income | 19,798 | $36,828 |
| Median Family Income | 5,281 | $80,949 |
| Mean Family Income | 5,281 | $102,571 |
| Median Household Income | 7,592 | $71,287 |
| Mean Household Income | 7,592 | $93,867 |
| Income Deficit | 5,281 | $0 |
| Wage / Income Gap (%) | 19,798 | 2.28% |
| Wage / Income Gap ($) | 19,798 | 97.72¢ per $1 |
| Gini / Inequality Index | 19,798 | 0.41 |
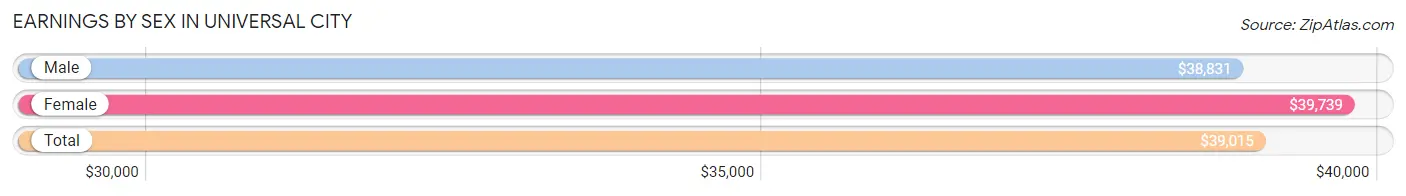
Earnings by Sex in Universal City
Average Earnings in Universal City are $39,015, $38,831 for men and $39,739 for women, a difference of 2.3%.
| Sex | Number | Average Earnings |
| Male | 5,769 (53.7%) | $38,831 |
| Female | 4,971 (46.3%) | $39,739 |
| Total | 10,740 (100.0%) | $39,015 |
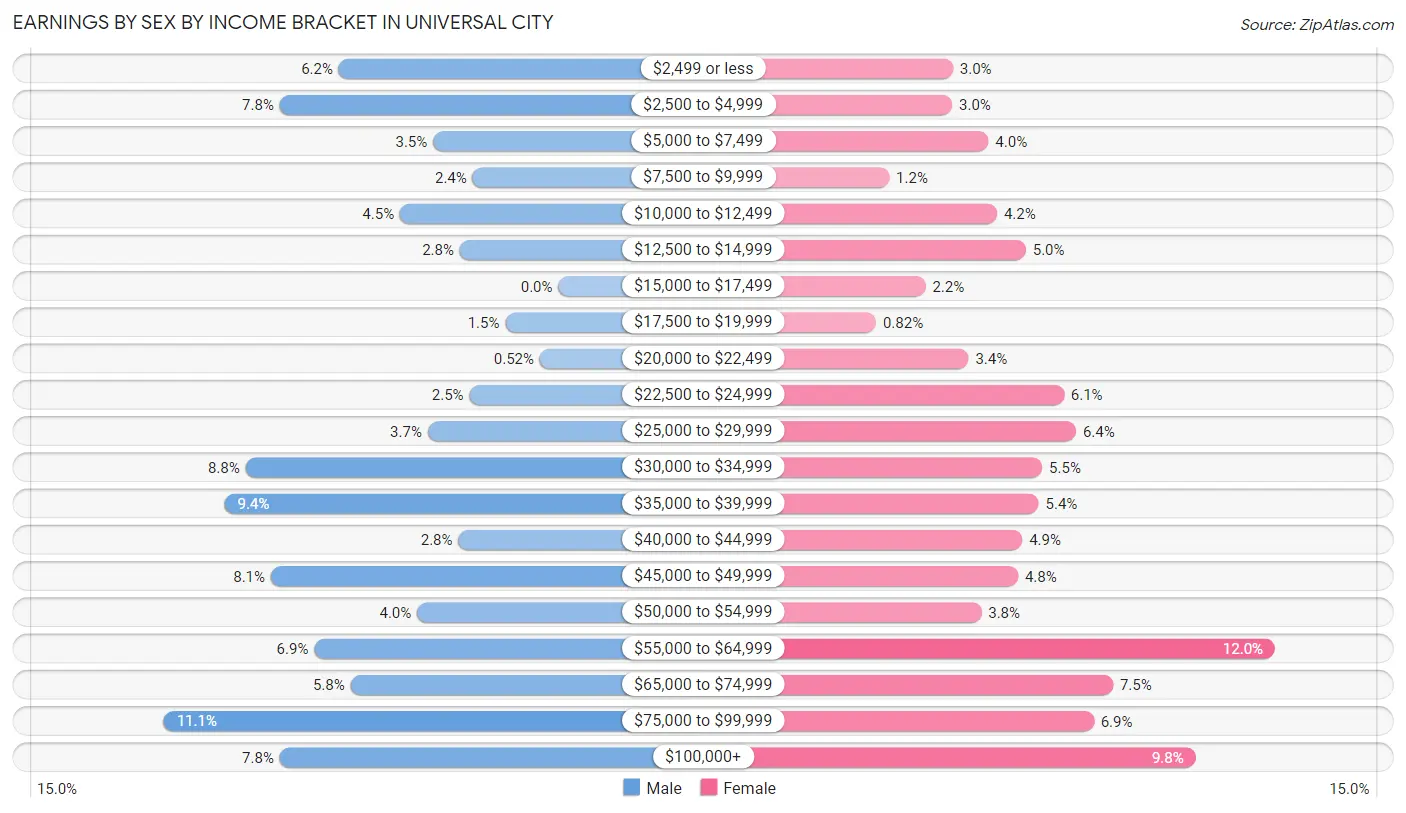
Earnings by Sex by Income Bracket in Universal City
The most common earnings brackets in Universal City are $75,000 to $99,999 for men (640 | 11.1%) and $55,000 to $64,999 for women (598 | 12.0%).
| Income | Male | Female |
| $2,499 or less | 356 (6.2%) | 148 (3.0%) |
| $2,500 to $4,999 | 452 (7.8%) | 147 (3.0%) |
| $5,000 to $7,499 | 203 (3.5%) | 198 (4.0%) |
| $7,500 to $9,999 | 139 (2.4%) | 59 (1.2%) |
| $10,000 to $12,499 | 257 (4.4%) | 210 (4.2%) |
| $12,500 to $14,999 | 160 (2.8%) | 250 (5.0%) |
| $15,000 to $17,499 | 0 (0.0%) | 110 (2.2%) |
| $17,500 to $19,999 | 86 (1.5%) | 41 (0.8%) |
| $20,000 to $22,499 | 30 (0.5%) | 170 (3.4%) |
| $22,500 to $24,999 | 144 (2.5%) | 303 (6.1%) |
| $25,000 to $29,999 | 212 (3.7%) | 320 (6.4%) |
| $30,000 to $34,999 | 507 (8.8%) | 273 (5.5%) |
| $35,000 to $39,999 | 541 (9.4%) | 268 (5.4%) |
| $40,000 to $44,999 | 162 (2.8%) | 245 (4.9%) |
| $45,000 to $49,999 | 466 (8.1%) | 239 (4.8%) |
| $50,000 to $54,999 | 229 (4.0%) | 188 (3.8%) |
| $55,000 to $64,999 | 396 (6.9%) | 598 (12.0%) |
| $65,000 to $74,999 | 337 (5.8%) | 372 (7.5%) |
| $75,000 to $99,999 | 640 (11.1%) | 345 (6.9%) |
| $100,000+ | 452 (7.8%) | 487 (9.8%) |
| Total | 5,769 (100.0%) | 4,971 (100.0%) |
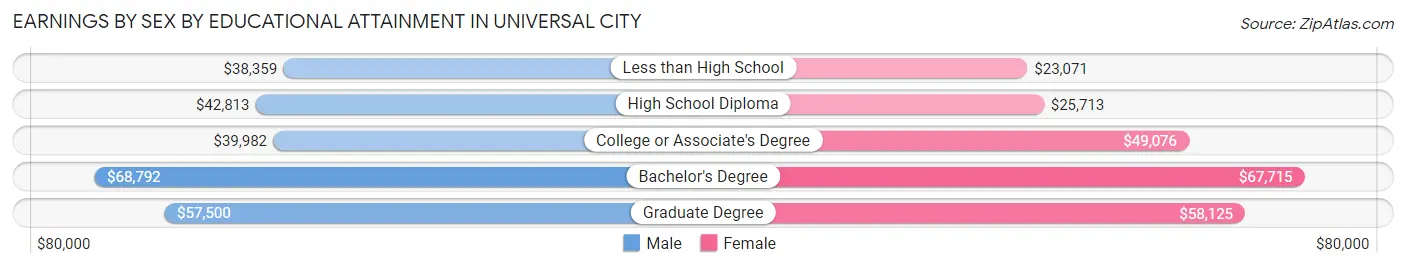
Earnings by Sex by Educational Attainment in Universal City
Average earnings in Universal City are $46,579 for men and $45,820 for women, a difference of 1.6%. Men with an educational attainment of bachelor's degree enjoy the highest average annual earnings of $68,792, while those with less than high school education earn the least with $38,359. Women with an educational attainment of bachelor's degree earn the most with the average annual earnings of $67,715, while those with less than high school education have the smallest earnings of $23,071.
| Educational Attainment | Male Income | Female Income |
| Less than High School | $38,359 | $23,071 |
| High School Diploma | $42,813 | $25,713 |
| College or Associate's Degree | $39,982 | $49,076 |
| Bachelor's Degree | $68,792 | $67,715 |
| Graduate Degree | $57,500 | $58,125 |
| Total | $46,579 | $45,820 |
Family Income in Universal City
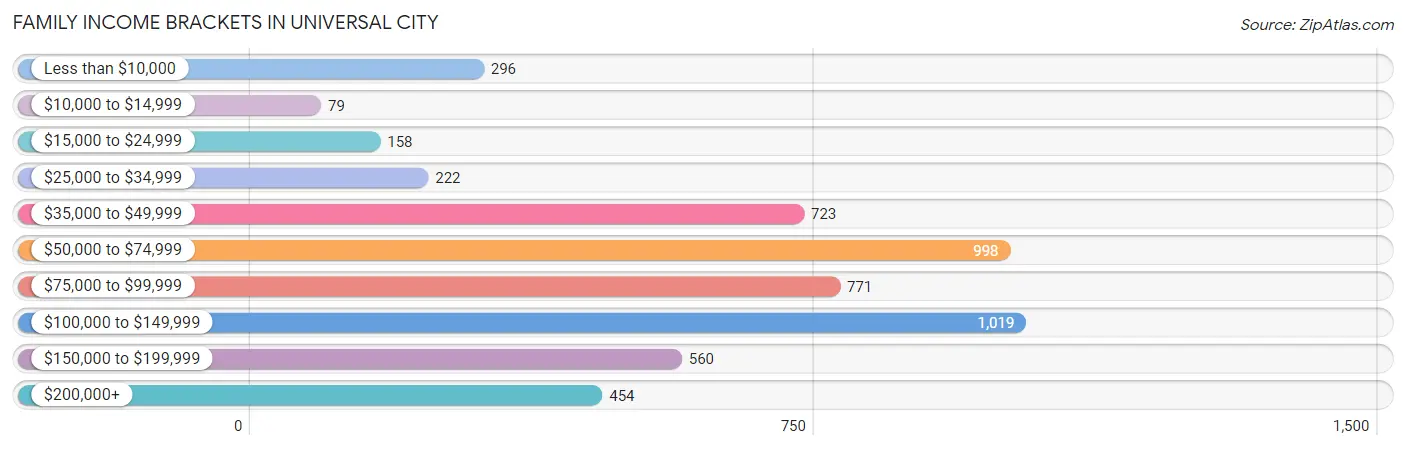
Family Income Brackets in Universal City
According to the Universal City family income data, there are 1,019 families falling into the $100,000 to $149,999 income range, which is the most common income bracket and makes up 19.3% of all families. Conversely, the $10,000 to $14,999 income bracket is the least frequent group with only 79 families (1.5%) belonging to this category.
| Income Bracket | # Families | % Families |
| Less than $10,000 | 296 | 5.6% |
| $10,000 to $14,999 | 79 | 1.5% |
| $15,000 to $24,999 | 158 | 3.0% |
| $25,000 to $34,999 | 222 | 4.2% |
| $35,000 to $49,999 | 723 | 13.7% |
| $50,000 to $74,999 | 998 | 18.9% |
| $75,000 to $99,999 | 771 | 14.6% |
| $100,000 to $149,999 | 1,019 | 19.3% |
| $150,000 to $199,999 | 560 | 10.6% |
| $200,000+ | 454 | 8.6% |
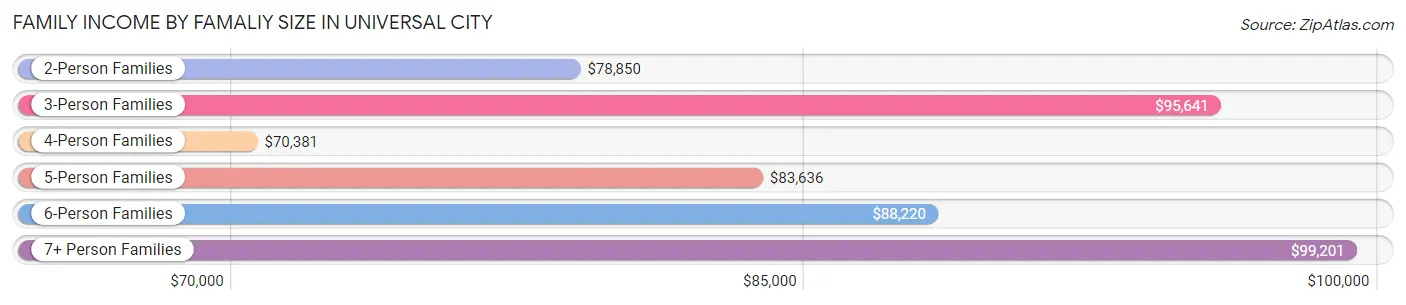
Family Income by Famaliy Size in Universal City
7+ person families (97 | 1.8%) account for the highest median family income in Universal City with $99,201 per family, while 2-person families (2,579 | 48.8%) have the highest median income of $39,425 per family member.
| Income Bracket | # Families | Median Income |
| 2-Person Families | 2,579 (48.8%) | $78,850 |
| 3-Person Families | 1,460 (27.7%) | $95,641 |
| 4-Person Families | 802 (15.2%) | $70,381 |
| 5-Person Families | 244 (4.6%) | $83,636 |
| 6-Person Families | 99 (1.9%) | $88,220 |
| 7+ Person Families | 97 (1.8%) | $99,201 |
| Total | 5,281 (100.0%) | $80,949 |
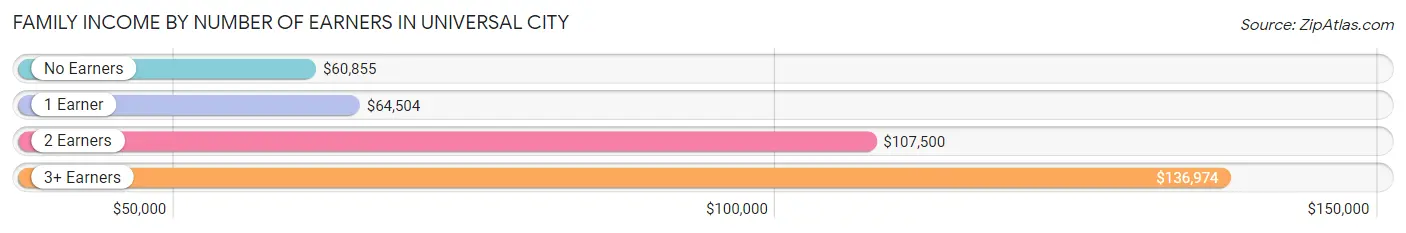
Family Income by Number of Earners in Universal City
The median family income in Universal City is $80,949, with families comprising 3+ earners (666) having the highest median family income of $136,974, while families with no earners (1,007) have the lowest median family income of $60,855, accounting for 12.6% and 19.1% of families, respectively.
| Number of Earners | # Families | Median Income |
| No Earners | 1,007 (19.1%) | $60,855 |
| 1 Earner | 1,646 (31.2%) | $64,504 |
| 2 Earners | 1,962 (37.1%) | $107,500 |
| 3+ Earners | 666 (12.6%) | $136,974 |
| Total | 5,281 (100.0%) | $80,949 |
Household Income in Universal City
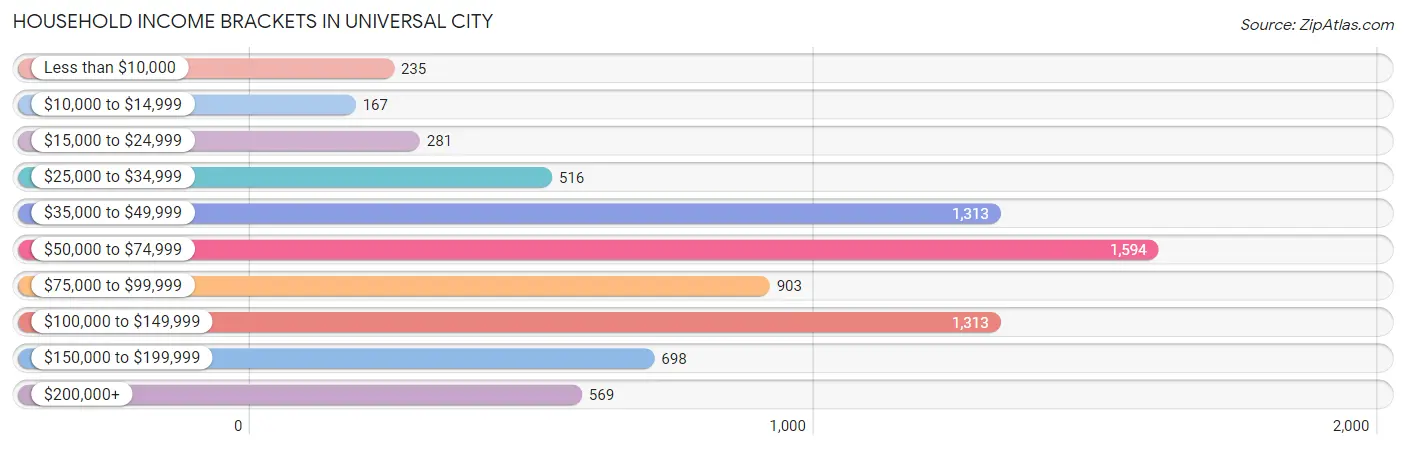
Household Income Brackets in Universal City
With 1,594 households falling in the category, the $50,000 to $74,999 income range is the most frequent in Universal City, accounting for 21.0% of all households. In contrast, only 167 households (2.2%) fall into the $10,000 to $14,999 income bracket, making it the least populous group.
| Income Bracket | # Households | % Households |
| Less than $10,000 | 235 | 3.1% |
| $10,000 to $14,999 | 167 | 2.2% |
| $15,000 to $24,999 | 281 | 3.7% |
| $25,000 to $34,999 | 516 | 6.8% |
| $35,000 to $49,999 | 1,313 | 17.3% |
| $50,000 to $74,999 | 1,594 | 21.0% |
| $75,000 to $99,999 | 903 | 11.9% |
| $100,000 to $149,999 | 1,313 | 17.3% |
| $150,000 to $199,999 | 698 | 9.2% |
| $200,000+ | 569 | 7.5% |
Household Income by Householder Age in Universal City
The median household income in Universal City is $71,287, with the highest median household income of $87,406 found in the 45 to 64 years age bracket for the primary householder. A total of 3,020 households (39.8%) fall into this category. Meanwhile, the 15 to 24 years age bracket for the primary householder has the lowest median household income of $47,647, with 472 households (6.2%) in this group.
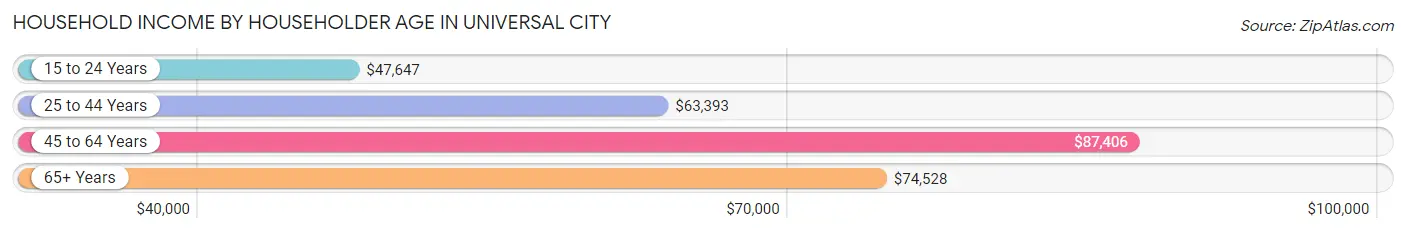
| Income Bracket | # Households | Median Income |
| 15 to 24 Years | 472 (6.2%) | $47,647 |
| 25 to 44 Years | 2,558 (33.7%) | $63,393 |
| 45 to 64 Years | 3,020 (39.8%) | $87,406 |
| 65+ Years | 1,542 (20.3%) | $74,528 |
| Total | 7,592 (100.0%) | $71,287 |
Poverty in Universal City
Income Below Poverty by Sex and Age in Universal City
With 12.6% poverty level for males and 10.8% for females among the residents of Universal City, 5 year old males and under 5 year old females are the most vulnerable to poverty, with 20 males (23.8%) and 129 females (26.3%) in their respective age groups living below the poverty level.
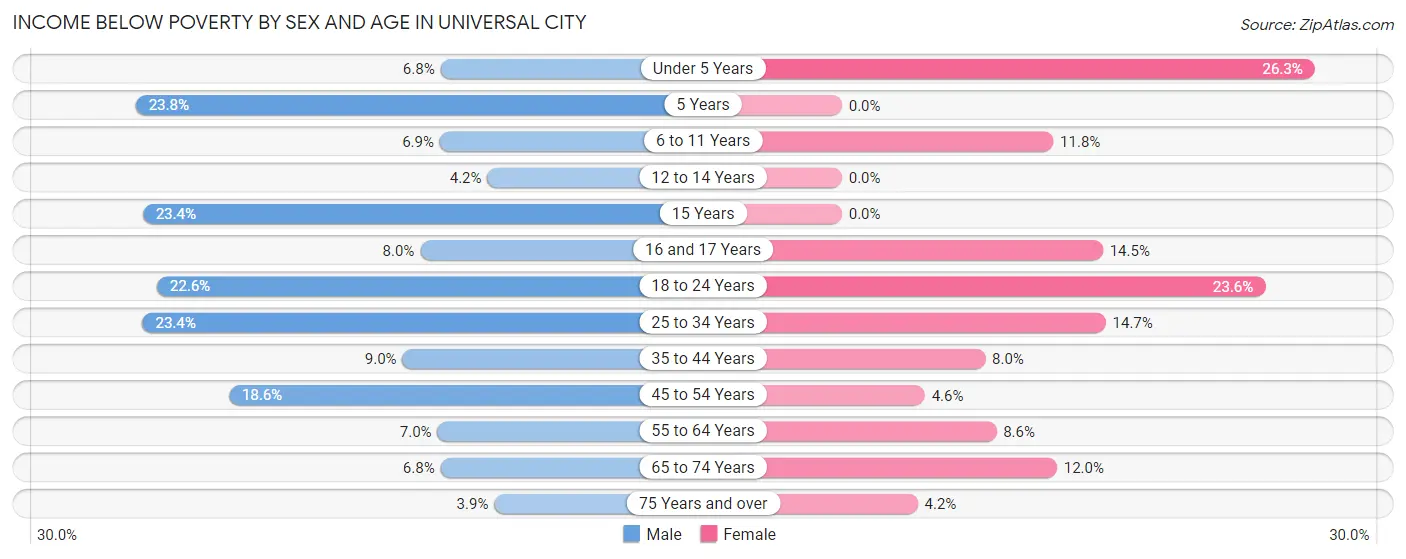
| Age Bracket | Male | Female |
| Under 5 Years | 18 (6.8%) | 129 (26.3%) |
| 5 Years | 20 (23.8%) | 0 (0.0%) |
| 6 to 11 Years | 80 (6.9%) | 111 (11.8%) |
| 12 to 14 Years | 18 (4.2%) | 0 (0.0%) |
| 15 Years | 26 (23.4%) | 0 (0.0%) |
| 16 and 17 Years | 20 (8.0%) | 26 (14.5%) |
| 18 to 24 Years | 236 (22.6%) | 193 (23.6%) |
| 25 to 34 Years | 328 (23.4%) | 199 (14.7%) |
| 35 to 44 Years | 114 (9.0%) | 106 (8.0%) |
| 45 to 54 Years | 214 (18.6%) | 48 (4.6%) |
| 55 to 64 Years | 102 (7.0%) | 139 (8.6%) |
| 65 to 74 Years | 58 (6.8%) | 82 (12.0%) |
| 75 Years and over | 18 (3.8%) | 25 (4.2%) |
| Total | 1,252 (12.6%) | 1,058 (10.8%) |
Income Above Poverty by Sex and Age in Universal City
According to the poverty statistics in Universal City, males aged 75 years and over and females aged 5 years are the age groups that are most secure financially, with 96.2% of males and 100.0% of females in these age groups living above the poverty line.
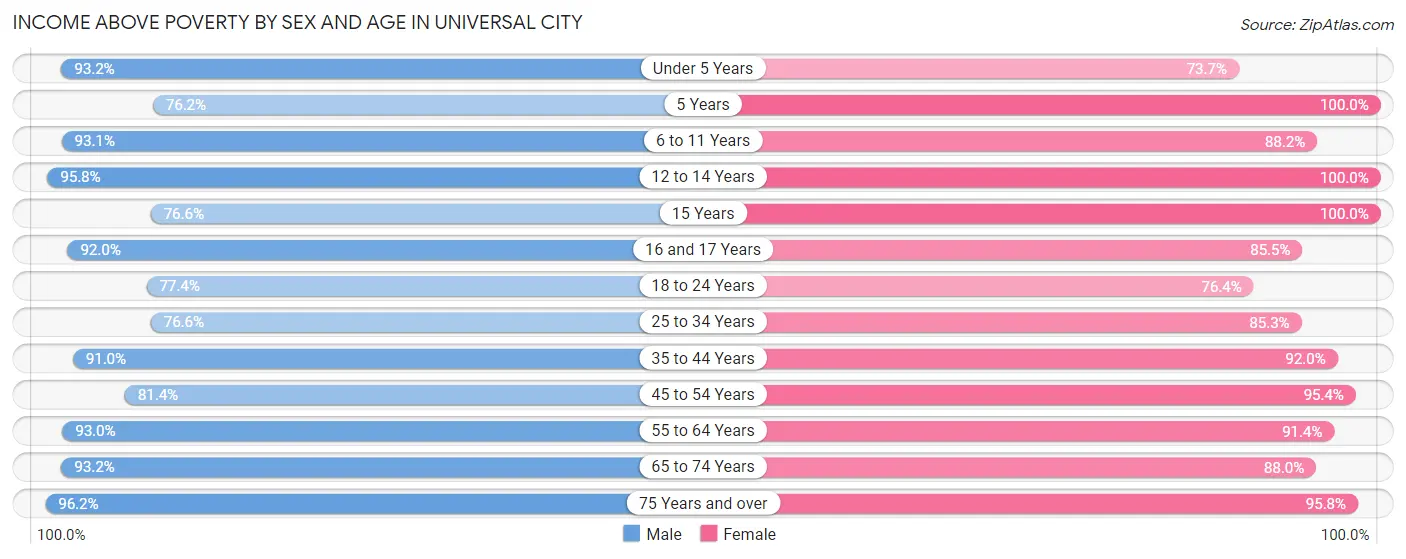
| Age Bracket | Male | Female |
| Under 5 Years | 245 (93.2%) | 361 (73.7%) |
| 5 Years | 64 (76.2%) | 20 (100.0%) |
| 6 to 11 Years | 1,082 (93.1%) | 832 (88.2%) |
| 12 to 14 Years | 408 (95.8%) | 606 (100.0%) |
| 15 Years | 85 (76.6%) | 101 (100.0%) |
| 16 and 17 Years | 231 (92.0%) | 153 (85.5%) |
| 18 to 24 Years | 807 (77.4%) | 626 (76.4%) |
| 25 to 34 Years | 1,072 (76.6%) | 1,156 (85.3%) |
| 35 to 44 Years | 1,158 (91.0%) | 1,222 (92.0%) |
| 45 to 54 Years | 935 (81.4%) | 990 (95.4%) |
| 55 to 64 Years | 1,353 (93.0%) | 1,477 (91.4%) |
| 65 to 74 Years | 790 (93.2%) | 603 (88.0%) |
| 75 Years and over | 449 (96.2%) | 567 (95.8%) |
| Total | 8,679 (87.4%) | 8,714 (89.2%) |
Income Below Poverty Among Married-Couple Families in Universal City
The poverty statistics for married-couple families in Universal City show that 4.3% or 149 of the total 3,496 families live below the poverty line. Families with 1 or 2 children have the highest poverty rate of 4.8%, comprising of 48 families. On the other hand, families with 3 or 4 children have the lowest poverty rate of 0.0%, which includes 0 families.
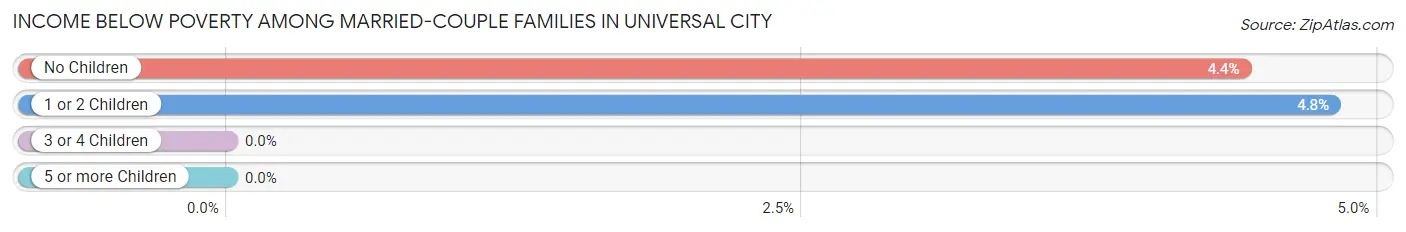
| Children | Above Poverty | Below Poverty |
| No Children | 2,189 (95.6%) | 101 (4.4%) |
| 1 or 2 Children | 951 (95.2%) | 48 (4.8%) |
| 3 or 4 Children | 126 (100.0%) | 0 (0.0%) |
| 5 or more Children | 81 (100.0%) | 0 (0.0%) |
| Total | 3,347 (95.7%) | 149 (4.3%) |
Income Below Poverty Among Single-Parent Households in Universal City
According to the poverty data in Universal City, 10.3% or 69 single-father households and 25.6% or 286 single-mother households are living below the poverty line. Among single-father households, those with no children have the highest poverty rate, with 55 households (18.2%) experiencing poverty. Likewise, among single-mother households, those with no children have the highest poverty rate, with 133 households (33.9%) falling below the poverty line.
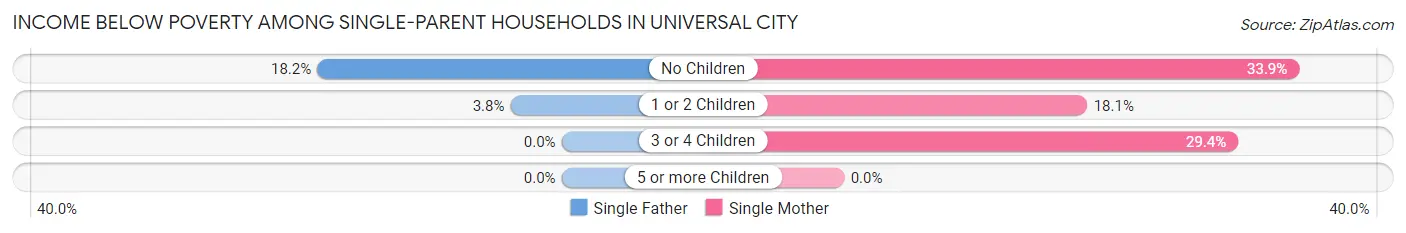
| Children | Single Father | Single Mother |
| No Children | 55 (18.2%) | 133 (33.9%) |
| 1 or 2 Children | 14 (3.8%) | 96 (18.1%) |
| 3 or 4 Children | 0 (0.0%) | 57 (29.4%) |
| 5 or more Children | 0 (0.0%) | 0 (0.0%) |
| Total | 69 (10.3%) | 286 (25.6%) |
Income Below Poverty Among Married-Couple vs Single-Parent Households in Universal City
The poverty data for Universal City shows that 149 of the married-couple family households (4.3%) and 355 of the single-parent households (19.9%) are living below the poverty level. Within the married-couple family households, those with 1 or 2 children have the highest poverty rate, with 48 households (4.8%) falling below the poverty line. Among the single-parent households, those with 3 or 4 children have the highest poverty rate, with 57 household (29.4%) living below poverty.
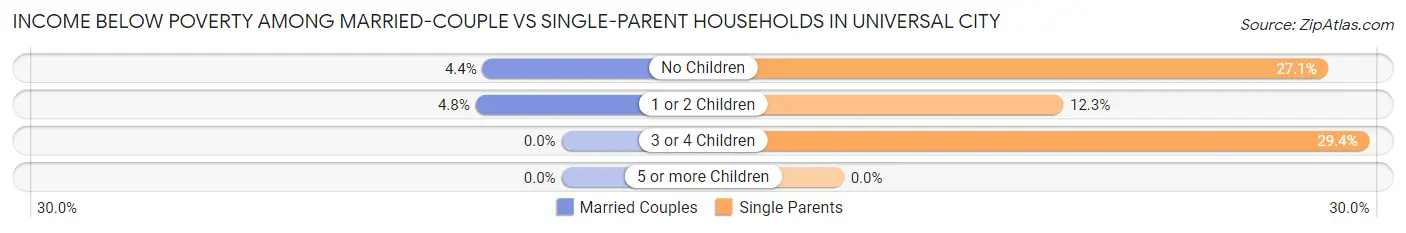
| Children | Married-Couple Families | Single-Parent Households |
| No Children | 101 (4.4%) | 188 (27.1%) |
| 1 or 2 Children | 48 (4.8%) | 110 (12.3%) |
| 3 or 4 Children | 0 (0.0%) | 57 (29.4%) |
| 5 or more Children | 0 (0.0%) | 0 (0.0%) |
| Total | 149 (4.3%) | 355 (19.9%) |
Race in Universal City
The most populous races in Universal City are White / Caucasian (12,791 | 64.6%), Hispanic or Latino (8,114 | 41.0%), and Two or more Races (2,888 | 14.6%).
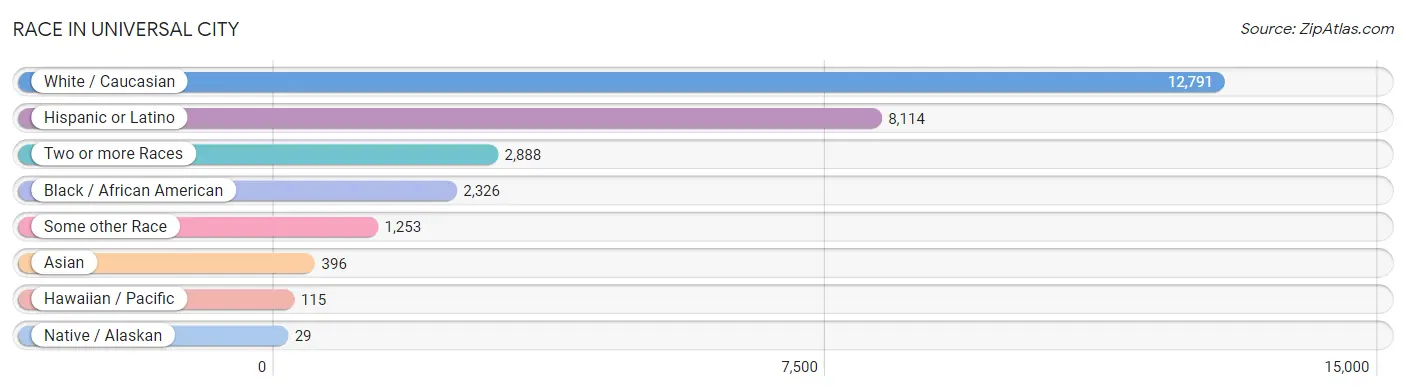
| Race | # Population | % Population |
| Asian | 396 | 2.0% |
| Black / African American | 2,326 | 11.7% |
| Hawaiian / Pacific | 115 | 0.6% |
| Hispanic or Latino | 8,114 | 41.0% |
| Native / Alaskan | 29 | 0.2% |
| White / Caucasian | 12,791 | 64.6% |
| Two or more Races | 2,888 | 14.6% |
| Some other Race | 1,253 | 6.3% |
| Total | 19,798 | 100.0% |
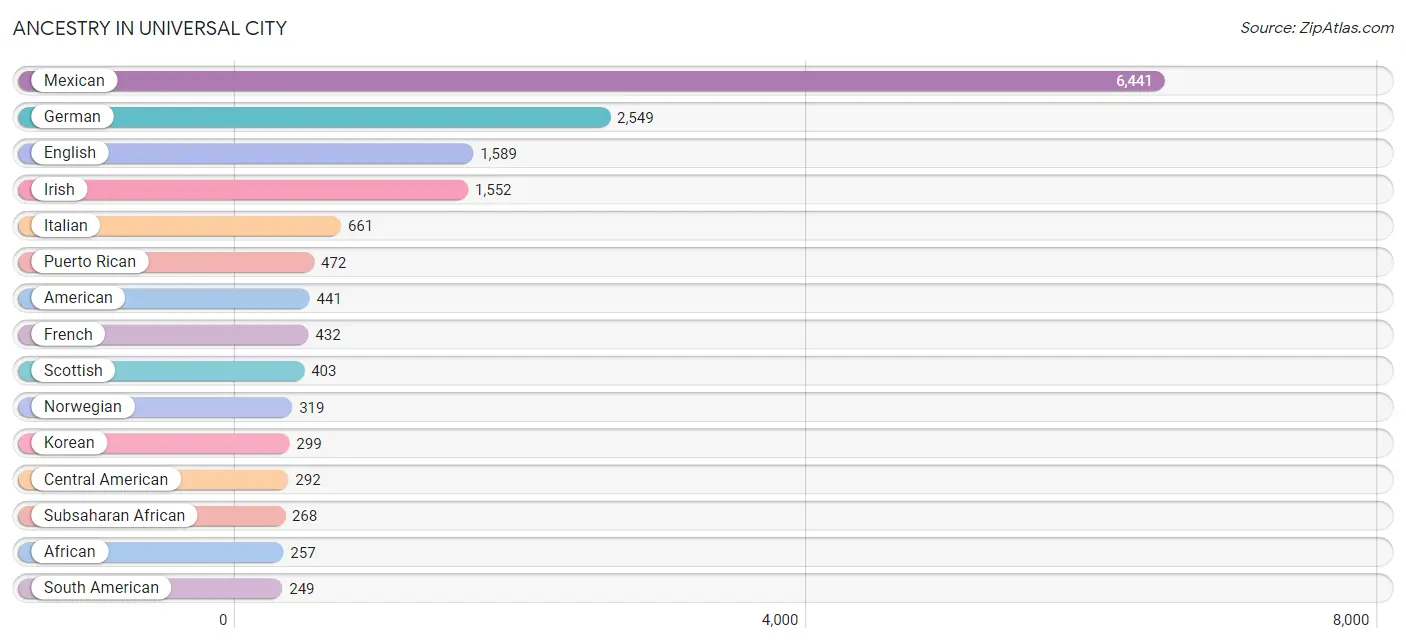
Ancestry in Universal City
The most populous ancestries reported in Universal City are Mexican (6,441 | 32.5%), German (2,549 | 12.9%), English (1,589 | 8.0%), Irish (1,552 | 7.8%), and Italian (661 | 3.3%), together accounting for 64.6% of all Universal City residents.
| Ancestry | # Population | % Population |
| African | 257 | 1.3% |
| American | 441 | 2.2% |
| Armenian | 13 | 0.1% |
| Austrian | 7 | 0.0% |
| Belgian | 17 | 0.1% |
| Bhutanese | 22 | 0.1% |
| British | 147 | 0.7% |
| Burmese | 27 | 0.1% |
| Central American | 292 | 1.5% |
| Cherokee | 43 | 0.2% |
| Choctaw | 35 | 0.2% |
| Cuban | 61 | 0.3% |
| Czech | 42 | 0.2% |
| Czechoslovakian | 83 | 0.4% |
| Danish | 44 | 0.2% |
| Dutch | 110 | 0.6% |
| Ecuadorian | 79 | 0.4% |
| English | 1,589 | 8.0% |
| European | 164 | 0.8% |
| Filipino | 66 | 0.3% |
| Finnish | 51 | 0.3% |
| French | 432 | 2.2% |
| French Canadian | 20 | 0.1% |
| German | 2,549 | 12.9% |
| Greek | 66 | 0.3% |
| Guatemalan | 53 | 0.3% |
| Haitian | 11 | 0.1% |
| Honduran | 28 | 0.1% |
| Hungarian | 77 | 0.4% |
| Iranian | 73 | 0.4% |
| Irish | 1,552 | 7.8% |
| Iroquois | 46 | 0.2% |
| Israeli | 16 | 0.1% |
| Italian | 661 | 3.3% |
| Jamaican | 48 | 0.2% |
| Japanese | 35 | 0.2% |
| Korean | 299 | 1.5% |
| Mexican | 6,441 | 32.5% |
| Mexican American Indian | 35 | 0.2% |
| Native Hawaiian | 147 | 0.7% |
| Norwegian | 319 | 1.6% |
| Osage | 10 | 0.1% |
| Pakistani | 42 | 0.2% |
| Panamanian | 158 | 0.8% |
| Polish | 160 | 0.8% |
| Portuguese | 85 | 0.4% |
| Puerto Rican | 472 | 2.4% |
| Russian | 25 | 0.1% |
| Salvadoran | 53 | 0.3% |
| Scandinavian | 13 | 0.1% |
| Scotch-Irish | 138 | 0.7% |
| Scottish | 403 | 2.0% |
| Sioux | 46 | 0.2% |
| Slovak | 25 | 0.1% |
| South American | 249 | 1.3% |
| Spaniard | 194 | 1.0% |
| Spanish | 201 | 1.0% |
| Sri Lankan | 52 | 0.3% |
| Subsaharan African | 268 | 1.3% |
| Swedish | 121 | 0.6% |
| Swiss | 11 | 0.1% |
| Turkish | 14 | 0.1% |
| Ukrainian | 35 | 0.2% |
| Venezuelan | 170 | 0.9% |
| Welsh | 87 | 0.4% |
| West Indian | 8 | 0.0% | View All 66 Rows |
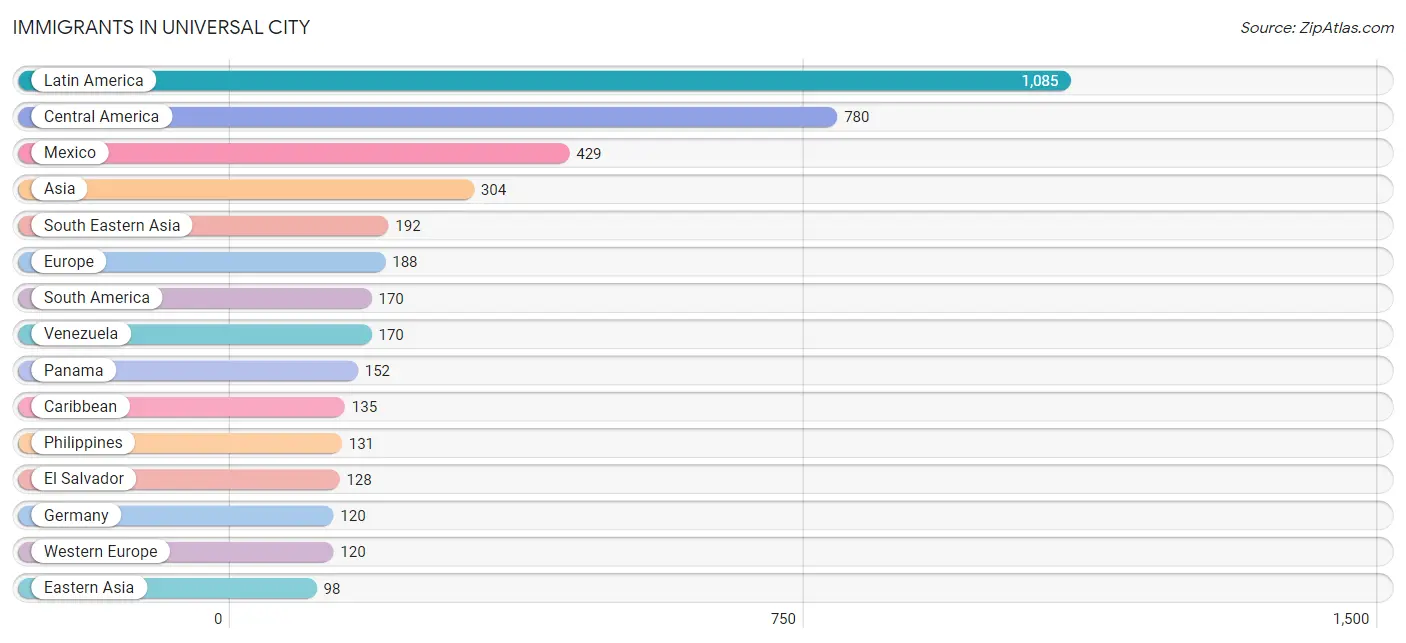
Immigrants in Universal City
The most numerous immigrant groups reported in Universal City came from Latin America (1,085 | 5.5%), Central America (780 | 3.9%), Mexico (429 | 2.2%), Asia (304 | 1.5%), and South Eastern Asia (192 | 1.0%), together accounting for 14.1% of all Universal City residents.
| Immigration Origin | # Population | % Population |
| Africa | 65 | 0.3% |
| Asia | 304 | 1.5% |
| Caribbean | 135 | 0.7% |
| Central America | 780 | 3.9% |
| China | 75 | 0.4% |
| Cuba | 61 | 0.3% |
| Dominican Republic | 15 | 0.1% |
| Eastern Asia | 98 | 0.5% |
| Eastern Europe | 11 | 0.1% |
| El Salvador | 128 | 0.6% |
| England | 30 | 0.2% |
| Europe | 188 | 0.9% |
| Germany | 120 | 0.6% |
| Guatemala | 33 | 0.2% |
| Haiti | 11 | 0.1% |
| Honduras | 28 | 0.1% |
| Jamaica | 48 | 0.2% |
| Korea | 23 | 0.1% |
| Latin America | 1,085 | 5.5% |
| Mexico | 429 | 2.2% |
| Nicaragua | 10 | 0.1% |
| Northern Africa | 65 | 0.3% |
| Northern Europe | 45 | 0.2% |
| Panama | 152 | 0.8% |
| Philippines | 131 | 0.7% |
| Russia | 11 | 0.1% |
| South America | 170 | 0.9% |
| South Eastern Asia | 192 | 1.0% |
| Southern Europe | 12 | 0.1% |
| Spain | 12 | 0.1% |
| Sweden | 15 | 0.1% |
| Taiwan | 66 | 0.3% |
| Thailand | 22 | 0.1% |
| Turkey | 14 | 0.1% |
| Venezuela | 170 | 0.9% |
| Vietnam | 39 | 0.2% |
| Western Asia | 14 | 0.1% |
| Western Europe | 120 | 0.6% | View All 38 Rows |
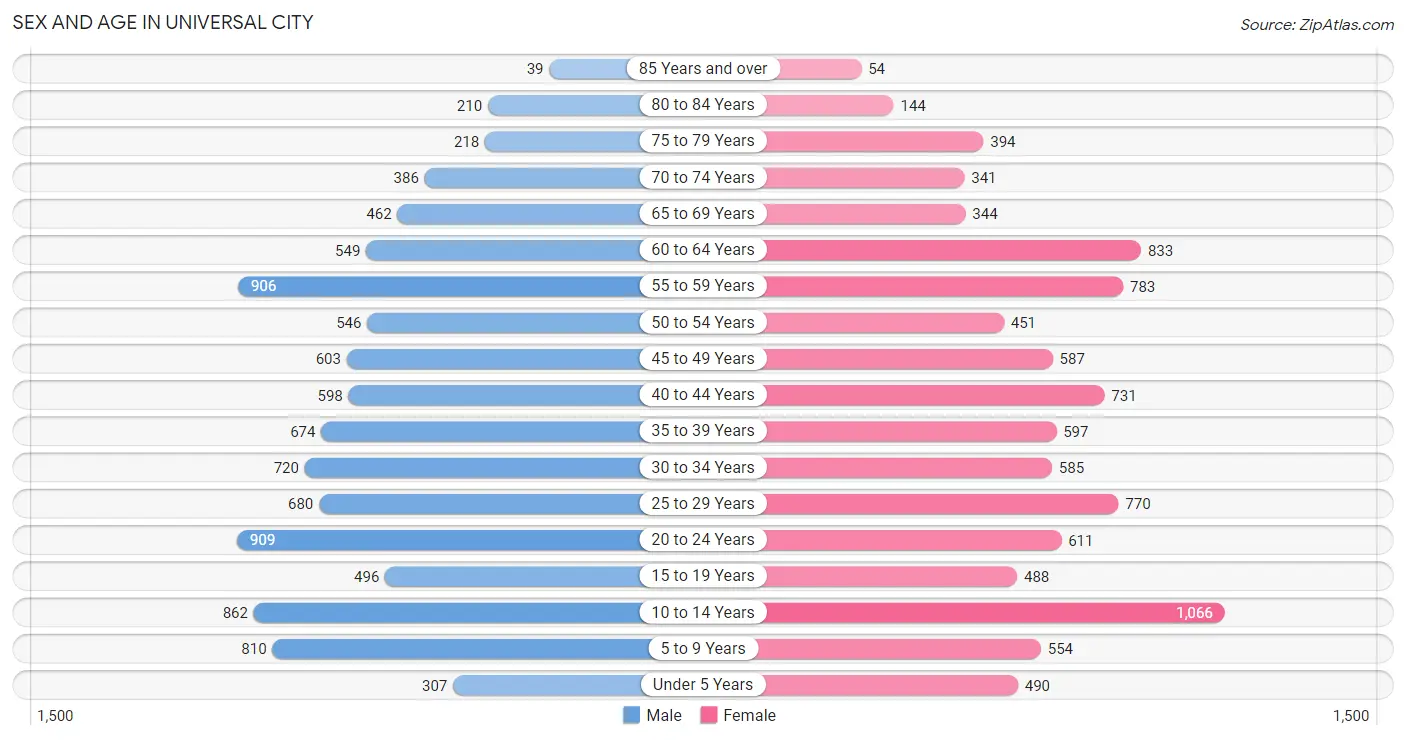
Sex and Age in Universal City
Sex and Age in Universal City
The most populous age groups in Universal City are 20 to 24 Years (909 | 9.1%) for men and 10 to 14 Years (1,066 | 10.8%) for women.
| Age Bracket | Male | Female |
| Under 5 Years | 307 (3.1%) | 490 (5.0%) |
| 5 to 9 Years | 810 (8.1%) | 554 (5.6%) |
| 10 to 14 Years | 862 (8.6%) | 1,066 (10.8%) |
| 15 to 19 Years | 496 (5.0%) | 488 (5.0%) |
| 20 to 24 Years | 909 (9.1%) | 611 (6.2%) |
| 25 to 29 Years | 680 (6.8%) | 770 (7.8%) |
| 30 to 34 Years | 720 (7.2%) | 585 (6.0%) |
| 35 to 39 Years | 674 (6.8%) | 597 (6.1%) |
| 40 to 44 Years | 598 (6.0%) | 731 (7.4%) |
| 45 to 49 Years | 603 (6.0%) | 587 (6.0%) |
| 50 to 54 Years | 546 (5.5%) | 451 (4.6%) |
| 55 to 59 Years | 906 (9.1%) | 783 (8.0%) |
| 60 to 64 Years | 549 (5.5%) | 833 (8.5%) |
| 65 to 69 Years | 462 (4.6%) | 344 (3.5%) |
| 70 to 74 Years | 386 (3.9%) | 341 (3.5%) |
| 75 to 79 Years | 218 (2.2%) | 394 (4.0%) |
| 80 to 84 Years | 210 (2.1%) | 144 (1.5%) |
| 85 Years and over | 39 (0.4%) | 54 (0.5%) |
| Total | 9,975 (100.0%) | 9,823 (100.0%) |
Families and Households in Universal City
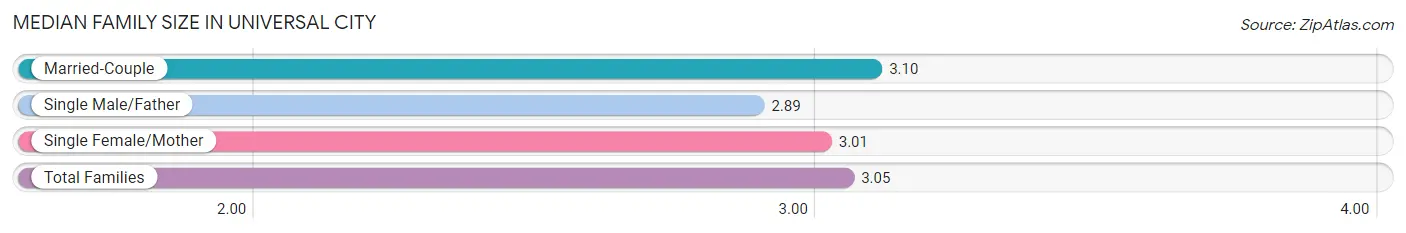
Median Family Size in Universal City
The median family size in Universal City is 3.05 persons per family, with married-couple families (3,496 | 66.2%) accounting for the largest median family size of 3.1 persons per family. On the other hand, single male/father families (669 | 12.7%) represent the smallest median family size with 2.89 persons per family.
| Family Type | # Families | Family Size |
| Married-Couple | 3,496 (66.2%) | 3.10 |
| Single Male/Father | 669 (12.7%) | 2.89 |
| Single Female/Mother | 1,116 (21.1%) | 3.01 |
| Total Families | 5,281 (100.0%) | 3.05 |
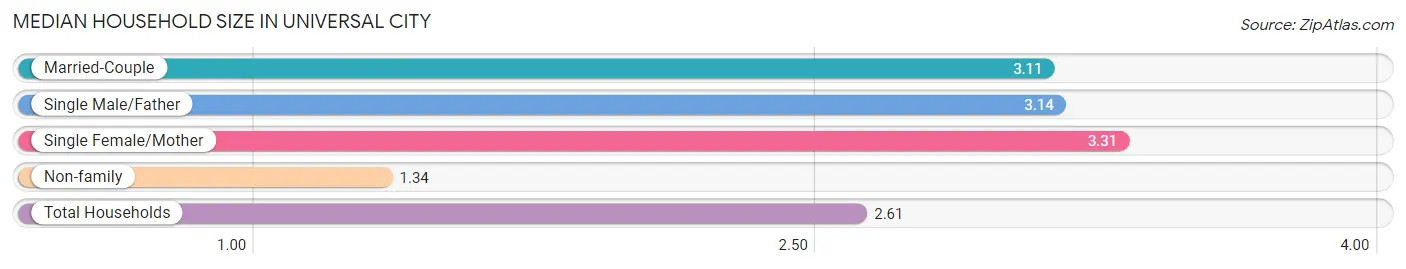
Median Household Size in Universal City
The median household size in Universal City is 2.61 persons per household, with single female/mother households (1,116 | 14.7%) accounting for the largest median household size of 3.31 persons per household. non-family households (2,311 | 30.4%) represent the smallest median household size with 1.34 persons per household.
| Household Type | # Households | Household Size |
| Married-Couple | 3,496 (46.1%) | 3.11 |
| Single Male/Father | 669 (8.8%) | 3.14 |
| Single Female/Mother | 1,116 (14.7%) | 3.31 |
| Non-family | 2,311 (30.4%) | 1.34 |
| Total Households | 7,592 (100.0%) | 2.61 |
Household Size by Marriage Status in Universal City
Out of a total of 7,592 households in Universal City, 5,281 (69.6%) are family households, while 2,311 (30.4%) are nonfamily households. The most numerous type of family households are 2-person households, comprising 2,300, and the most common type of nonfamily households are 1-person households, comprising 1,714.
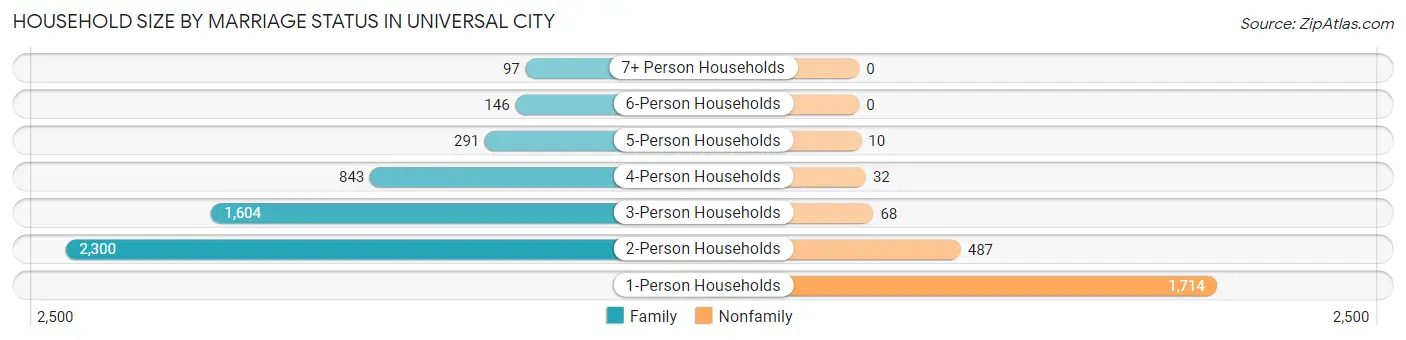
| Household Size | Family Households | Nonfamily Households |
| 1-Person Households | - | 1,714 (22.6%) |
| 2-Person Households | 2,300 (30.3%) | 487 (6.4%) |
| 3-Person Households | 1,604 (21.1%) | 68 (0.9%) |
| 4-Person Households | 843 (11.1%) | 32 (0.4%) |
| 5-Person Households | 291 (3.8%) | 10 (0.1%) |
| 6-Person Households | 146 (1.9%) | 0 (0.0%) |
| 7+ Person Households | 97 (1.3%) | 0 (0.0%) |
| Total | 5,281 (69.6%) | 2,311 (30.4%) |
Female Fertility in Universal City
Fertility by Age in Universal City
Average fertility rate in Universal City is 49.0 births per 1,000 women. Women in the age bracket of 20 to 34 years have the highest fertility rate with 53.0 births per 1,000 women. Women in the age bracket of 20 to 34 years acount for 48.4% of all women with births.
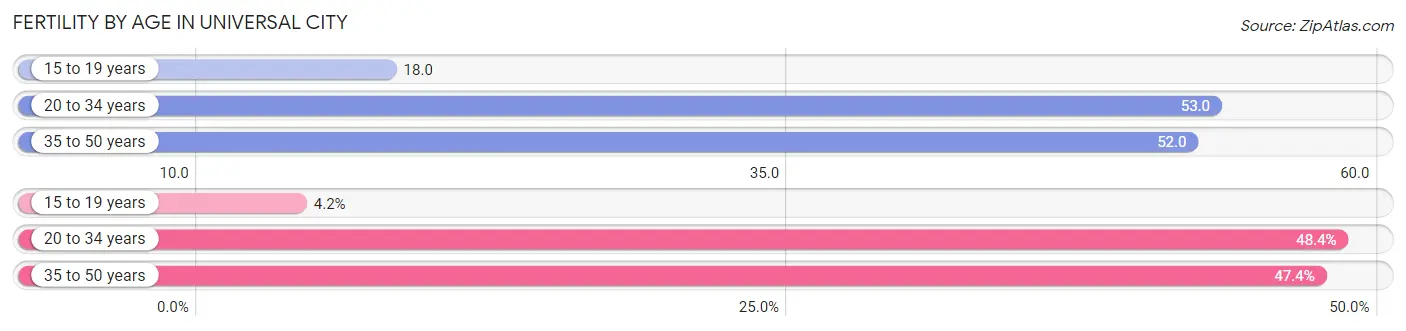
| Age Bracket | Women with Births | Births / 1,000 Women |
| 15 to 19 years | 9 (4.2%) | 18.0 |
| 20 to 34 years | 104 (48.4%) | 53.0 |
| 35 to 50 years | 102 (47.4%) | 52.0 |
| Total | 215 (100.0%) | 49.0 |
Fertility by Age by Marriage Status in Universal City
47.0% of women with births (215) in Universal City are married. The highest percentage of unmarried women with births falls into 15 to 19 years age bracket with 100.0% of them unmarried at the time of birth, while the lowest percentage of unmarried women with births belong to 35 to 50 years age bracket with 34.3% of them unmarried.
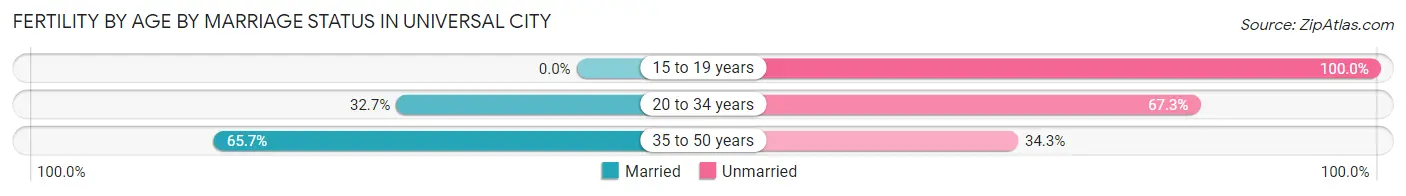
| Age Bracket | Married | Unmarried |
| 15 to 19 years | 0 (0.0%) | 9 (100.0%) |
| 20 to 34 years | 34 (32.7%) | 70 (67.3%) |
| 35 to 50 years | 67 (65.7%) | 35 (34.3%) |
| Total | 101 (47.0%) | 114 (53.0%) |
Fertility by Education in Universal City
Average fertility rate in Universal City is 49.0 births per 1,000 women. Women with the education attainment of college or associate's degree have the highest fertility rate of 69.0 births per 1,000 women, while women with the education attainment of bachelor's degree have the lowest fertility at 9.0 births per 1,000 women. Women with the education attainment of college or associate's degree represent 57.7% of all women with births.
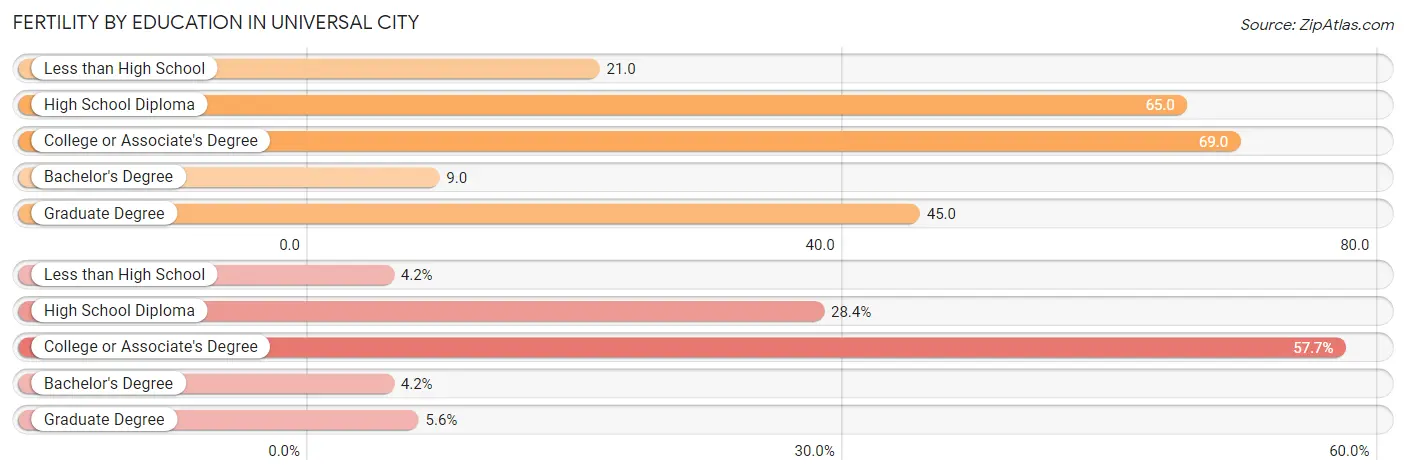
| Educational Attainment | Women with Births | Births / 1,000 Women |
| Less than High School | 9 (4.2%) | 21.0 |
| High School Diploma | 61 (28.4%) | 65.0 |
| College or Associate's Degree | 124 (57.7%) | 69.0 |
| Bachelor's Degree | 9 (4.2%) | 9.0 |
| Graduate Degree | 12 (5.6%) | 45.0 |
| Total | 215 (100.0%) | 49.0 |
Fertility by Education by Marriage Status in Universal City
53.0% of women with births in Universal City are unmarried. Women with the educational attainment of graduate degree are most likely to be married with 100.0% of them married at childbirth, while women with the educational attainment of less than high school are least likely to be married with 100.0% of them unmarried at childbirth.
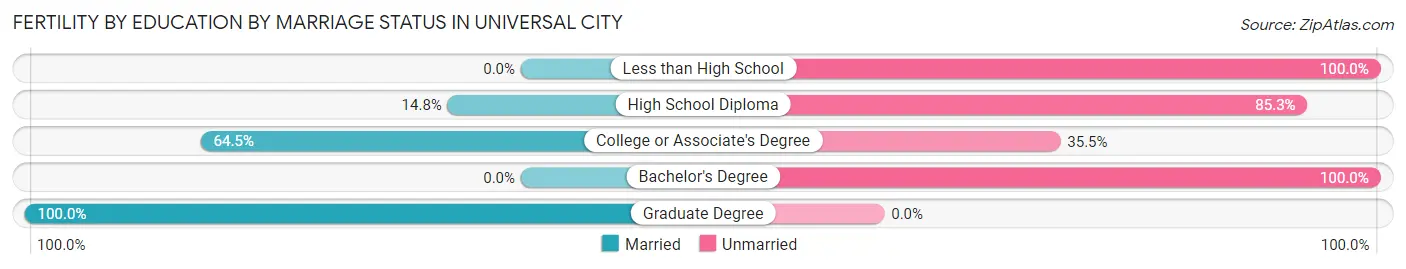
| Educational Attainment | Married | Unmarried |
| Less than High School | 0 (0.0%) | 9 (100.0%) |
| High School Diploma | 9 (14.7%) | 52 (85.3%) |
| College or Associate's Degree | 80 (64.5%) | 44 (35.5%) |
| Bachelor's Degree | 0 (0.0%) | 9 (100.0%) |
| Graduate Degree | 12 (100.0%) | 0 (0.0%) |
| Total | 101 (47.0%) | 114 (53.0%) |
Employment Characteristics in Universal City
Employment by Class of Employer in Universal City
Among the 9,888 employed individuals in Universal City, private company employees (6,176 | 62.5%), federal government employees (1,115 | 11.3%), and local government employees (927 | 9.4%) make up the most common classes of employment.
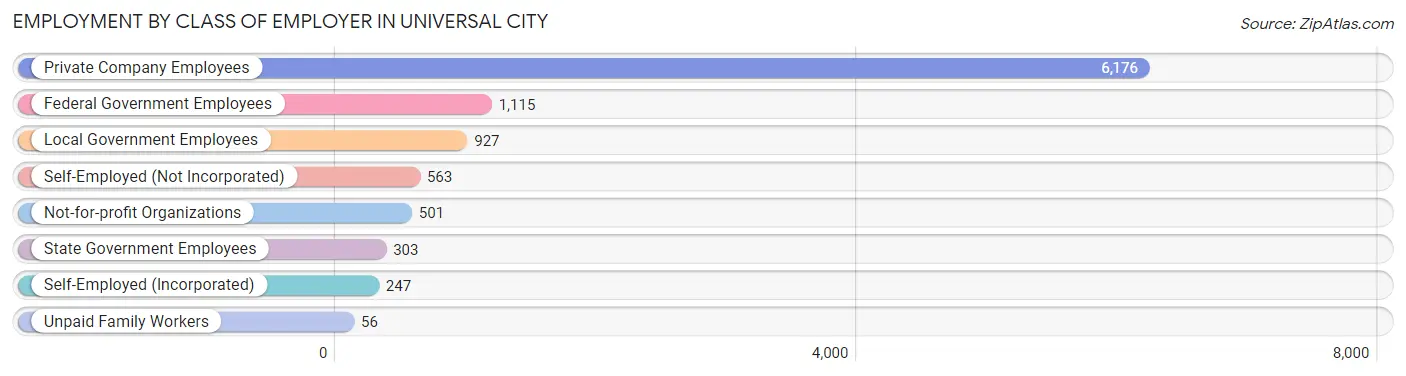
| Employer Class | # Employees | % Employees |
| Private Company Employees | 6,176 | 62.5% |
| Self-Employed (Incorporated) | 247 | 2.5% |
| Self-Employed (Not Incorporated) | 563 | 5.7% |
| Not-for-profit Organizations | 501 | 5.1% |
| Local Government Employees | 927 | 9.4% |
| State Government Employees | 303 | 3.1% |
| Federal Government Employees | 1,115 | 11.3% |
| Unpaid Family Workers | 56 | 0.6% |
| Total | 9,888 | 100.0% |
Employment Status by Age in Universal City
According to the labor force statistics for Universal City, out of the total population over 16 years of age (15,497), 68.0% or 10,538 individuals are in the labor force, with 5.1% or 537 of them unemployed. The age group with the highest labor force participation rate is 20 to 24 years, with 92.1% or 1,400 individuals in the labor force. Within the labor force, the 16 to 19 years age range has the highest percentage of unemployed individuals, with 18.5% or 61 of them being unemployed.
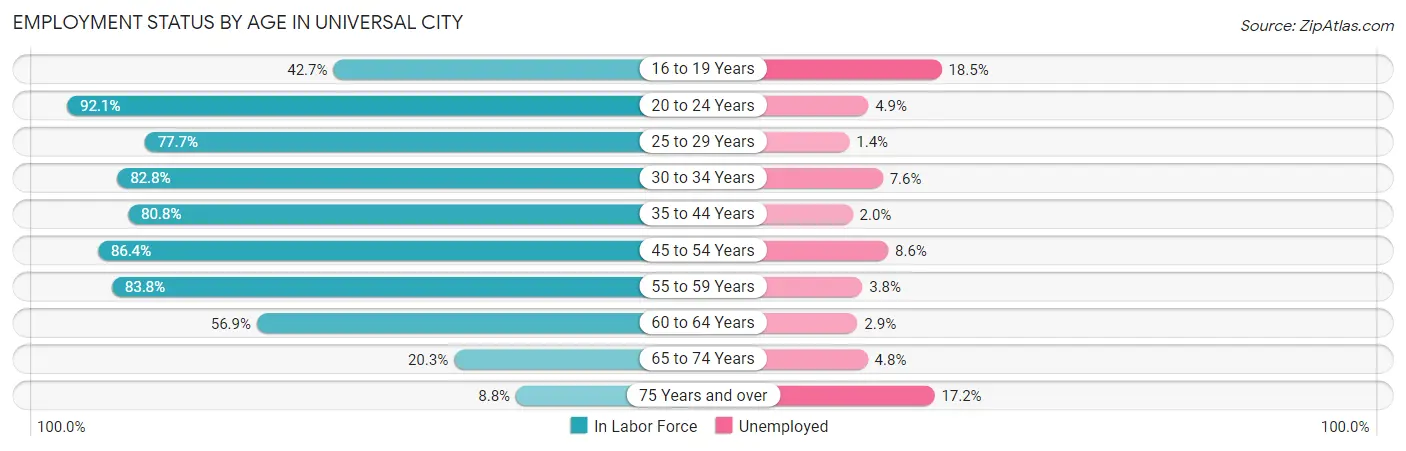
| Age Bracket | In Labor Force | Unemployed |
| 16 to 19 Years | 330 (42.7%) | 61 (18.5%) |
| 20 to 24 Years | 1,400 (92.1%) | 69 (4.9%) |
| 25 to 29 Years | 1,127 (77.7%) | 16 (1.4%) |
| 30 to 34 Years | 1,081 (82.8%) | 82 (7.6%) |
| 35 to 44 Years | 2,101 (80.8%) | 42 (2.0%) |
| 45 to 54 Years | 1,890 (86.4%) | 163 (8.6%) |
| 55 to 59 Years | 1,415 (83.8%) | 54 (3.8%) |
| 60 to 64 Years | 786 (56.9%) | 23 (2.9%) |
| 65 to 74 Years | 311 (20.3%) | 15 (4.8%) |
| 75 Years and over | 93 (8.8%) | 16 (17.2%) |
| Total | 10,538 (68.0%) | 537 (5.1%) |
Employment Status by Educational Attainment in Universal City
According to labor force statistics for Universal City, 79.1% of individuals (8,395) out of the total population between 25 and 64 years of age (10,613) are in the labor force, with 4.5% or 378 of them being unemployed. The group with the highest labor force participation rate are those with the educational attainment of bachelor's degree or higher, with 87.8% or 2,780 individuals in the labor force. Within the labor force, individuals with less than high school education have the highest percentage of unemployment, with 11.6% or 39 of them being unemployed.
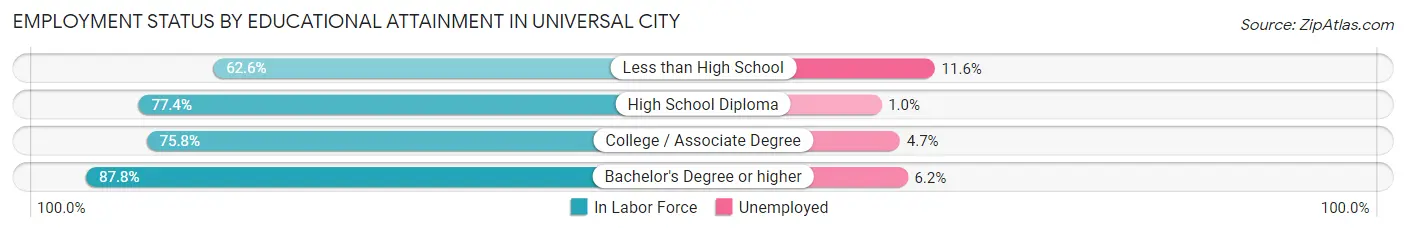
| Educational Attainment | In Labor Force | Unemployed |
| Less than High School | 335 (62.6%) | 62 (11.6%) |
| High School Diploma | 2,059 (77.4%) | 27 (1.0%) |
| College / Associate Degree | 3,223 (75.8%) | 200 (4.7%) |
| Bachelor's Degree or higher | 2,780 (87.8%) | 196 (6.2%) |
| Total | 8,395 (79.1%) | 478 (4.5%) |
Employment Occupations by Sex in Universal City
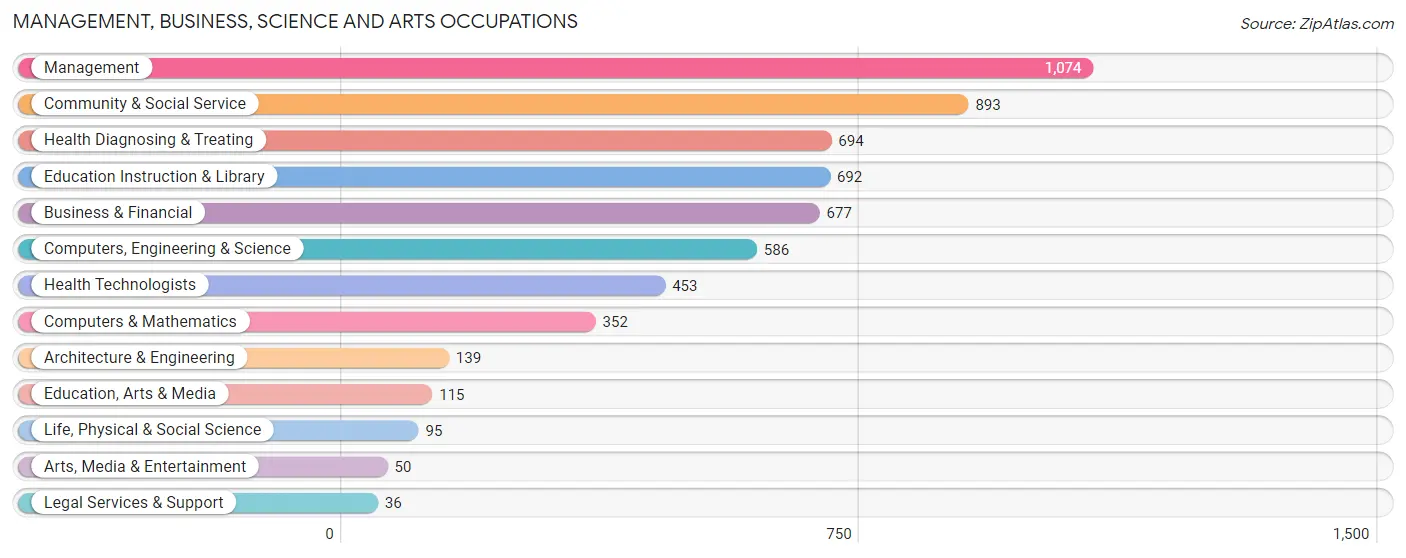
Management, Business, Science and Arts Occupations
The most common Management, Business, Science and Arts occupations in Universal City are Management (1,074 | 10.9%), Community & Social Service (893 | 9.1%), Health Diagnosing & Treating (694 | 7.1%), Education Instruction & Library (692 | 7.0%), and Business & Financial (677 | 6.9%).
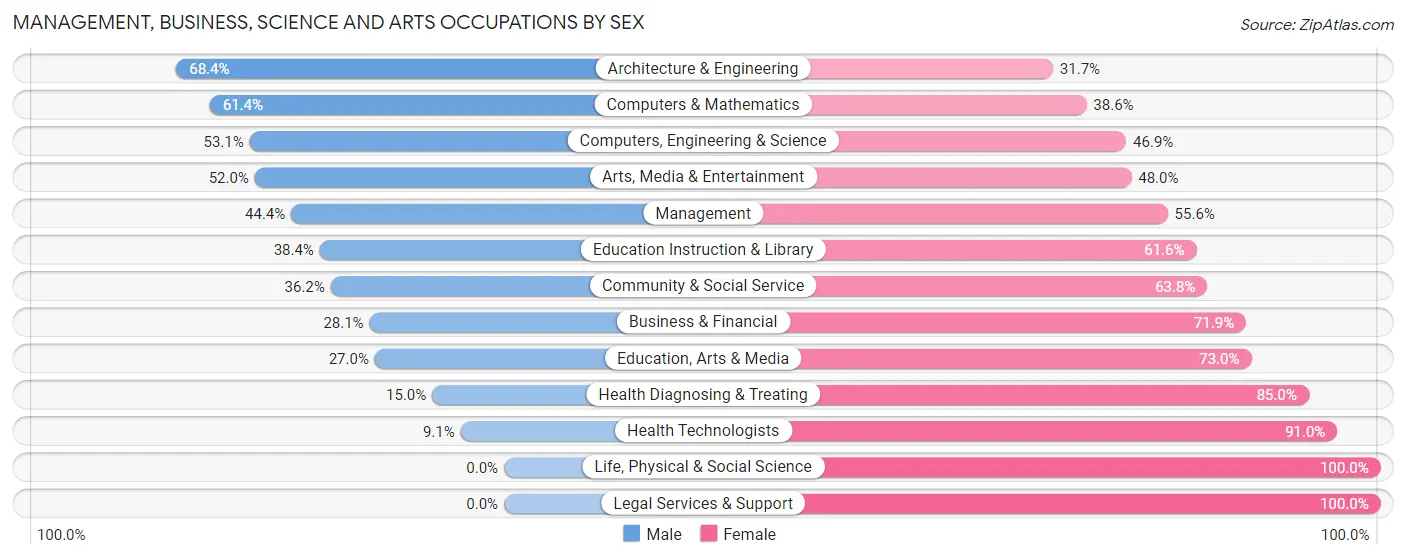
Management, Business, Science and Arts Occupations by Sex
Within the Management, Business, Science and Arts occupations in Universal City, the most male-oriented occupations are Architecture & Engineering (68.3%), Computers & Mathematics (61.4%), and Computers, Engineering & Science (53.1%), while the most female-oriented occupations are Life, Physical & Social Science (100.0%), Legal Services & Support (100.0%), and Health Technologists (90.9%).
| Occupation | Male | Female |
| Management | 477 (44.4%) | 597 (55.6%) |
| Business & Financial | 190 (28.1%) | 487 (71.9%) |
| Computers, Engineering & Science | 311 (53.1%) | 275 (46.9%) |
| Computers & Mathematics | 216 (61.4%) | 136 (38.6%) |
| Architecture & Engineering | 95 (68.3%) | 44 (31.7%) |
| Life, Physical & Social Science | 0 (0.0%) | 95 (100.0%) |
| Community & Social Service | 323 (36.2%) | 570 (63.8%) |
| Education, Arts & Media | 31 (27.0%) | 84 (73.0%) |
| Legal Services & Support | 0 (0.0%) | 36 (100.0%) |
| Education Instruction & Library | 266 (38.4%) | 426 (61.6%) |
| Arts, Media & Entertainment | 26 (52.0%) | 24 (48.0%) |
| Health Diagnosing & Treating | 104 (15.0%) | 590 (85.0%) |
| Health Technologists | 41 (9.0%) | 412 (90.9%) |
| Total (Category) | 1,405 (35.8%) | 2,519 (64.2%) |
| Total (Overall) | 5,279 (53.7%) | 4,552 (46.3%) |
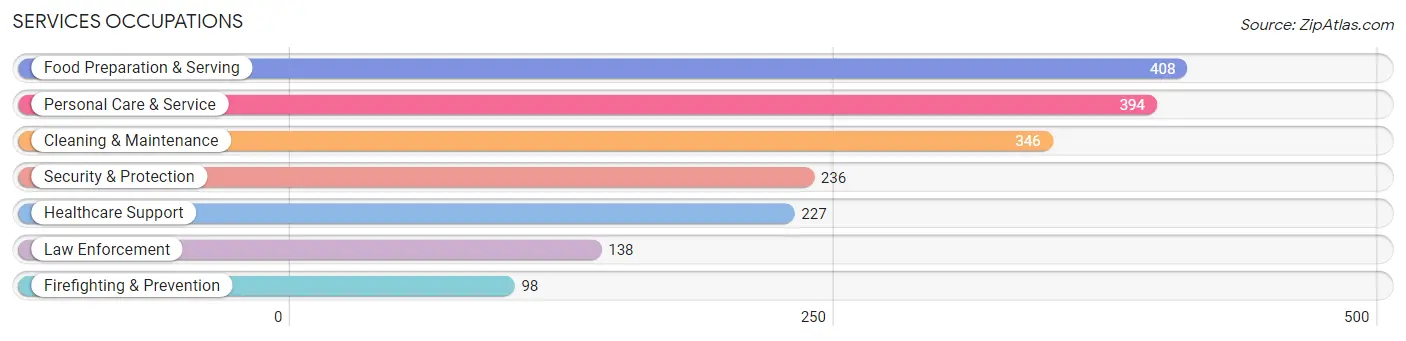
Services Occupations
The most common Services occupations in Universal City are Food Preparation & Serving (408 | 4.2%), Personal Care & Service (394 | 4.0%), Cleaning & Maintenance (346 | 3.5%), Security & Protection (236 | 2.4%), and Healthcare Support (227 | 2.3%).
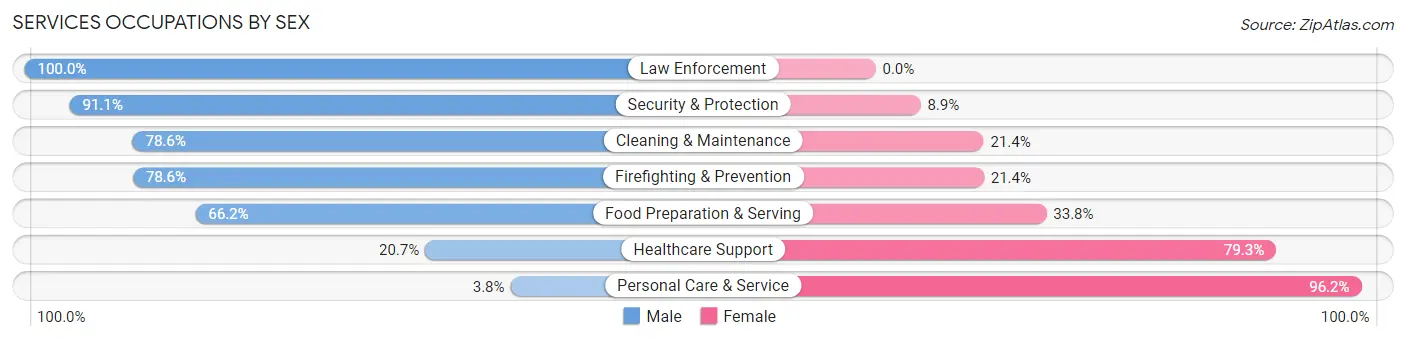
Services Occupations by Sex
Within the Services occupations in Universal City, the most male-oriented occupations are Law Enforcement (100.0%), Security & Protection (91.1%), and Cleaning & Maintenance (78.6%), while the most female-oriented occupations are Personal Care & Service (96.2%), Healthcare Support (79.3%), and Food Preparation & Serving (33.8%).
| Occupation | Male | Female |
| Healthcare Support | 47 (20.7%) | 180 (79.3%) |
| Security & Protection | 215 (91.1%) | 21 (8.9%) |
| Firefighting & Prevention | 77 (78.6%) | 21 (21.4%) |
| Law Enforcement | 138 (100.0%) | 0 (0.0%) |
| Food Preparation & Serving | 270 (66.2%) | 138 (33.8%) |
| Cleaning & Maintenance | 272 (78.6%) | 74 (21.4%) |
| Personal Care & Service | 15 (3.8%) | 379 (96.2%) |
| Total (Category) | 819 (50.8%) | 792 (49.2%) |
| Total (Overall) | 5,279 (53.7%) | 4,552 (46.3%) |
Sales and Office Occupations
The most common Sales and Office occupations in Universal City are Office & Administration (993 | 10.1%), and Sales & Related (822 | 8.4%).
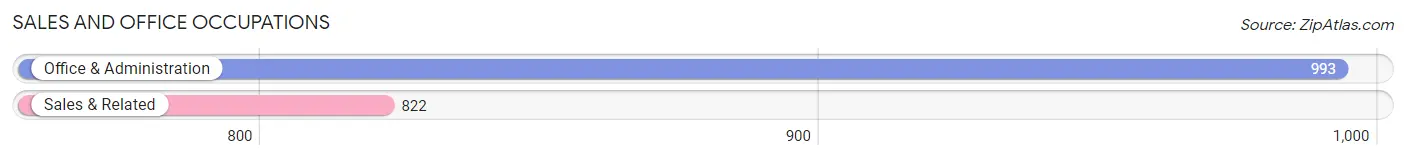
Sales and Office Occupations by Sex
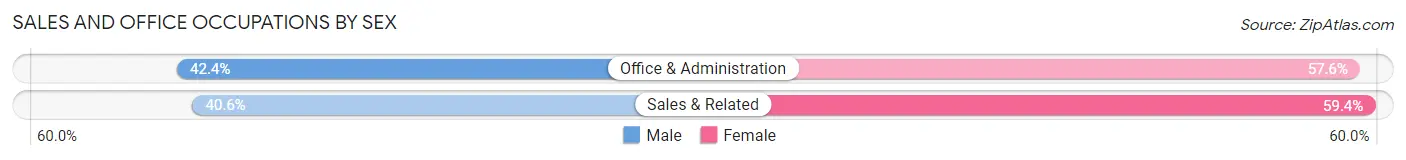
| Occupation | Male | Female |
| Sales & Related | 334 (40.6%) | 488 (59.4%) |
| Office & Administration | 421 (42.4%) | 572 (57.6%) |
| Total (Category) | 755 (41.6%) | 1,060 (58.4%) |
| Total (Overall) | 5,279 (53.7%) | 4,552 (46.3%) |
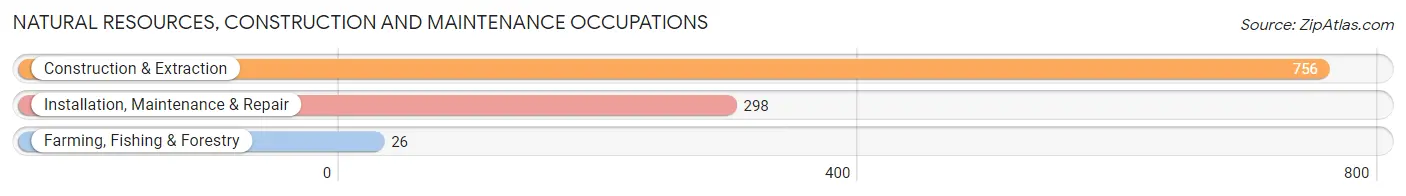
Natural Resources, Construction and Maintenance Occupations
The most common Natural Resources, Construction and Maintenance occupations in Universal City are Construction & Extraction (756 | 7.7%), Installation, Maintenance & Repair (298 | 3.0%), and Farming, Fishing & Forestry (26 | 0.3%).
Natural Resources, Construction and Maintenance Occupations by Sex

| Occupation | Male | Female |
| Farming, Fishing & Forestry | 0 (0.0%) | 26 (100.0%) |
| Construction & Extraction | 756 (100.0%) | 0 (0.0%) |
| Installation, Maintenance & Repair | 298 (100.0%) | 0 (0.0%) |
| Total (Category) | 1,054 (97.6%) | 26 (2.4%) |
| Total (Overall) | 5,279 (53.7%) | 4,552 (46.3%) |
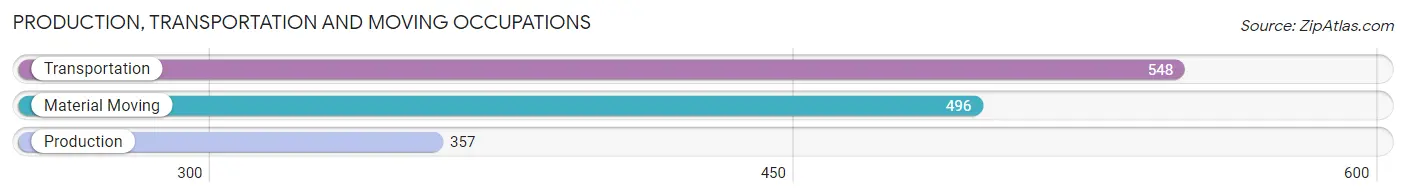
Production, Transportation and Moving Occupations
The most common Production, Transportation and Moving occupations in Universal City are Transportation (548 | 5.6%), Material Moving (496 | 5.1%), and Production (357 | 3.6%).
Production, Transportation and Moving Occupations by Sex
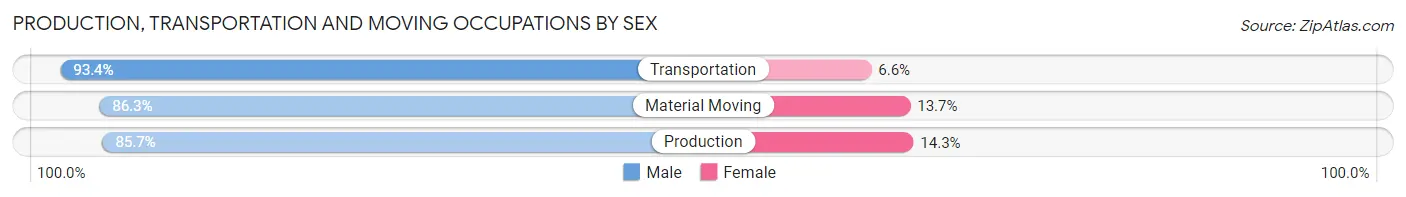
| Occupation | Male | Female |
| Production | 306 (85.7%) | 51 (14.3%) |
| Transportation | 512 (93.4%) | 36 (6.6%) |
| Material Moving | 428 (86.3%) | 68 (13.7%) |
| Total (Category) | 1,246 (88.9%) | 155 (11.1%) |
| Total (Overall) | 5,279 (53.7%) | 4,552 (46.3%) |
Employment Industries by Sex in Universal City
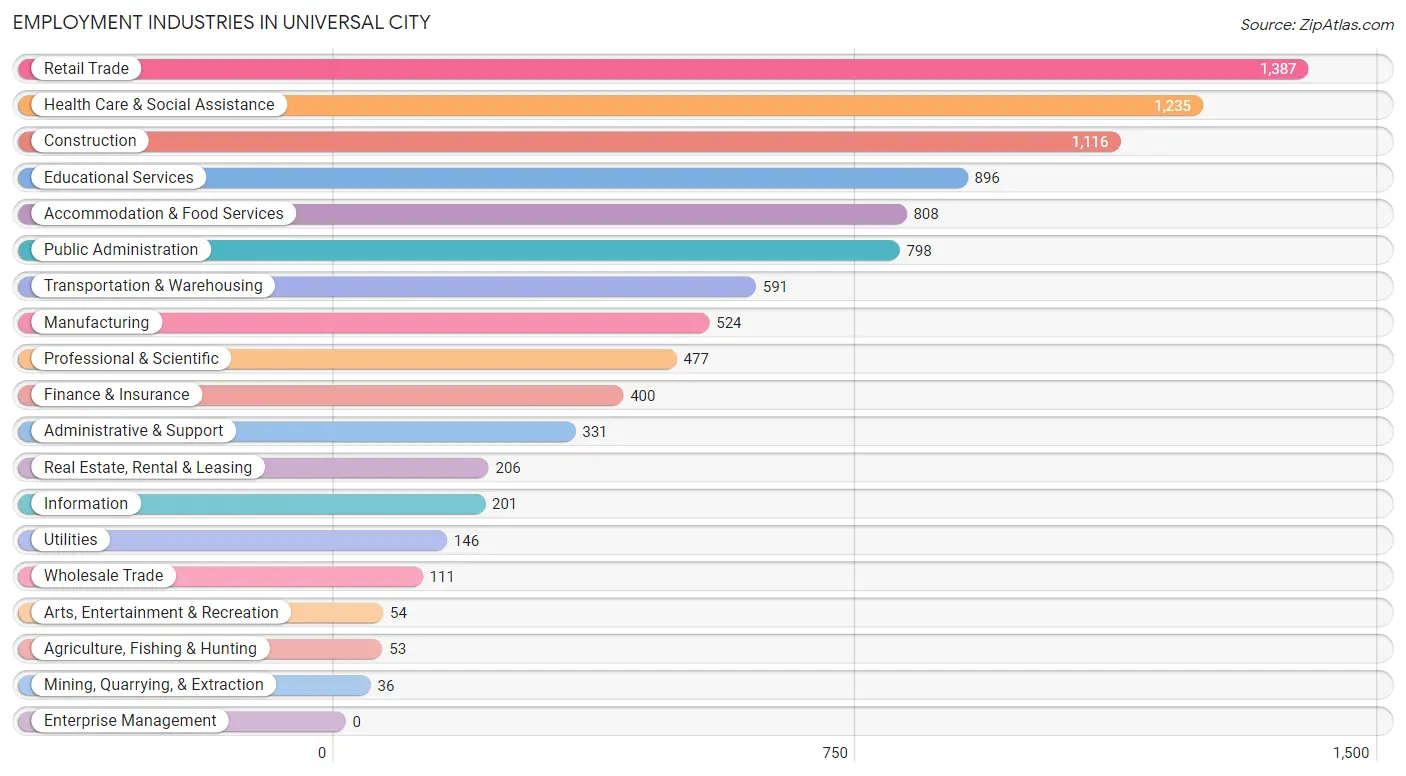
Employment Industries in Universal City
The major employment industries in Universal City include Retail Trade (1,387 | 14.1%), Health Care & Social Assistance (1,235 | 12.6%), Construction (1,116 | 11.4%), Educational Services (896 | 9.1%), and Accommodation & Food Services (808 | 8.2%).
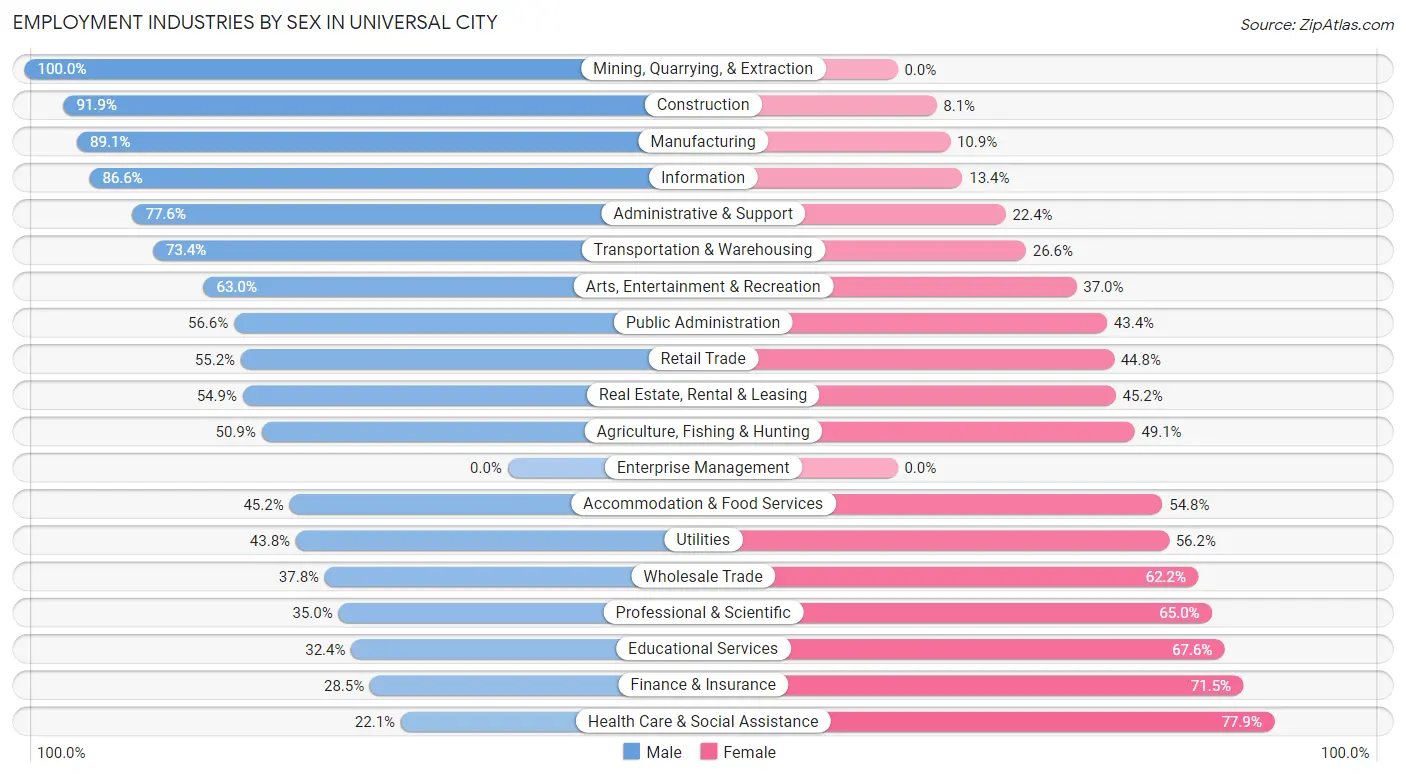
Employment Industries by Sex in Universal City
The Universal City industries that see more men than women are Mining, Quarrying, & Extraction (100.0%), Construction (91.9%), and Manufacturing (89.1%), whereas the industries that tend to have a higher number of women are Health Care & Social Assistance (77.9%), Finance & Insurance (71.5%), and Educational Services (67.6%).
| Industry | Male | Female |
| Agriculture, Fishing & Hunting | 27 (50.9%) | 26 (49.1%) |
| Mining, Quarrying, & Extraction | 36 (100.0%) | 0 (0.0%) |
| Construction | 1,026 (91.9%) | 90 (8.1%) |
| Manufacturing | 467 (89.1%) | 57 (10.9%) |
| Wholesale Trade | 42 (37.8%) | 69 (62.2%) |
| Retail Trade | 766 (55.2%) | 621 (44.8%) |
| Transportation & Warehousing | 434 (73.4%) | 157 (26.6%) |
| Utilities | 64 (43.8%) | 82 (56.2%) |
| Information | 174 (86.6%) | 27 (13.4%) |
| Finance & Insurance | 114 (28.5%) | 286 (71.5%) |
| Real Estate, Rental & Leasing | 113 (54.8%) | 93 (45.2%) |
| Professional & Scientific | 167 (35.0%) | 310 (65.0%) |
| Enterprise Management | 0 (0.0%) | 0 (0.0%) |
| Administrative & Support | 257 (77.6%) | 74 (22.4%) |
| Educational Services | 290 (32.4%) | 606 (67.6%) |
| Health Care & Social Assistance | 273 (22.1%) | 962 (77.9%) |
| Arts, Entertainment & Recreation | 34 (63.0%) | 20 (37.0%) |
| Accommodation & Food Services | 365 (45.2%) | 443 (54.8%) |
| Public Administration | 452 (56.6%) | 346 (43.4%) |
| Total | 5,279 (53.7%) | 4,552 (46.3%) |
Education in Universal City
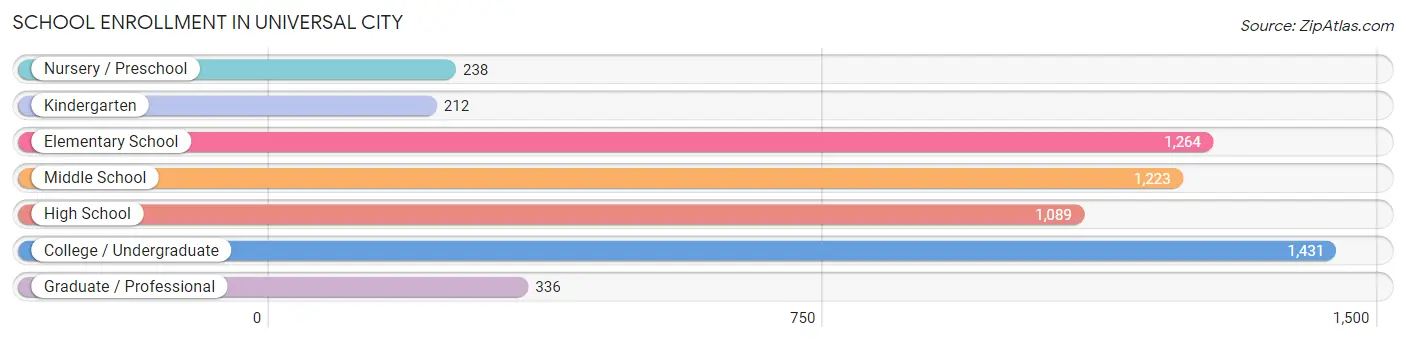
School Enrollment in Universal City
The most common levels of schooling among the 5,793 students in Universal City are college / undergraduate (1,431 | 24.7%), elementary school (1,264 | 21.8%), and middle school (1,223 | 21.1%).
| School Level | # Students | % Students |
| Nursery / Preschool | 238 | 4.1% |
| Kindergarten | 212 | 3.7% |
| Elementary School | 1,264 | 21.8% |
| Middle School | 1,223 | 21.1% |
| High School | 1,089 | 18.8% |
| College / Undergraduate | 1,431 | 24.7% |
| Graduate / Professional | 336 | 5.8% |
| Total | 5,793 | 100.0% |
School Enrollment by Age by Funding Source in Universal City
Out of a total of 5,793 students who are enrolled in schools in Universal City, 1,112 (19.2%) attend a private institution, while the remaining 4,681 (80.8%) are enrolled in public schools. The age group of 35 years and over has the highest likelihood of being enrolled in private schools, with 255 (64.1% in the age bracket) enrolled. Conversely, the age group of 18 to 19 year olds has the lowest likelihood of being enrolled in a private school, with 233 (100.0% in the age bracket) attending a public institution.
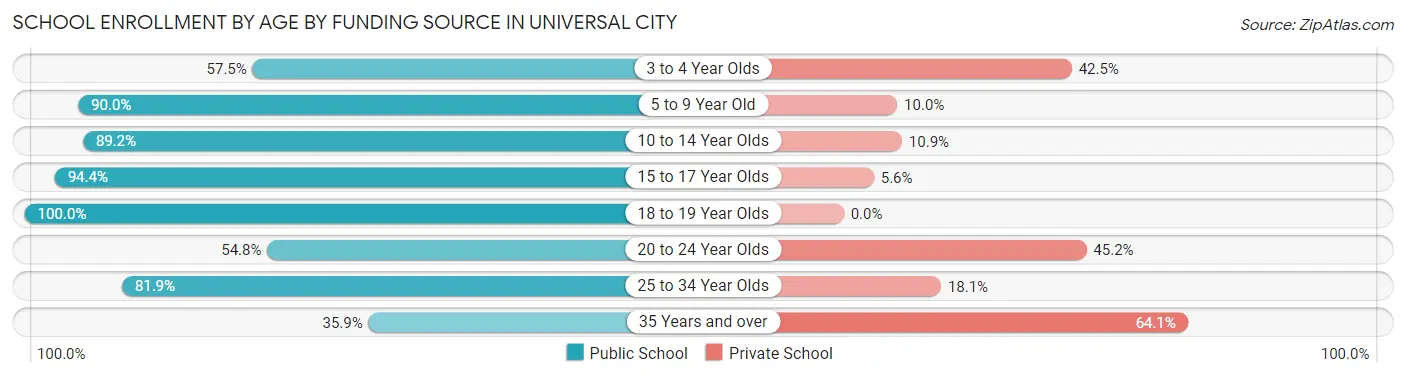
| Age Bracket | Public School | Private School |
| 3 to 4 Year Olds | 107 (57.5%) | 79 (42.5%) |
| 5 to 9 Year Old | 1,130 (90.0%) | 125 (10.0%) |
| 10 to 14 Year Olds | 1,676 (89.1%) | 204 (10.8%) |
| 15 to 17 Year Olds | 606 (94.4%) | 36 (5.6%) |
| 18 to 19 Year Olds | 233 (100.0%) | 0 (0.0%) |
| 20 to 24 Year Olds | 400 (54.8%) | 330 (45.2%) |
| 25 to 34 Year Olds | 384 (81.9%) | 85 (18.1%) |
| 35 Years and over | 143 (35.9%) | 255 (64.1%) |
| Total | 4,681 (80.8%) | 1,112 (19.2%) |
Educational Attainment by Field of Study in Universal City
Business (884 | 20.2%), education (807 | 18.4%), science & technology (609 | 13.9%), arts & humanities (436 | 10.0%), and computers & mathematics (250 | 5.7%) are the most common fields of study among 4,382 individuals in Universal City who have obtained a bachelor's degree or higher.
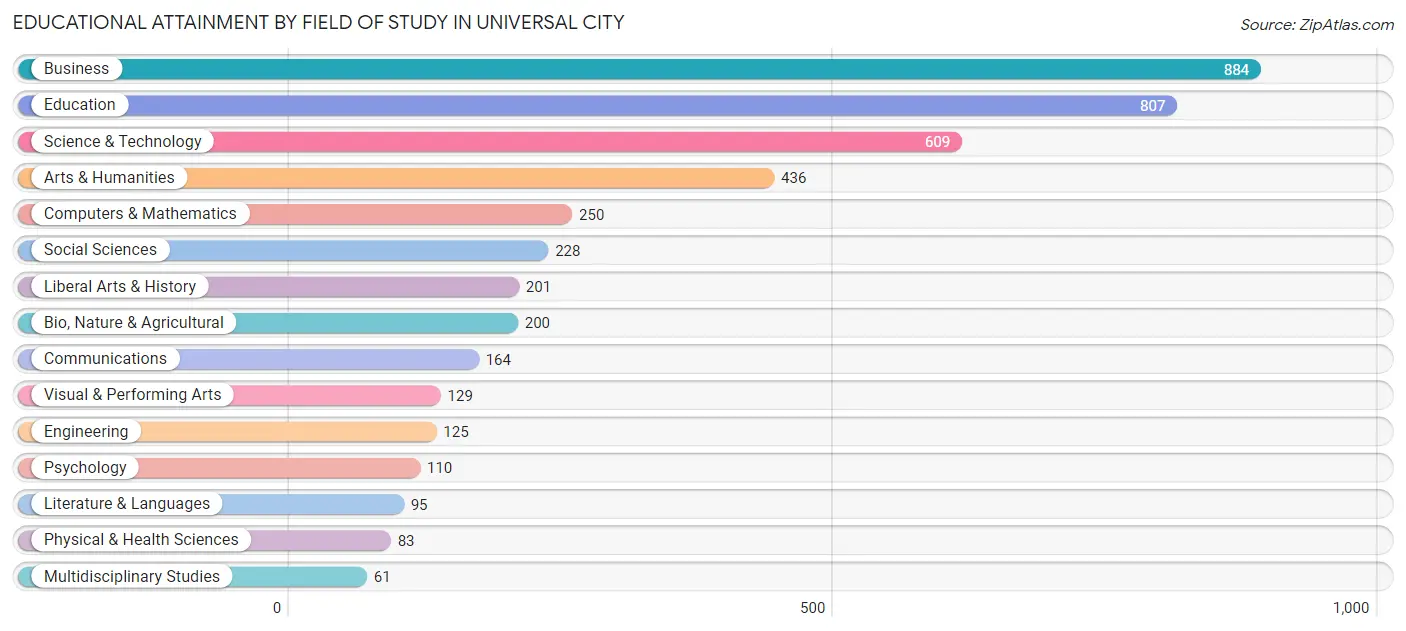
| Field of Study | # Graduates | % Graduates |
| Computers & Mathematics | 250 | 5.7% |
| Bio, Nature & Agricultural | 200 | 4.6% |
| Physical & Health Sciences | 83 | 1.9% |
| Psychology | 110 | 2.5% |
| Social Sciences | 228 | 5.2% |
| Engineering | 125 | 2.9% |
| Multidisciplinary Studies | 61 | 1.4% |
| Science & Technology | 609 | 13.9% |
| Business | 884 | 20.2% |
| Education | 807 | 18.4% |
| Literature & Languages | 95 | 2.2% |
| Liberal Arts & History | 201 | 4.6% |
| Visual & Performing Arts | 129 | 2.9% |
| Communications | 164 | 3.7% |
| Arts & Humanities | 436 | 10.0% |
| Total | 4,382 | 100.0% |
Transportation & Commute in Universal City
Vehicle Availability by Sex in Universal City
The most prevalent vehicle ownership categories in Universal City are males with 2 vehicles (2,056, accounting for 38.7%) and females with 2 vehicles (2,176, making up 44.9%).
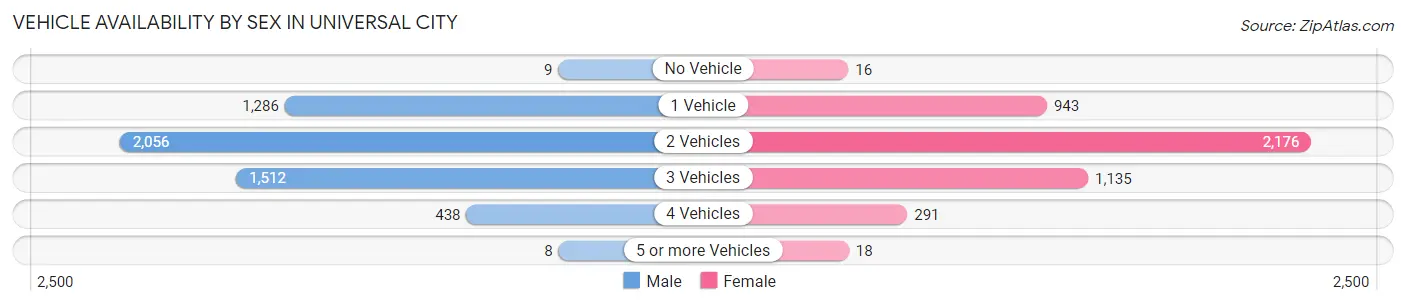
| Vehicles Available | Male | Female |
| No Vehicle | 9 (0.2%) | 16 (0.4%) |
| 1 Vehicle | 1,286 (24.2%) | 943 (20.6%) |
| 2 Vehicles | 2,056 (38.7%) | 2,176 (47.5%) |
| 3 Vehicles | 1,512 (28.5%) | 1,135 (24.8%) |
| 4 Vehicles | 438 (8.3%) | 291 (6.4%) |
| 5 or more Vehicles | 8 (0.2%) | 18 (0.4%) |
| Total | 5,309 (100.0%) | 4,579 (100.0%) |
Commute Time in Universal City
The most frequently occuring commute durations in Universal City are 30 to 34 minutes (1,930 commuters, 20.7%), 20 to 24 minutes (1,672 commuters, 17.9%), and 15 to 19 minutes (1,127 commuters, 12.1%).
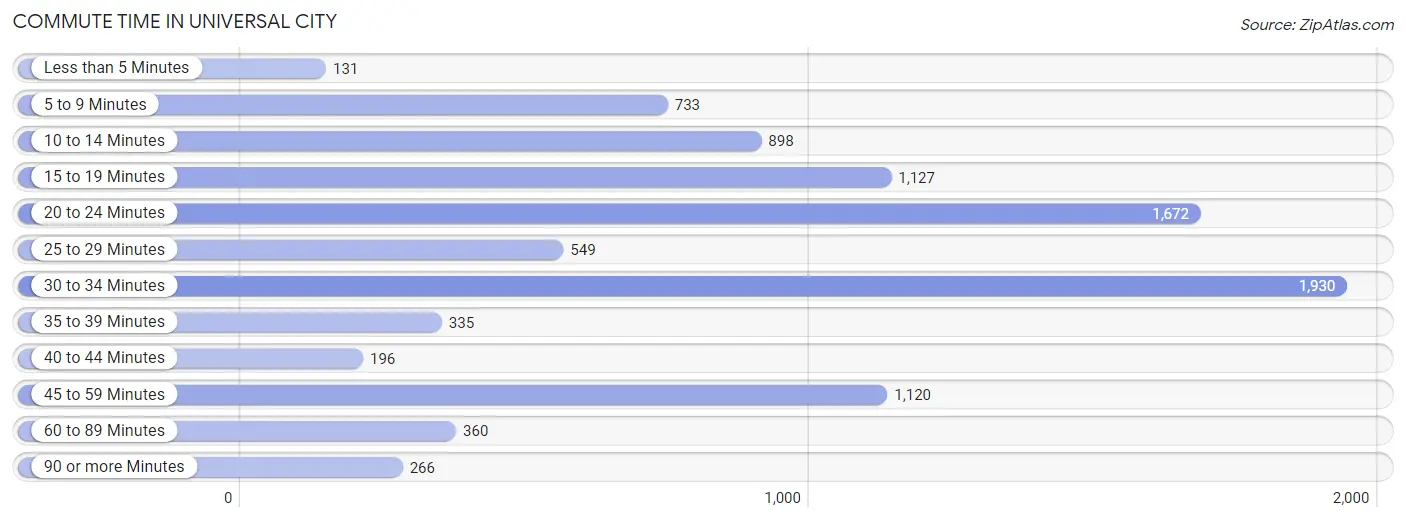
| Commute Time | # Commuters | % Commuters |
| Less than 5 Minutes | 131 | 1.4% |
| 5 to 9 Minutes | 733 | 7.9% |
| 10 to 14 Minutes | 898 | 9.6% |
| 15 to 19 Minutes | 1,127 | 12.1% |
| 20 to 24 Minutes | 1,672 | 17.9% |
| 25 to 29 Minutes | 549 | 5.9% |
| 30 to 34 Minutes | 1,930 | 20.7% |
| 35 to 39 Minutes | 335 | 3.6% |
| 40 to 44 Minutes | 196 | 2.1% |
| 45 to 59 Minutes | 1,120 | 12.0% |
| 60 to 89 Minutes | 360 | 3.9% |
| 90 or more Minutes | 266 | 2.9% |
Commute Time by Sex in Universal City
The most common commute times in Universal City are 30 to 34 minutes (1,118 commuters, 21.9%) for males and 30 to 34 minutes (812 commuters, 19.3%) for females.
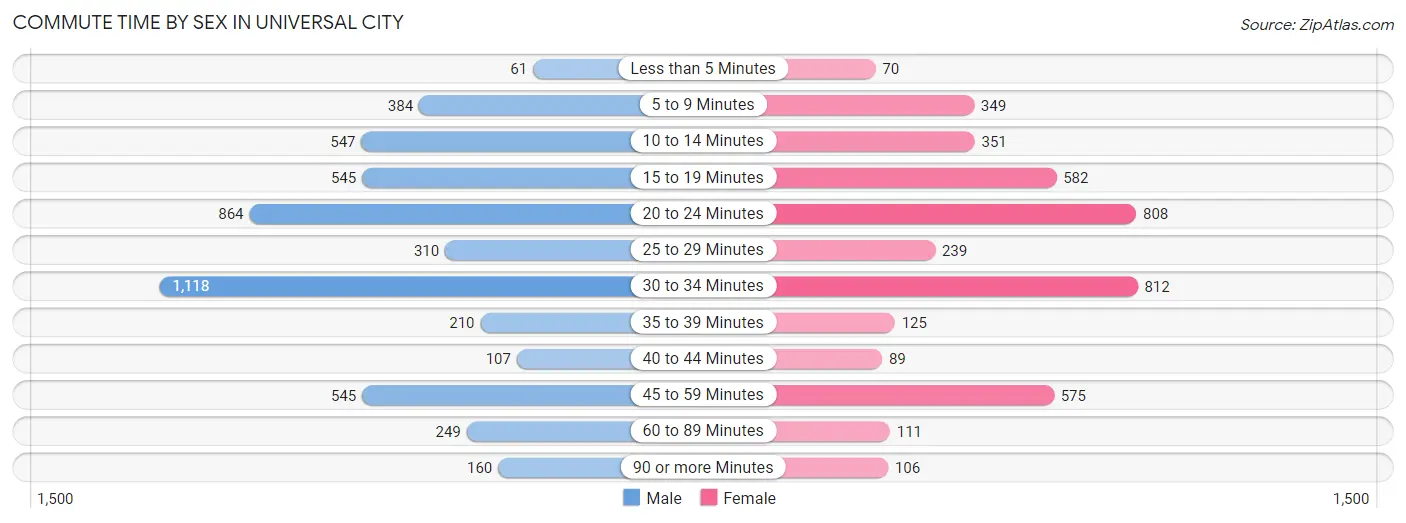
| Commute Time | Male | Female |
| Less than 5 Minutes | 61 (1.2%) | 70 (1.7%) |
| 5 to 9 Minutes | 384 (7.5%) | 349 (8.3%) |
| 10 to 14 Minutes | 547 (10.7%) | 351 (8.3%) |
| 15 to 19 Minutes | 545 (10.7%) | 582 (13.8%) |
| 20 to 24 Minutes | 864 (16.9%) | 808 (19.2%) |
| 25 to 29 Minutes | 310 (6.1%) | 239 (5.7%) |
| 30 to 34 Minutes | 1,118 (21.9%) | 812 (19.3%) |
| 35 to 39 Minutes | 210 (4.1%) | 125 (3.0%) |
| 40 to 44 Minutes | 107 (2.1%) | 89 (2.1%) |
| 45 to 59 Minutes | 545 (10.7%) | 575 (13.6%) |
| 60 to 89 Minutes | 249 (4.9%) | 111 (2.6%) |
| 90 or more Minutes | 160 (3.1%) | 106 (2.5%) |
Time of Departure to Work by Sex in Universal City
The most frequent times of departure to work in Universal City are 7:30 AM to 7:59 AM (898, 17.6%) for males and 7:00 AM to 7:29 AM (1,234, 29.3%) for females.
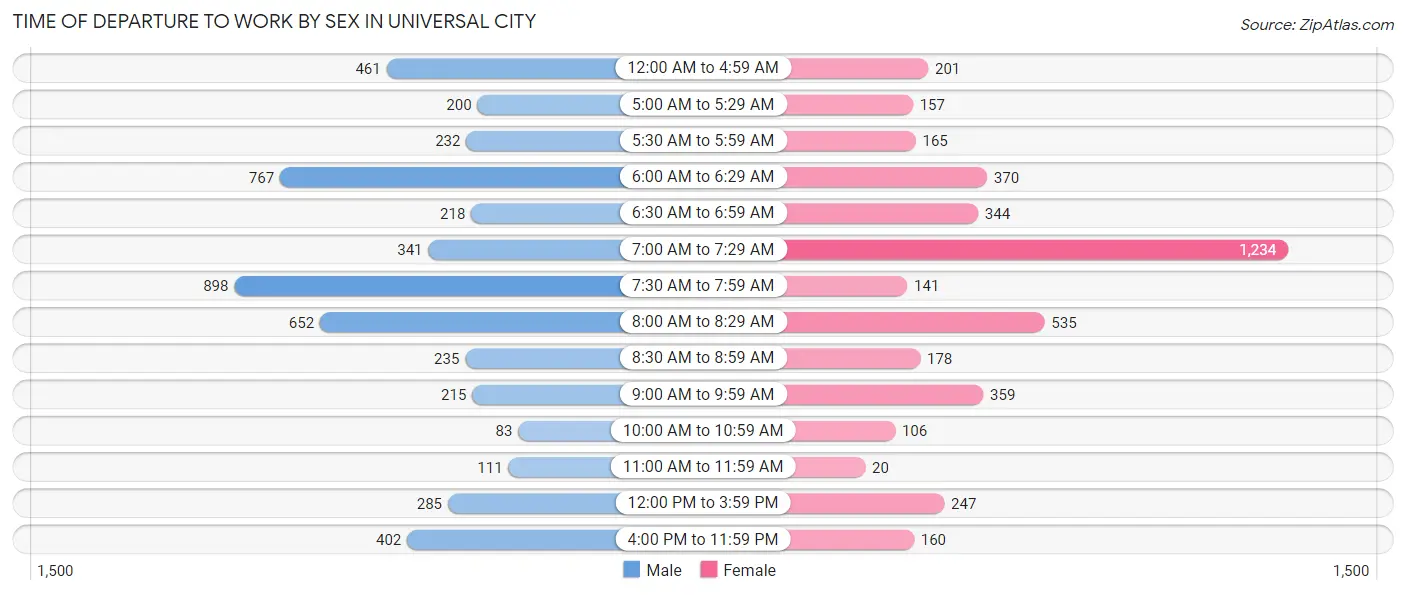
| Time of Departure | Male | Female |
| 12:00 AM to 4:59 AM | 461 (9.0%) | 201 (4.8%) |
| 5:00 AM to 5:29 AM | 200 (3.9%) | 157 (3.7%) |
| 5:30 AM to 5:59 AM | 232 (4.5%) | 165 (3.9%) |
| 6:00 AM to 6:29 AM | 767 (15.0%) | 370 (8.8%) |
| 6:30 AM to 6:59 AM | 218 (4.3%) | 344 (8.2%) |
| 7:00 AM to 7:29 AM | 341 (6.7%) | 1,234 (29.3%) |
| 7:30 AM to 7:59 AM | 898 (17.6%) | 141 (3.3%) |
| 8:00 AM to 8:29 AM | 652 (12.8%) | 535 (12.7%) |
| 8:30 AM to 8:59 AM | 235 (4.6%) | 178 (4.2%) |
| 9:00 AM to 9:59 AM | 215 (4.2%) | 359 (8.5%) |
| 10:00 AM to 10:59 AM | 83 (1.6%) | 106 (2.5%) |
| 11:00 AM to 11:59 AM | 111 (2.2%) | 20 (0.5%) |
| 12:00 PM to 3:59 PM | 285 (5.6%) | 247 (5.9%) |
| 4:00 PM to 11:59 PM | 402 (7.9%) | 160 (3.8%) |
| Total | 5,100 (100.0%) | 4,217 (100.0%) |
Housing Occupancy in Universal City
Occupancy by Ownership in Universal City
Of the total 7,592 dwellings in Universal City, owner-occupied units account for 4,226 (55.7%), while renter-occupied units make up 3,366 (44.3%).
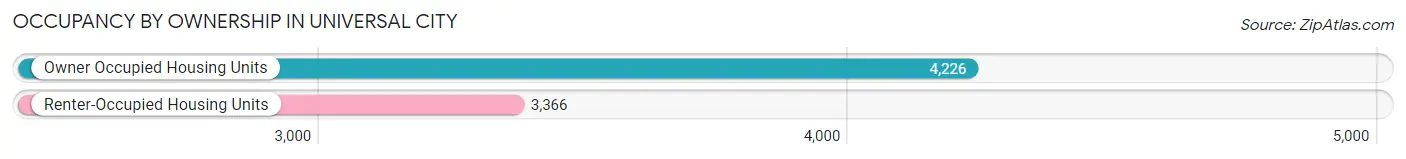
| Occupancy | # Housing Units | % Housing Units |
| Owner Occupied Housing Units | 4,226 | 55.7% |
| Renter-Occupied Housing Units | 3,366 | 44.3% |
| Total Occupied Housing Units | 7,592 | 100.0% |
Occupancy by Household Size in Universal City
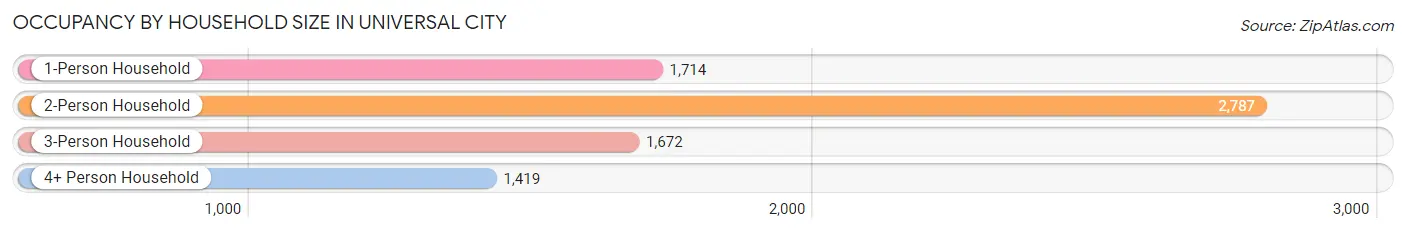
| Household Size | # Housing Units | % Housing Units |
| 1-Person Household | 1,714 | 22.6% |
| 2-Person Household | 2,787 | 36.7% |
| 3-Person Household | 1,672 | 22.0% |
| 4+ Person Household | 1,419 | 18.7% |
| Total Housing Units | 7,592 | 100.0% |
Occupancy by Ownership by Household Size in Universal City
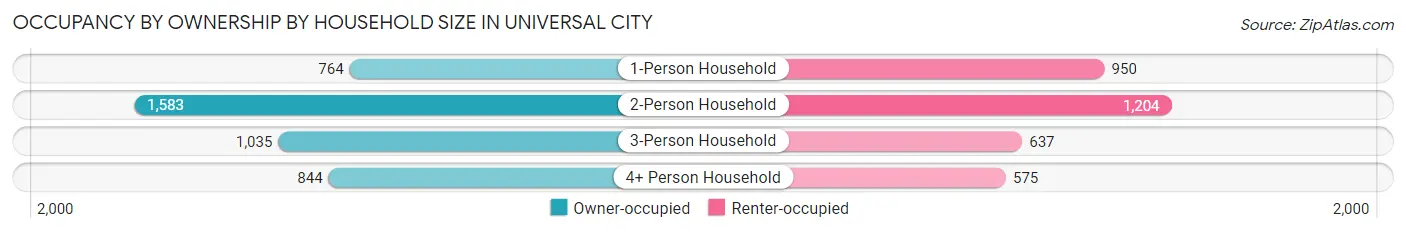
| Household Size | Owner-occupied | Renter-occupied |
| 1-Person Household | 764 (44.6%) | 950 (55.4%) |
| 2-Person Household | 1,583 (56.8%) | 1,204 (43.2%) |
| 3-Person Household | 1,035 (61.9%) | 637 (38.1%) |
| 4+ Person Household | 844 (59.5%) | 575 (40.5%) |
| Total Housing Units | 4,226 (55.7%) | 3,366 (44.3%) |
Occupancy by Educational Attainment in Universal City
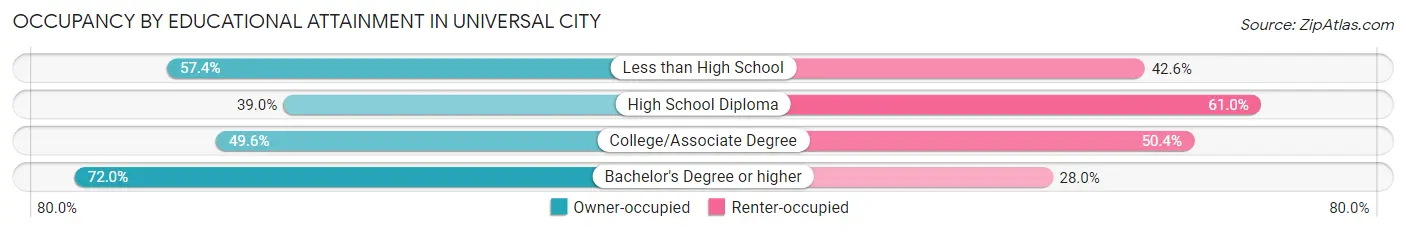
| Household Size | Owner-occupied | Renter-occupied |
| Less than High School | 97 (57.4%) | 72 (42.6%) |
| High School Diploma | 634 (39.0%) | 991 (61.0%) |
| College/Associate Degree | 1,510 (49.6%) | 1,532 (50.4%) |
| Bachelor's Degree or higher | 1,985 (72.0%) | 771 (28.0%) |
Occupancy by Age of Householder in Universal City
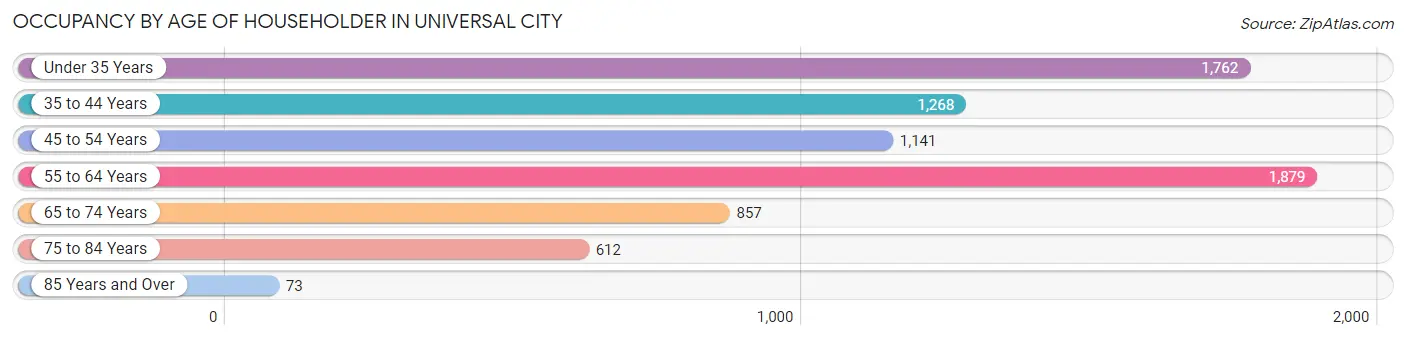
| Age Bracket | # Households | % Households |
| Under 35 Years | 1,762 | 23.2% |
| 35 to 44 Years | 1,268 | 16.7% |
| 45 to 54 Years | 1,141 | 15.0% |
| 55 to 64 Years | 1,879 | 24.7% |
| 65 to 74 Years | 857 | 11.3% |
| 75 to 84 Years | 612 | 8.1% |
| 85 Years and Over | 73 | 1.0% |
| Total | 7,592 | 100.0% |
Housing Finances in Universal City
Median Income by Occupancy in Universal City
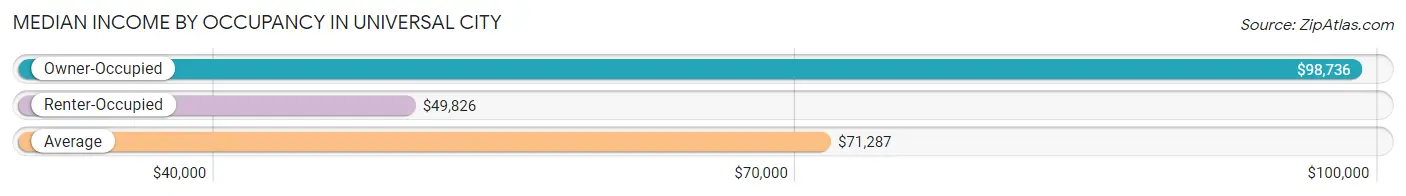
| Occupancy Type | # Households | Median Income |
| Owner-Occupied | 4,226 (55.7%) | $98,736 |
| Renter-Occupied | 3,366 (44.3%) | $49,826 |
| Average | 7,592 (100.0%) | $71,287 |
Occupancy by Householder Income Bracket in Universal City
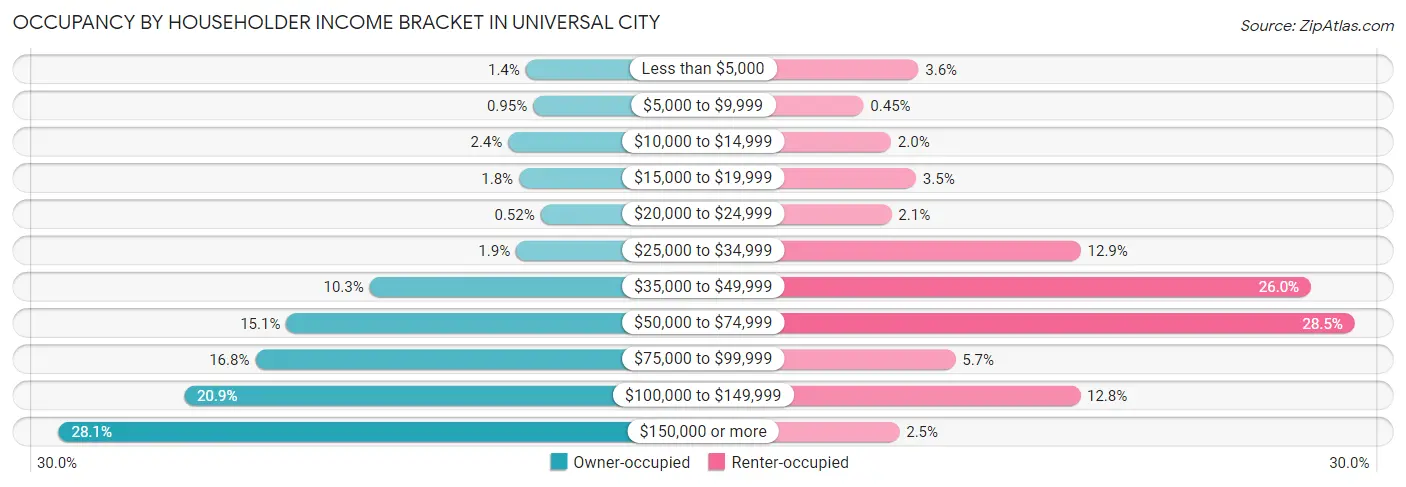
| Income Bracket | Owner-occupied | Renter-occupied |
| Less than $5,000 | 58 (1.4%) | 121 (3.6%) |
| $5,000 to $9,999 | 40 (0.9%) | 15 (0.4%) |
| $10,000 to $14,999 | 100 (2.4%) | 68 (2.0%) |
| $15,000 to $19,999 | 74 (1.8%) | 116 (3.5%) |
| $20,000 to $24,999 | 22 (0.5%) | 69 (2.1%) |
| $25,000 to $34,999 | 81 (1.9%) | 433 (12.9%) |
| $35,000 to $49,999 | 435 (10.3%) | 876 (26.0%) |
| $50,000 to $74,999 | 636 (15.0%) | 960 (28.5%) |
| $75,000 to $99,999 | 711 (16.8%) | 192 (5.7%) |
| $100,000 to $149,999 | 883 (20.9%) | 432 (12.8%) |
| $150,000 or more | 1,186 (28.1%) | 84 (2.5%) |
| Total | 4,226 (100.0%) | 3,366 (100.0%) |
Monthly Housing Cost Tiers in Universal City
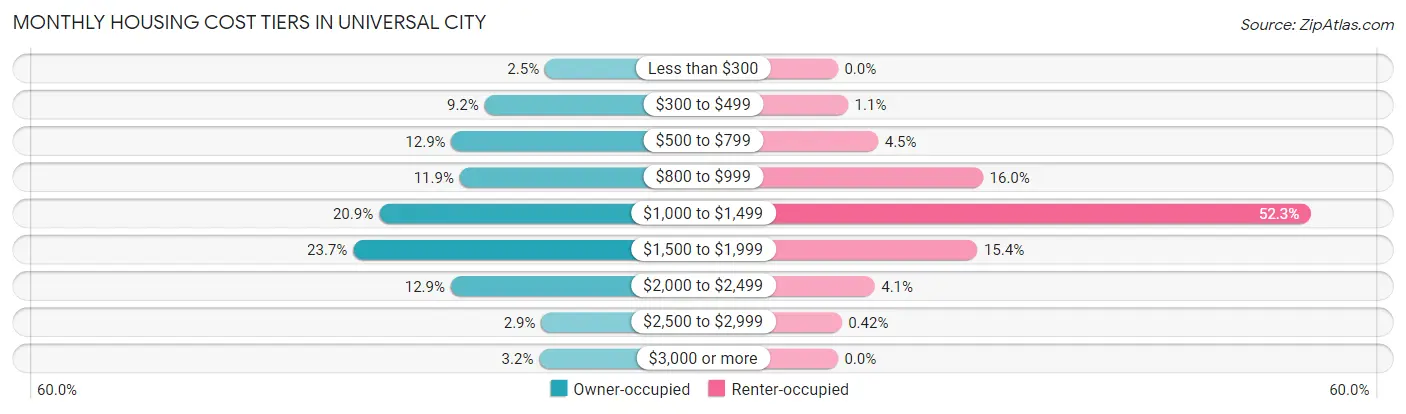
| Monthly Cost | Owner-occupied | Renter-occupied |
| Less than $300 | 106 (2.5%) | 0 (0.0%) |
| $300 to $499 | 388 (9.2%) | 38 (1.1%) |
| $500 to $799 | 543 (12.9%) | 150 (4.5%) |
| $800 to $999 | 504 (11.9%) | 540 (16.0%) |
| $1,000 to $1,499 | 881 (20.8%) | 1,761 (52.3%) |
| $1,500 to $1,999 | 1,002 (23.7%) | 519 (15.4%) |
| $2,000 to $2,499 | 546 (12.9%) | 137 (4.1%) |
| $2,500 to $2,999 | 123 (2.9%) | 14 (0.4%) |
| $3,000 or more | 133 (3.2%) | 0 (0.0%) |
| Total | 4,226 (100.0%) | 3,366 (100.0%) |
Physical Housing Characteristics in Universal City
Housing Structures in Universal City
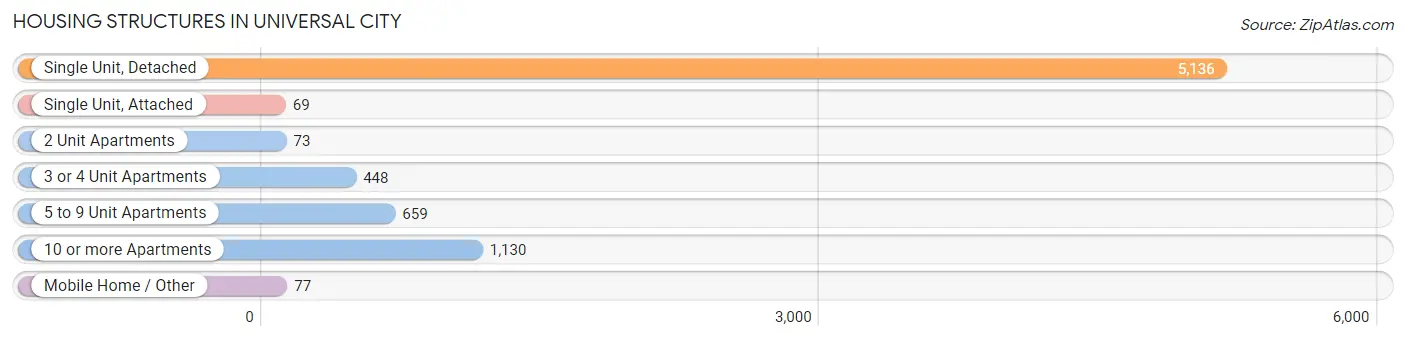
| Structure Type | # Housing Units | % Housing Units |
| Single Unit, Detached | 5,136 | 67.6% |
| Single Unit, Attached | 69 | 0.9% |
| 2 Unit Apartments | 73 | 1.0% |
| 3 or 4 Unit Apartments | 448 | 5.9% |
| 5 to 9 Unit Apartments | 659 | 8.7% |
| 10 or more Apartments | 1,130 | 14.9% |
| Mobile Home / Other | 77 | 1.0% |
| Total | 7,592 | 100.0% |
Housing Structures by Occupancy in Universal City
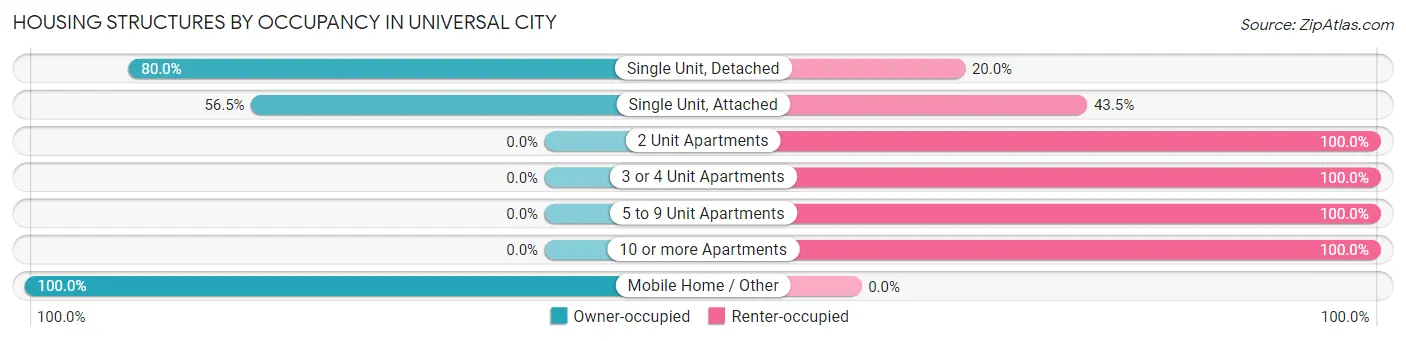
| Structure Type | Owner-occupied | Renter-occupied |
| Single Unit, Detached | 4,110 (80.0%) | 1,026 (20.0%) |
| Single Unit, Attached | 39 (56.5%) | 30 (43.5%) |
| 2 Unit Apartments | 0 (0.0%) | 73 (100.0%) |
| 3 or 4 Unit Apartments | 0 (0.0%) | 448 (100.0%) |
| 5 to 9 Unit Apartments | 0 (0.0%) | 659 (100.0%) |
| 10 or more Apartments | 0 (0.0%) | 1,130 (100.0%) |
| Mobile Home / Other | 77 (100.0%) | 0 (0.0%) |
| Total | 4,226 (55.7%) | 3,366 (44.3%) |
Housing Structures by Number of Rooms in Universal City
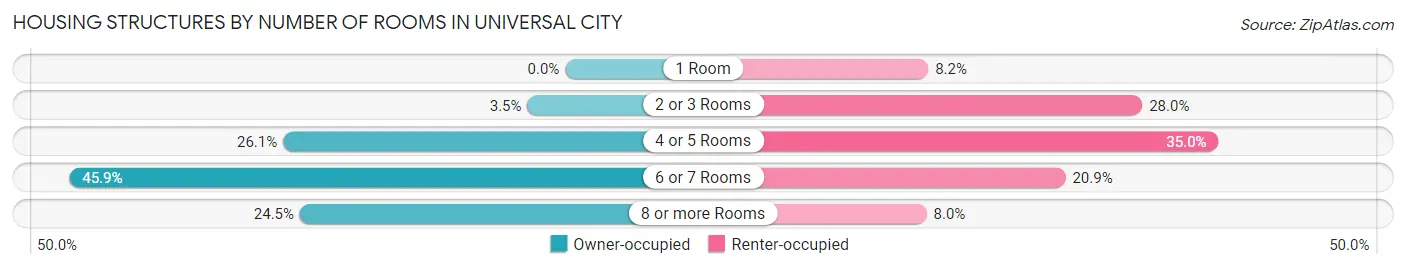
| Number of Rooms | Owner-occupied | Renter-occupied |
| 1 Room | 0 (0.0%) | 275 (8.2%) |
| 2 or 3 Rooms | 148 (3.5%) | 941 (28.0%) |
| 4 or 5 Rooms | 1,103 (26.1%) | 1,178 (35.0%) |
| 6 or 7 Rooms | 1,938 (45.9%) | 702 (20.9%) |
| 8 or more Rooms | 1,037 (24.5%) | 270 (8.0%) |
| Total | 4,226 (100.0%) | 3,366 (100.0%) |
Housing Structure by Heating Type in Universal City
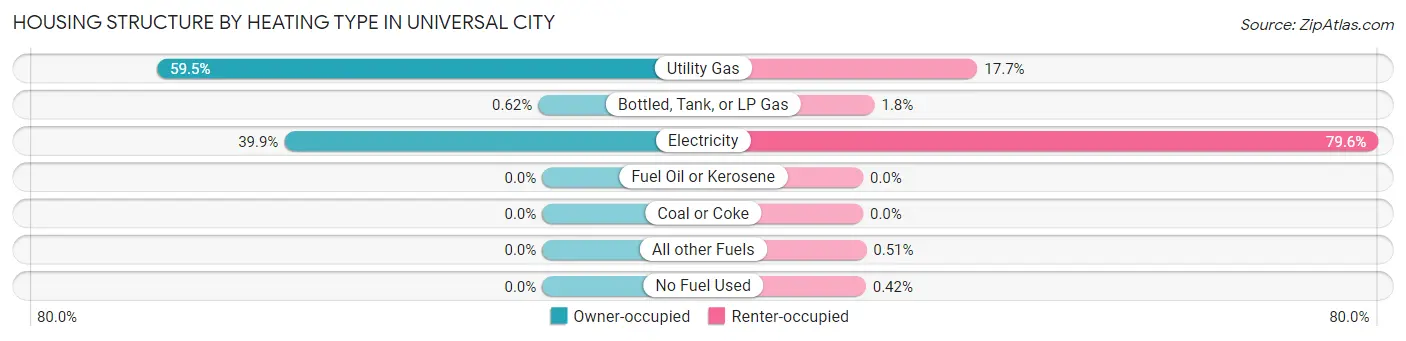
| Heating Type | Owner-occupied | Renter-occupied |
| Utility Gas | 2,515 (59.5%) | 595 (17.7%) |
| Bottled, Tank, or LP Gas | 26 (0.6%) | 60 (1.8%) |
| Electricity | 1,685 (39.9%) | 2,680 (79.6%) |
| Fuel Oil or Kerosene | 0 (0.0%) | 0 (0.0%) |
| Coal or Coke | 0 (0.0%) | 0 (0.0%) |
| All other Fuels | 0 (0.0%) | 17 (0.5%) |
| No Fuel Used | 0 (0.0%) | 14 (0.4%) |
| Total | 4,226 (100.0%) | 3,366 (100.0%) |
Household Vehicle Usage in Universal City
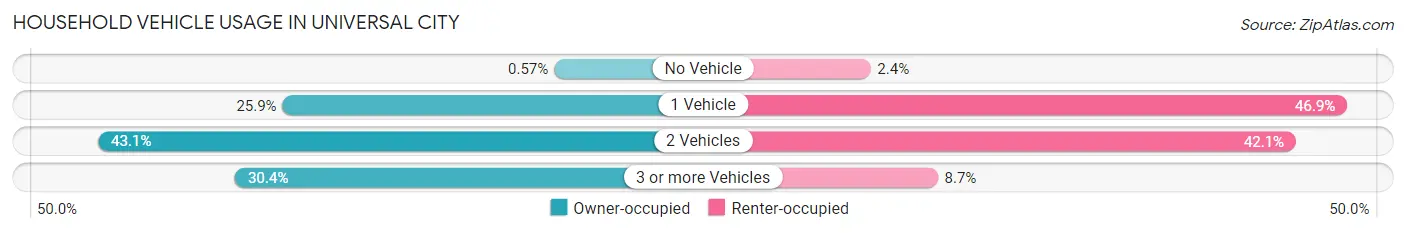
| Vehicles per Household | Owner-occupied | Renter-occupied |
| No Vehicle | 24 (0.6%) | 80 (2.4%) |
| 1 Vehicle | 1,096 (25.9%) | 1,578 (46.9%) |
| 2 Vehicles | 1,823 (43.1%) | 1,417 (42.1%) |
| 3 or more Vehicles | 1,283 (30.4%) | 291 (8.6%) |
| Total | 4,226 (100.0%) | 3,366 (100.0%) |
Real Estate & Mortgages in Universal City
Real Estate and Mortgage Overview in Universal City
| Characteristic | Without Mortgage | With Mortgage |
| Housing Units | 1,584 | 2,642 |
| Median Property Value | $222,500 | $228,700 |
| Median Household Income | $79,727 | $867 |
| Monthly Housing Costs | $665 | $133 |
| Real Estate Taxes | $3,883 | $145 |
Property Value by Mortgage Status in Universal City
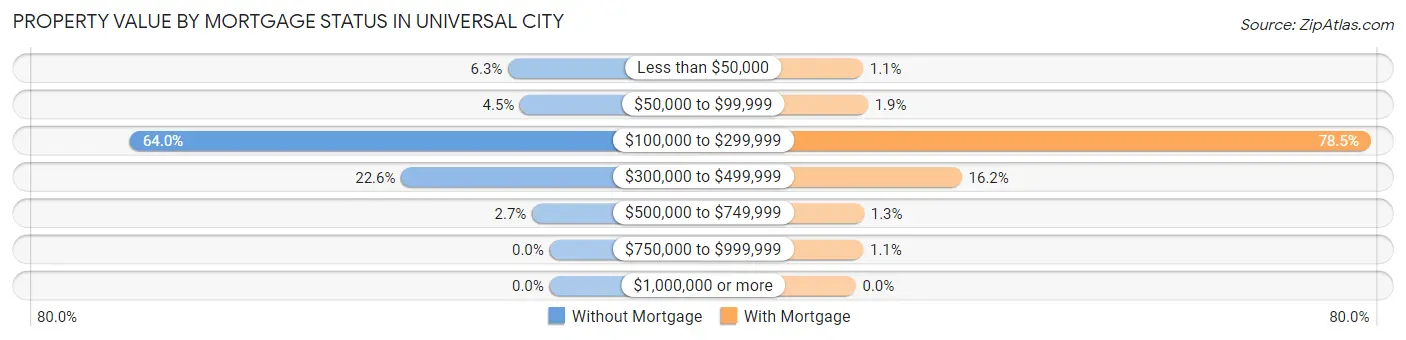
| Property Value | Without Mortgage | With Mortgage |
| Less than $50,000 | 100 (6.3%) | 29 (1.1%) |
| $50,000 to $99,999 | 71 (4.5%) | 49 (1.8%) |
| $100,000 to $299,999 | 1,013 (63.9%) | 2,074 (78.5%) |
| $300,000 to $499,999 | 358 (22.6%) | 427 (16.2%) |
| $500,000 to $749,999 | 42 (2.6%) | 33 (1.3%) |
| $750,000 to $999,999 | 0 (0.0%) | 30 (1.1%) |
| $1,000,000 or more | 0 (0.0%) | 0 (0.0%) |
| Total | 1,584 (100.0%) | 2,642 (100.0%) |
Household Income by Mortgage Status in Universal City
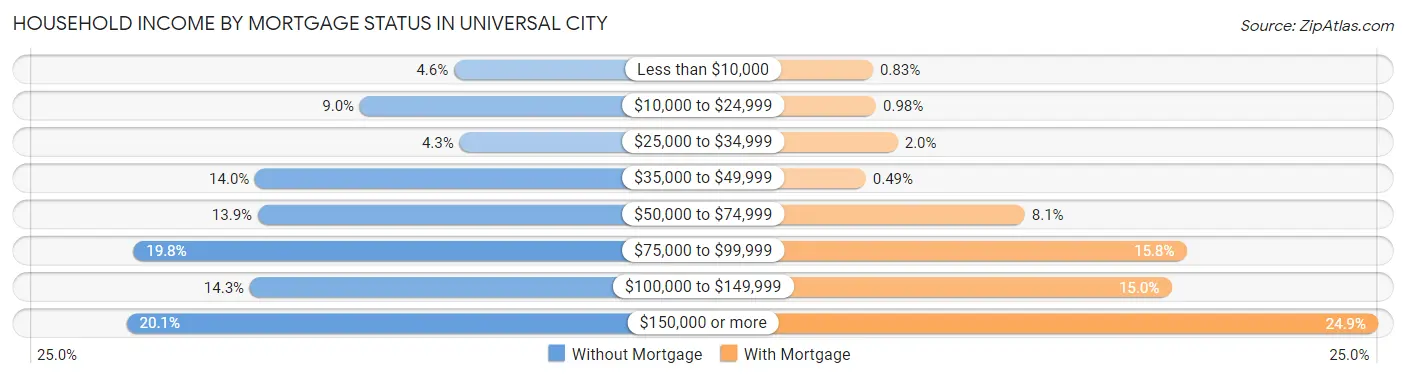
| Household Income | Without Mortgage | With Mortgage |
| Less than $10,000 | 72 (4.5%) | 22 (0.8%) |
| $10,000 to $24,999 | 143 (9.0%) | 26 (1.0%) |
| $25,000 to $34,999 | 68 (4.3%) | 53 (2.0%) |
| $35,000 to $49,999 | 222 (14.0%) | 13 (0.5%) |
| $50,000 to $74,999 | 220 (13.9%) | 213 (8.1%) |
| $75,000 to $99,999 | 314 (19.8%) | 416 (15.8%) |
| $100,000 to $149,999 | 226 (14.3%) | 397 (15.0%) |
| $150,000 or more | 319 (20.1%) | 657 (24.9%) |
| Total | 1,584 (100.0%) | 2,642 (100.0%) |
Property Value to Household Income Ratio in Universal City
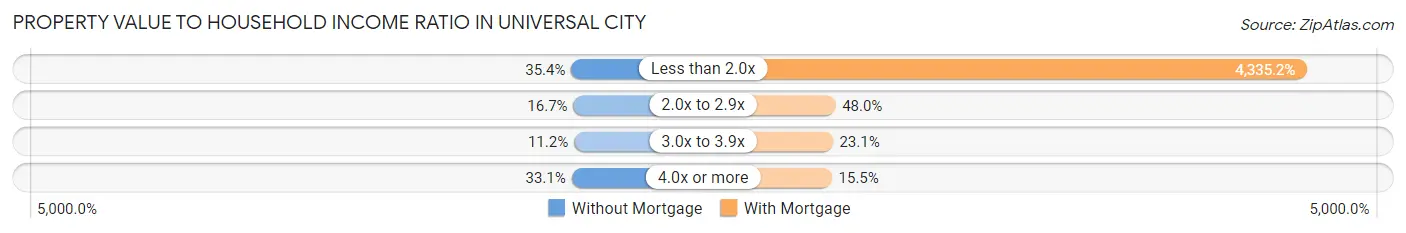
| Value-to-Income Ratio | Without Mortgage | With Mortgage |
| Less than 2.0x | 560 (35.3%) | 114,535 (4,335.2%) |
| 2.0x to 2.9x | 264 (16.7%) | 1,268 (48.0%) |
| 3.0x to 3.9x | 177 (11.2%) | 611 (23.1%) |
| 4.0x or more | 525 (33.1%) | 410 (15.5%) |
| Total | 1,584 (100.0%) | 2,642 (100.0%) |
Real Estate Taxes by Mortgage Status in Universal City
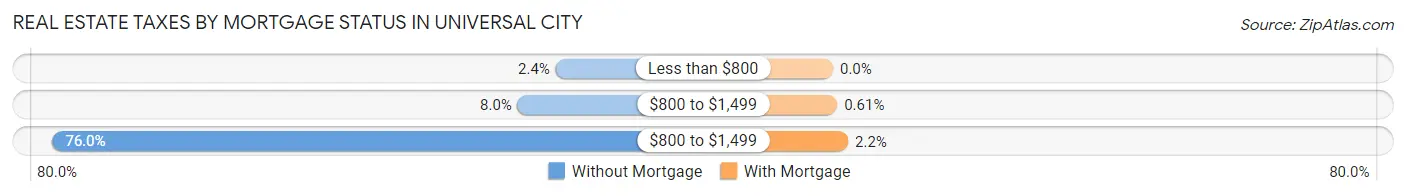
| Property Taxes | Without Mortgage | With Mortgage |
| Less than $800 | 38 (2.4%) | 0 (0.0%) |
| $800 to $1,499 | 126 (8.0%) | 16 (0.6%) |
| $800 to $1,499 | 1,203 (75.9%) | 58 (2.2%) |
| Total | 1,584 (100.0%) | 2,642 (100.0%) |
Health & Disability in Universal City
Health Insurance Coverage by Age in Universal City
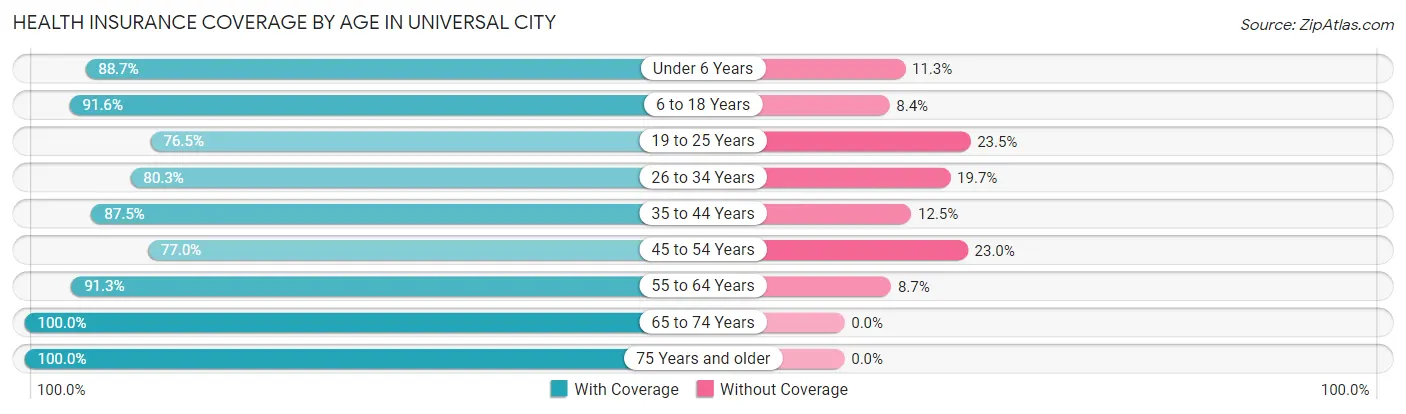
| Age Bracket | With Coverage | Without Coverage |
| Under 6 Years | 799 (88.7%) | 102 (11.3%) |
| 6 to 18 Years | 3,751 (91.6%) | 344 (8.4%) |
| 19 to 25 Years | 1,483 (76.5%) | 455 (23.5%) |
| 26 to 34 Years | 1,858 (80.3%) | 457 (19.7%) |
| 35 to 44 Years | 2,227 (87.5%) | 317 (12.5%) |
| 45 to 54 Years | 1,684 (77.0%) | 503 (23.0%) |
| 55 to 64 Years | 2,792 (91.3%) | 266 (8.7%) |
| 65 to 74 Years | 1,533 (100.0%) | 0 (0.0%) |
| 75 Years and older | 1,059 (100.0%) | 0 (0.0%) |
| Total | 17,186 (87.5%) | 2,444 (12.4%) |
Health Insurance Coverage by Citizenship Status in Universal City
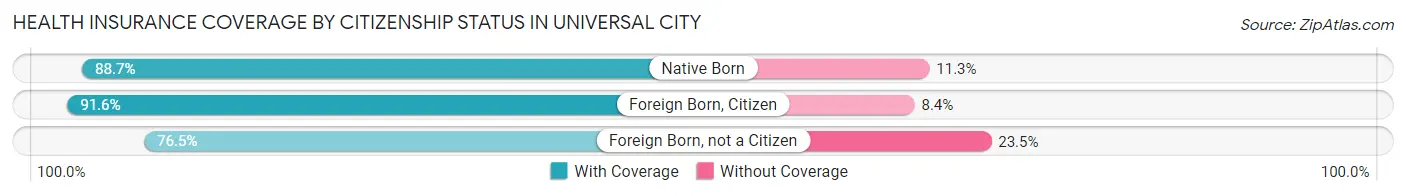
| Citizenship Status | With Coverage | Without Coverage |
| Native Born | 799 (88.7%) | 102 (11.3%) |
| Foreign Born, Citizen | 3,751 (91.6%) | 344 (8.4%) |
| Foreign Born, not a Citizen | 1,483 (76.5%) | 455 (23.5%) |
Health Insurance Coverage by Household Income in Universal City
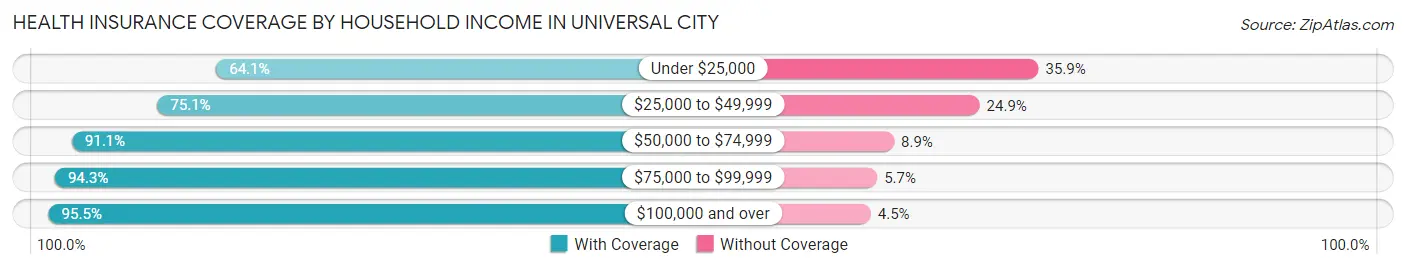
| Household Income | With Coverage | Without Coverage |
| Under $25,000 | 947 (64.1%) | 531 (35.9%) |
| $25,000 to $49,999 | 3,314 (75.1%) | 1,098 (24.9%) |
| $50,000 to $74,999 | 3,363 (91.1%) | 327 (8.9%) |
| $75,000 to $99,999 | 2,580 (94.3%) | 156 (5.7%) |
| $100,000 and over | 6,972 (95.5%) | 329 (4.5%) |
Public vs Private Health Insurance Coverage by Age in Universal City
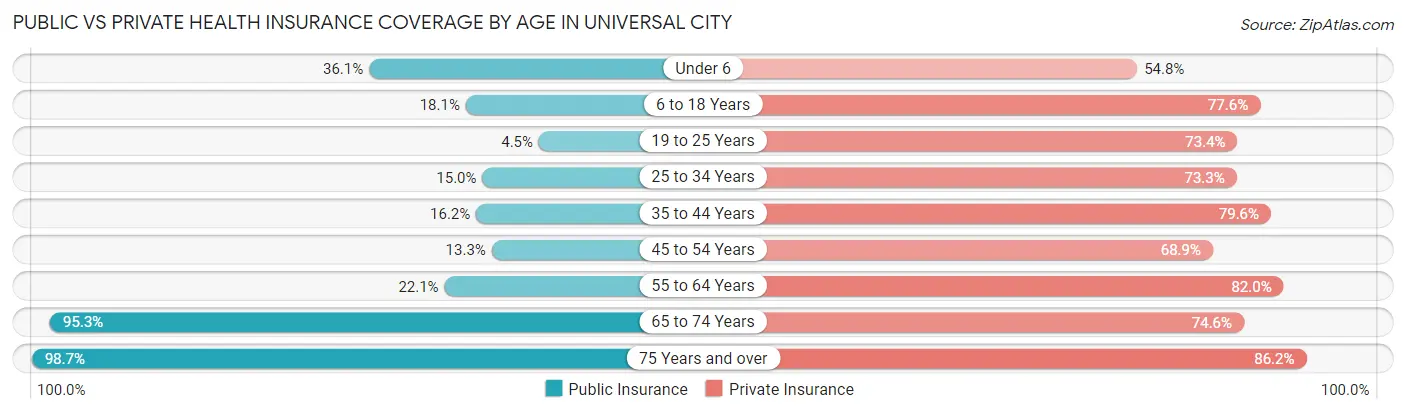
| Age Bracket | Public Insurance | Private Insurance |
| Under 6 | 325 (36.1%) | 494 (54.8%) |
| 6 to 18 Years | 742 (18.1%) | 3,179 (77.6%) |
| 19 to 25 Years | 88 (4.5%) | 1,423 (73.4%) |
| 25 to 34 Years | 348 (15.0%) | 1,696 (73.3%) |
| 35 to 44 Years | 412 (16.2%) | 2,026 (79.6%) |
| 45 to 54 Years | 291 (13.3%) | 1,506 (68.9%) |
| 55 to 64 Years | 675 (22.1%) | 2,507 (82.0%) |
| 65 to 74 Years | 1,461 (95.3%) | 1,144 (74.6%) |
| 75 Years and over | 1,045 (98.7%) | 913 (86.2%) |
| Total | 5,387 (27.4%) | 14,888 (75.8%) |
Disability Status by Sex by Age in Universal City
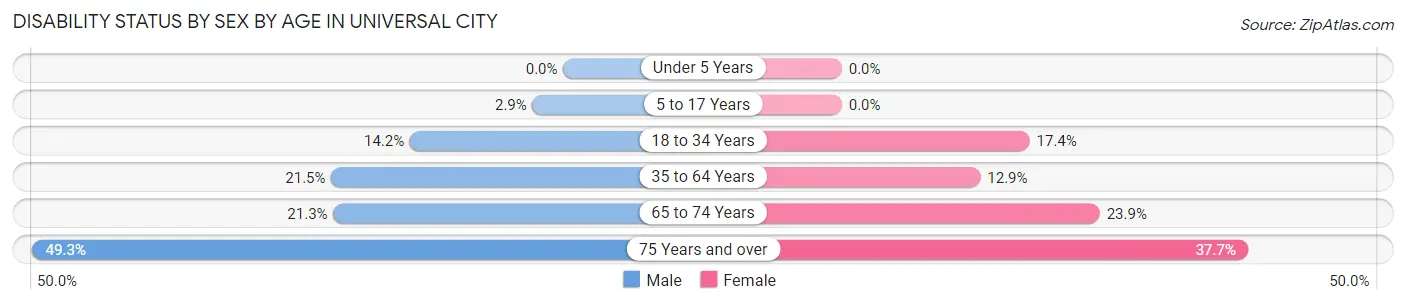
| Age Bracket | Male | Female |
| Under 5 Years | 0 (0.0%) | 0 (0.0%) |
| 5 to 17 Years | 58 (2.9%) | 0 (0.0%) |
| 18 to 34 Years | 335 (14.2%) | 377 (17.4%) |
| 35 to 64 Years | 825 (21.5%) | 509 (12.9%) |
| 65 to 74 Years | 181 (21.3%) | 164 (23.9%) |
| 75 Years and over | 230 (49.2%) | 223 (37.7%) |
Disability Class by Sex by Age in Universal City
Disability Class: Hearing Difficulty
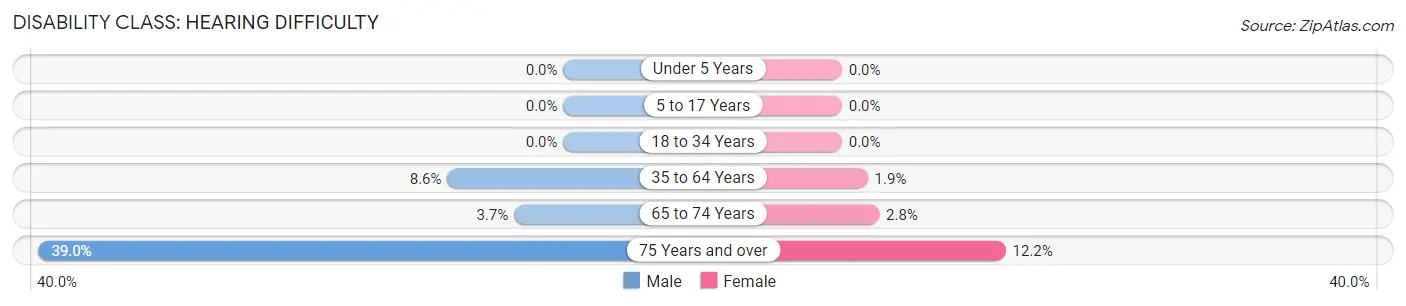
| Age Bracket | Male | Female |
| Under 5 Years | 0 (0.0%) | 0 (0.0%) |
| 5 to 17 Years | 0 (0.0%) | 0 (0.0%) |
| 18 to 34 Years | 0 (0.0%) | 0 (0.0%) |
| 35 to 64 Years | 330 (8.6%) | 76 (1.9%) |
| 65 to 74 Years | 31 (3.7%) | 19 (2.8%) |
| 75 Years and over | 182 (39.0%) | 72 (12.2%) |
Disability Class: Vision Difficulty
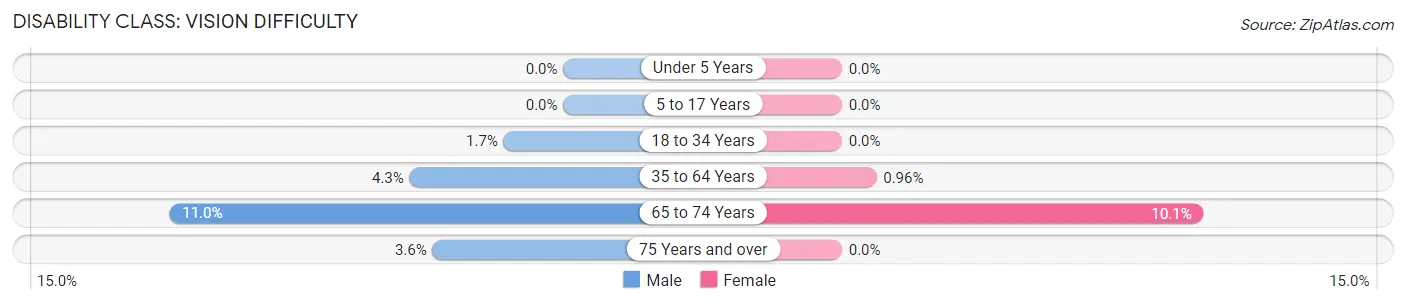
| Age Bracket | Male | Female |
| Under 5 Years | 0 (0.0%) | 0 (0.0%) |
| 5 to 17 Years | 0 (0.0%) | 0 (0.0%) |
| 18 to 34 Years | 39 (1.7%) | 0 (0.0%) |
| 35 to 64 Years | 164 (4.3%) | 38 (1.0%) |
| 65 to 74 Years | 93 (11.0%) | 69 (10.1%) |
| 75 Years and over | 17 (3.6%) | 0 (0.0%) |
Disability Class: Cognitive Difficulty
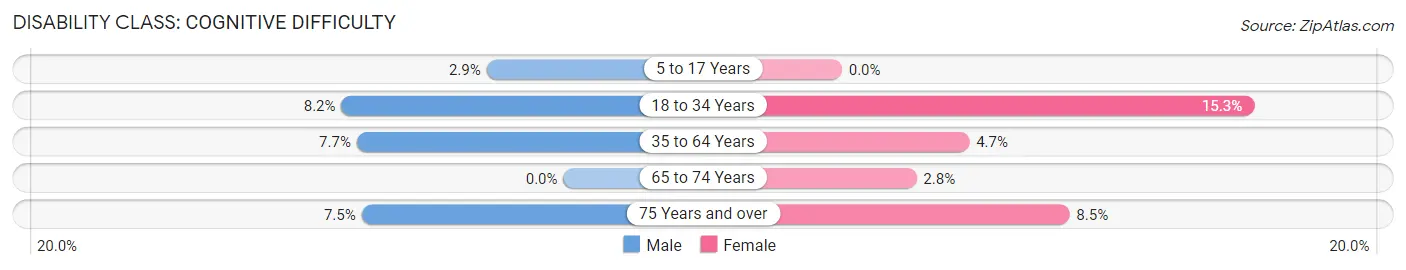
| Age Bracket | Male | Female |
| 5 to 17 Years | 58 (2.9%) | 0 (0.0%) |
| 18 to 34 Years | 194 (8.2%) | 331 (15.3%) |
| 35 to 64 Years | 294 (7.7%) | 187 (4.7%) |
| 65 to 74 Years | 0 (0.0%) | 19 (2.8%) |
| 75 Years and over | 35 (7.5%) | 50 (8.5%) |
Disability Class: Ambulatory Difficulty
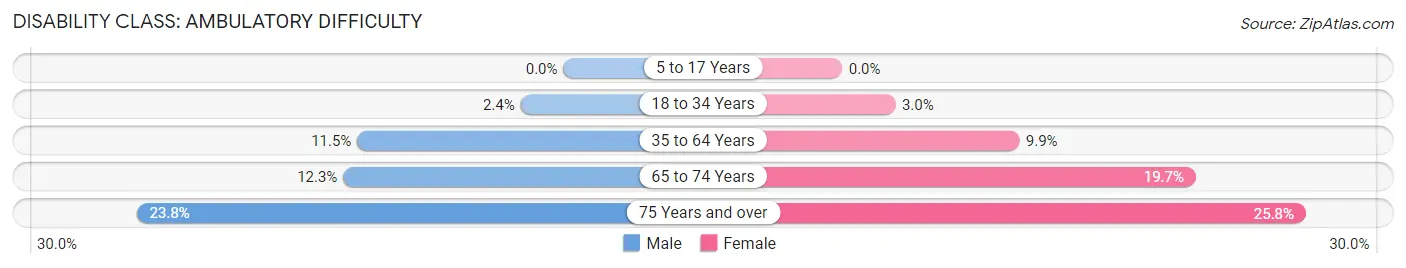
| Age Bracket | Male | Female |
| 5 to 17 Years | 0 (0.0%) | 0 (0.0%) |
| 18 to 34 Years | 56 (2.4%) | 64 (3.0%) |
| 35 to 64 Years | 440 (11.5%) | 390 (9.9%) |
| 65 to 74 Years | 104 (12.3%) | 135 (19.7%) |
| 75 Years and over | 111 (23.8%) | 153 (25.8%) |
Disability Class: Self-Care Difficulty
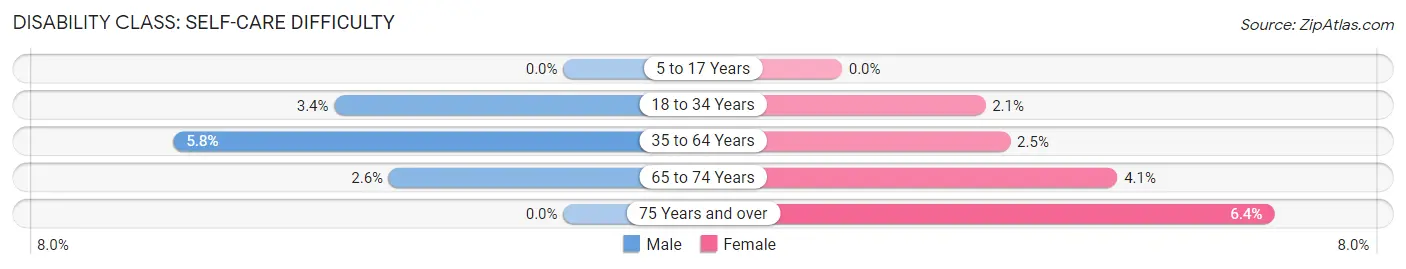
| Age Bracket | Male | Female |
| 5 to 17 Years | 0 (0.0%) | 0 (0.0%) |
| 18 to 34 Years | 80 (3.4%) | 46 (2.1%) |
| 35 to 64 Years | 222 (5.8%) | 99 (2.5%) |
| 65 to 74 Years | 22 (2.6%) | 28 (4.1%) |
| 75 Years and over | 0 (0.0%) | 38 (6.4%) |
Technology Access in Universal City
Computing Device Access in Universal City
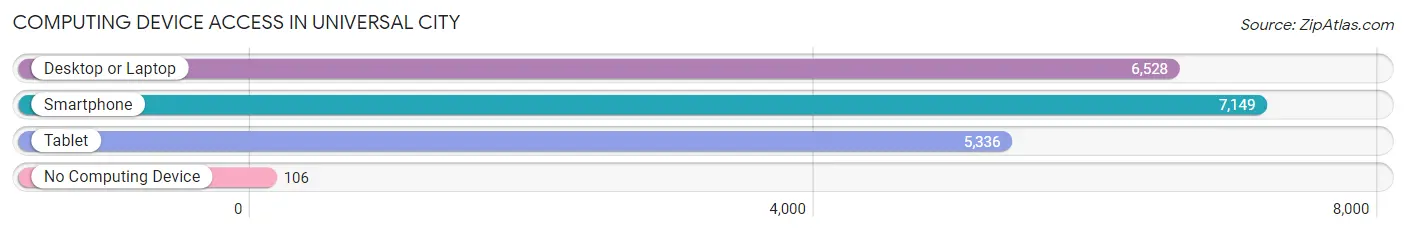
| Device Type | # Households | % Households |
| Desktop or Laptop | 6,528 | 86.0% |
| Smartphone | 7,149 | 94.2% |
| Tablet | 5,336 | 70.3% |
| No Computing Device | 106 | 1.4% |
| Total | 7,592 | 100.0% |
Internet Access in Universal City
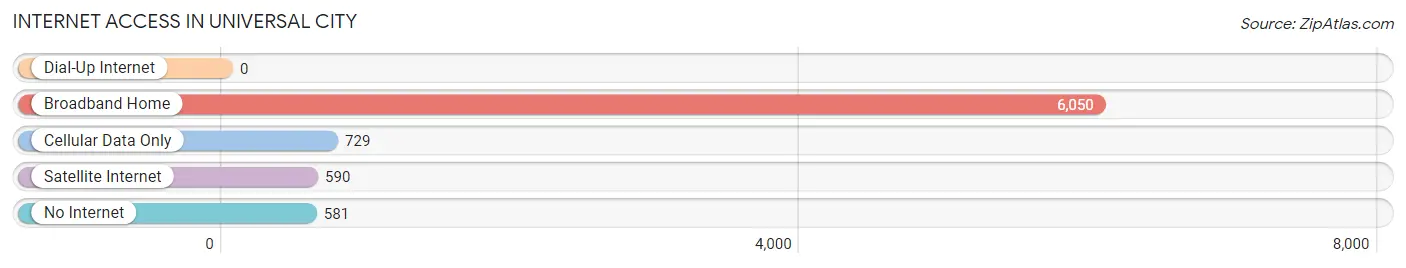
| Internet Type | # Households | % Households |
| Dial-Up Internet | 0 | 0.0% |
| Broadband Home | 6,050 | 79.7% |
| Cellular Data Only | 729 | 9.6% |
| Satellite Internet | 590 | 7.8% |
| No Internet | 581 | 7.6% |
| Total | 7,592 | 100.0% |
Universal City Summary
Universal City, Texas is a city located in Bexar County, Texas, United States. It is a suburb of San Antonio and part of the San Antonio–New Braunfels metropolitan area. The population was 19,236 at the 2010 census.
History
Universal City was founded in 1959 by the Universal City Development Company, a subsidiary of the Universal Oil Products Company. The company was formed to develop a planned community in the area. The city was incorporated in 1960 and has grown steadily since then.
Geography
Universal City is located at 29°32'25" North, 98°20'17" West (29.540278, -98.338056). It is situated in the northeast corner of Bexar County, approximately 15 miles northeast of downtown San Antonio. The city is bordered by Schertz to the north, Converse to the east, Live Oak to the south, and Randolph Air Force Base to the west.
Universal City has a total area of 8.2 square miles, all of which is land. The terrain is mostly flat, with some rolling hills in the northern part of the city. The city is located in the Edwards Plateau region of Texas, which is characterized by limestone hills and creeks.
Economy
Universal City is a bedroom community for San Antonio, with many of its residents commuting to the city for work. The city's economy is largely based on retail and services, with many of its businesses catering to the needs of the local population.
The largest employers in Universal City are Randolph Air Force Base, Universal City Independent School District, and Universal City Development Company. Other major employers include Walmart, H-E-B, and the City of Universal City.
Demographics
As of the 2010 census, there were 19,236 people, 6,945 households, and 5,541 families residing in the city. The population density was 2,346.2 people per square mile. The racial makeup of the city was 79.2% White, 8.3% African American, 0.5% Native American, 4.2% Asian, 0.1% Pacific Islander, 5.2% from other races, and 2.5% from two or more races. Hispanic or Latino of any race were 18.3% of the population.
The median income for a household in the city was $60,945, and the median income for a family was $68,945. The per capita income for the city was $25,945. About 4.2% of families and 5.7% of the population were below the poverty line, including 7.2% of those under age 18 and 4.2% of those age 65 or over.
Universal City is served by the Universal City Independent School District. The district has five elementary schools, two middle schools, and one high school. The city is also home to the University of the Incarnate Word, a private Catholic university.
Common Questions
What is Per Capita Income in Universal City?
Per Capita income in Universal City is $36,828.
What is the Median Family Income in Universal City?
Median Family Income in Universal City is $80,949.
What is the Median Household income in Universal City?
Median Household Income in Universal City is $71,287.
What is Income or Wage Gap in Universal City?
Income or Wage Gap in Universal City is 2.3%.
Women in Universal City earn 97.7 cents for every dollar earned by a man.
What is Inequality or Gini Index in Universal City?
Inequality or Gini Index in Universal City is 0.41.
What is the Total Population of Universal City?
Total Population of Universal City is 19,798.
What is the Total Male Population of Universal City?
Total Male Population of Universal City is 9,975.
What is the Total Female Population of Universal City?
Total Female Population of Universal City is 9,823.
What is the Ratio of Males per 100 Females in Universal City?
There are 101.55 Males per 100 Females in Universal City.
What is the Ratio of Females per 100 Males in Universal City?
There are 98.48 Females per 100 Males in Universal City.
What is the Median Population Age in Universal City?
Median Population Age in Universal City is 37.2 Years.
What is the Average Family Size in Universal City
Average Family Size in Universal City is 3.0 People.
What is the Average Household Size in Universal City
Average Household Size in Universal City is 2.6 People.
How Large is the Labor Force in Universal City?
There are 10,538 People in the Labor Forcein in Universal City.
What is the Percentage of People in the Labor Force in Universal City?
68.0% of People are in the Labor Force in Universal City.
What is the Unemployment Rate in Universal City?
Unemployment Rate in Universal City is 5.1%.