Taft, TX Map & Demographics
Taft Map
Taft Overview
$20,915
PER CAPITA INCOME
$68,446
AVG FAMILY INCOME
$54,286
AVG HOUSEHOLD INCOME
56.7%
WAGE / INCOME GAP [ % ]
43.3¢/ $1
WAGE / INCOME GAP [ $ ]
0.45
INEQUALITY / GINI INDEX
2,838
TOTAL POPULATION
1,379
MALE POPULATION
1,459
FEMALE POPULATION
94.52
MALES / 100 FEMALES
105.80
FEMALES / 100 MALES
33.8
MEDIAN AGE
3.8
AVG FAMILY SIZE
3.3
AVG HOUSEHOLD SIZE
1,110
LABOR FORCE [ PEOPLE ]
54.0%
PERCENT IN LABOR FORCE
10.0%
UNEMPLOYMENT RATE
Taft Zip Codes
Taft Area Codes
Income in Taft
Income Overview in Taft
Per Capita Income in Taft is $20,915, while median incomes of families and households are $68,446 and $54,286 respectively.
| Characteristic | Number | Measure |
| Per Capita Income | 2,838 | $20,915 |
| Median Family Income | 664 | $68,446 |
| Mean Family Income | 664 | $67,002 |
| Median Household Income | 858 | $54,286 |
| Mean Household Income | 858 | $66,913 |
| Income Deficit | 664 | $0 |
| Wage / Income Gap (%) | 2,838 | 56.68% |
| Wage / Income Gap ($) | 2,838 | 43.32¢ per $1 |
| Gini / Inequality Index | 2,838 | 0.45 |
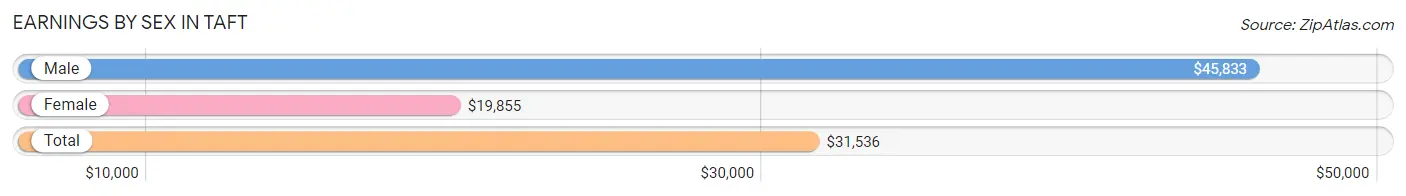
Earnings by Sex in Taft
Average Earnings in Taft are $31,536, $45,833 for men and $19,855 for women, a difference of 56.7%.
| Sex | Number | Average Earnings |
| Male | 574 (50.7%) | $45,833 |
| Female | 557 (49.2%) | $19,855 |
| Total | 1,131 (100.0%) | $31,536 |
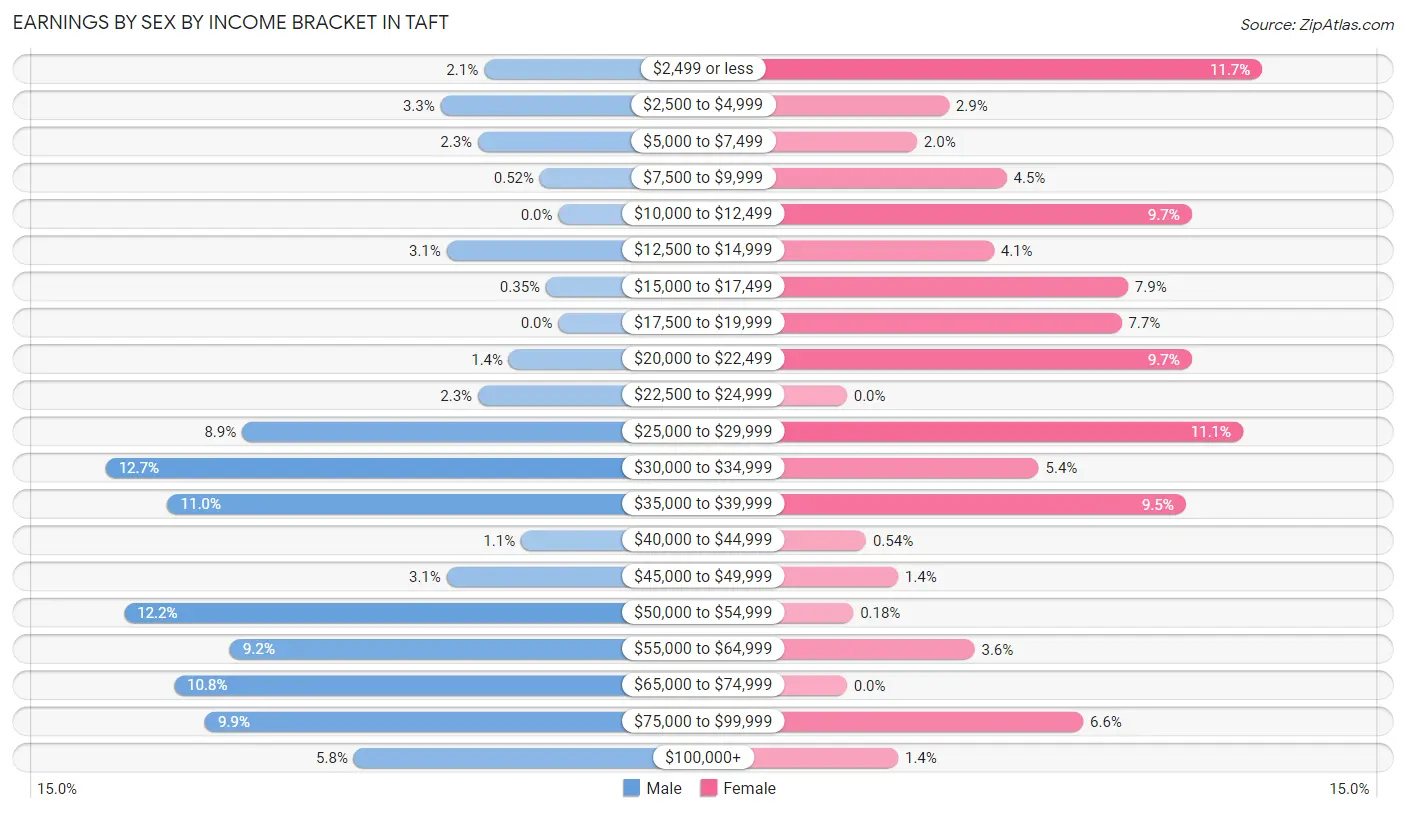
Earnings by Sex by Income Bracket in Taft
The most common earnings brackets in Taft are $30,000 to $34,999 for men (73 | 12.7%) and $2,499 or less for women (65 | 11.7%).
| Income | Male | Female |
| $2,499 or less | 12 (2.1%) | 65 (11.7%) |
| $2,500 to $4,999 | 19 (3.3%) | 16 (2.9%) |
| $5,000 to $7,499 | 13 (2.3%) | 11 (2.0%) |
| $7,500 to $9,999 | 3 (0.5%) | 25 (4.5%) |
| $10,000 to $12,499 | 0 (0.0%) | 54 (9.7%) |
| $12,500 to $14,999 | 18 (3.1%) | 23 (4.1%) |
| $15,000 to $17,499 | 2 (0.4%) | 44 (7.9%) |
| $17,500 to $19,999 | 0 (0.0%) | 43 (7.7%) |
| $20,000 to $22,499 | 8 (1.4%) | 54 (9.7%) |
| $22,500 to $24,999 | 13 (2.3%) | 0 (0.0%) |
| $25,000 to $29,999 | 51 (8.9%) | 62 (11.1%) |
| $30,000 to $34,999 | 73 (12.7%) | 30 (5.4%) |
| $35,000 to $39,999 | 63 (11.0%) | 53 (9.5%) |
| $40,000 to $44,999 | 6 (1.1%) | 3 (0.5%) |
| $45,000 to $49,999 | 18 (3.1%) | 8 (1.4%) |
| $50,000 to $54,999 | 70 (12.2%) | 1 (0.2%) |
| $55,000 to $64,999 | 53 (9.2%) | 20 (3.6%) |
| $65,000 to $74,999 | 62 (10.8%) | 0 (0.0%) |
| $75,000 to $99,999 | 57 (9.9%) | 37 (6.6%) |
| $100,000+ | 33 (5.8%) | 8 (1.4%) |
| Total | 574 (100.0%) | 557 (100.0%) |
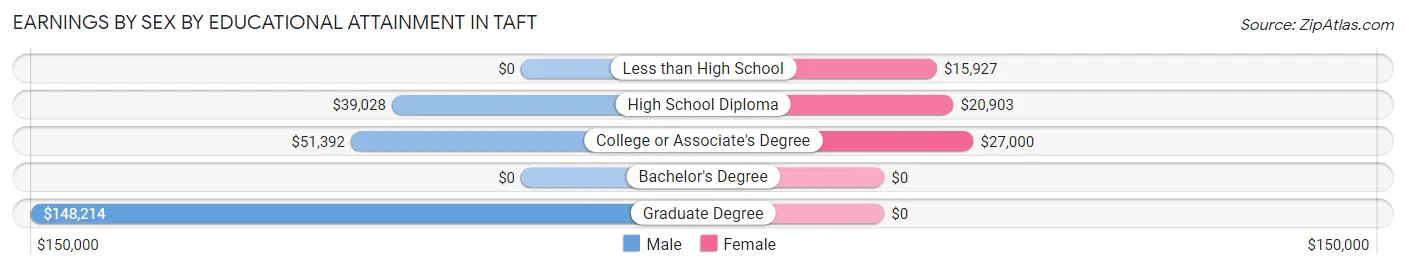
Earnings by Sex by Educational Attainment in Taft
Average earnings in Taft are $50,313 for men and $22,130 for women, a difference of 56.0%. Men with an educational attainment of graduate degree enjoy the highest average annual earnings of $148,214, while those with high school diploma education earn the least with $39,028. Women with an educational attainment of college or associate's degree earn the most with the average annual earnings of $27,000, while those with less than high school education have the smallest earnings of $15,927.
| Educational Attainment | Male Income | Female Income |
| Less than High School | - | - |
| High School Diploma | $39,028 | $20,903 |
| College or Associate's Degree | $51,392 | $27,000 |
| Bachelor's Degree | - | - |
| Graduate Degree | $148,214 | $0 |
| Total | $50,313 | $22,130 |
Family Income in Taft
Family Income Brackets in Taft
According to the Taft family income data, there are 148 families falling into the $50,000 to $74,999 income range, which is the most common income bracket and makes up 22.3% of all families. Conversely, the $200,000+ income bracket is the least frequent group with only 11 families (1.7%) belonging to this category.
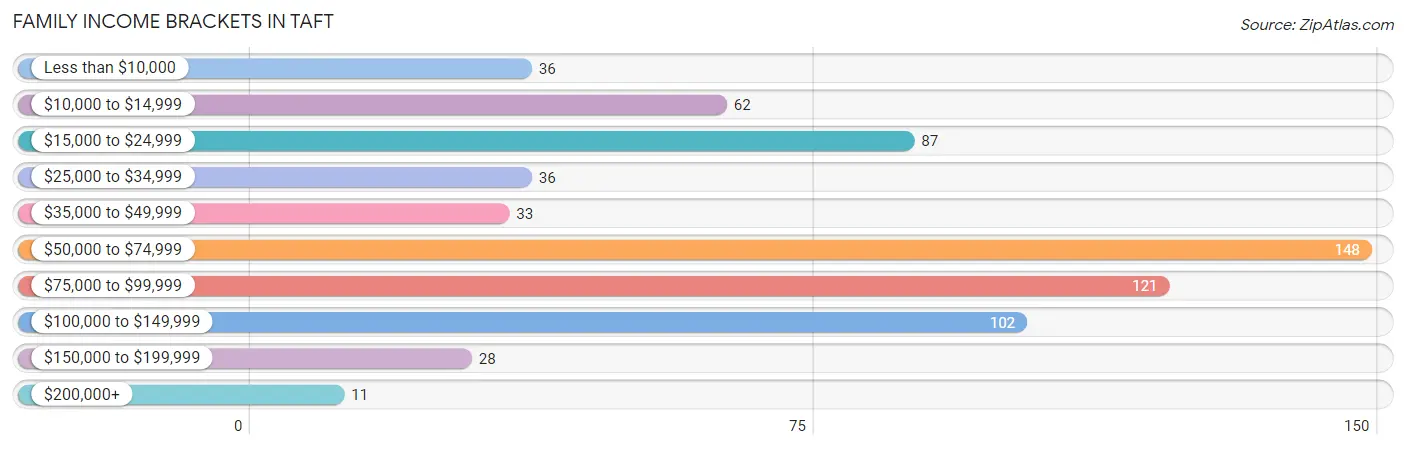
| Income Bracket | # Families | % Families |
| Less than $10,000 | 36 | 5.4% |
| $10,000 to $14,999 | 62 | 9.3% |
| $15,000 to $24,999 | 87 | 13.1% |
| $25,000 to $34,999 | 36 | 5.4% |
| $35,000 to $49,999 | 33 | 5.0% |
| $50,000 to $74,999 | 148 | 22.3% |
| $75,000 to $99,999 | 121 | 18.2% |
| $100,000 to $149,999 | 102 | 15.4% |
| $150,000 to $199,999 | 28 | 4.2% |
| $200,000+ | 11 | 1.7% |
Family Income by Famaliy Size in Taft
5-person families (81 | 12.2%) account for the highest median family income in Taft with $101,985 per family, while 3-person families (108 | 16.3%) have the highest median income of $31,111 per family member.
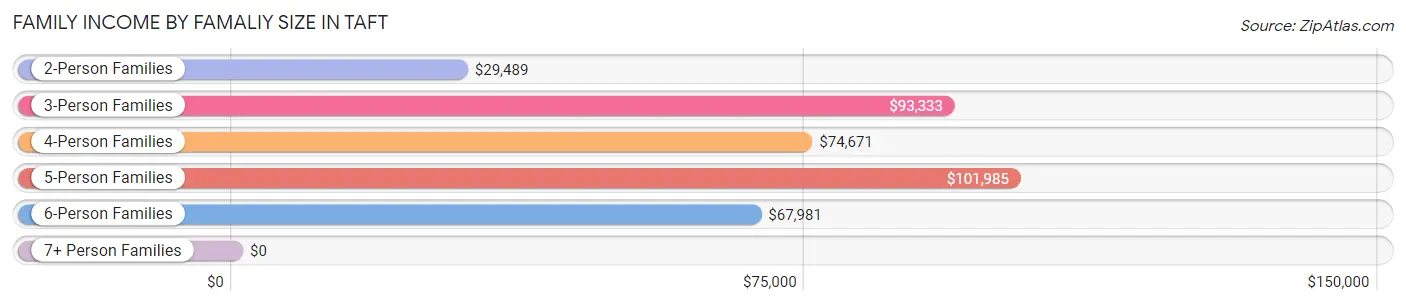
| Income Bracket | # Families | Median Income |
| 2-Person Families | 211 (31.8%) | $29,489 |
| 3-Person Families | 108 (16.3%) | $93,333 |
| 4-Person Families | 164 (24.7%) | $74,671 |
| 5-Person Families | 81 (12.2%) | $101,985 |
| 6-Person Families | 45 (6.8%) | $67,981 |
| 7+ Person Families | 55 (8.3%) | $0 |
| Total | 664 (100.0%) | $68,446 |
Family Income by Number of Earners in Taft
The median family income in Taft is $68,446, with families comprising 3+ earners (84) having the highest median family income of $95,952, while families with no earners (142) have the lowest median family income of $23,393, accounting for 12.7% and 21.4% of families, respectively.
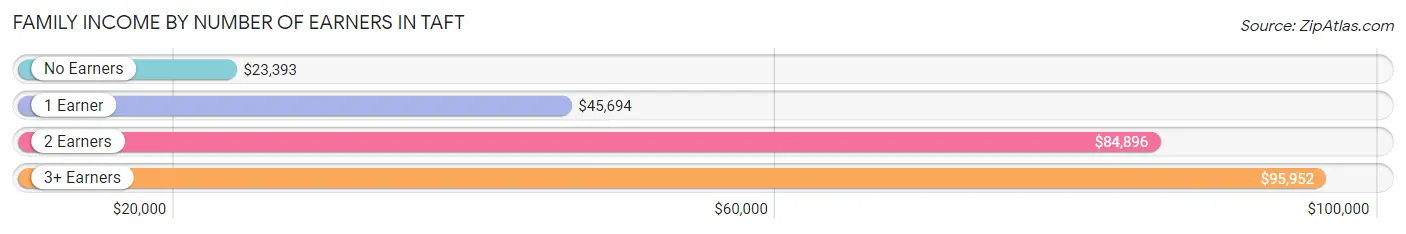
| Number of Earners | # Families | Median Income |
| No Earners | 142 (21.4%) | $23,393 |
| 1 Earner | 191 (28.8%) | $45,694 |
| 2 Earners | 247 (37.2%) | $84,896 |
| 3+ Earners | 84 (12.7%) | $95,952 |
| Total | 664 (100.0%) | $68,446 |
Household Income in Taft
Household Income Brackets in Taft
With 187 households falling in the category, the $50,000 to $74,999 income range is the most frequent in Taft, accounting for 21.8% of all households. In contrast, only 15 households (1.8%) fall into the $200,000+ income bracket, making it the least populous group.
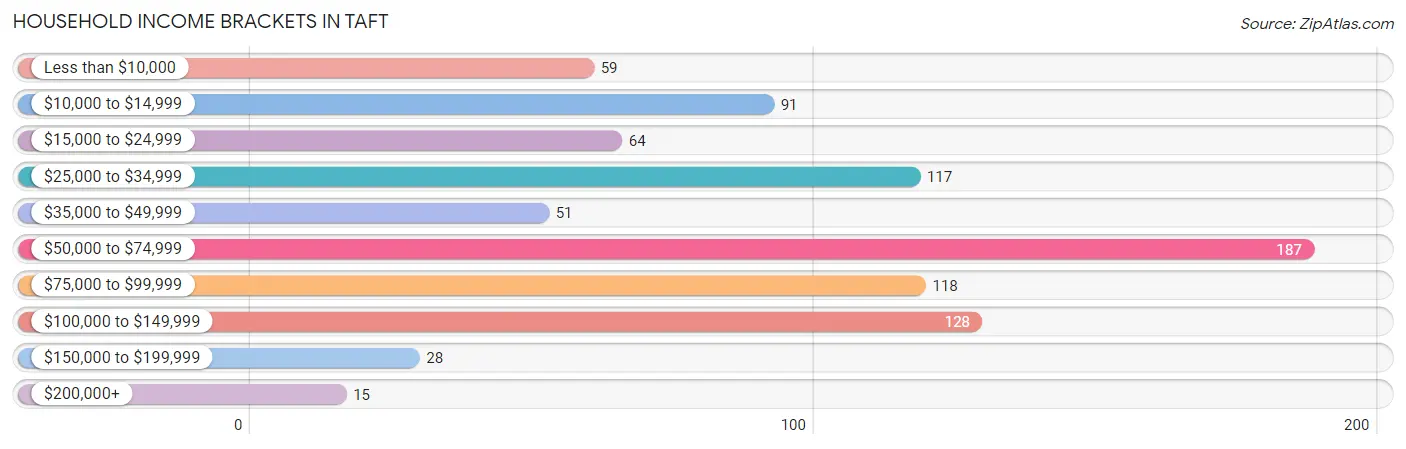
| Income Bracket | # Households | % Households |
| Less than $10,000 | 59 | 6.9% |
| $10,000 to $14,999 | 91 | 10.6% |
| $15,000 to $24,999 | 64 | 7.5% |
| $25,000 to $34,999 | 117 | 13.6% |
| $35,000 to $49,999 | 51 | 5.9% |
| $50,000 to $74,999 | 187 | 21.8% |
| $75,000 to $99,999 | 118 | 13.8% |
| $100,000 to $149,999 | 128 | 14.9% |
| $150,000 to $199,999 | 28 | 3.3% |
| $200,000+ | 15 | 1.7% |
Household Income by Householder Age in Taft
The median household income in Taft is $54,286, with the highest median household income of $73,803 found in the 45 to 64 years age bracket for the primary householder. A total of 371 households (43.2%) fall into this category. Meanwhile, the 15 to 24 years age bracket for the primary householder has the lowest median household income of $0, with 9 households (1.1%) in this group.
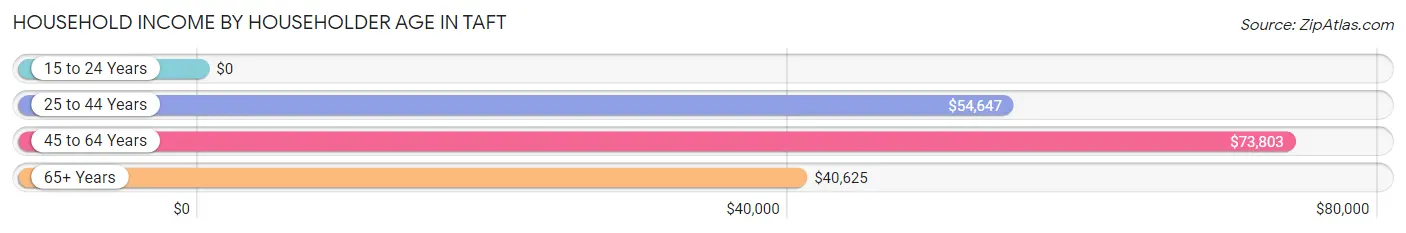
| Income Bracket | # Households | Median Income |
| 15 to 24 Years | 9 (1.1%) | $0 |
| 25 to 44 Years | 231 (26.9%) | $54,647 |
| 45 to 64 Years | 371 (43.2%) | $73,803 |
| 65+ Years | 247 (28.8%) | $40,625 |
| Total | 858 (100.0%) | $54,286 |
Poverty in Taft
Income Below Poverty by Sex and Age in Taft
With 23.0% poverty level for males and 30.7% for females among the residents of Taft, 12 to 14 year old males and under 5 year old females are the most vulnerable to poverty, with 100 males (73.5%) and 67 females (67.0%) in their respective age groups living below the poverty level.
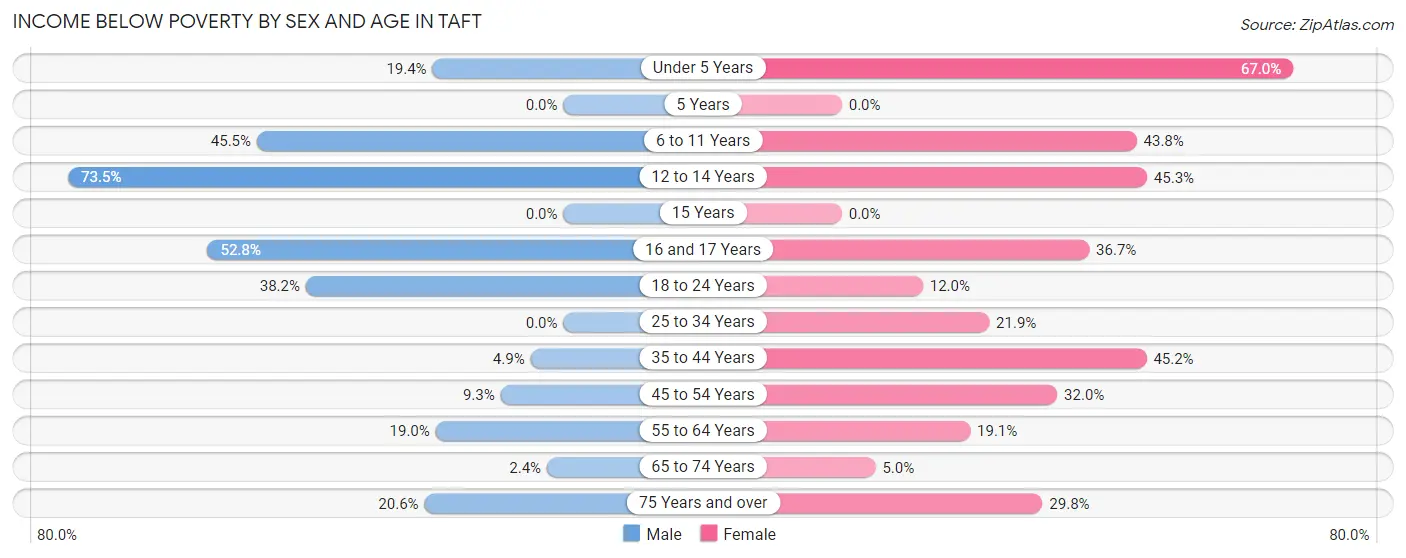
| Age Bracket | Male | Female |
| Under 5 Years | 7 (19.4%) | 67 (67.0%) |
| 5 Years | 0 (0.0%) | 0 (0.0%) |
| 6 to 11 Years | 71 (45.5%) | 81 (43.8%) |
| 12 to 14 Years | 100 (73.5%) | 29 (45.3%) |
| 15 Years | 0 (0.0%) | 0 (0.0%) |
| 16 and 17 Years | 56 (52.8%) | 18 (36.7%) |
| 18 to 24 Years | 13 (38.2%) | 16 (12.0%) |
| 25 to 34 Years | 0 (0.0%) | 28 (21.9%) |
| 35 to 44 Years | 8 (4.9%) | 76 (45.2%) |
| 45 to 54 Years | 7 (9.3%) | 63 (32.0%) |
| 55 to 64 Years | 33 (19.0%) | 36 (19.1%) |
| 65 to 74 Years | 3 (2.4%) | 6 (5.0%) |
| 75 Years and over | 13 (20.6%) | 28 (29.8%) |
| Total | 311 (23.0%) | 448 (30.7%) |
Income Above Poverty by Sex and Age in Taft
According to the poverty statistics in Taft, males aged 5 years and females aged 5 years are the age groups that are most secure financially, with 100.0% of males and 100.0% of females in these age groups living above the poverty line.
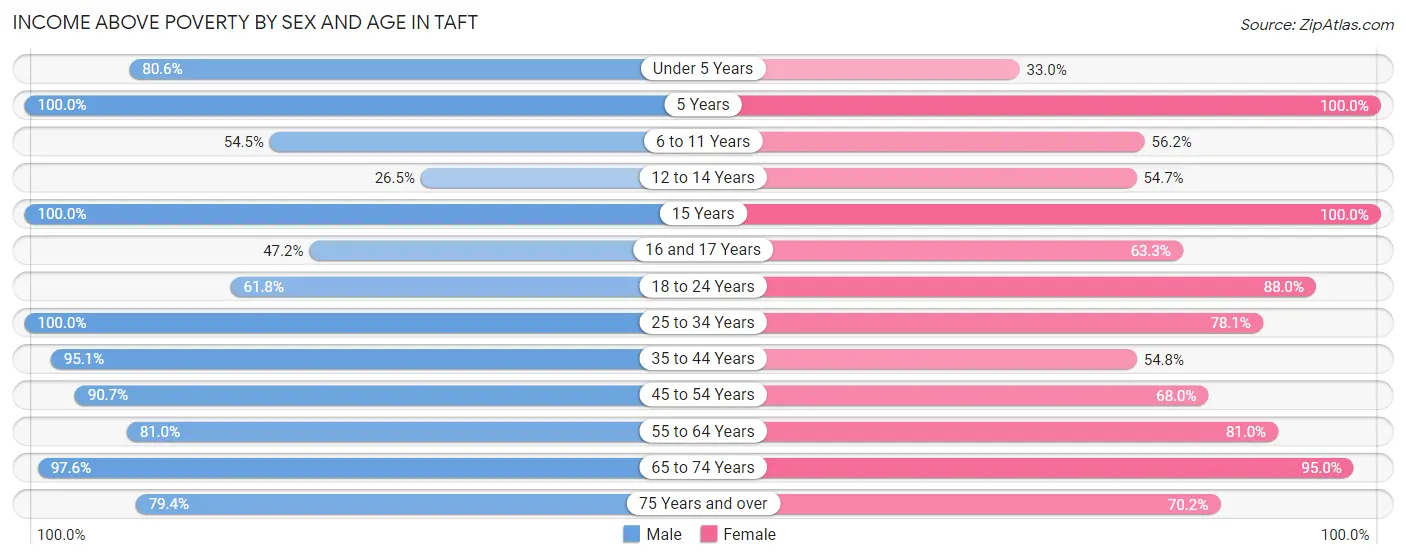
| Age Bracket | Male | Female |
| Under 5 Years | 29 (80.6%) | 33 (33.0%) |
| 5 Years | 29 (100.0%) | 23 (100.0%) |
| 6 to 11 Years | 85 (54.5%) | 104 (56.2%) |
| 12 to 14 Years | 36 (26.5%) | 35 (54.7%) |
| 15 Years | 15 (100.0%) | 9 (100.0%) |
| 16 and 17 Years | 50 (47.2%) | 31 (63.3%) |
| 18 to 24 Years | 21 (61.8%) | 117 (88.0%) |
| 25 to 34 Years | 239 (100.0%) | 100 (78.1%) |
| 35 to 44 Years | 156 (95.1%) | 92 (54.8%) |
| 45 to 54 Years | 68 (90.7%) | 134 (68.0%) |
| 55 to 64 Years | 141 (81.0%) | 153 (80.9%) |
| 65 to 74 Years | 120 (97.6%) | 114 (95.0%) |
| 75 Years and over | 50 (79.4%) | 66 (70.2%) |
| Total | 1,039 (77.0%) | 1,011 (69.3%) |
Income Below Poverty Among Married-Couple Families in Taft
The poverty statistics for married-couple families in Taft show that 7.9% or 32 of the total 406 families live below the poverty line. Families with 5 or more children have the highest poverty rate of 40.0%, comprising of 8 families. On the other hand, families with 3 or 4 children have the lowest poverty rate of 0.0%, which includes 0 families.
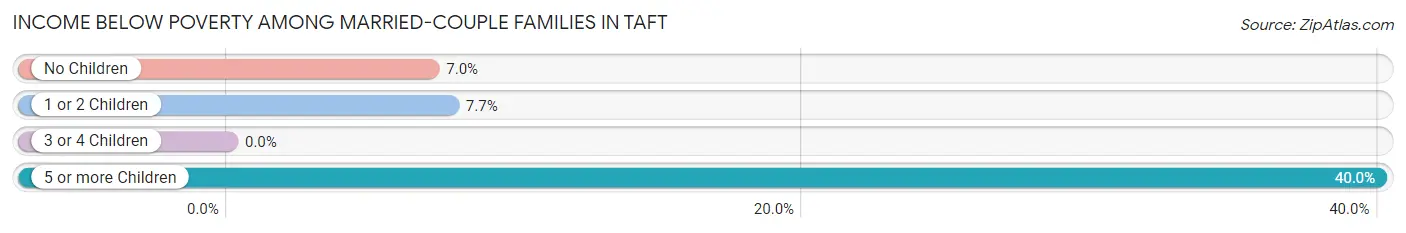
| Children | Above Poverty | Below Poverty |
| No Children | 199 (93.0%) | 15 (7.0%) |
| 1 or 2 Children | 108 (92.3%) | 9 (7.7%) |
| 3 or 4 Children | 55 (100.0%) | 0 (0.0%) |
| 5 or more Children | 12 (60.0%) | 8 (40.0%) |
| Total | 374 (92.1%) | 32 (7.9%) |
Income Below Poverty Among Single-Parent Households in Taft
According to the poverty data in Taft, 32.8% or 21 single-father households and 64.9% or 126 single-mother households are living below the poverty line. Among single-father households, those with 1 or 2 children have the highest poverty rate, with 18 households (42.9%) experiencing poverty. Likewise, among single-mother households, those with 5 or more children have the highest poverty rate, with 20 households (100.0%) falling below the poverty line.
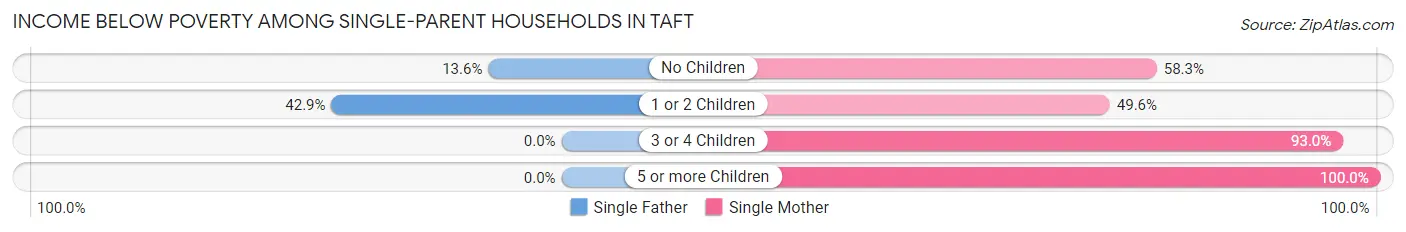
| Children | Single Father | Single Mother |
| No Children | 3 (13.6%) | 7 (58.3%) |
| 1 or 2 Children | 18 (42.9%) | 59 (49.6%) |
| 3 or 4 Children | 0 (0.0%) | 40 (93.0%) |
| 5 or more Children | 0 (0.0%) | 20 (100.0%) |
| Total | 21 (32.8%) | 126 (64.9%) |
Income Below Poverty Among Married-Couple vs Single-Parent Households in Taft
The poverty data for Taft shows that 32 of the married-couple family households (7.9%) and 147 of the single-parent households (57.0%) are living below the poverty level. Within the married-couple family households, those with 5 or more children have the highest poverty rate, with 8 households (40.0%) falling below the poverty line. Among the single-parent households, those with 5 or more children have the highest poverty rate, with 20 household (100.0%) living below poverty.
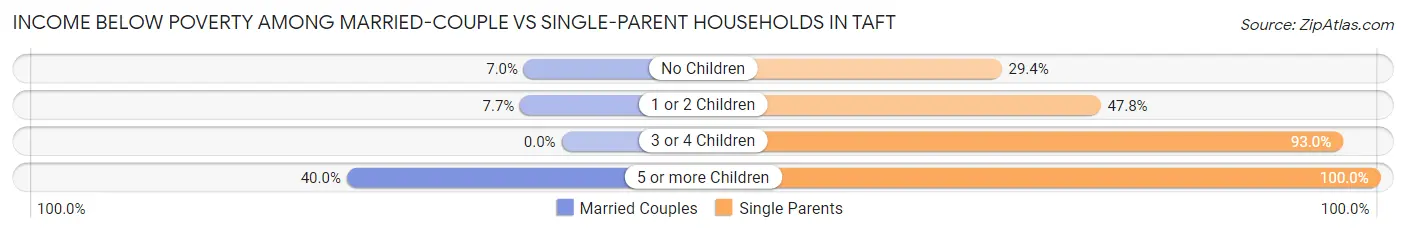
| Children | Married-Couple Families | Single-Parent Households |
| No Children | 15 (7.0%) | 10 (29.4%) |
| 1 or 2 Children | 9 (7.7%) | 77 (47.8%) |
| 3 or 4 Children | 0 (0.0%) | 40 (93.0%) |
| 5 or more Children | 8 (40.0%) | 20 (100.0%) |
| Total | 32 (7.9%) | 147 (57.0%) |
Race in Taft
The most populous races in Taft are Hispanic or Latino (2,290 | 80.7%), White / Caucasian (1,706 | 60.1%), and Two or more Races (848 | 29.9%).
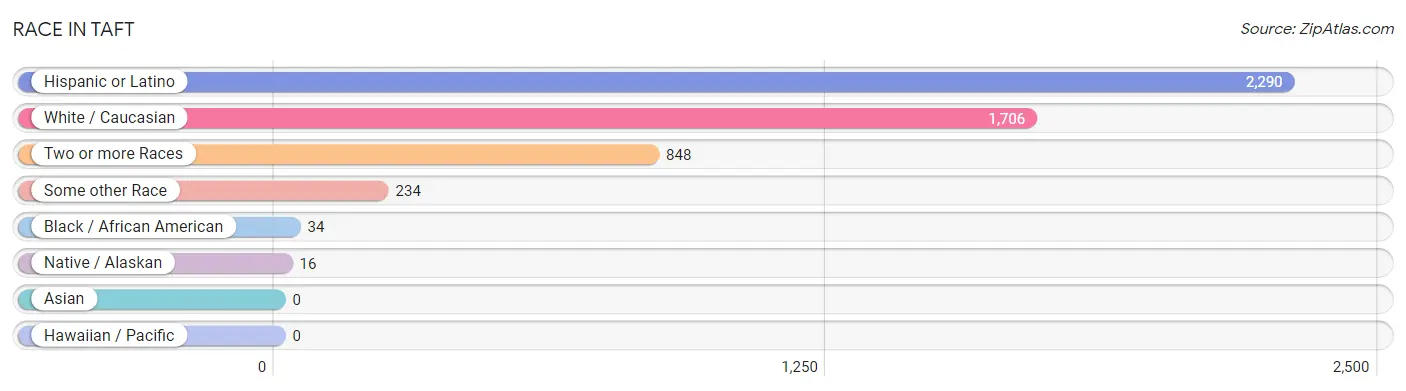
| Race | # Population | % Population |
| Asian | 0 | 0.0% |
| Black / African American | 34 | 1.2% |
| Hawaiian / Pacific | 0 | 0.0% |
| Hispanic or Latino | 2,290 | 80.7% |
| Native / Alaskan | 16 | 0.6% |
| White / Caucasian | 1,706 | 60.1% |
| Two or more Races | 848 | 29.9% |
| Some other Race | 234 | 8.3% |
| Total | 2,838 | 100.0% |
Ancestry in Taft
The most populous ancestries reported in Taft are Mexican (2,156 | 76.0%), German (273 | 9.6%), English (63 | 2.2%), Irish (57 | 2.0%), and Swedish (23 | 0.8%), together accounting for 90.6% of all Taft residents.
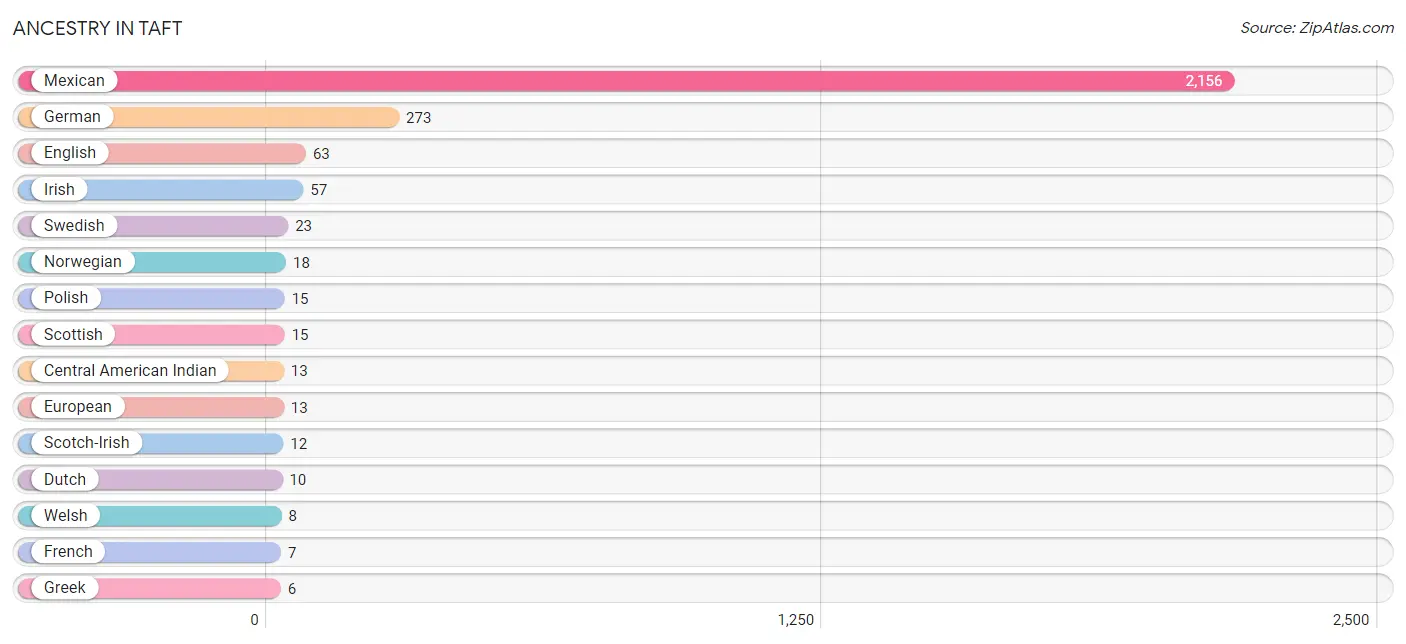
| Ancestry | # Population | % Population |
| Central American Indian | 13 | 0.5% |
| Dutch | 10 | 0.4% |
| English | 63 | 2.2% |
| European | 13 | 0.5% |
| French | 7 | 0.3% |
| German | 273 | 9.6% |
| Greek | 6 | 0.2% |
| Irish | 57 | 2.0% |
| Mexican | 2,156 | 76.0% |
| Norwegian | 18 | 0.6% |
| Polish | 15 | 0.5% |
| Scotch-Irish | 12 | 0.4% |
| Scottish | 15 | 0.5% |
| Swedish | 23 | 0.8% |
| Welsh | 8 | 0.3% | View All 15 Rows |
Immigrants in Taft
The most numerous immigrant groups reported in Taft came from Latin America (63 | 2.2%), Caribbean (34 | 1.2%), Cuba (34 | 1.2%), Central America (29 | 1.0%), and Mexico (29 | 1.0%), together accounting for 6.7% of all Taft residents.
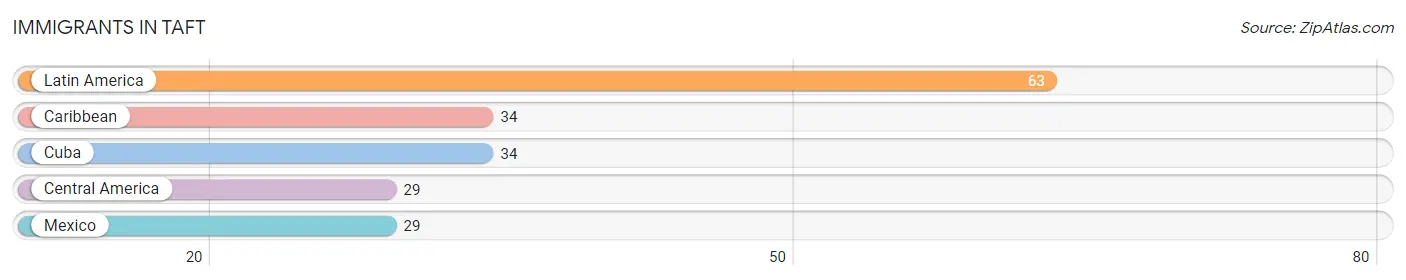
| Immigration Origin | # Population | % Population |
| Caribbean | 34 | 1.2% |
| Central America | 29 | 1.0% |
| Cuba | 34 | 1.2% |
| Latin America | 63 | 2.2% |
| Mexico | 29 | 1.0% | View All 5 Rows |
Sex and Age in Taft
Sex and Age in Taft
The most populous age groups in Taft are 10 to 14 Years (198 | 14.4%) for men and 5 to 9 Years (163 | 11.2%) for women.
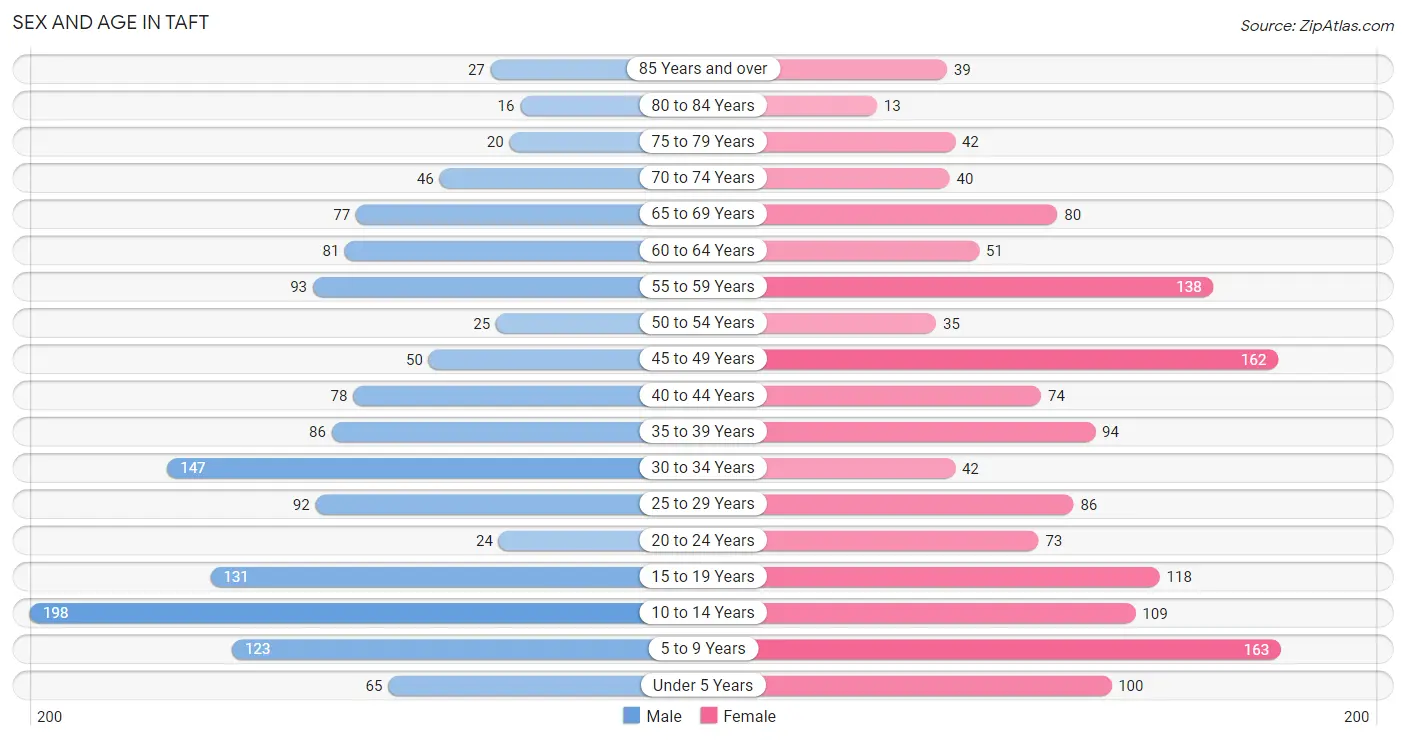
| Age Bracket | Male | Female |
| Under 5 Years | 65 (4.7%) | 100 (6.9%) |
| 5 to 9 Years | 123 (8.9%) | 163 (11.2%) |
| 10 to 14 Years | 198 (14.4%) | 109 (7.5%) |
| 15 to 19 Years | 131 (9.5%) | 118 (8.1%) |
| 20 to 24 Years | 24 (1.7%) | 73 (5.0%) |
| 25 to 29 Years | 92 (6.7%) | 86 (5.9%) |
| 30 to 34 Years | 147 (10.7%) | 42 (2.9%) |
| 35 to 39 Years | 86 (6.2%) | 94 (6.4%) |
| 40 to 44 Years | 78 (5.7%) | 74 (5.1%) |
| 45 to 49 Years | 50 (3.6%) | 162 (11.1%) |
| 50 to 54 Years | 25 (1.8%) | 35 (2.4%) |
| 55 to 59 Years | 93 (6.7%) | 138 (9.5%) |
| 60 to 64 Years | 81 (5.9%) | 51 (3.5%) |
| 65 to 69 Years | 77 (5.6%) | 80 (5.5%) |
| 70 to 74 Years | 46 (3.3%) | 40 (2.7%) |
| 75 to 79 Years | 20 (1.5%) | 42 (2.9%) |
| 80 to 84 Years | 16 (1.2%) | 13 (0.9%) |
| 85 Years and over | 27 (2.0%) | 39 (2.7%) |
| Total | 1,379 (100.0%) | 1,459 (100.0%) |
Families and Households in Taft
Median Family Size in Taft
The median family size in Taft is 3.80 persons per family, with married-couple families (406 | 61.1%) accounting for the largest median family size of 3.95 persons per family. On the other hand, single male/father families (64 | 9.6%) represent the smallest median family size with 2.56 persons per family.
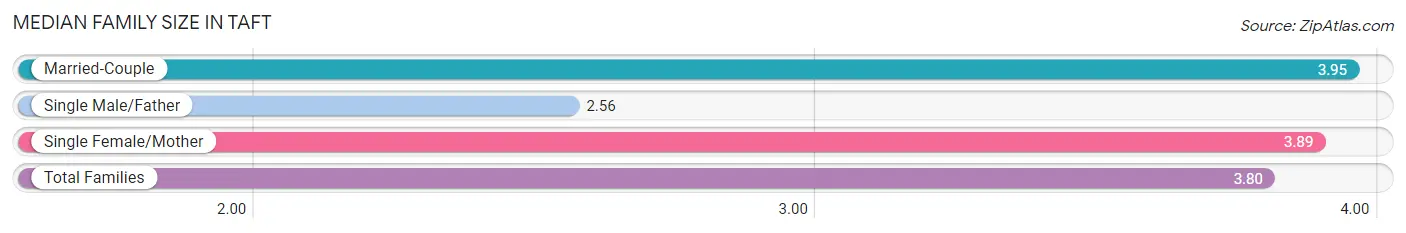
| Family Type | # Families | Family Size |
| Married-Couple | 406 (61.1%) | 3.95 |
| Single Male/Father | 64 (9.6%) | 2.56 |
| Single Female/Mother | 194 (29.2%) | 3.89 |
| Total Families | 664 (100.0%) | 3.80 |
Median Household Size in Taft
The median household size in Taft is 3.31 persons per household, with single female/mother households (194 | 22.6%) accounting for the largest median household size of 4.06 persons per household. non-family households (194 | 22.6%) represent the smallest median household size with 1.26 persons per household.
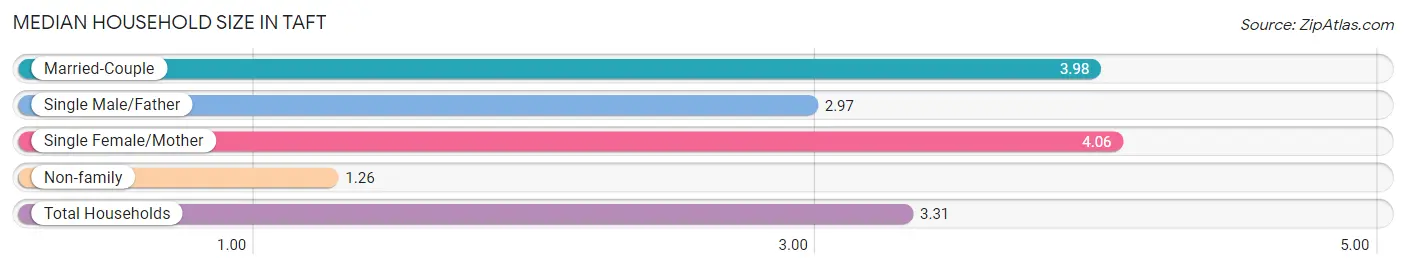
| Household Type | # Households | Household Size |
| Married-Couple | 406 (47.3%) | 3.98 |
| Single Male/Father | 64 (7.5%) | 2.97 |
| Single Female/Mother | 194 (22.6%) | 4.06 |
| Non-family | 194 (22.6%) | 1.26 |
| Total Households | 858 (100.0%) | 3.31 |
Household Size by Marriage Status in Taft
Out of a total of 858 households in Taft, 664 (77.4%) are family households, while 194 (22.6%) are nonfamily households. The most numerous type of family households are 4-person households, comprising 171, and the most common type of nonfamily households are 1-person households, comprising 168.
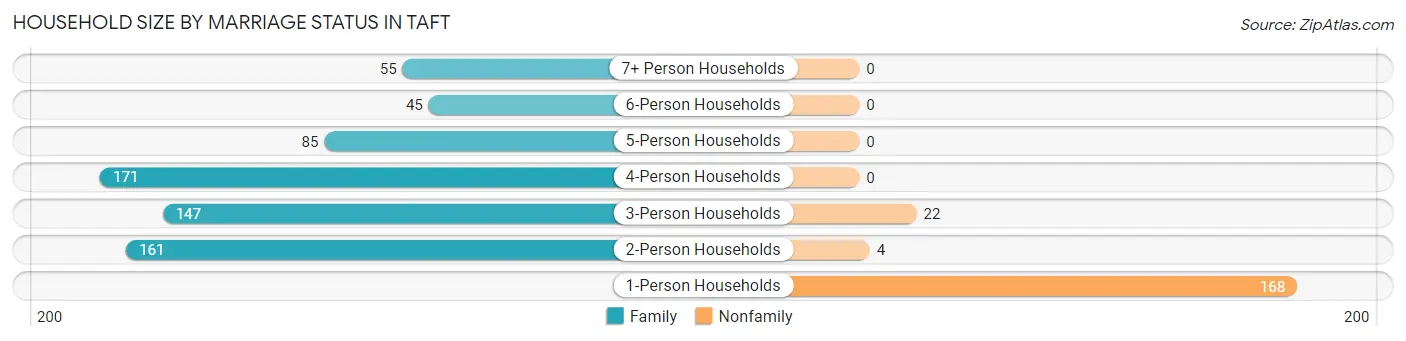
| Household Size | Family Households | Nonfamily Households |
| 1-Person Households | - | 168 (19.6%) |
| 2-Person Households | 161 (18.8%) | 4 (0.5%) |
| 3-Person Households | 147 (17.1%) | 22 (2.6%) |
| 4-Person Households | 171 (19.9%) | 0 (0.0%) |
| 5-Person Households | 85 (9.9%) | 0 (0.0%) |
| 6-Person Households | 45 (5.2%) | 0 (0.0%) |
| 7+ Person Households | 55 (6.4%) | 0 (0.0%) |
| Total | 664 (77.4%) | 194 (22.6%) |
Female Fertility in Taft
Fertility by Age in Taft
Average fertility rate in Taft is 31.0 births per 1,000 women. Women in the age bracket of 20 to 34 years have the highest fertility rate with 100.0 births per 1,000 women. Women in the age bracket of 20 to 34 years acount for 100.0% of all women with births.
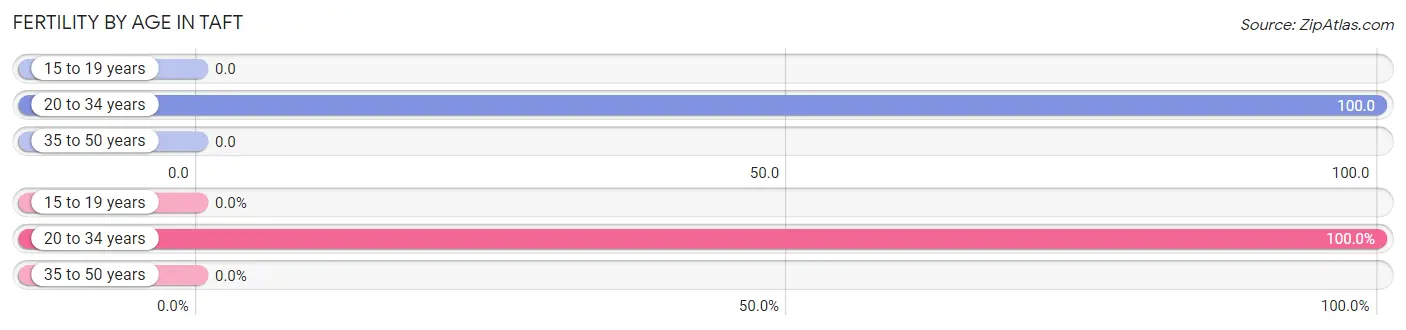
| Age Bracket | Women with Births | Births / 1,000 Women |
| 15 to 19 years | 0 (0.0%) | 0.0 |
| 20 to 34 years | 20 (100.0%) | 100.0 |
| 35 to 50 years | 0 (0.0%) | 0.0 |
| Total | 20 (100.0%) | 31.0 |
Fertility by Age by Marriage Status in Taft
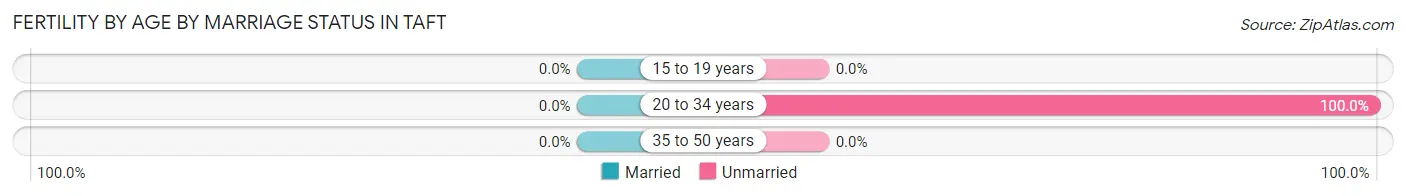
| Age Bracket | Married | Unmarried |
| 15 to 19 years | 0 (0.0%) | 0 (0.0%) |
| 20 to 34 years | 0 (0.0%) | 20 (100.0%) |
| 35 to 50 years | 0 (0.0%) | 0 (0.0%) |
| Total | 0 (0.0%) | 20 (100.0%) |
Fertility by Education in Taft
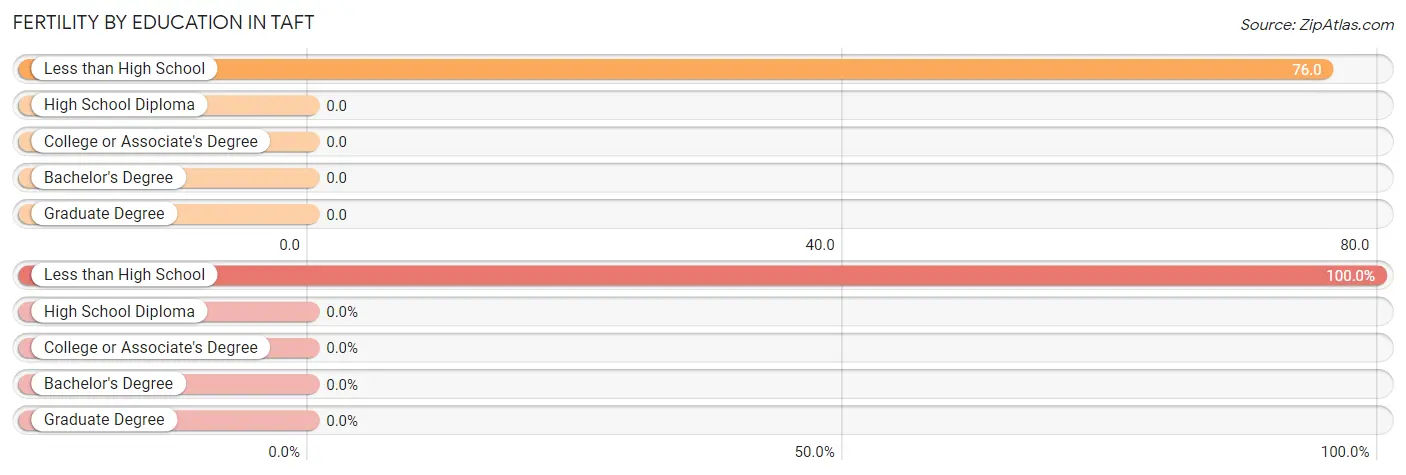
| Educational Attainment | Women with Births | Births / 1,000 Women |
| Less than High School | 20 (100.0%) | 76.0 |
| High School Diploma | 0 (0.0%) | 0.0 |
| College or Associate's Degree | 0 (0.0%) | 0.0 |
| Bachelor's Degree | 0 (0.0%) | 0.0 |
| Graduate Degree | 0 (0.0%) | 0.0 |
| Total | 20 (100.0%) | 31.0 |
Fertility by Education by Marriage Status in Taft
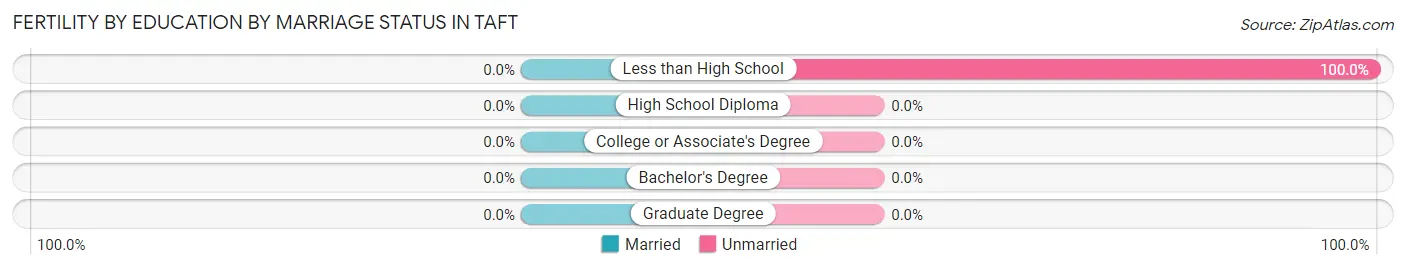
| Educational Attainment | Married | Unmarried |
| Less than High School | 0 (0.0%) | 20 (100.0%) |
| High School Diploma | 0 (0.0%) | 0 (0.0%) |
| College or Associate's Degree | 0 (0.0%) | 0 (0.0%) |
| Bachelor's Degree | 0 (0.0%) | 0 (0.0%) |
| Graduate Degree | 0 (0.0%) | 0 (0.0%) |
| Total | 0 (0.0%) | 20 (100.0%) |
Employment Characteristics in Taft
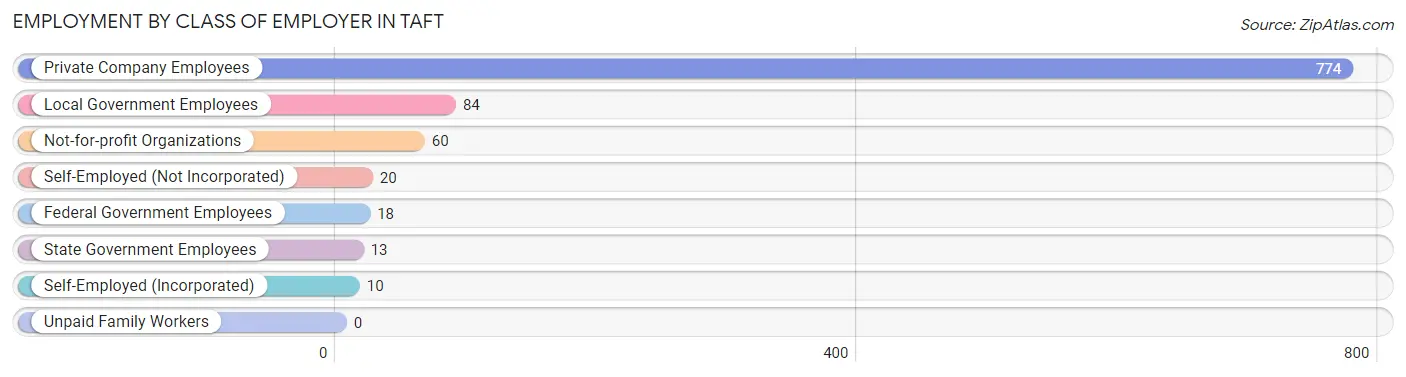
Employment by Class of Employer in Taft
Among the 979 employed individuals in Taft, private company employees (774 | 79.1%), local government employees (84 | 8.6%), and not-for-profit organizations (60 | 6.1%) make up the most common classes of employment.
| Employer Class | # Employees | % Employees |
| Private Company Employees | 774 | 79.1% |
| Self-Employed (Incorporated) | 10 | 1.0% |
| Self-Employed (Not Incorporated) | 20 | 2.0% |
| Not-for-profit Organizations | 60 | 6.1% |
| Local Government Employees | 84 | 8.6% |
| State Government Employees | 13 | 1.3% |
| Federal Government Employees | 18 | 1.8% |
| Unpaid Family Workers | 0 | 0.0% |
| Total | 979 | 100.0% |
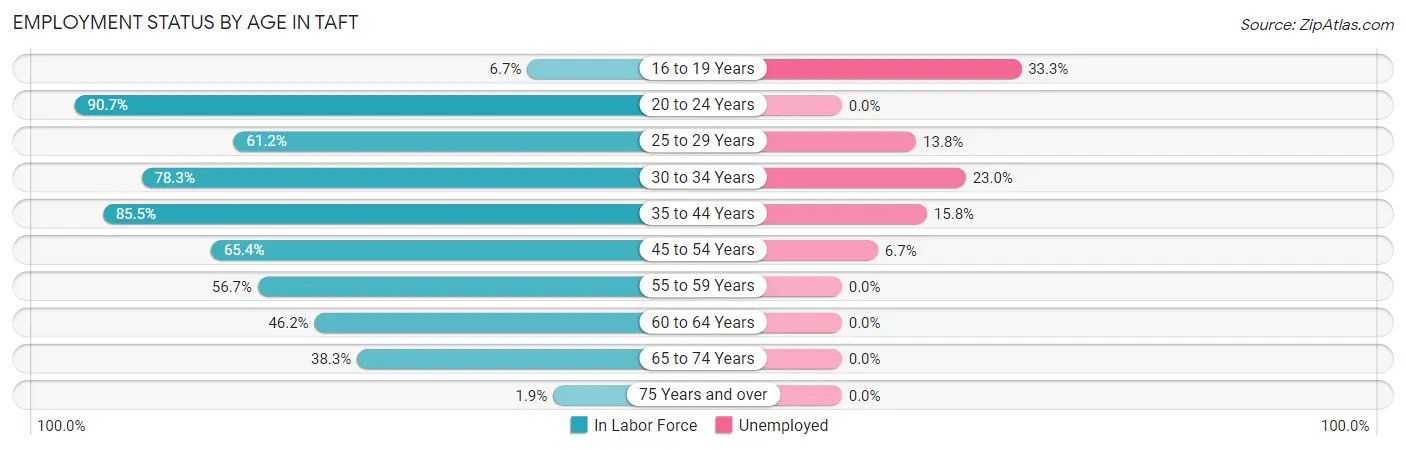
Employment Status by Age in Taft
According to the labor force statistics for Taft, out of the total population over 16 years of age (2,056), 54.0% or 1,110 individuals are in the labor force, with 10.0% or 111 of them unemployed. The age group with the highest labor force participation rate is 20 to 24 years, with 90.7% or 88 individuals in the labor force. Within the labor force, the 16 to 19 years age range has the highest percentage of unemployed individuals, with 33.3% or 5 of them being unemployed.
| Age Bracket | In Labor Force | Unemployed |
| 16 to 19 Years | 15 (6.7%) | 5 (33.3%) |
| 20 to 24 Years | 88 (90.7%) | 0 (0.0%) |
| 25 to 29 Years | 109 (61.2%) | 15 (13.8%) |
| 30 to 34 Years | 148 (78.3%) | 34 (23.0%) |
| 35 to 44 Years | 284 (85.5%) | 45 (15.8%) |
| 45 to 54 Years | 178 (65.4%) | 12 (6.7%) |
| 55 to 59 Years | 131 (56.7%) | 0 (0.0%) |
| 60 to 64 Years | 61 (46.2%) | 0 (0.0%) |
| 65 to 74 Years | 93 (38.3%) | 0 (0.0%) |
| 75 Years and over | 3 (1.9%) | 0 (0.0%) |
| Total | 1,110 (54.0%) | 111 (10.0%) |
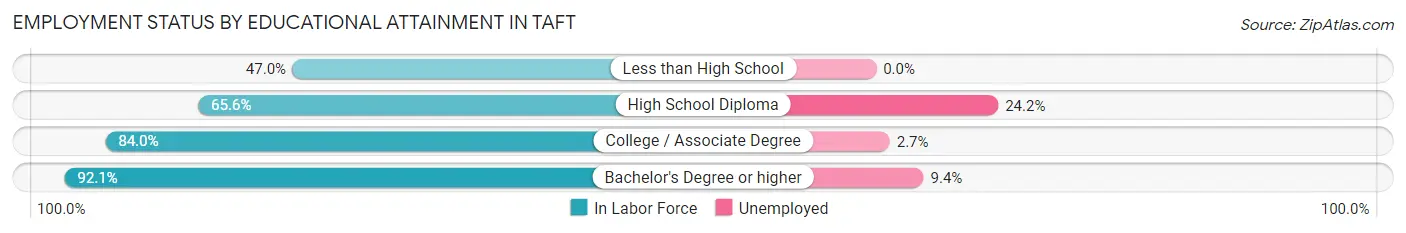
Employment Status by Educational Attainment in Taft
According to labor force statistics for Taft, 68.3% of individuals (911) out of the total population between 25 and 64 years of age (1,334) are in the labor force, with 11.6% or 106 of them being unemployed. The group with the highest labor force participation rate are those with the educational attainment of bachelor's degree or higher, with 92.1% or 139 individuals in the labor force. Within the labor force, individuals with high school diploma education have the highest percentage of unemployment, with 24.2% or 86 of them being unemployed.
| Educational Attainment | In Labor Force | Unemployed |
| Less than High School | 155 (47.0%) | 0 (0.0%) |
| High School Diploma | 355 (65.6%) | 131 (24.2%) |
| College / Associate Degree | 262 (84.0%) | 8 (2.7%) |
| Bachelor's Degree or higher | 139 (92.1%) | 14 (9.4%) |
| Total | 911 (68.3%) | 155 (11.6%) |
Employment Occupations by Sex in Taft
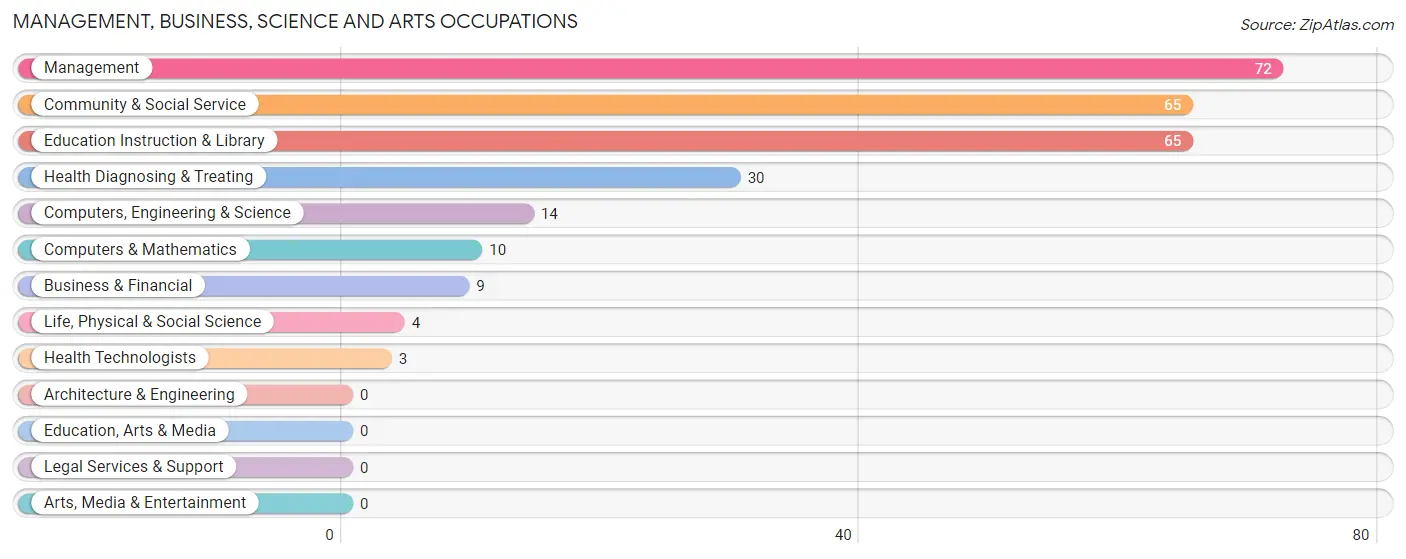
Management, Business, Science and Arts Occupations
The most common Management, Business, Science and Arts occupations in Taft are Management (72 | 7.2%), Community & Social Service (65 | 6.5%), Education Instruction & Library (65 | 6.5%), Health Diagnosing & Treating (30 | 3.0%), and Computers, Engineering & Science (14 | 1.4%).
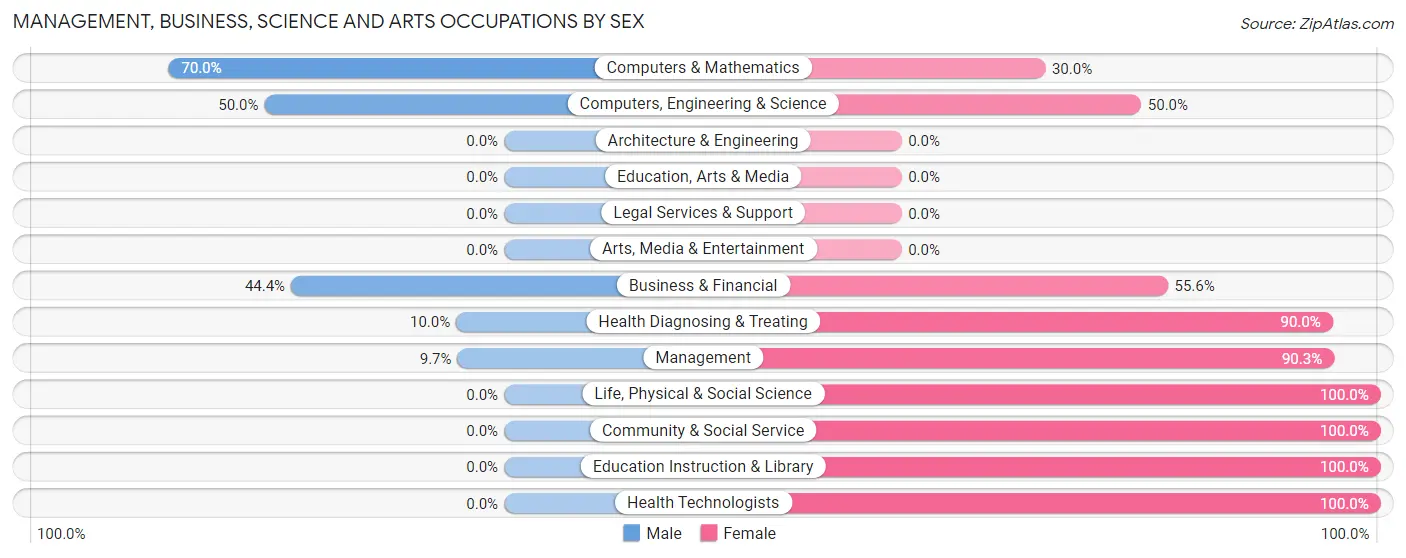
Management, Business, Science and Arts Occupations by Sex
Within the Management, Business, Science and Arts occupations in Taft, the most male-oriented occupations are Computers & Mathematics (70.0%), Computers, Engineering & Science (50.0%), and Business & Financial (44.4%), while the most female-oriented occupations are Life, Physical & Social Science (100.0%), Community & Social Service (100.0%), and Education Instruction & Library (100.0%).
| Occupation | Male | Female |
| Management | 7 (9.7%) | 65 (90.3%) |
| Business & Financial | 4 (44.4%) | 5 (55.6%) |
| Computers, Engineering & Science | 7 (50.0%) | 7 (50.0%) |
| Computers & Mathematics | 7 (70.0%) | 3 (30.0%) |
| Architecture & Engineering | 0 (0.0%) | 0 (0.0%) |
| Life, Physical & Social Science | 0 (0.0%) | 4 (100.0%) |
| Community & Social Service | 0 (0.0%) | 65 (100.0%) |
| Education, Arts & Media | 0 (0.0%) | 0 (0.0%) |
| Legal Services & Support | 0 (0.0%) | 0 (0.0%) |
| Education Instruction & Library | 0 (0.0%) | 65 (100.0%) |
| Arts, Media & Entertainment | 0 (0.0%) | 0 (0.0%) |
| Health Diagnosing & Treating | 3 (10.0%) | 27 (90.0%) |
| Health Technologists | 0 (0.0%) | 3 (100.0%) |
| Total (Category) | 21 (11.1%) | 169 (88.9%) |
| Total (Overall) | 521 (52.1%) | 478 (47.8%) |
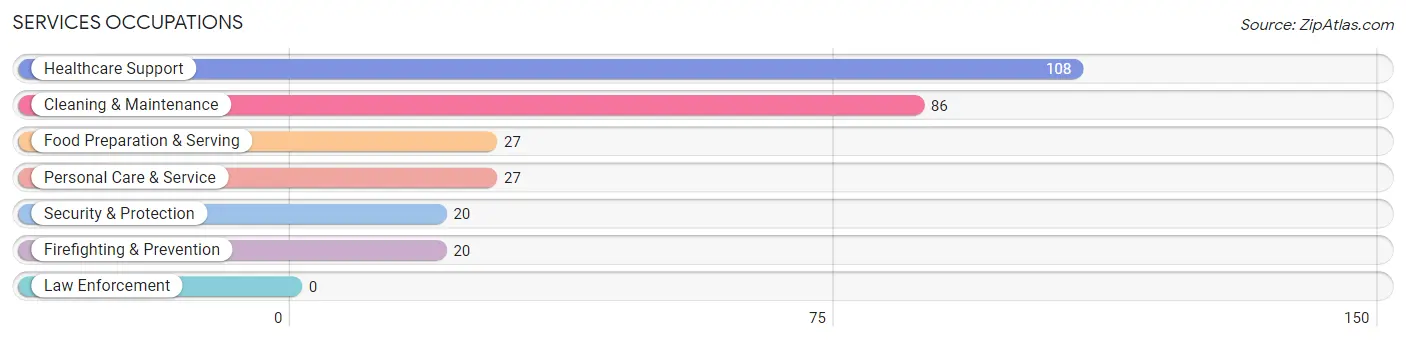
Services Occupations
The most common Services occupations in Taft are Healthcare Support (108 | 10.8%), Cleaning & Maintenance (86 | 8.6%), Food Preparation & Serving (27 | 2.7%), Personal Care & Service (27 | 2.7%), and Security & Protection (20 | 2.0%).
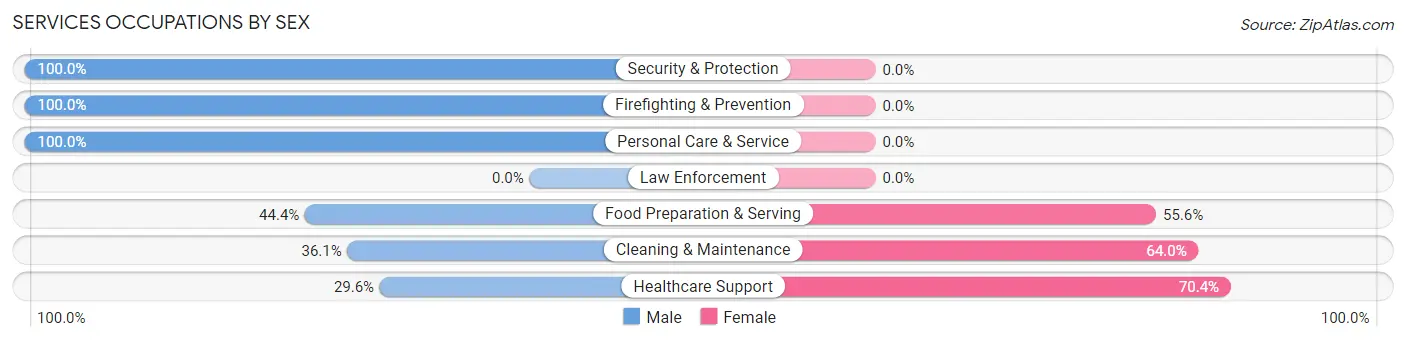
Services Occupations by Sex
Within the Services occupations in Taft, the most male-oriented occupations are Security & Protection (100.0%), Firefighting & Prevention (100.0%), and Personal Care & Service (100.0%), while the most female-oriented occupations are Healthcare Support (70.4%), Cleaning & Maintenance (63.9%), and Food Preparation & Serving (55.6%).
| Occupation | Male | Female |
| Healthcare Support | 32 (29.6%) | 76 (70.4%) |
| Security & Protection | 20 (100.0%) | 0 (0.0%) |
| Firefighting & Prevention | 20 (100.0%) | 0 (0.0%) |
| Law Enforcement | 0 (0.0%) | 0 (0.0%) |
| Food Preparation & Serving | 12 (44.4%) | 15 (55.6%) |
| Cleaning & Maintenance | 31 (36.0%) | 55 (63.9%) |
| Personal Care & Service | 27 (100.0%) | 0 (0.0%) |
| Total (Category) | 122 (45.5%) | 146 (54.5%) |
| Total (Overall) | 521 (52.1%) | 478 (47.8%) |
Sales and Office Occupations
The most common Sales and Office occupations in Taft are Sales & Related (111 | 11.1%), and Office & Administration (55 | 5.5%).
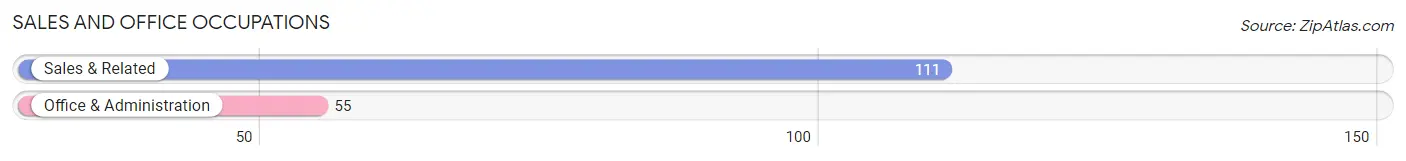
Sales and Office Occupations by Sex

| Occupation | Male | Female |
| Sales & Related | 20 (18.0%) | 91 (82.0%) |
| Office & Administration | 0 (0.0%) | 55 (100.0%) |
| Total (Category) | 20 (12.0%) | 146 (87.9%) |
| Total (Overall) | 521 (52.1%) | 478 (47.8%) |
Natural Resources, Construction and Maintenance Occupations
The most common Natural Resources, Construction and Maintenance occupations in Taft are Construction & Extraction (152 | 15.2%), and Installation, Maintenance & Repair (35 | 3.5%).
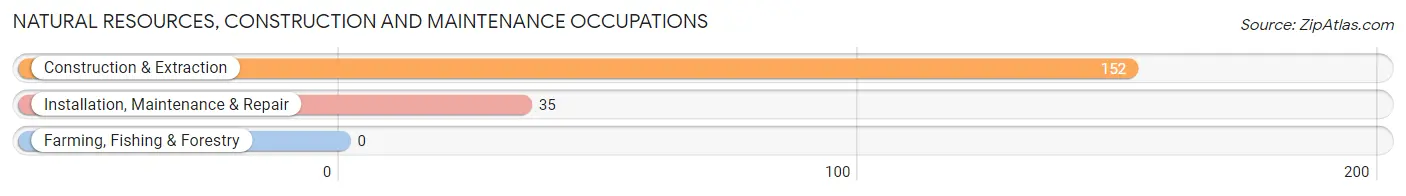
Natural Resources, Construction and Maintenance Occupations by Sex

| Occupation | Male | Female |
| Farming, Fishing & Forestry | 0 (0.0%) | 0 (0.0%) |
| Construction & Extraction | 152 (100.0%) | 0 (0.0%) |
| Installation, Maintenance & Repair | 35 (100.0%) | 0 (0.0%) |
| Total (Category) | 187 (100.0%) | 0 (0.0%) |
| Total (Overall) | 521 (52.1%) | 478 (47.8%) |
Production, Transportation and Moving Occupations
The most common Production, Transportation and Moving occupations in Taft are Material Moving (104 | 10.4%), Production (62 | 6.2%), and Transportation (22 | 2.2%).
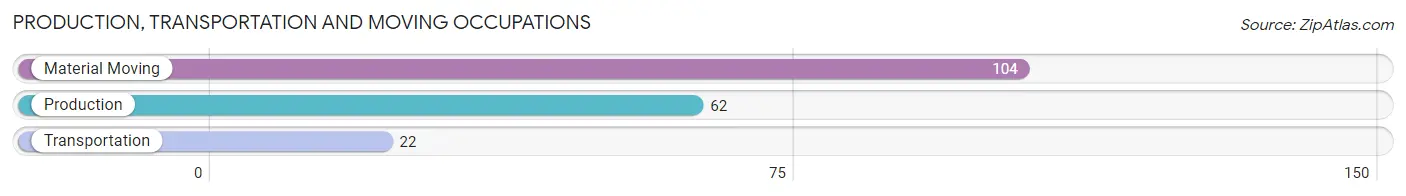
Production, Transportation and Moving Occupations by Sex
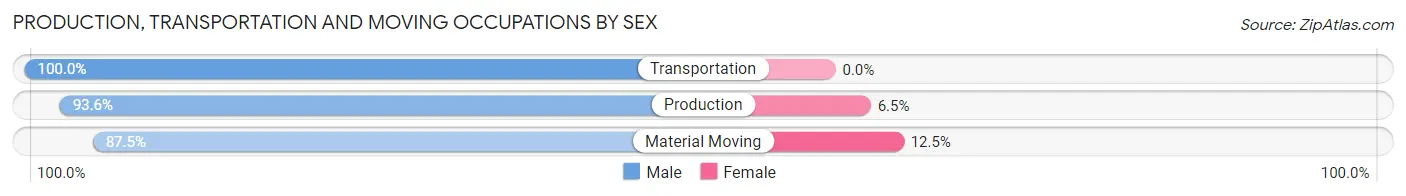
| Occupation | Male | Female |
| Production | 58 (93.5%) | 4 (6.5%) |
| Transportation | 22 (100.0%) | 0 (0.0%) |
| Material Moving | 91 (87.5%) | 13 (12.5%) |
| Total (Category) | 171 (91.0%) | 17 (9.0%) |
| Total (Overall) | 521 (52.1%) | 478 (47.8%) |
Employment Industries by Sex in Taft
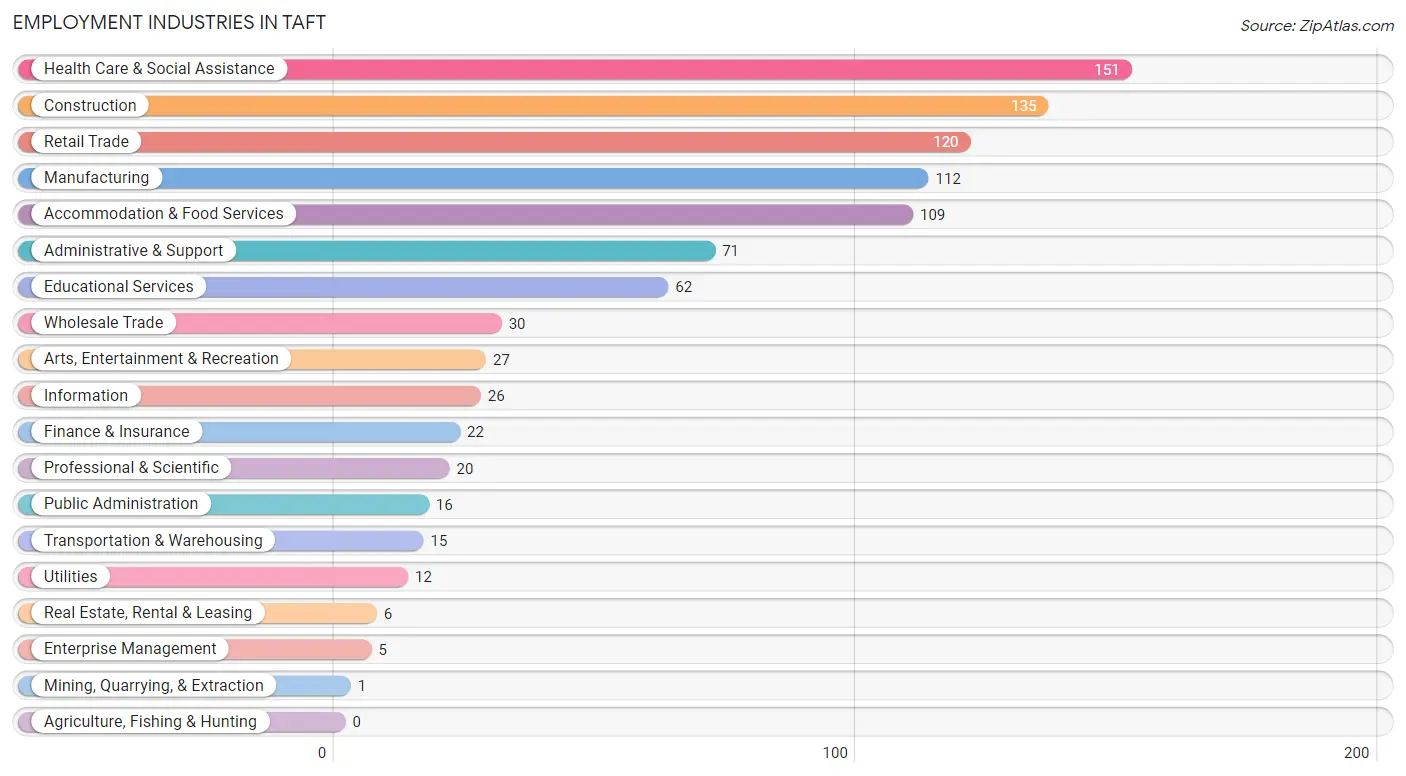
Employment Industries in Taft
The major employment industries in Taft include Health Care & Social Assistance (151 | 15.1%), Construction (135 | 13.5%), Retail Trade (120 | 12.0%), Manufacturing (112 | 11.2%), and Accommodation & Food Services (109 | 10.9%).
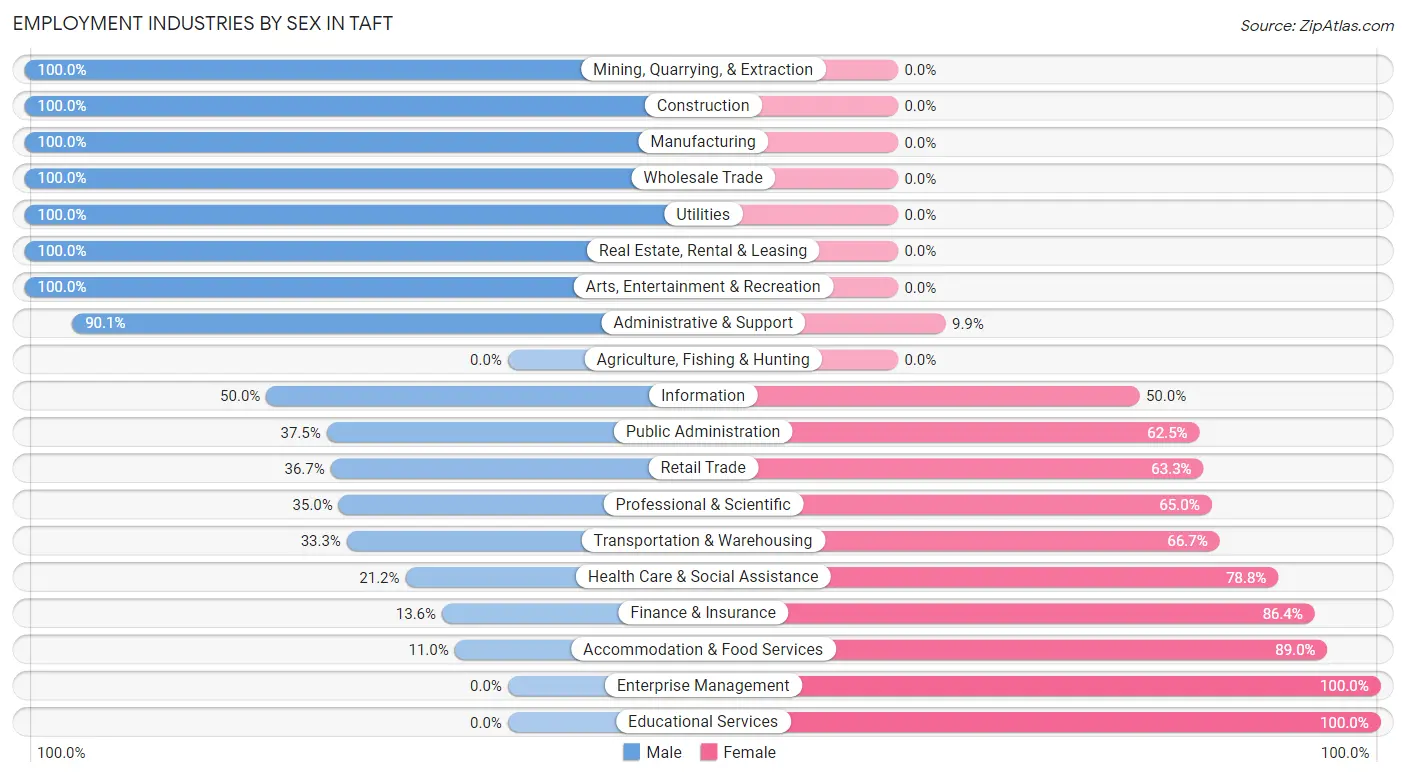
Employment Industries by Sex in Taft
The Taft industries that see more men than women are Mining, Quarrying, & Extraction (100.0%), Construction (100.0%), and Manufacturing (100.0%), whereas the industries that tend to have a higher number of women are Enterprise Management (100.0%), Educational Services (100.0%), and Accommodation & Food Services (89.0%).
| Industry | Male | Female |
| Agriculture, Fishing & Hunting | 0 (0.0%) | 0 (0.0%) |
| Mining, Quarrying, & Extraction | 1 (100.0%) | 0 (0.0%) |
| Construction | 135 (100.0%) | 0 (0.0%) |
| Manufacturing | 112 (100.0%) | 0 (0.0%) |
| Wholesale Trade | 30 (100.0%) | 0 (0.0%) |
| Retail Trade | 44 (36.7%) | 76 (63.3%) |
| Transportation & Warehousing | 5 (33.3%) | 10 (66.7%) |
| Utilities | 12 (100.0%) | 0 (0.0%) |
| Information | 13 (50.0%) | 13 (50.0%) |
| Finance & Insurance | 3 (13.6%) | 19 (86.4%) |
| Real Estate, Rental & Leasing | 6 (100.0%) | 0 (0.0%) |
| Professional & Scientific | 7 (35.0%) | 13 (65.0%) |
| Enterprise Management | 0 (0.0%) | 5 (100.0%) |
| Administrative & Support | 64 (90.1%) | 7 (9.9%) |
| Educational Services | 0 (0.0%) | 62 (100.0%) |
| Health Care & Social Assistance | 32 (21.2%) | 119 (78.8%) |
| Arts, Entertainment & Recreation | 27 (100.0%) | 0 (0.0%) |
| Accommodation & Food Services | 12 (11.0%) | 97 (89.0%) |
| Public Administration | 6 (37.5%) | 10 (62.5%) |
| Total | 521 (52.1%) | 478 (47.8%) |
Education in Taft
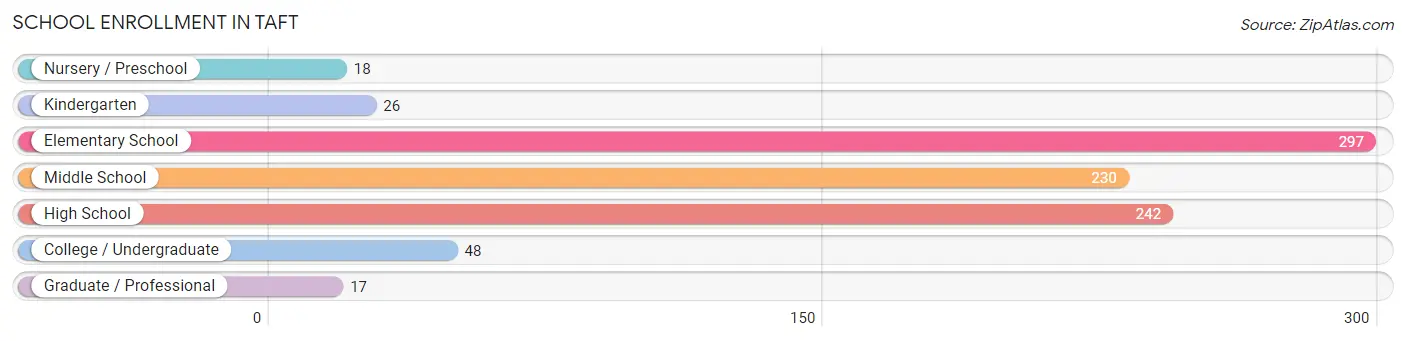
School Enrollment in Taft
The most common levels of schooling among the 878 students in Taft are elementary school (297 | 33.8%), high school (242 | 27.6%), and middle school (230 | 26.2%).
| School Level | # Students | % Students |
| Nursery / Preschool | 18 | 2.1% |
| Kindergarten | 26 | 3.0% |
| Elementary School | 297 | 33.8% |
| Middle School | 230 | 26.2% |
| High School | 242 | 27.6% |
| College / Undergraduate | 48 | 5.5% |
| Graduate / Professional | 17 | 1.9% |
| Total | 878 | 100.0% |
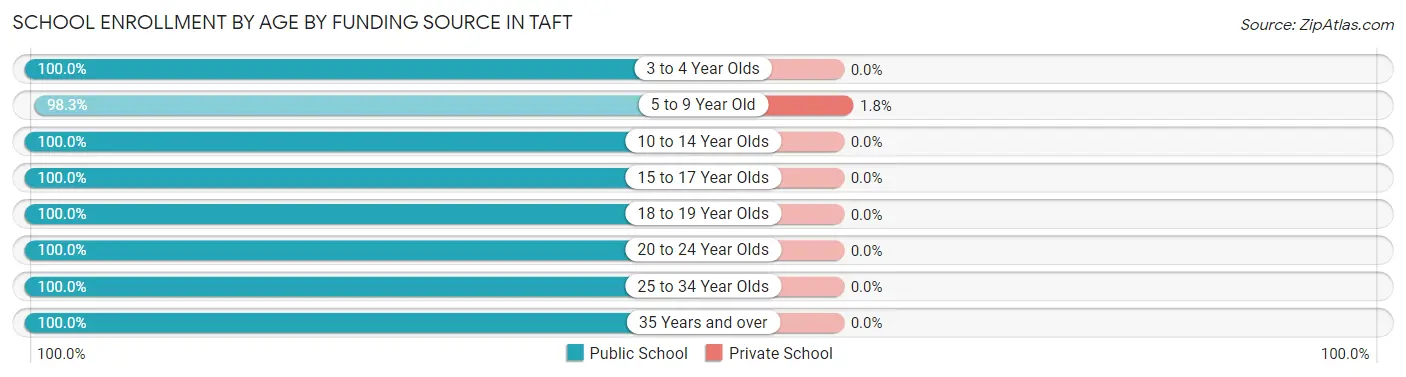
School Enrollment by Age by Funding Source in Taft
Out of a total of 878 students who are enrolled in schools in Taft, 5 (0.6%) attend a private institution, while the remaining 873 (99.4%) are enrolled in public schools. The age group of 5 to 9 year old has the highest likelihood of being enrolled in private schools, with 5 (1.8% in the age bracket) enrolled. Conversely, the age group of 3 to 4 year olds has the lowest likelihood of being enrolled in a private school, with 7 (100.0% in the age bracket) attending a public institution.
| Age Bracket | Public School | Private School |
| 3 to 4 Year Olds | 7 (100.0%) | 0 (0.0%) |
| 5 to 9 Year Old | 281 (98.3%) | 5 (1.8%) |
| 10 to 14 Year Olds | 307 (100.0%) | 0 (0.0%) |
| 15 to 17 Year Olds | 179 (100.0%) | 0 (0.0%) |
| 18 to 19 Year Olds | 47 (100.0%) | 0 (0.0%) |
| 20 to 24 Year Olds | 12 (100.0%) | 0 (0.0%) |
| 25 to 34 Year Olds | 16 (100.0%) | 0 (0.0%) |
| 35 Years and over | 24 (100.0%) | 0 (0.0%) |
| Total | 873 (99.4%) | 5 (0.6%) |
Educational Attainment by Field of Study in Taft
Education (40 | 23.7%), business (37 | 21.9%), psychology (36 | 21.3%), arts & humanities (17 | 10.1%), and literature & languages (11 | 6.5%) are the most common fields of study among 169 individuals in Taft who have obtained a bachelor's degree or higher.
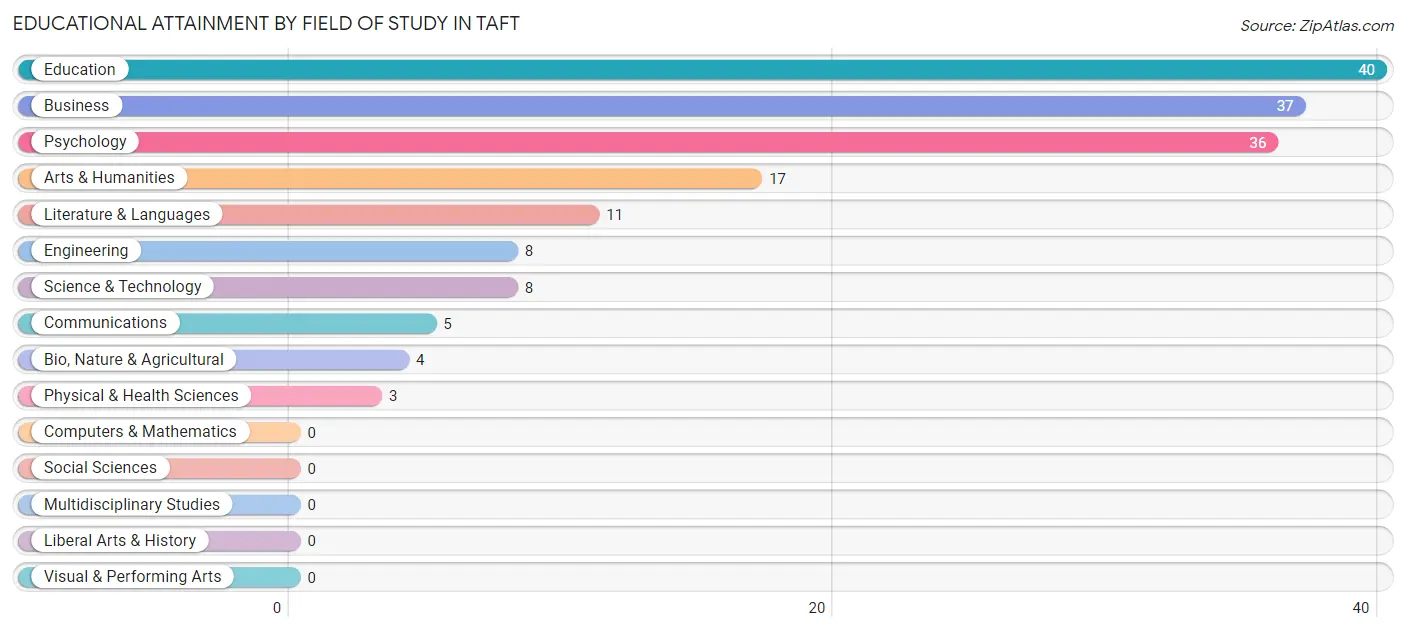
| Field of Study | # Graduates | % Graduates |
| Computers & Mathematics | 0 | 0.0% |
| Bio, Nature & Agricultural | 4 | 2.4% |
| Physical & Health Sciences | 3 | 1.8% |
| Psychology | 36 | 21.3% |
| Social Sciences | 0 | 0.0% |
| Engineering | 8 | 4.7% |
| Multidisciplinary Studies | 0 | 0.0% |
| Science & Technology | 8 | 4.7% |
| Business | 37 | 21.9% |
| Education | 40 | 23.7% |
| Literature & Languages | 11 | 6.5% |
| Liberal Arts & History | 0 | 0.0% |
| Visual & Performing Arts | 0 | 0.0% |
| Communications | 5 | 3.0% |
| Arts & Humanities | 17 | 10.1% |
| Total | 169 | 100.0% |
Transportation & Commute in Taft
Vehicle Availability by Sex in Taft
The most prevalent vehicle ownership categories in Taft are males with 3 vehicles (191, accounting for 36.7%) and females with 3 vehicles (145, making up 41.7%).
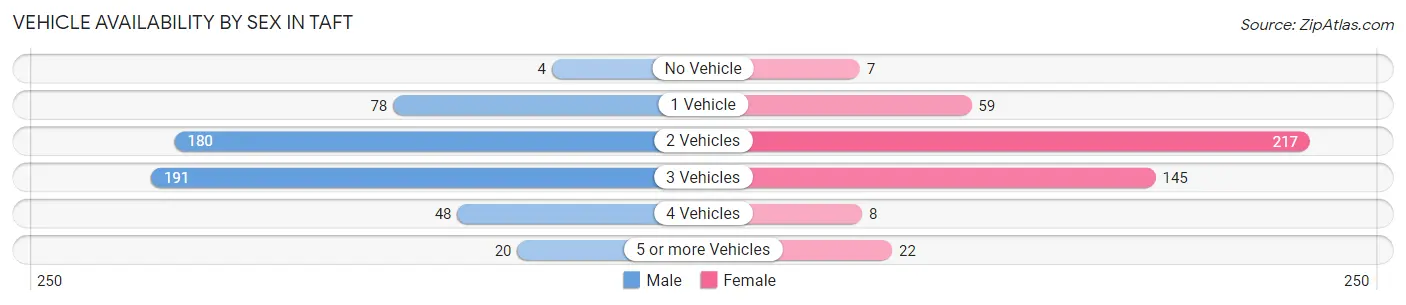
| Vehicles Available | Male | Female |
| No Vehicle | 4 (0.8%) | 7 (1.5%) |
| 1 Vehicle | 78 (15.0%) | 59 (12.9%) |
| 2 Vehicles | 180 (34.5%) | 217 (47.4%) |
| 3 Vehicles | 191 (36.7%) | 145 (31.7%) |
| 4 Vehicles | 48 (9.2%) | 8 (1.8%) |
| 5 or more Vehicles | 20 (3.8%) | 22 (4.8%) |
| Total | 521 (100.0%) | 458 (100.0%) |
Commute Time in Taft
The most frequently occuring commute durations in Taft are 30 to 34 minutes (238 commuters, 24.7%), 5 to 9 minutes (127 commuters, 13.2%), and 20 to 24 minutes (116 commuters, 12.0%).
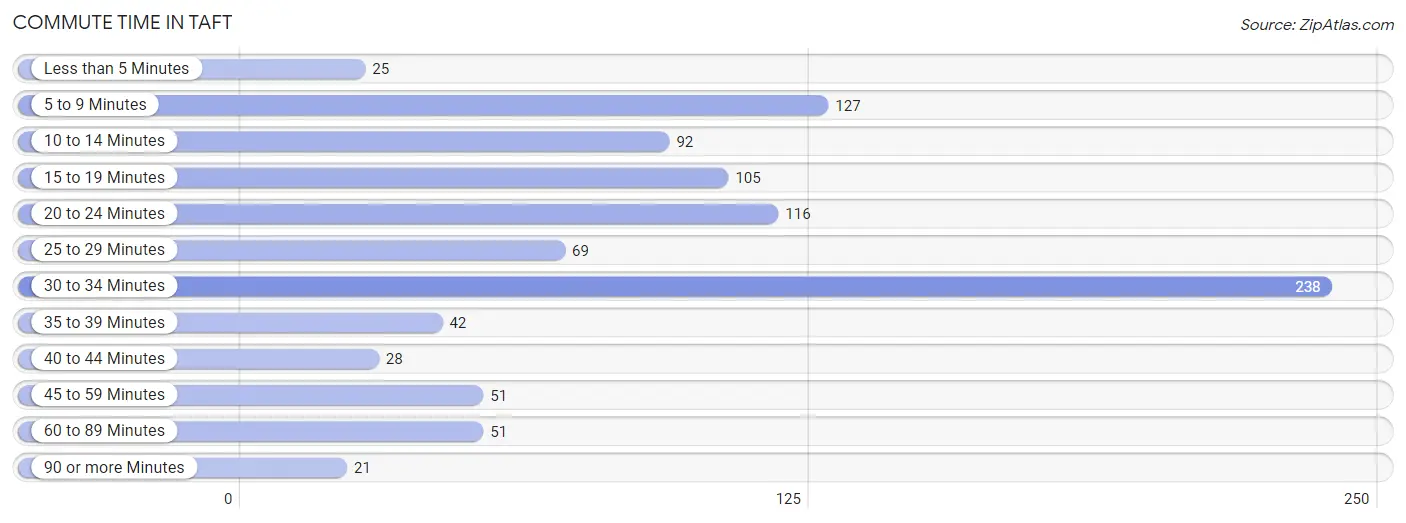
| Commute Time | # Commuters | % Commuters |
| Less than 5 Minutes | 25 | 2.6% |
| 5 to 9 Minutes | 127 | 13.2% |
| 10 to 14 Minutes | 92 | 9.5% |
| 15 to 19 Minutes | 105 | 10.9% |
| 20 to 24 Minutes | 116 | 12.0% |
| 25 to 29 Minutes | 69 | 7.1% |
| 30 to 34 Minutes | 238 | 24.7% |
| 35 to 39 Minutes | 42 | 4.3% |
| 40 to 44 Minutes | 28 | 2.9% |
| 45 to 59 Minutes | 51 | 5.3% |
| 60 to 89 Minutes | 51 | 5.3% |
| 90 or more Minutes | 21 | 2.2% |
Commute Time by Sex in Taft
The most common commute times in Taft are 30 to 34 minutes (161 commuters, 30.9%) for males and 5 to 9 minutes (117 commuters, 26.4%) for females.
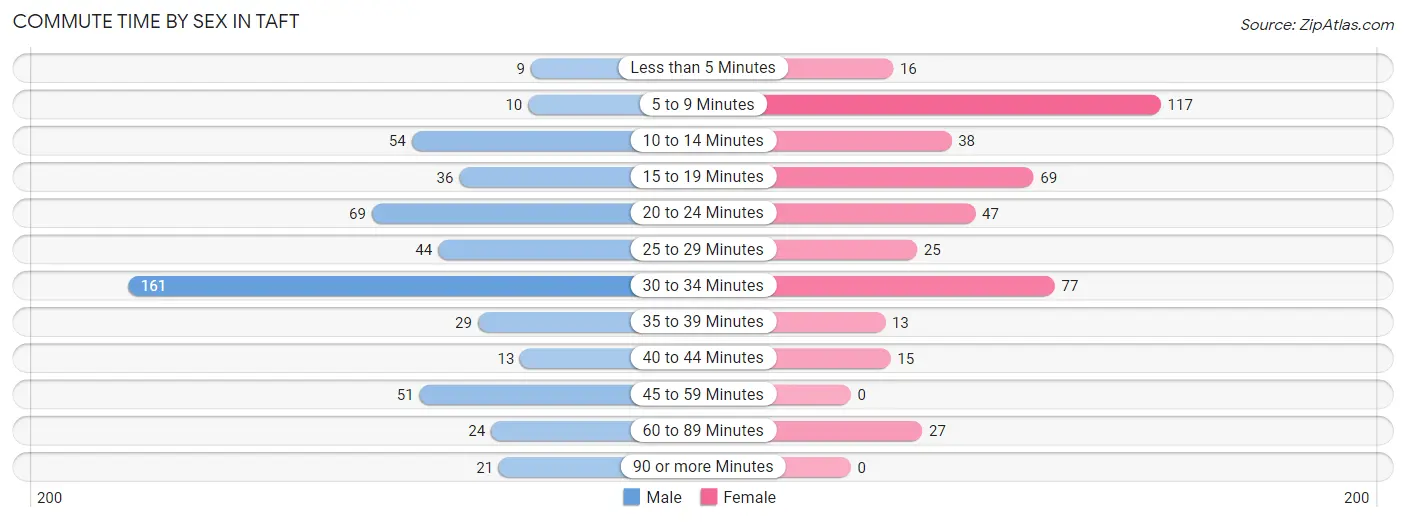
| Commute Time | Male | Female |
| Less than 5 Minutes | 9 (1.7%) | 16 (3.6%) |
| 5 to 9 Minutes | 10 (1.9%) | 117 (26.4%) |
| 10 to 14 Minutes | 54 (10.4%) | 38 (8.6%) |
| 15 to 19 Minutes | 36 (6.9%) | 69 (15.5%) |
| 20 to 24 Minutes | 69 (13.2%) | 47 (10.6%) |
| 25 to 29 Minutes | 44 (8.5%) | 25 (5.6%) |
| 30 to 34 Minutes | 161 (30.9%) | 77 (17.3%) |
| 35 to 39 Minutes | 29 (5.6%) | 13 (2.9%) |
| 40 to 44 Minutes | 13 (2.5%) | 15 (3.4%) |
| 45 to 59 Minutes | 51 (9.8%) | 0 (0.0%) |
| 60 to 89 Minutes | 24 (4.6%) | 27 (6.1%) |
| 90 or more Minutes | 21 (4.0%) | 0 (0.0%) |
Time of Departure to Work by Sex in Taft
The most frequent times of departure to work in Taft are 6:00 AM to 6:29 AM (129, 24.8%) for males and 7:00 AM to 7:29 AM (111, 25.0%) for females.
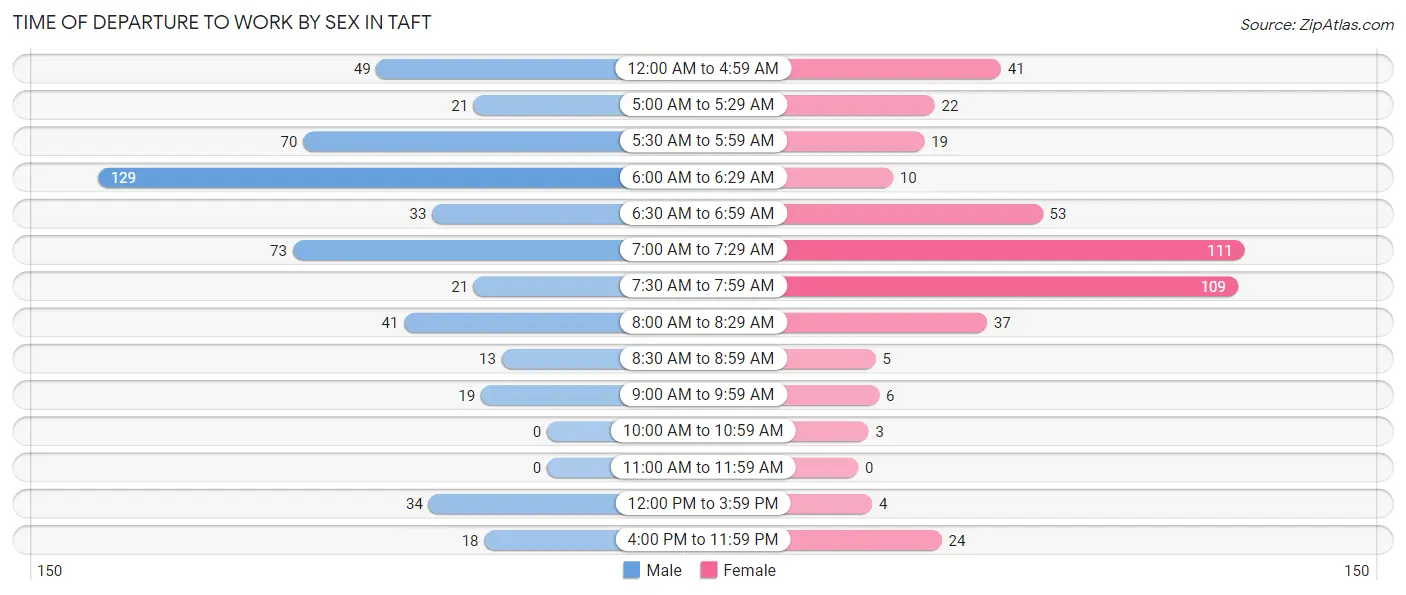
| Time of Departure | Male | Female |
| 12:00 AM to 4:59 AM | 49 (9.4%) | 41 (9.2%) |
| 5:00 AM to 5:29 AM | 21 (4.0%) | 22 (5.0%) |
| 5:30 AM to 5:59 AM | 70 (13.4%) | 19 (4.3%) |
| 6:00 AM to 6:29 AM | 129 (24.8%) | 10 (2.2%) |
| 6:30 AM to 6:59 AM | 33 (6.3%) | 53 (11.9%) |
| 7:00 AM to 7:29 AM | 73 (14.0%) | 111 (25.0%) |
| 7:30 AM to 7:59 AM | 21 (4.0%) | 109 (24.5%) |
| 8:00 AM to 8:29 AM | 41 (7.9%) | 37 (8.3%) |
| 8:30 AM to 8:59 AM | 13 (2.5%) | 5 (1.1%) |
| 9:00 AM to 9:59 AM | 19 (3.6%) | 6 (1.3%) |
| 10:00 AM to 10:59 AM | 0 (0.0%) | 3 (0.7%) |
| 11:00 AM to 11:59 AM | 0 (0.0%) | 0 (0.0%) |
| 12:00 PM to 3:59 PM | 34 (6.5%) | 4 (0.9%) |
| 4:00 PM to 11:59 PM | 18 (3.5%) | 24 (5.4%) |
| Total | 521 (100.0%) | 444 (100.0%) |
Housing Occupancy in Taft
Occupancy by Ownership in Taft
Of the total 858 dwellings in Taft, owner-occupied units account for 547 (63.7%), while renter-occupied units make up 311 (36.2%).
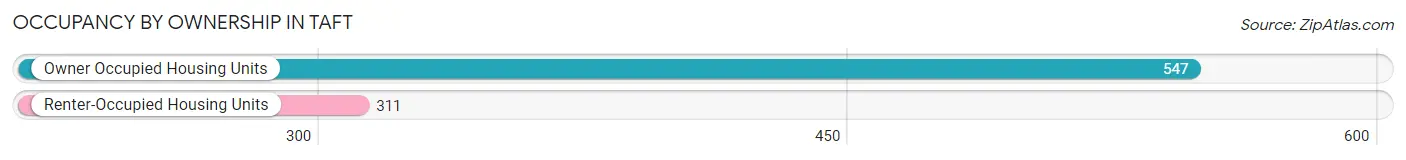
| Occupancy | # Housing Units | % Housing Units |
| Owner Occupied Housing Units | 547 | 63.7% |
| Renter-Occupied Housing Units | 311 | 36.2% |
| Total Occupied Housing Units | 858 | 100.0% |
Occupancy by Household Size in Taft
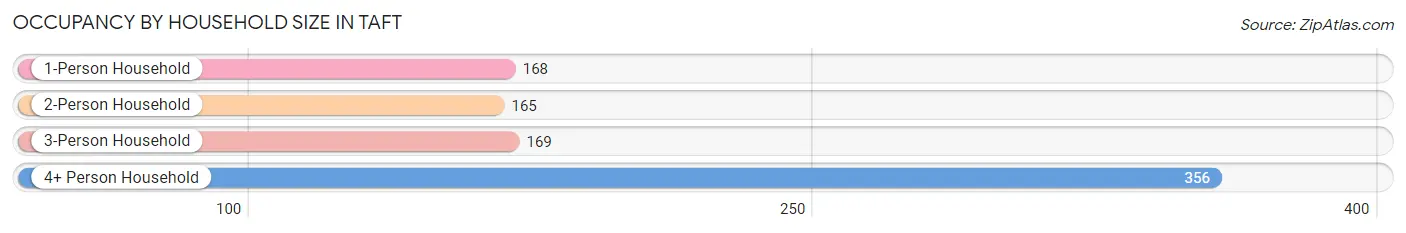
| Household Size | # Housing Units | % Housing Units |
| 1-Person Household | 168 | 19.6% |
| 2-Person Household | 165 | 19.2% |
| 3-Person Household | 169 | 19.7% |
| 4+ Person Household | 356 | 41.5% |
| Total Housing Units | 858 | 100.0% |
Occupancy by Ownership by Household Size in Taft
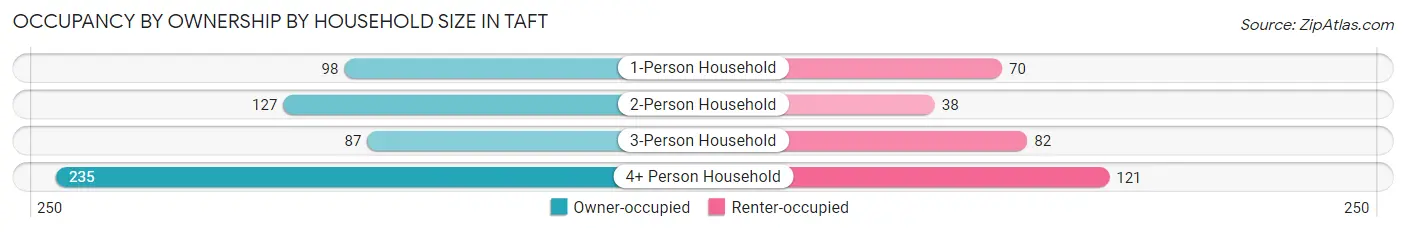
| Household Size | Owner-occupied | Renter-occupied |
| 1-Person Household | 98 (58.3%) | 70 (41.7%) |
| 2-Person Household | 127 (77.0%) | 38 (23.0%) |
| 3-Person Household | 87 (51.5%) | 82 (48.5%) |
| 4+ Person Household | 235 (66.0%) | 121 (34.0%) |
| Total Housing Units | 547 (63.7%) | 311 (36.2%) |
Occupancy by Educational Attainment in Taft
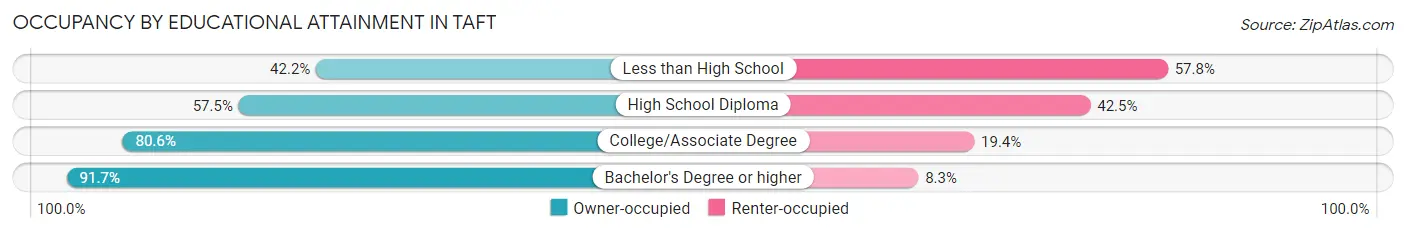
| Household Size | Owner-occupied | Renter-occupied |
| Less than High School | 108 (42.2%) | 148 (57.8%) |
| High School Diploma | 145 (57.5%) | 107 (42.5%) |
| College/Associate Degree | 195 (80.6%) | 47 (19.4%) |
| Bachelor's Degree or higher | 99 (91.7%) | 9 (8.3%) |
Occupancy by Age of Householder in Taft
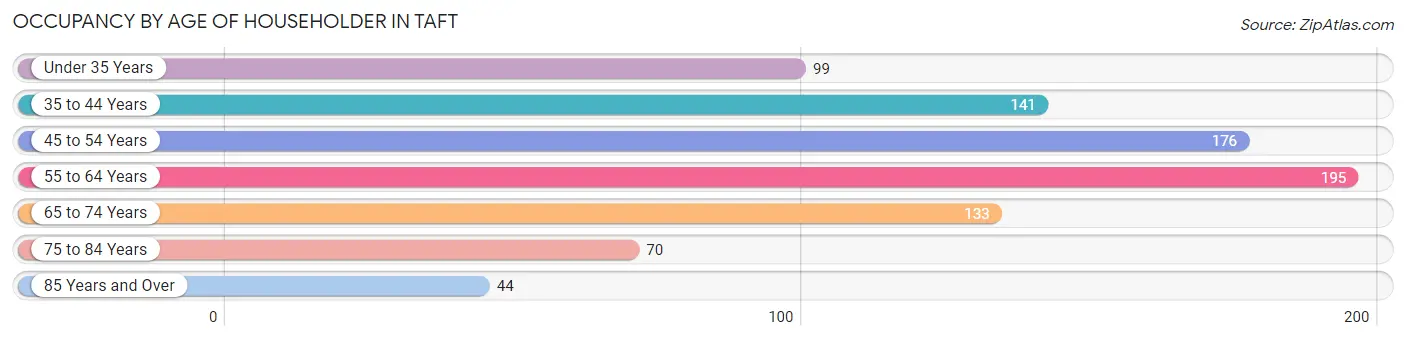
| Age Bracket | # Households | % Households |
| Under 35 Years | 99 | 11.5% |
| 35 to 44 Years | 141 | 16.4% |
| 45 to 54 Years | 176 | 20.5% |
| 55 to 64 Years | 195 | 22.7% |
| 65 to 74 Years | 133 | 15.5% |
| 75 to 84 Years | 70 | 8.2% |
| 85 Years and Over | 44 | 5.1% |
| Total | 858 | 100.0% |
Housing Finances in Taft
Median Income by Occupancy in Taft
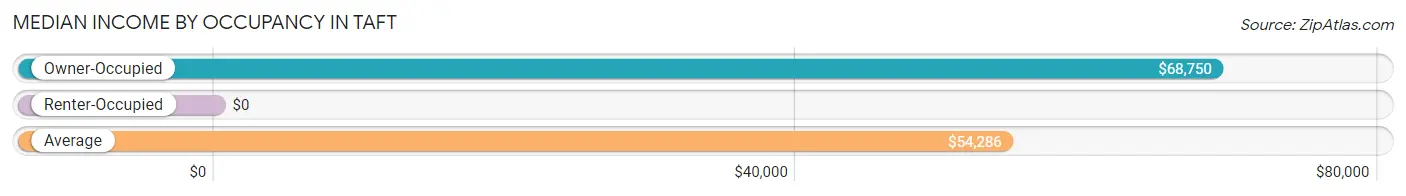
| Occupancy Type | # Households | Median Income |
| Owner-Occupied | 547 (63.7%) | $68,750 |
| Renter-Occupied | 311 (36.2%) | $0 |
| Average | 858 (100.0%) | $54,286 |
Occupancy by Householder Income Bracket in Taft
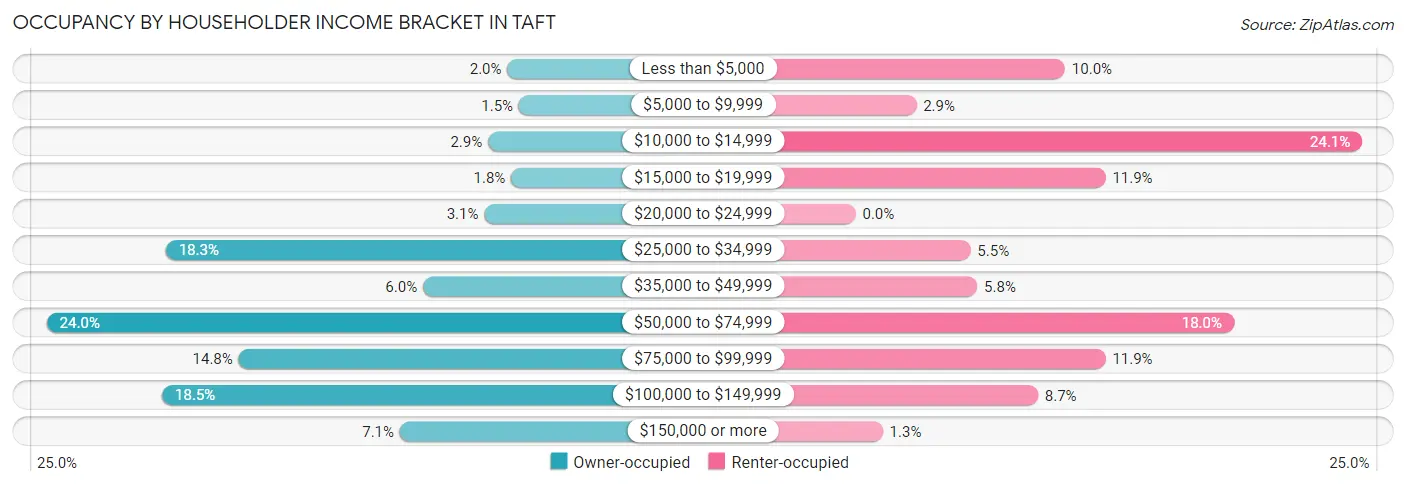
| Income Bracket | Owner-occupied | Renter-occupied |
| Less than $5,000 | 11 (2.0%) | 31 (10.0%) |
| $5,000 to $9,999 | 8 (1.5%) | 9 (2.9%) |
| $10,000 to $14,999 | 16 (2.9%) | 75 (24.1%) |
| $15,000 to $19,999 | 10 (1.8%) | 37 (11.9%) |
| $20,000 to $24,999 | 17 (3.1%) | 0 (0.0%) |
| $25,000 to $34,999 | 100 (18.3%) | 17 (5.5%) |
| $35,000 to $49,999 | 33 (6.0%) | 18 (5.8%) |
| $50,000 to $74,999 | 131 (23.9%) | 56 (18.0%) |
| $75,000 to $99,999 | 81 (14.8%) | 37 (11.9%) |
| $100,000 to $149,999 | 101 (18.5%) | 27 (8.7%) |
| $150,000 or more | 39 (7.1%) | 4 (1.3%) |
| Total | 547 (100.0%) | 311 (100.0%) |
Monthly Housing Cost Tiers in Taft
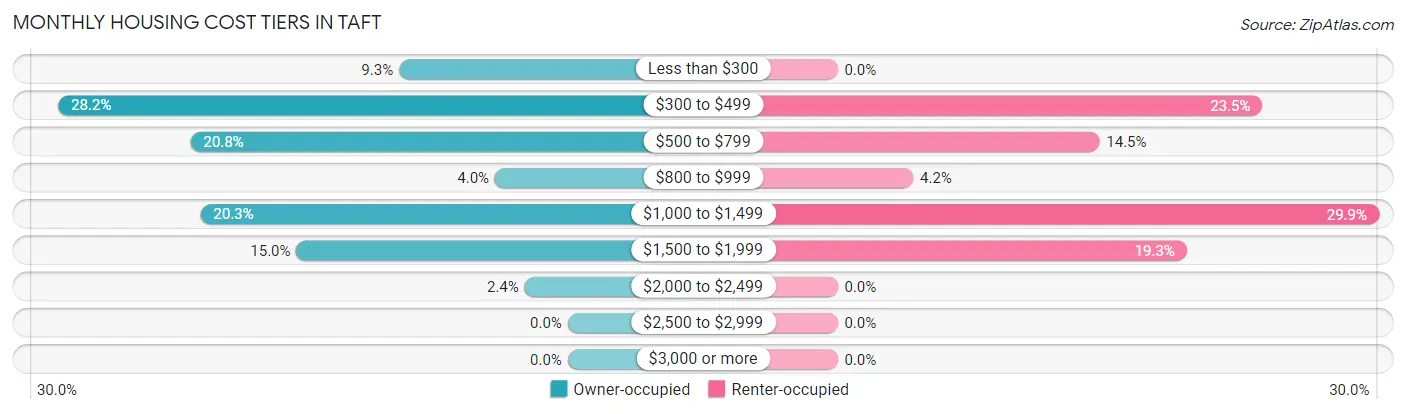
| Monthly Cost | Owner-occupied | Renter-occupied |
| Less than $300 | 51 (9.3%) | 0 (0.0%) |
| $300 to $499 | 154 (28.1%) | 73 (23.5%) |
| $500 to $799 | 114 (20.8%) | 45 (14.5%) |
| $800 to $999 | 22 (4.0%) | 13 (4.2%) |
| $1,000 to $1,499 | 111 (20.3%) | 93 (29.9%) |
| $1,500 to $1,999 | 82 (15.0%) | 60 (19.3%) |
| $2,000 to $2,499 | 13 (2.4%) | 0 (0.0%) |
| $2,500 to $2,999 | 0 (0.0%) | 0 (0.0%) |
| $3,000 or more | 0 (0.0%) | 0 (0.0%) |
| Total | 547 (100.0%) | 311 (100.0%) |
Physical Housing Characteristics in Taft
Housing Structures in Taft
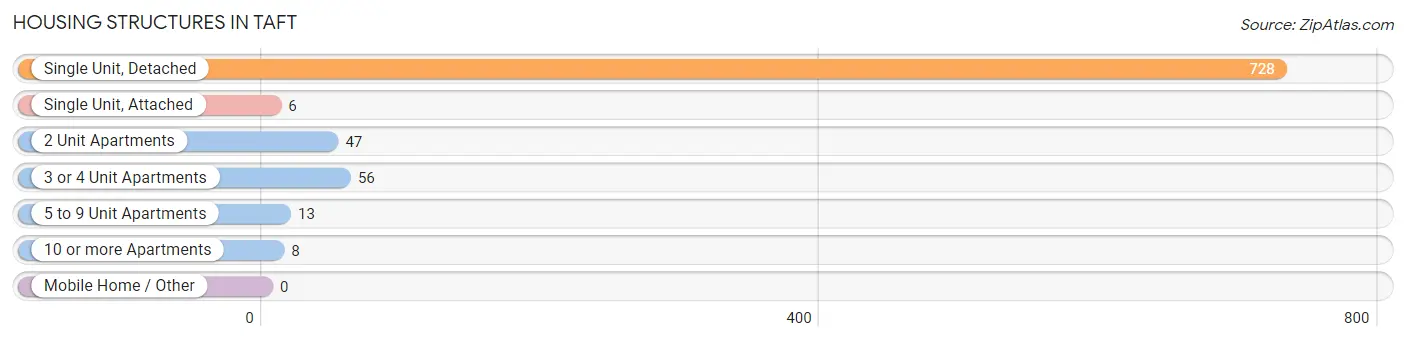
| Structure Type | # Housing Units | % Housing Units |
| Single Unit, Detached | 728 | 84.9% |
| Single Unit, Attached | 6 | 0.7% |
| 2 Unit Apartments | 47 | 5.5% |
| 3 or 4 Unit Apartments | 56 | 6.5% |
| 5 to 9 Unit Apartments | 13 | 1.5% |
| 10 or more Apartments | 8 | 0.9% |
| Mobile Home / Other | 0 | 0.0% |
| Total | 858 | 100.0% |
Housing Structures by Occupancy in Taft
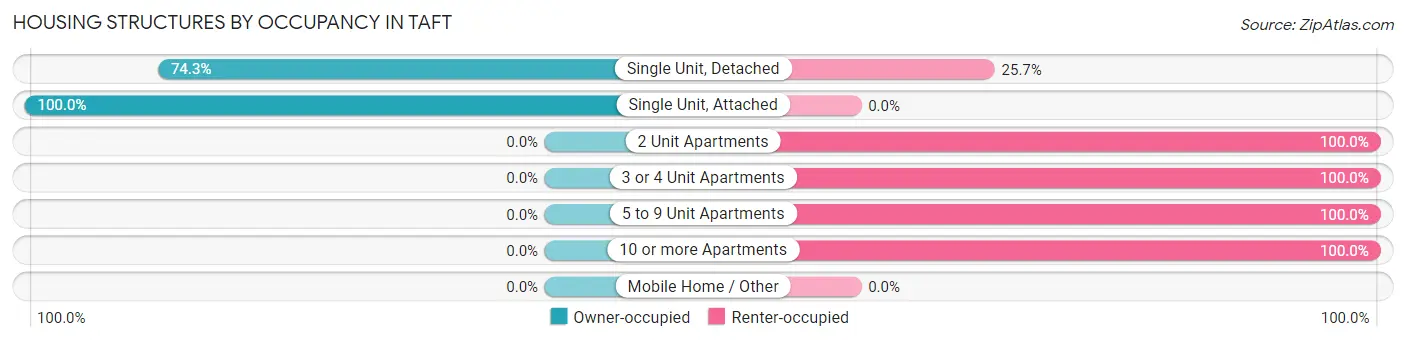
| Structure Type | Owner-occupied | Renter-occupied |
| Single Unit, Detached | 541 (74.3%) | 187 (25.7%) |
| Single Unit, Attached | 6 (100.0%) | 0 (0.0%) |
| 2 Unit Apartments | 0 (0.0%) | 47 (100.0%) |
| 3 or 4 Unit Apartments | 0 (0.0%) | 56 (100.0%) |
| 5 to 9 Unit Apartments | 0 (0.0%) | 13 (100.0%) |
| 10 or more Apartments | 0 (0.0%) | 8 (100.0%) |
| Mobile Home / Other | 0 (0.0%) | 0 (0.0%) |
| Total | 547 (63.7%) | 311 (36.2%) |
Housing Structures by Number of Rooms in Taft
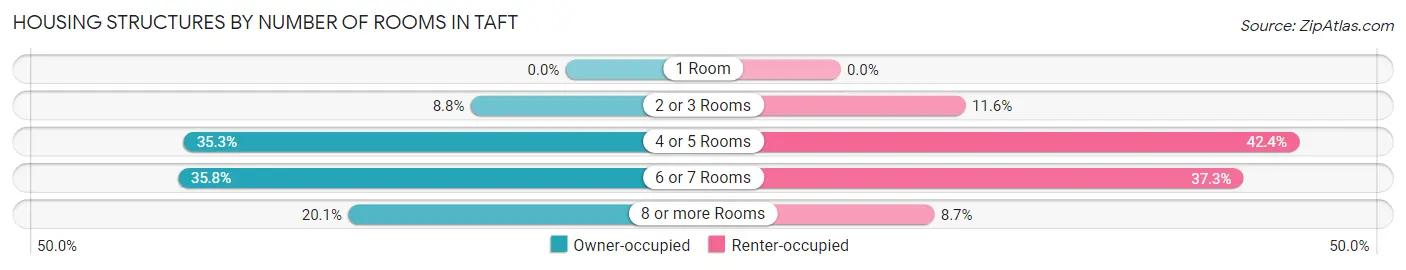
| Number of Rooms | Owner-occupied | Renter-occupied |
| 1 Room | 0 (0.0%) | 0 (0.0%) |
| 2 or 3 Rooms | 48 (8.8%) | 36 (11.6%) |
| 4 or 5 Rooms | 193 (35.3%) | 132 (42.4%) |
| 6 or 7 Rooms | 196 (35.8%) | 116 (37.3%) |
| 8 or more Rooms | 110 (20.1%) | 27 (8.7%) |
| Total | 547 (100.0%) | 311 (100.0%) |
Housing Structure by Heating Type in Taft
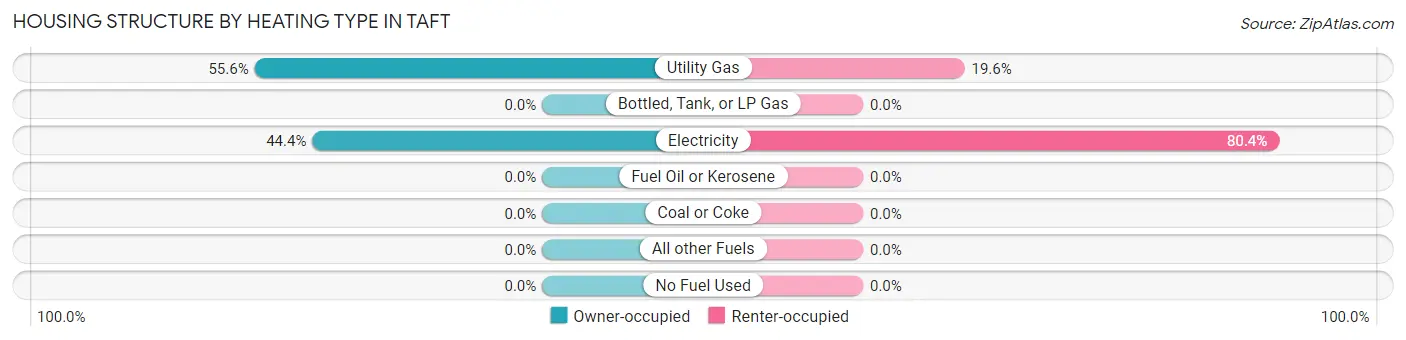
| Heating Type | Owner-occupied | Renter-occupied |
| Utility Gas | 304 (55.6%) | 61 (19.6%) |
| Bottled, Tank, or LP Gas | 0 (0.0%) | 0 (0.0%) |
| Electricity | 243 (44.4%) | 250 (80.4%) |
| Fuel Oil or Kerosene | 0 (0.0%) | 0 (0.0%) |
| Coal or Coke | 0 (0.0%) | 0 (0.0%) |
| All other Fuels | 0 (0.0%) | 0 (0.0%) |
| No Fuel Used | 0 (0.0%) | 0 (0.0%) |
| Total | 547 (100.0%) | 311 (100.0%) |
Household Vehicle Usage in Taft
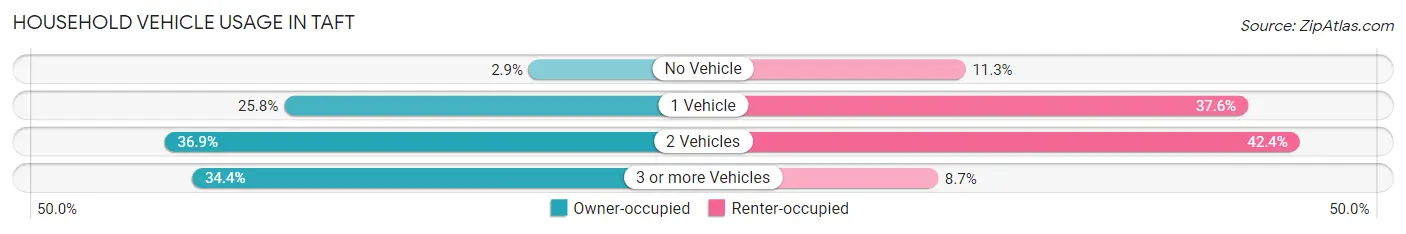
| Vehicles per Household | Owner-occupied | Renter-occupied |
| No Vehicle | 16 (2.9%) | 35 (11.3%) |
| 1 Vehicle | 141 (25.8%) | 117 (37.6%) |
| 2 Vehicles | 202 (36.9%) | 132 (42.4%) |
| 3 or more Vehicles | 188 (34.4%) | 27 (8.7%) |
| Total | 547 (100.0%) | 311 (100.0%) |
Real Estate & Mortgages in Taft
Real Estate and Mortgage Overview in Taft
| Characteristic | Without Mortgage | With Mortgage |
| Housing Units | 327 | 220 |
| Median Property Value | $93,100 | $121,800 |
| Median Household Income | $57,604 | $24 |
| Monthly Housing Costs | $445 | $0 |
| Real Estate Taxes | $1,483 | $7 |
Property Value by Mortgage Status in Taft
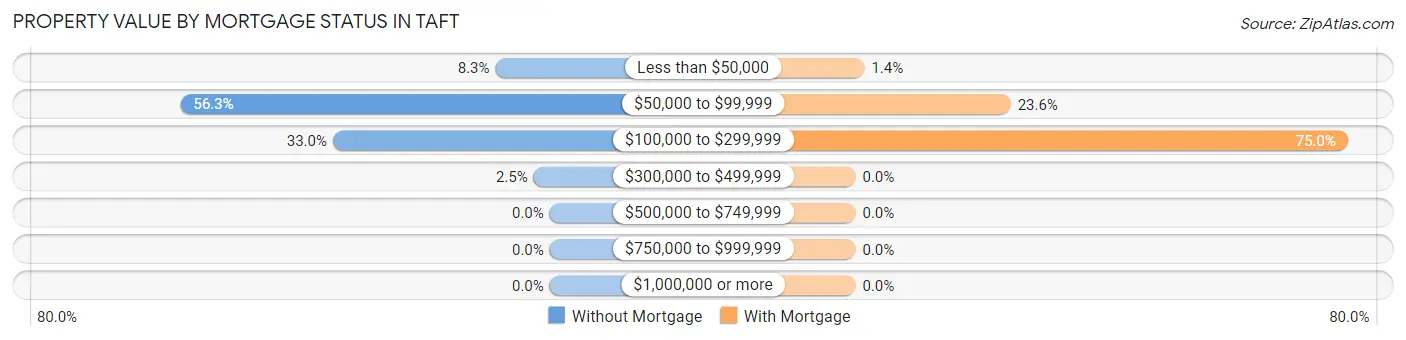
| Property Value | Without Mortgage | With Mortgage |
| Less than $50,000 | 27 (8.3%) | 3 (1.4%) |
| $50,000 to $99,999 | 184 (56.3%) | 52 (23.6%) |
| $100,000 to $299,999 | 108 (33.0%) | 165 (75.0%) |
| $300,000 to $499,999 | 8 (2.5%) | 0 (0.0%) |
| $500,000 to $749,999 | 0 (0.0%) | 0 (0.0%) |
| $750,000 to $999,999 | 0 (0.0%) | 0 (0.0%) |
| $1,000,000 or more | 0 (0.0%) | 0 (0.0%) |
| Total | 327 (100.0%) | 220 (100.0%) |
Household Income by Mortgage Status in Taft
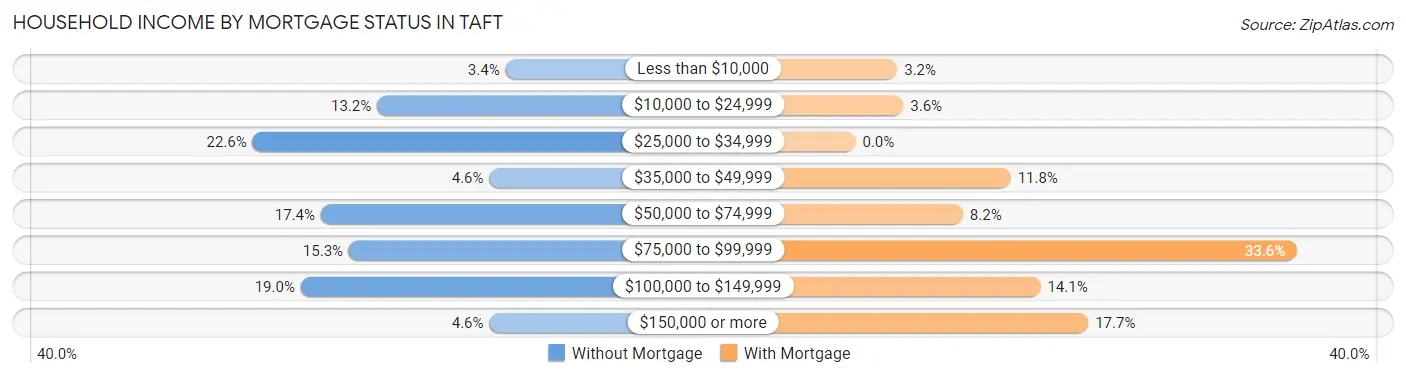
| Household Income | Without Mortgage | With Mortgage |
| Less than $10,000 | 11 (3.4%) | 7 (3.2%) |
| $10,000 to $24,999 | 43 (13.2%) | 8 (3.6%) |
| $25,000 to $34,999 | 74 (22.6%) | 0 (0.0%) |
| $35,000 to $49,999 | 15 (4.6%) | 26 (11.8%) |
| $50,000 to $74,999 | 57 (17.4%) | 18 (8.2%) |
| $75,000 to $99,999 | 50 (15.3%) | 74 (33.6%) |
| $100,000 to $149,999 | 62 (19.0%) | 31 (14.1%) |
| $150,000 or more | 15 (4.6%) | 39 (17.7%) |
| Total | 327 (100.0%) | 220 (100.0%) |
Property Value to Household Income Ratio in Taft
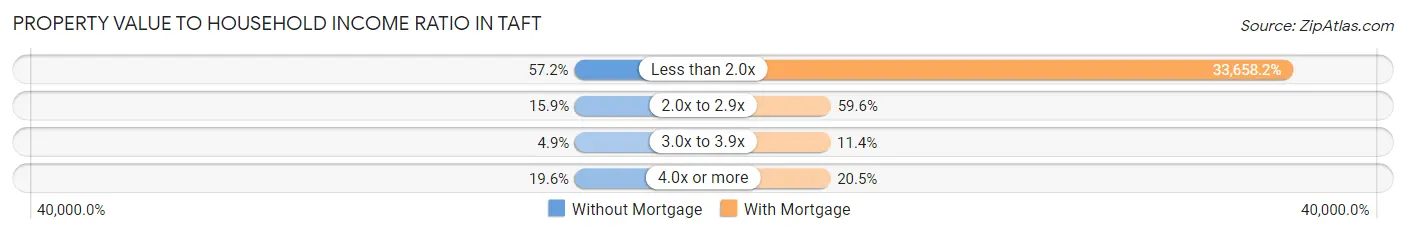
| Value-to-Income Ratio | Without Mortgage | With Mortgage |
| Less than 2.0x | 187 (57.2%) | 74,048 (33,658.2%) |
| 2.0x to 2.9x | 52 (15.9%) | 131 (59.6%) |
| 3.0x to 3.9x | 16 (4.9%) | 25 (11.4%) |
| 4.0x or more | 64 (19.6%) | 45 (20.4%) |
| Total | 327 (100.0%) | 220 (100.0%) |
Real Estate Taxes by Mortgage Status in Taft
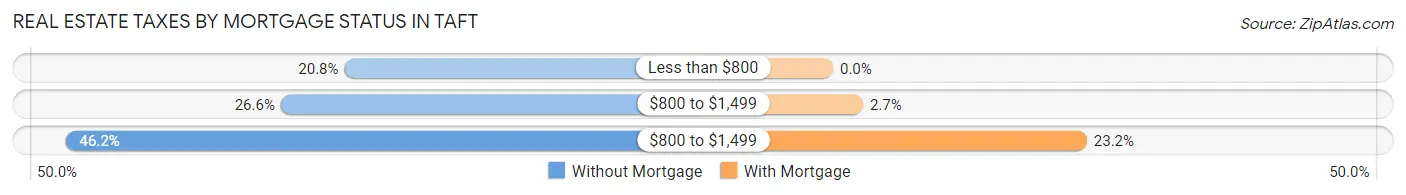
| Property Taxes | Without Mortgage | With Mortgage |
| Less than $800 | 68 (20.8%) | 0 (0.0%) |
| $800 to $1,499 | 87 (26.6%) | 6 (2.7%) |
| $800 to $1,499 | 151 (46.2%) | 51 (23.2%) |
| Total | 327 (100.0%) | 220 (100.0%) |
Health & Disability in Taft
Health Insurance Coverage by Age in Taft
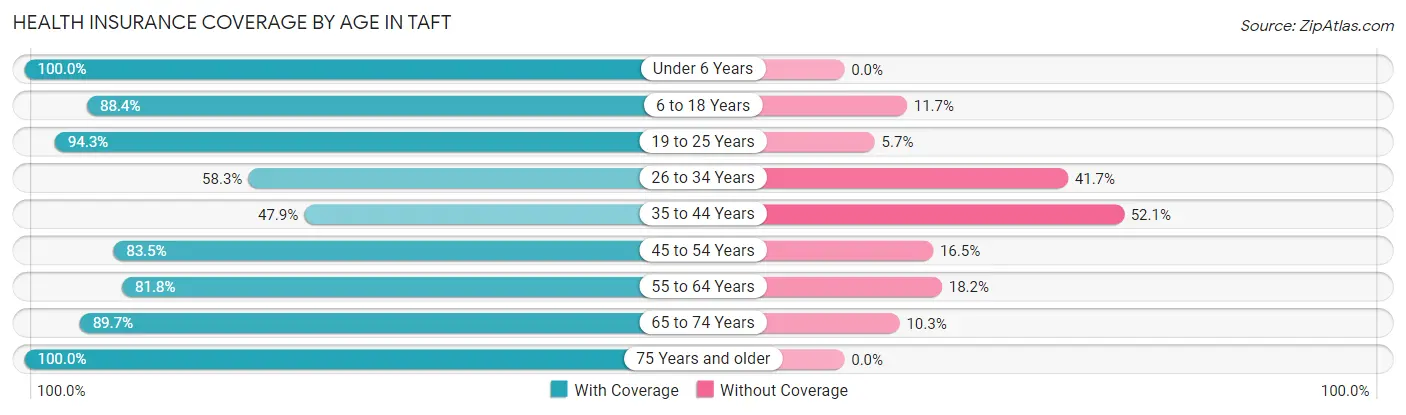
| Age Bracket | With Coverage | Without Coverage |
| Under 6 Years | 217 (100.0%) | 0 (0.0%) |
| 6 to 18 Years | 690 (88.3%) | 91 (11.7%) |
| 19 to 25 Years | 100 (94.3%) | 6 (5.7%) |
| 26 to 34 Years | 214 (58.3%) | 153 (41.7%) |
| 35 to 44 Years | 159 (47.9%) | 173 (52.1%) |
| 45 to 54 Years | 227 (83.5%) | 45 (16.5%) |
| 55 to 64 Years | 297 (81.8%) | 66 (18.2%) |
| 65 to 74 Years | 218 (89.7%) | 25 (10.3%) |
| 75 Years and older | 157 (100.0%) | 0 (0.0%) |
| Total | 2,279 (80.3%) | 559 (19.7%) |
Health Insurance Coverage by Citizenship Status in Taft

| Citizenship Status | With Coverage | Without Coverage |
| Native Born | 217 (100.0%) | 0 (0.0%) |
| Foreign Born, Citizen | 690 (88.3%) | 91 (11.7%) |
| Foreign Born, not a Citizen | 100 (94.3%) | 6 (5.7%) |
Health Insurance Coverage by Household Income in Taft
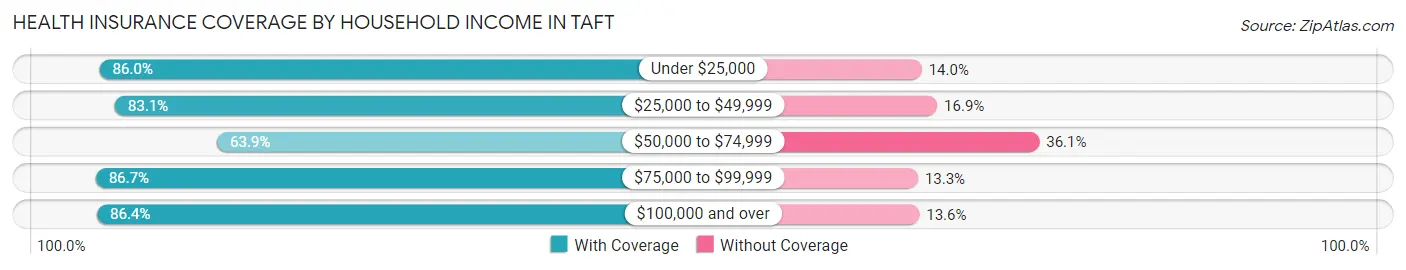
| Household Income | With Coverage | Without Coverage |
| Under $25,000 | 557 (86.0%) | 91 (14.0%) |
| $25,000 to $49,999 | 319 (83.1%) | 65 (16.9%) |
| $50,000 to $74,999 | 452 (63.9%) | 255 (36.1%) |
| $75,000 to $99,999 | 455 (86.7%) | 70 (13.3%) |
| $100,000 and over | 496 (86.4%) | 78 (13.6%) |
Public vs Private Health Insurance Coverage by Age in Taft
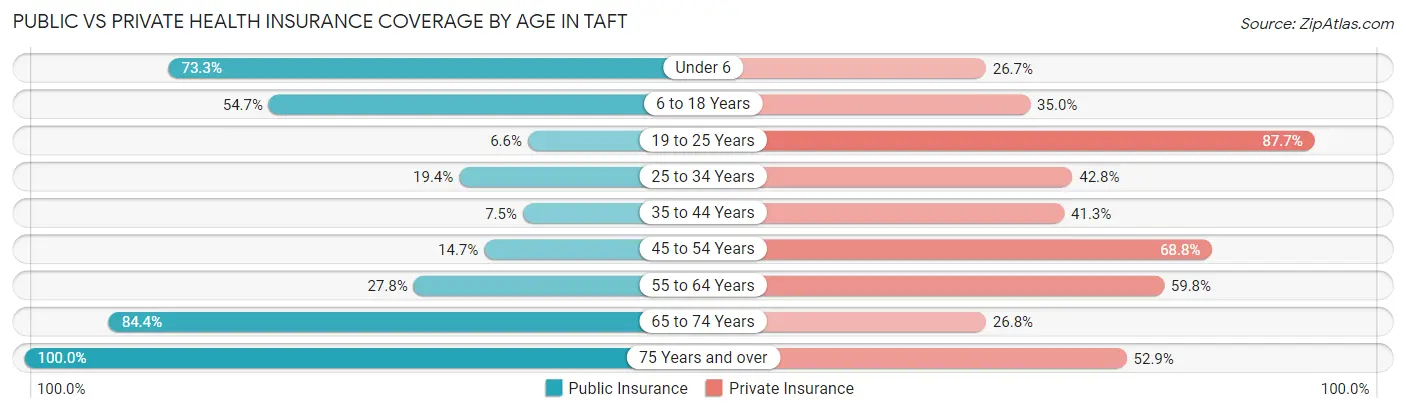
| Age Bracket | Public Insurance | Private Insurance |
| Under 6 | 159 (73.3%) | 58 (26.7%) |
| 6 to 18 Years | 427 (54.7%) | 273 (35.0%) |
| 19 to 25 Years | 7 (6.6%) | 93 (87.7%) |
| 25 to 34 Years | 71 (19.4%) | 157 (42.8%) |
| 35 to 44 Years | 25 (7.5%) | 137 (41.3%) |
| 45 to 54 Years | 40 (14.7%) | 187 (68.8%) |
| 55 to 64 Years | 101 (27.8%) | 217 (59.8%) |
| 65 to 74 Years | 205 (84.4%) | 65 (26.8%) |
| 75 Years and over | 157 (100.0%) | 83 (52.9%) |
| Total | 1,192 (42.0%) | 1,270 (44.8%) |
Disability Status by Sex by Age in Taft
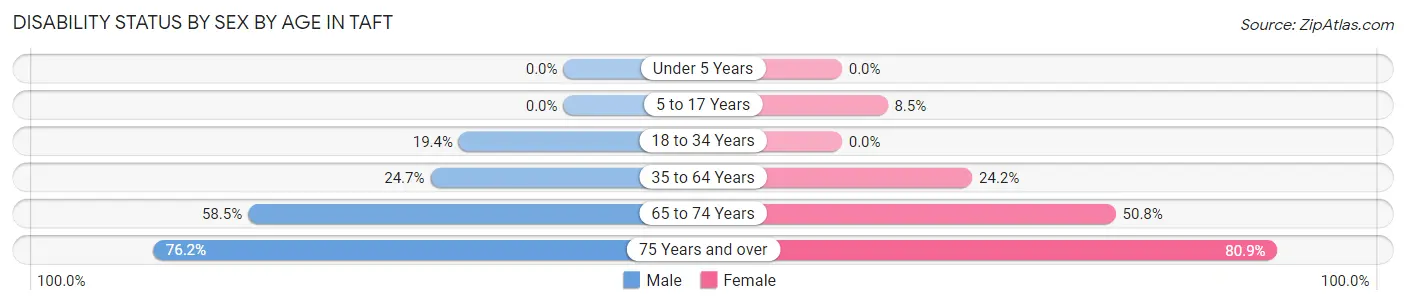
| Age Bracket | Male | Female |
| Under 5 Years | 0 (0.0%) | 0 (0.0%) |
| 5 to 17 Years | 0 (0.0%) | 28 (8.5%) |
| 18 to 34 Years | 53 (19.4%) | 0 (0.0%) |
| 35 to 64 Years | 102 (24.7%) | 134 (24.2%) |
| 65 to 74 Years | 72 (58.5%) | 61 (50.8%) |
| 75 Years and over | 48 (76.2%) | 76 (80.8%) |
Disability Class by Sex by Age in Taft
Disability Class: Hearing Difficulty
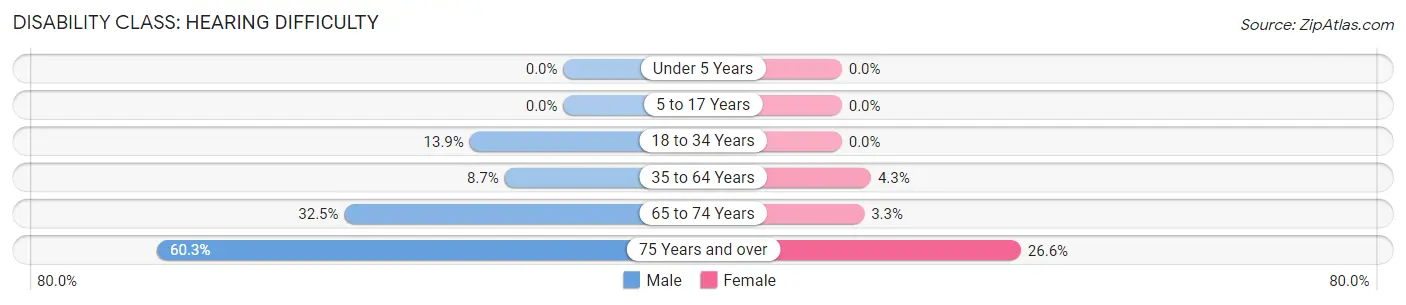
| Age Bracket | Male | Female |
| Under 5 Years | 0 (0.0%) | 0 (0.0%) |
| 5 to 17 Years | 0 (0.0%) | 0 (0.0%) |
| 18 to 34 Years | 38 (13.9%) | 0 (0.0%) |
| 35 to 64 Years | 36 (8.7%) | 24 (4.3%) |
| 65 to 74 Years | 40 (32.5%) | 4 (3.3%) |
| 75 Years and over | 38 (60.3%) | 25 (26.6%) |
Disability Class: Vision Difficulty
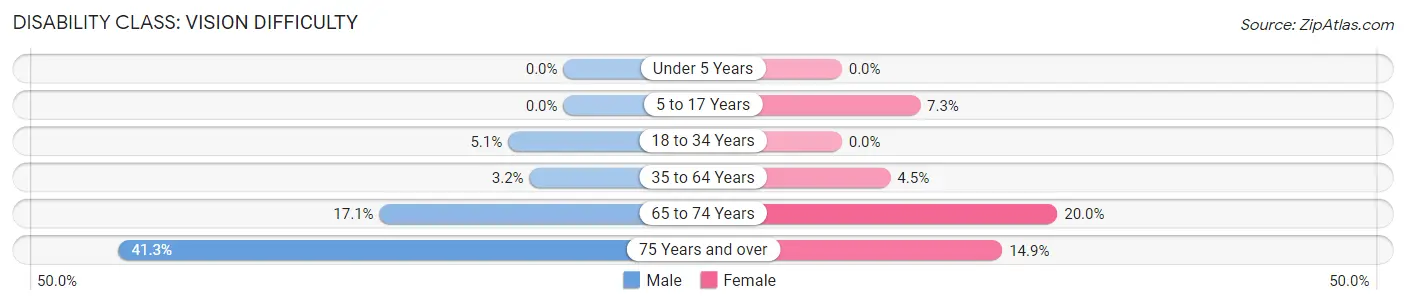
| Age Bracket | Male | Female |
| Under 5 Years | 0 (0.0%) | 0 (0.0%) |
| 5 to 17 Years | 0 (0.0%) | 24 (7.3%) |
| 18 to 34 Years | 14 (5.1%) | 0 (0.0%) |
| 35 to 64 Years | 13 (3.2%) | 25 (4.5%) |
| 65 to 74 Years | 21 (17.1%) | 24 (20.0%) |
| 75 Years and over | 26 (41.3%) | 14 (14.9%) |
Disability Class: Cognitive Difficulty
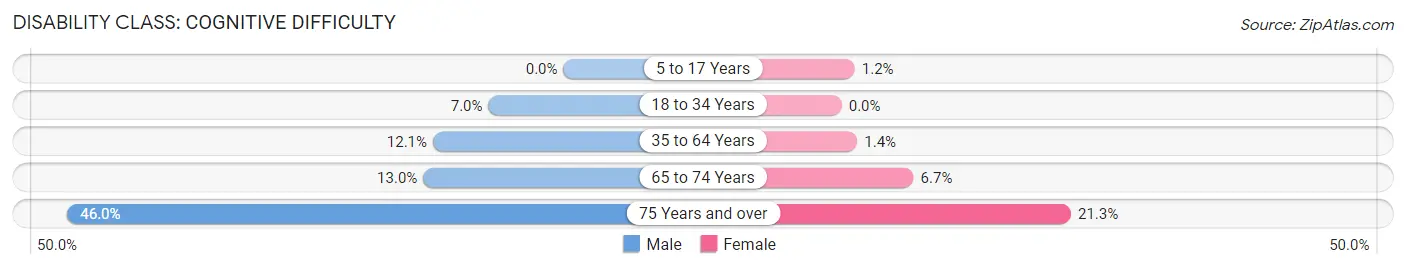
| Age Bracket | Male | Female |
| 5 to 17 Years | 0 (0.0%) | 4 (1.2%) |
| 18 to 34 Years | 19 (7.0%) | 0 (0.0%) |
| 35 to 64 Years | 50 (12.1%) | 8 (1.4%) |
| 65 to 74 Years | 16 (13.0%) | 8 (6.7%) |
| 75 Years and over | 29 (46.0%) | 20 (21.3%) |
Disability Class: Ambulatory Difficulty
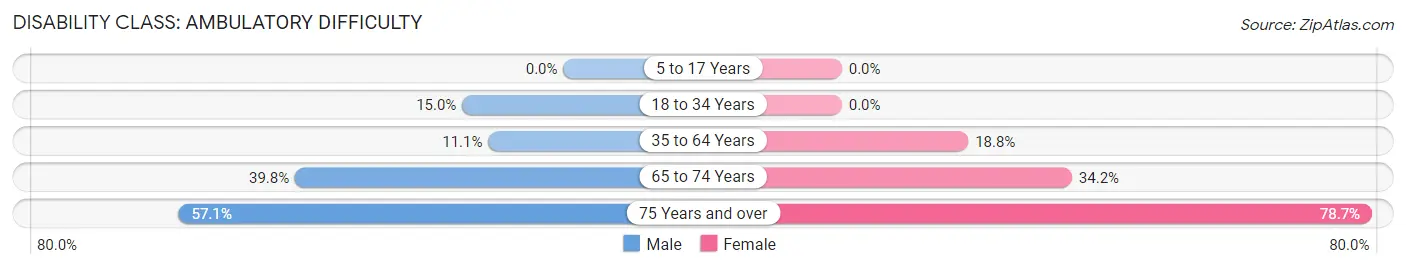
| Age Bracket | Male | Female |
| 5 to 17 Years | 0 (0.0%) | 0 (0.0%) |
| 18 to 34 Years | 41 (15.0%) | 0 (0.0%) |
| 35 to 64 Years | 46 (11.1%) | 104 (18.8%) |
| 65 to 74 Years | 49 (39.8%) | 41 (34.2%) |
| 75 Years and over | 36 (57.1%) | 74 (78.7%) |
Disability Class: Self-Care Difficulty
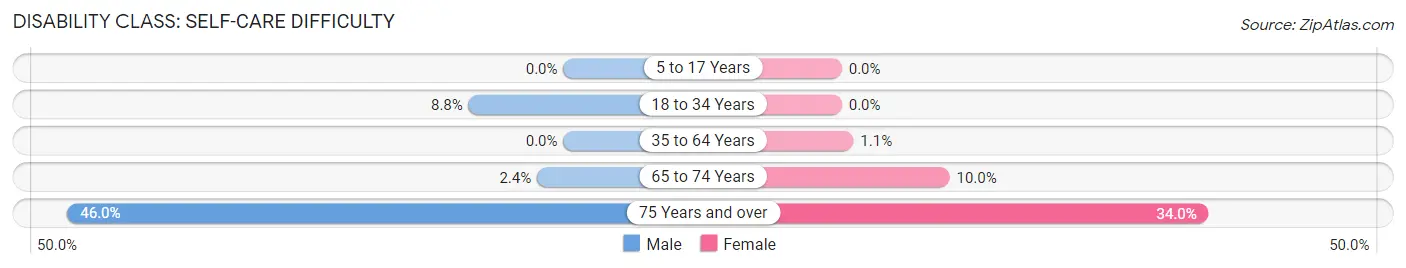
| Age Bracket | Male | Female |
| 5 to 17 Years | 0 (0.0%) | 0 (0.0%) |
| 18 to 34 Years | 24 (8.8%) | 0 (0.0%) |
| 35 to 64 Years | 0 (0.0%) | 6 (1.1%) |
| 65 to 74 Years | 3 (2.4%) | 12 (10.0%) |
| 75 Years and over | 29 (46.0%) | 32 (34.0%) |
Technology Access in Taft
Computing Device Access in Taft
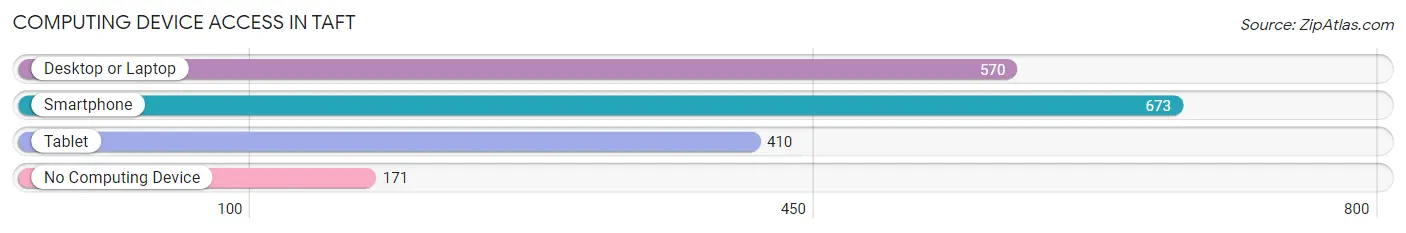
| Device Type | # Households | % Households |
| Desktop or Laptop | 570 | 66.4% |
| Smartphone | 673 | 78.4% |
| Tablet | 410 | 47.8% |
| No Computing Device | 171 | 19.9% |
| Total | 858 | 100.0% |
Internet Access in Taft
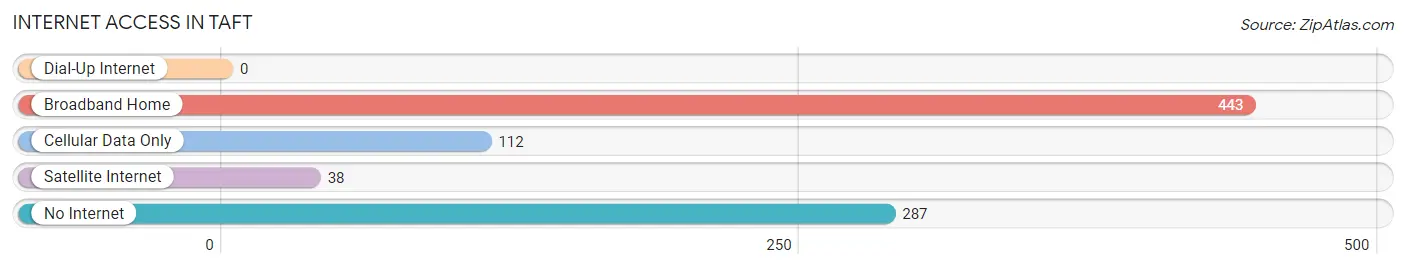
| Internet Type | # Households | % Households |
| Dial-Up Internet | 0 | 0.0% |
| Broadband Home | 443 | 51.6% |
| Cellular Data Only | 112 | 13.1% |
| Satellite Internet | 38 | 4.4% |
| No Internet | 287 | 33.5% |
| Total | 858 | 100.0% |
Taft Summary
Taft is a small city located in San Patricio County, Texas. It is situated on the Gulf Coast, approximately 30 miles south of Corpus Christi. The city has a population of approximately 3,000 people and is part of the Corpus Christi Metropolitan Statistical Area.
History
Taft was founded in 1909 by the Taft family, who had moved to the area from Illinois. The city was named after the family’s patriarch, William Howard Taft, who was the 27th President of the United States. The city was incorporated in 1911 and has remained a small, rural community ever since.
Geography
Taft is located in the Coastal Bend region of Texas, which is known for its flat terrain and sandy soils. The city is situated on the Gulf Coast, approximately 30 miles south of Corpus Christi. The city is bordered by the Nueces River to the east and the San Patricio County line to the west. The climate in Taft is subtropical, with hot summers and mild winters.
Economy
Taft’s economy is largely based on agriculture and oil and gas production. The city is home to several large oil and gas companies, including Chevron, ExxonMobil, and Valero. The city also has a thriving agricultural sector, with crops such as cotton, corn, and sorghum being grown in the area. In addition, Taft is home to several manufacturing companies, including a paper mill and a plastics plant.
Demographics
As of the 2010 census, Taft had a population of 3,048 people. The racial makeup of the city was 79.3% White, 0.7% African American, 0.3% Native American, 0.2% Asian, 0.1% Pacific Islander, 17.2% from other races, and 2.4% from two or more races. Hispanic or Latino of any race were 33.2% of the population.
The median household income in Taft was $31,250, and the median family income was $37,500. The per capita income for the city was $14,845. About 20.2% of families and 24.2% of the population were below the poverty line, including 33.3% of those under age 18 and 16.2% of those age 65 or over.
Taft is a small city with a rich history and a diverse population. The city’s economy is largely based on agriculture and oil and gas production, and the city is home to several large companies. The city has a population of approximately 3,000 people, and the median household income is $31,250. Taft is a great place to live and work, and it is a great example of the unique culture and history of the Coastal Bend region of Texas.
Common Questions
What is Per Capita Income in Taft?
Per Capita income in Taft is $20,915.
What is the Median Family Income in Taft?
Median Family Income in Taft is $68,446.
What is the Median Household income in Taft?
Median Household Income in Taft is $54,286.
What is Income or Wage Gap in Taft?
Income or Wage Gap in Taft is 56.7%.
Women in Taft earn 43.3 cents for every dollar earned by a man.
What is Inequality or Gini Index in Taft?
Inequality or Gini Index in Taft is 0.45.
What is the Total Population of Taft?
Total Population of Taft is 2,838.
What is the Total Male Population of Taft?
Total Male Population of Taft is 1,379.
What is the Total Female Population of Taft?
Total Female Population of Taft is 1,459.
What is the Ratio of Males per 100 Females in Taft?
There are 94.52 Males per 100 Females in Taft.
What is the Ratio of Females per 100 Males in Taft?
There are 105.80 Females per 100 Males in Taft.
What is the Median Population Age in Taft?
Median Population Age in Taft is 33.8 Years.
What is the Average Family Size in Taft
Average Family Size in Taft is 3.8 People.
What is the Average Household Size in Taft
Average Household Size in Taft is 3.3 People.
How Large is the Labor Force in Taft?
There are 1,110 People in the Labor Forcein in Taft.
What is the Percentage of People in the Labor Force in Taft?
54.0% of People are in the Labor Force in Taft.
What is the Unemployment Rate in Taft?
Unemployment Rate in Taft is 10.0%.