Portland, TX Map & Demographics
Portland Map
Portland Overview
$38,253
PER CAPITA INCOME
$93,950
AVG FAMILY INCOME
$83,493
AVG HOUSEHOLD INCOME
34.9%
WAGE / INCOME GAP [ % ]
65.1¢/ $1
WAGE / INCOME GAP [ $ ]
$17,005
FAMILY INCOME DEFICIT
0.41
INEQUALITY / GINI INDEX
20,130
TOTAL POPULATION
10,422
MALE POPULATION
9,708
FEMALE POPULATION
107.35
MALES / 100 FEMALES
93.15
FEMALES / 100 MALES
34.2
MEDIAN AGE
3.3
AVG FAMILY SIZE
2.8
AVG HOUSEHOLD SIZE
9,776
LABOR FORCE [ PEOPLE ]
64.2%
PERCENT IN LABOR FORCE
3.1%
UNEMPLOYMENT RATE
Portland Zip Codes
Portland Area Codes
Income in Portland
Income Overview in Portland
Per Capita Income in Portland is $38,253, while median incomes of families and households are $93,950 and $83,493 respectively.
| Characteristic | Number | Measure |
| Per Capita Income | 20,130 | $38,253 |
| Median Family Income | 5,319 | $93,950 |
| Mean Family Income | 5,319 | $112,944 |
| Median Household Income | 7,066 | $83,493 |
| Mean Household Income | 7,066 | $107,126 |
| Income Deficit | 5,319 | $17,005 |
| Wage / Income Gap (%) | 20,130 | 34.93% |
| Wage / Income Gap ($) | 20,130 | 65.07¢ per $1 |
| Gini / Inequality Index | 20,130 | 0.41 |
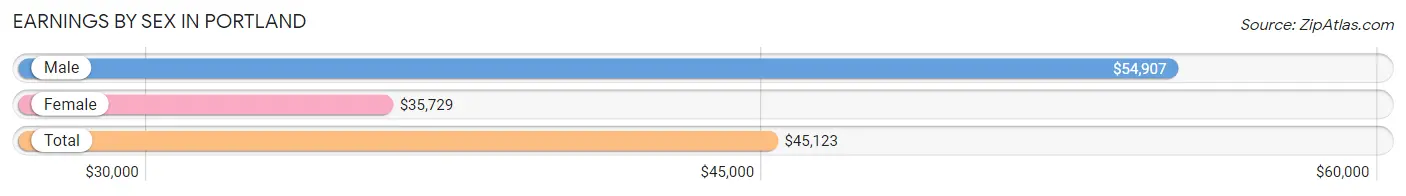
Earnings by Sex in Portland
Average Earnings in Portland are $45,123, $54,907 for men and $35,729 for women, a difference of 34.9%.
| Sex | Number | Average Earnings |
| Male | 6,106 (59.1%) | $54,907 |
| Female | 4,226 (40.9%) | $35,729 |
| Total | 10,332 (100.0%) | $45,123 |
Earnings by Sex by Income Bracket in Portland
The most common earnings brackets in Portland are $100,000+ for men (1,344 | 22.0%) and $65,000 to $74,999 for women (427 | 10.1%).
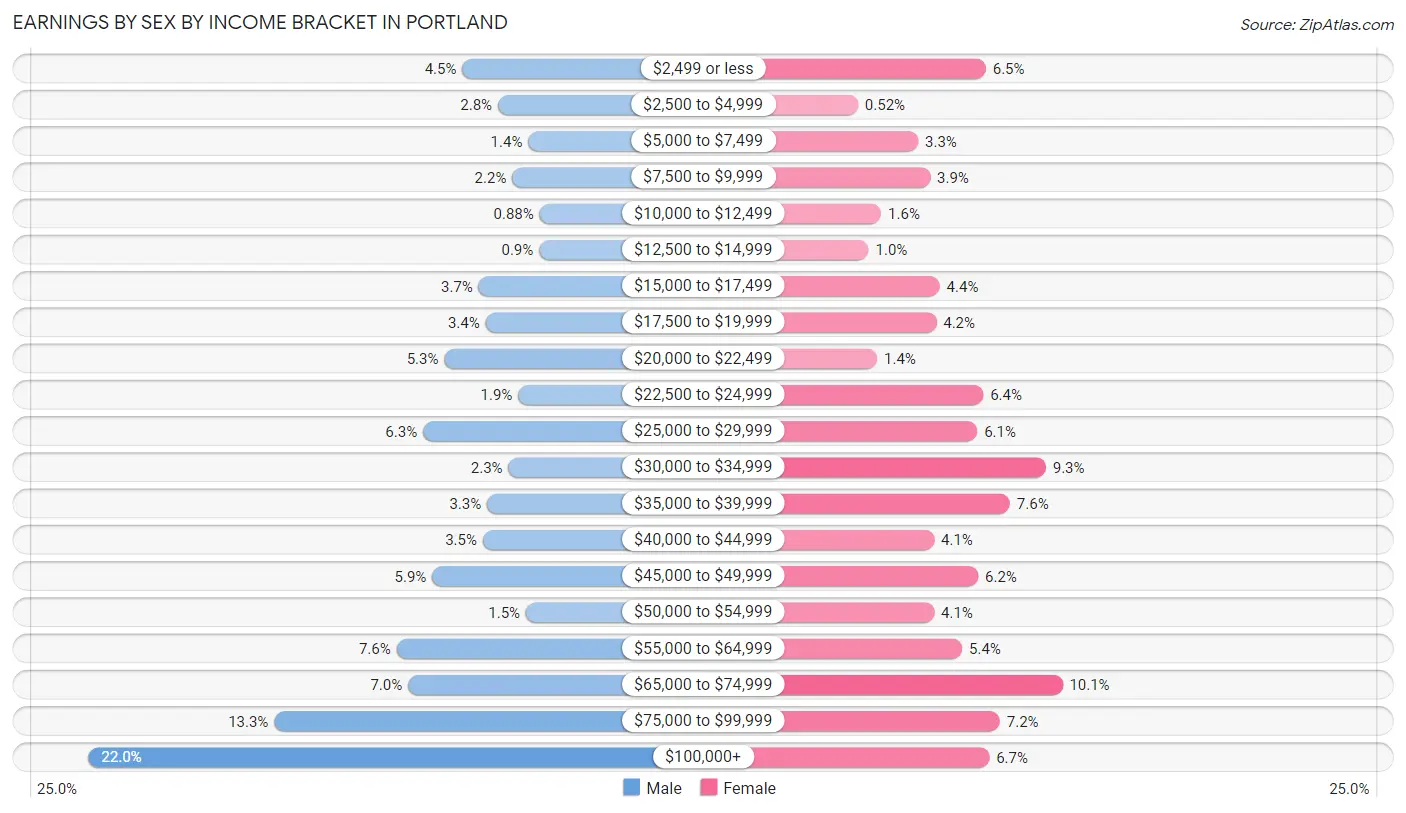
| Income | Male | Female |
| $2,499 or less | 275 (4.5%) | 275 (6.5%) |
| $2,500 to $4,999 | 173 (2.8%) | 22 (0.5%) |
| $5,000 to $7,499 | 86 (1.4%) | 141 (3.3%) |
| $7,500 to $9,999 | 132 (2.2%) | 165 (3.9%) |
| $10,000 to $12,499 | 54 (0.9%) | 68 (1.6%) |
| $12,500 to $14,999 | 55 (0.9%) | 43 (1.0%) |
| $15,000 to $17,499 | 228 (3.7%) | 184 (4.3%) |
| $17,500 to $19,999 | 208 (3.4%) | 177 (4.2%) |
| $20,000 to $22,499 | 326 (5.3%) | 60 (1.4%) |
| $22,500 to $24,999 | 115 (1.9%) | 270 (6.4%) |
| $25,000 to $29,999 | 387 (6.3%) | 258 (6.1%) |
| $30,000 to $34,999 | 143 (2.3%) | 394 (9.3%) |
| $35,000 to $39,999 | 204 (3.3%) | 323 (7.6%) |
| $40,000 to $44,999 | 216 (3.5%) | 173 (4.1%) |
| $45,000 to $49,999 | 361 (5.9%) | 260 (6.1%) |
| $50,000 to $54,999 | 93 (1.5%) | 173 (4.1%) |
| $55,000 to $64,999 | 463 (7.6%) | 228 (5.4%) |
| $65,000 to $74,999 | 430 (7.0%) | 427 (10.1%) |
| $75,000 to $99,999 | 813 (13.3%) | 303 (7.2%) |
| $100,000+ | 1,344 (22.0%) | 282 (6.7%) |
| Total | 6,106 (100.0%) | 4,226 (100.0%) |
Earnings by Sex by Educational Attainment in Portland
Average earnings in Portland are $65,106 for men and $38,426 for women, a difference of 41.0%. Men with an educational attainment of graduate degree enjoy the highest average annual earnings of $143,750, while those with less than high school education earn the least with $19,992. Women with an educational attainment of graduate degree earn the most with the average annual earnings of $72,984, while those with less than high school education have the smallest earnings of $11,176.
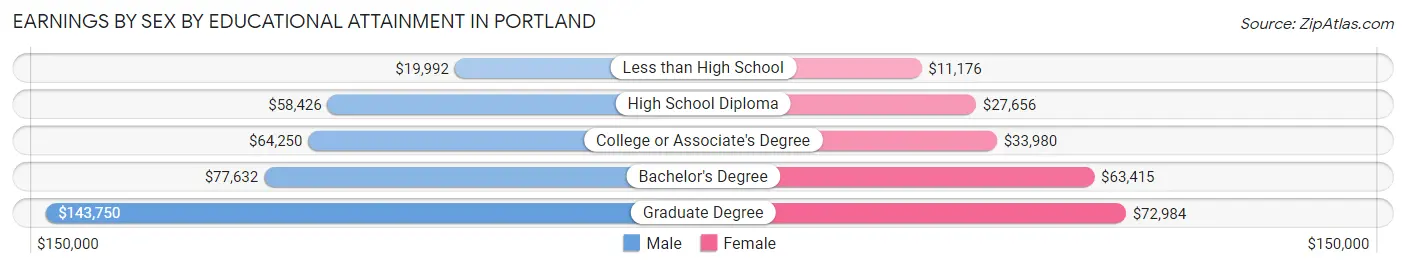
| Educational Attainment | Male Income | Female Income |
| Less than High School | $19,992 | $11,176 |
| High School Diploma | $58,426 | $27,656 |
| College or Associate's Degree | $64,250 | $33,980 |
| Bachelor's Degree | $77,632 | $63,415 |
| Graduate Degree | $143,750 | $72,984 |
| Total | $65,106 | $38,426 |
Family Income in Portland
Family Income Brackets in Portland
According to the Portland family income data, there are 1,128 families falling into the $100,000 to $149,999 income range, which is the most common income bracket and makes up 21.2% of all families. Conversely, the $10,000 to $14,999 income bracket is the least frequent group with only 90 families (1.7%) belonging to this category.
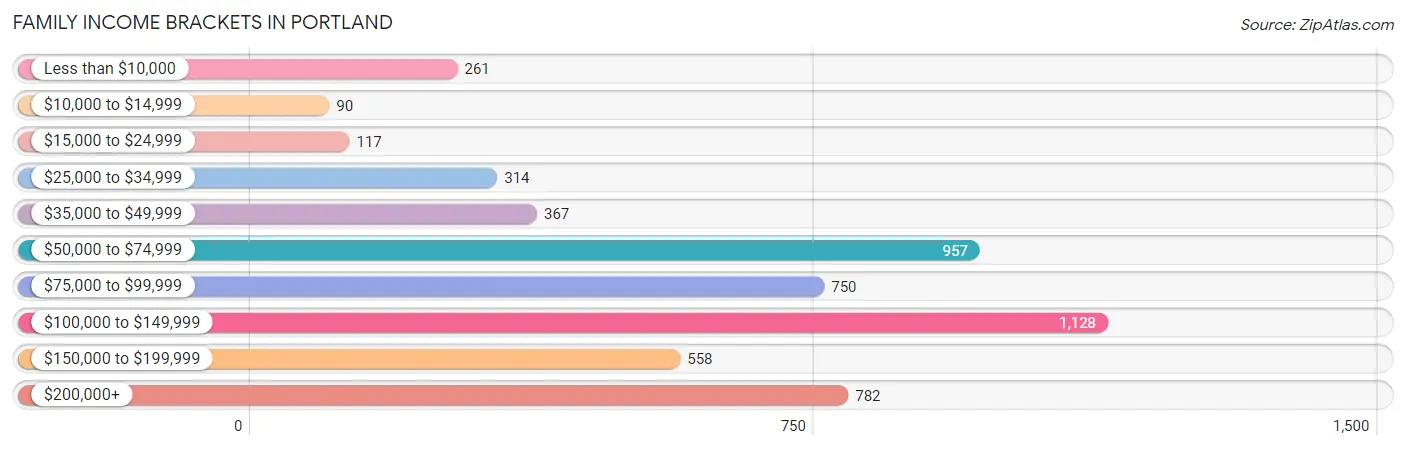
| Income Bracket | # Families | % Families |
| Less than $10,000 | 261 | 4.9% |
| $10,000 to $14,999 | 90 | 1.7% |
| $15,000 to $24,999 | 117 | 2.2% |
| $25,000 to $34,999 | 314 | 5.9% |
| $35,000 to $49,999 | 367 | 6.9% |
| $50,000 to $74,999 | 957 | 18.0% |
| $75,000 to $99,999 | 750 | 14.1% |
| $100,000 to $149,999 | 1,128 | 21.2% |
| $150,000 to $199,999 | 558 | 10.5% |
| $200,000+ | 782 | 14.7% |
Family Income by Famaliy Size in Portland
5-person families (573 | 10.8%) account for the highest median family income in Portland with $148,523 per family, while 2-person families (2,075 | 39.0%) have the highest median income of $41,112 per family member.
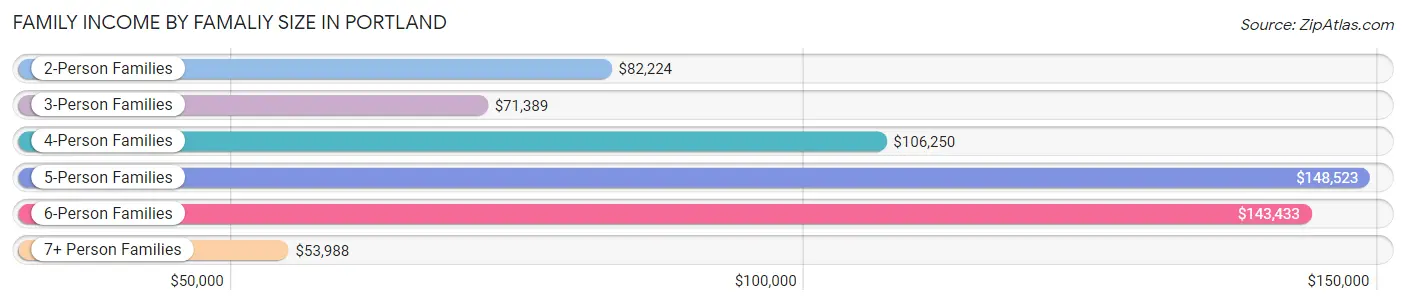
| Income Bracket | # Families | Median Income |
| 2-Person Families | 2,075 (39.0%) | $82,224 |
| 3-Person Families | 1,340 (25.2%) | $71,389 |
| 4-Person Families | 996 (18.7%) | $106,250 |
| 5-Person Families | 573 (10.8%) | $148,523 |
| 6-Person Families | 216 (4.1%) | $143,433 |
| 7+ Person Families | 119 (2.2%) | $53,988 |
| Total | 5,319 (100.0%) | $93,950 |
Family Income by Number of Earners in Portland
The median family income in Portland is $93,950, with families comprising 3+ earners (539) having the highest median family income of $142,708, while families with no earners (754) have the lowest median family income of $46,768, accounting for 10.1% and 14.2% of families, respectively.
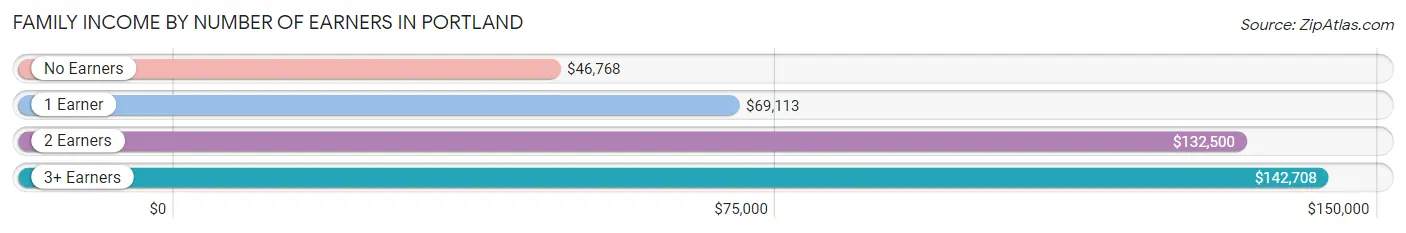
| Number of Earners | # Families | Median Income |
| No Earners | 754 (14.2%) | $46,768 |
| 1 Earner | 1,644 (30.9%) | $69,113 |
| 2 Earners | 2,382 (44.8%) | $132,500 |
| 3+ Earners | 539 (10.1%) | $142,708 |
| Total | 5,319 (100.0%) | $93,950 |
Household Income in Portland
Household Income Brackets in Portland
With 1,371 households falling in the category, the $50,000 to $74,999 income range is the most frequent in Portland, accounting for 19.4% of all households. In contrast, only 184 households (2.6%) fall into the $15,000 to $24,999 income bracket, making it the least populous group.
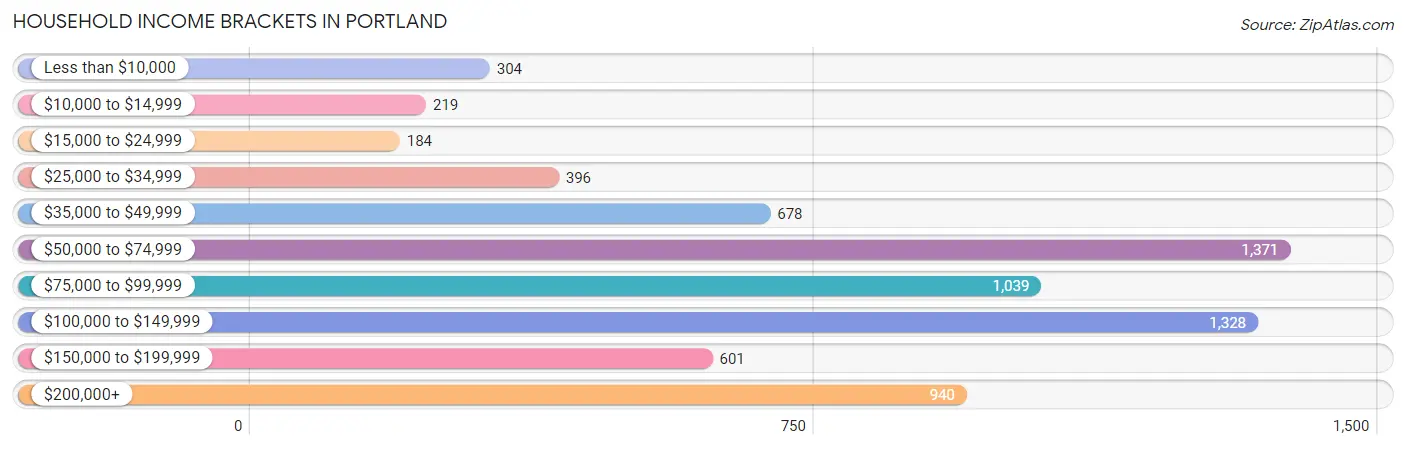
| Income Bracket | # Households | % Households |
| Less than $10,000 | 304 | 4.3% |
| $10,000 to $14,999 | 219 | 3.1% |
| $15,000 to $24,999 | 184 | 2.6% |
| $25,000 to $34,999 | 396 | 5.6% |
| $35,000 to $49,999 | 678 | 9.6% |
| $50,000 to $74,999 | 1,371 | 19.4% |
| $75,000 to $99,999 | 1,039 | 14.7% |
| $100,000 to $149,999 | 1,328 | 18.8% |
| $150,000 to $199,999 | 601 | 8.5% |
| $200,000+ | 940 | 13.3% |
Household Income by Householder Age in Portland
The median household income in Portland is $83,493, with the highest median household income of $97,188 found in the 45 to 64 years age bracket for the primary householder. A total of 2,468 households (34.9%) fall into this category. Meanwhile, the 15 to 24 years age bracket for the primary householder has the lowest median household income of $0, with 143 households (2.0%) in this group.
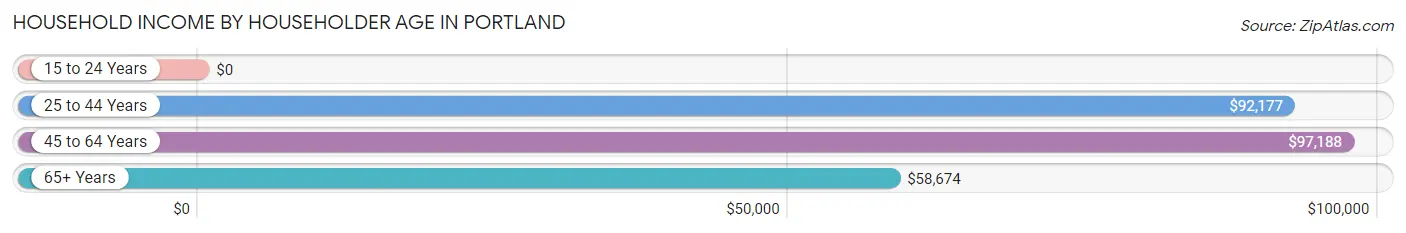
| Income Bracket | # Households | Median Income |
| 15 to 24 Years | 143 (2.0%) | $0 |
| 25 to 44 Years | 2,790 (39.5%) | $92,177 |
| 45 to 64 Years | 2,468 (34.9%) | $97,188 |
| 65+ Years | 1,665 (23.6%) | $58,674 |
| Total | 7,066 (100.0%) | $83,493 |
Poverty in Portland
Income Below Poverty by Sex and Age in Portland
With 8.1% poverty level for males and 11.3% for females among the residents of Portland, under 5 year old males and 6 to 11 year old females are the most vulnerable to poverty, with 232 males (31.3%) and 197 females (26.2%) in their respective age groups living below the poverty level.
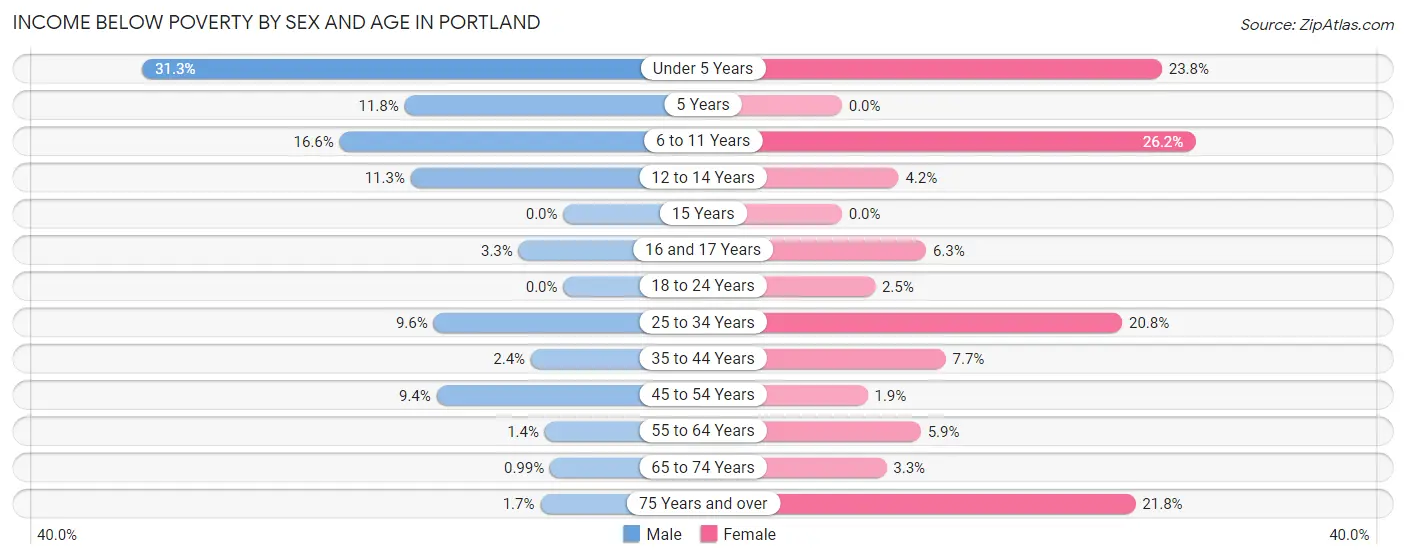
| Age Bracket | Male | Female |
| Under 5 Years | 232 (31.3%) | 168 (23.8%) |
| 5 Years | 25 (11.8%) | 0 (0.0%) |
| 6 to 11 Years | 208 (16.6%) | 197 (26.2%) |
| 12 to 14 Years | 40 (11.3%) | 20 (4.2%) |
| 15 Years | 0 (0.0%) | 0 (0.0%) |
| 16 and 17 Years | 7 (3.3%) | 8 (6.2%) |
| 18 to 24 Years | 0 (0.0%) | 18 (2.5%) |
| 25 to 34 Years | 164 (9.6%) | 304 (20.8%) |
| 35 to 44 Years | 32 (2.4%) | 117 (7.7%) |
| 45 to 54 Years | 104 (9.4%) | 23 (1.9%) |
| 55 to 64 Years | 13 (1.4%) | 56 (5.9%) |
| 65 to 74 Years | 8 (1.0%) | 25 (3.3%) |
| 75 Years and over | 7 (1.7%) | 150 (21.8%) |
| Total | 840 (8.1%) | 1,086 (11.3%) |
Income Above Poverty by Sex and Age in Portland
According to the poverty statistics in Portland, males aged 15 years and females aged 5 years are the age groups that are most secure financially, with 100.0% of males and 100.0% of females in these age groups living above the poverty line.
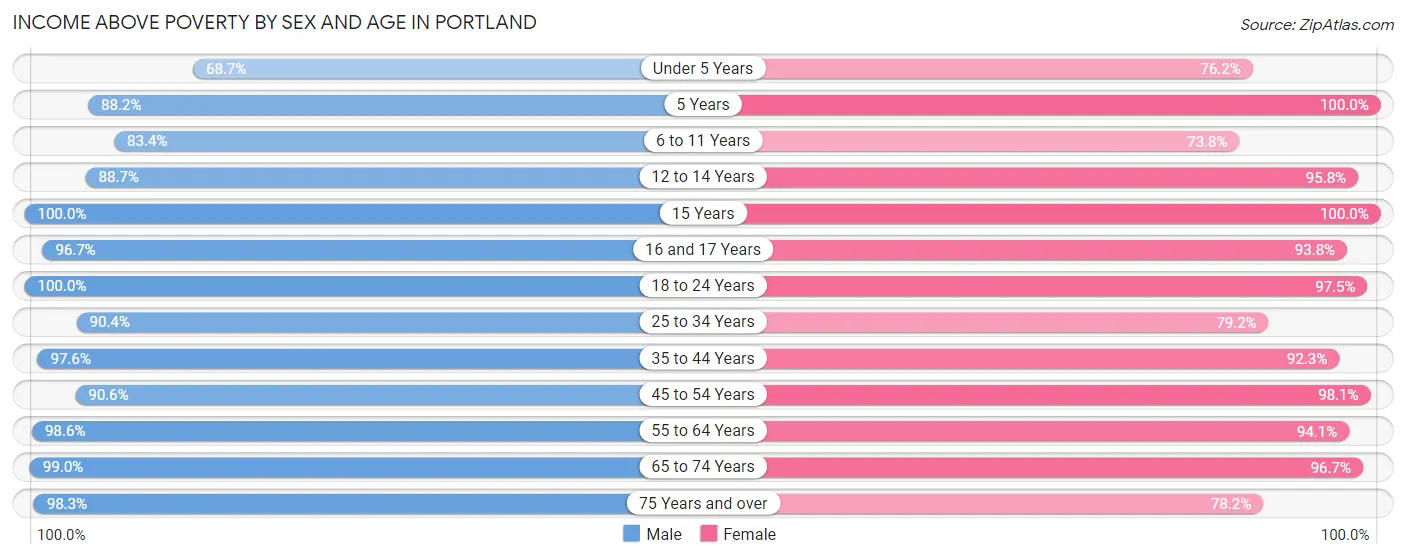
| Age Bracket | Male | Female |
| Under 5 Years | 510 (68.7%) | 539 (76.2%) |
| 5 Years | 187 (88.2%) | 106 (100.0%) |
| 6 to 11 Years | 1,044 (83.4%) | 554 (73.8%) |
| 12 to 14 Years | 313 (88.7%) | 455 (95.8%) |
| 15 Years | 112 (100.0%) | 172 (100.0%) |
| 16 and 17 Years | 204 (96.7%) | 120 (93.8%) |
| 18 to 24 Years | 1,201 (100.0%) | 713 (97.5%) |
| 25 to 34 Years | 1,538 (90.4%) | 1,157 (79.2%) |
| 35 to 44 Years | 1,296 (97.6%) | 1,400 (92.3%) |
| 45 to 54 Years | 1,001 (90.6%) | 1,180 (98.1%) |
| 55 to 64 Years | 930 (98.6%) | 900 (94.1%) |
| 65 to 74 Years | 799 (99.0%) | 730 (96.7%) |
| 75 Years and over | 402 (98.3%) | 538 (78.2%) |
| Total | 9,537 (91.9%) | 8,564 (88.7%) |
Income Below Poverty Among Married-Couple Families in Portland
The poverty statistics for married-couple families in Portland show that 2.5% or 96 of the total 3,859 families live below the poverty line. Families with 1 or 2 children have the highest poverty rate of 5.7%, comprising of 71 families. On the other hand, families with no children have the lowest poverty rate of 0.0%, which includes 0 families.
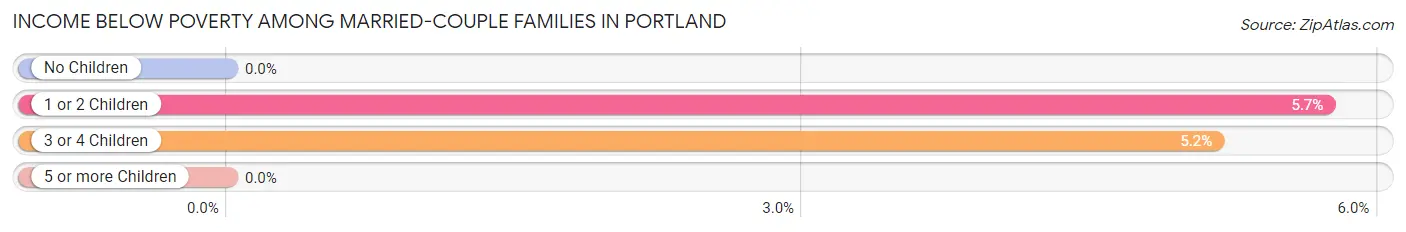
| Children | Above Poverty | Below Poverty |
| No Children | 2,128 (100.0%) | 0 (0.0%) |
| 1 or 2 Children | 1,169 (94.3%) | 71 (5.7%) |
| 3 or 4 Children | 460 (94.9%) | 25 (5.1%) |
| 5 or more Children | 6 (100.0%) | 0 (0.0%) |
| Total | 3,763 (97.5%) | 96 (2.5%) |
Income Below Poverty Among Single-Parent Households in Portland
According to the poverty data in Portland, 9.6% or 31 single-father households and 28.1% or 319 single-mother households are living below the poverty line. Among single-father households, those with 3 or 4 children have the highest poverty rate, with 8 households (16.3%) experiencing poverty. Likewise, among single-mother households, those with 3 or 4 children have the highest poverty rate, with 122 households (45.2%) falling below the poverty line.
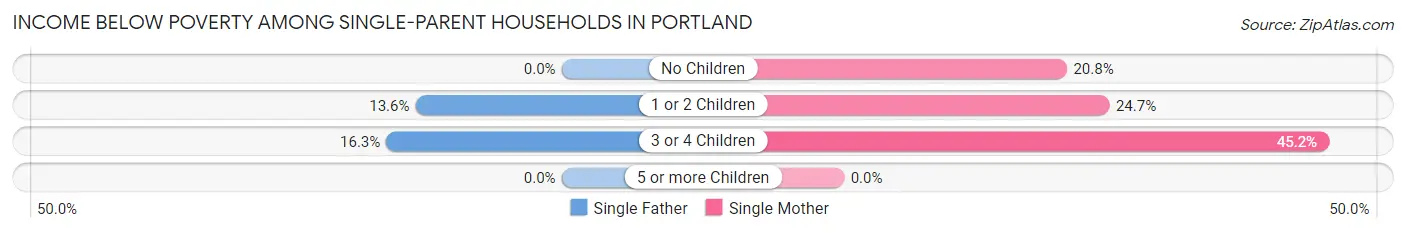
| Children | Single Father | Single Mother |
| No Children | 0 (0.0%) | 89 (20.7%) |
| 1 or 2 Children | 23 (13.6%) | 108 (24.7%) |
| 3 or 4 Children | 8 (16.3%) | 122 (45.2%) |
| 5 or more Children | 0 (0.0%) | 0 (0.0%) |
| Total | 31 (9.6%) | 319 (28.1%) |
Income Below Poverty Among Married-Couple vs Single-Parent Households in Portland
The poverty data for Portland shows that 96 of the married-couple family households (2.5%) and 350 of the single-parent households (24.0%) are living below the poverty level. Within the married-couple family households, those with 1 or 2 children have the highest poverty rate, with 71 households (5.7%) falling below the poverty line. Among the single-parent households, those with 3 or 4 children have the highest poverty rate, with 130 household (40.7%) living below poverty.
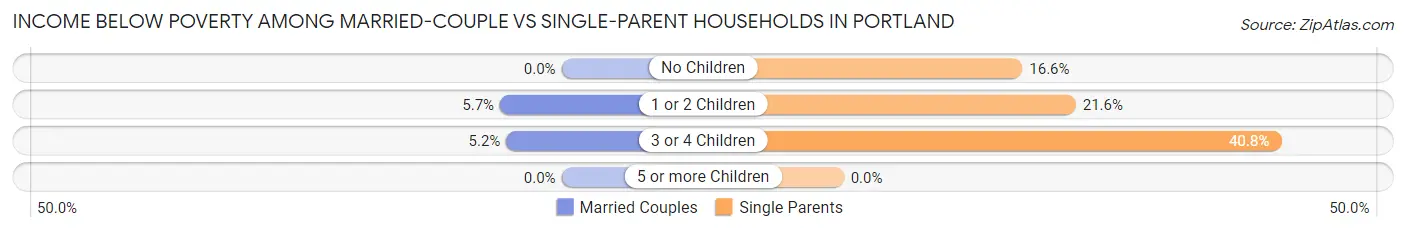
| Children | Married-Couple Families | Single-Parent Households |
| No Children | 0 (0.0%) | 89 (16.6%) |
| 1 or 2 Children | 71 (5.7%) | 131 (21.6%) |
| 3 or 4 Children | 25 (5.1%) | 130 (40.7%) |
| 5 or more Children | 0 (0.0%) | 0 (0.0%) |
| Total | 96 (2.5%) | 350 (24.0%) |
Race in Portland
The most populous races in Portland are White / Caucasian (15,500 | 77.0%), Hispanic or Latino (8,794 | 43.7%), and Two or more Races (3,042 | 15.1%).
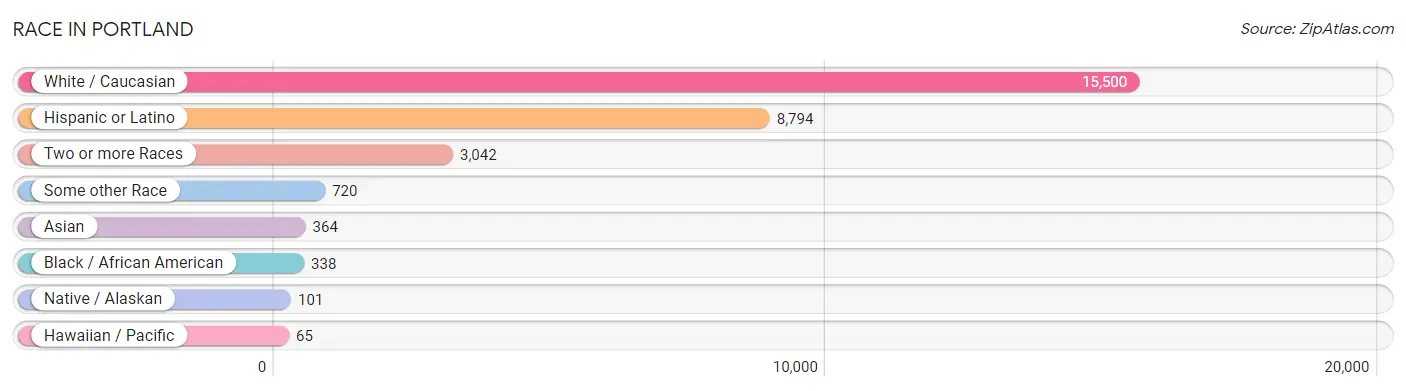
| Race | # Population | % Population |
| Asian | 364 | 1.8% |
| Black / African American | 338 | 1.7% |
| Hawaiian / Pacific | 65 | 0.3% |
| Hispanic or Latino | 8,794 | 43.7% |
| Native / Alaskan | 101 | 0.5% |
| White / Caucasian | 15,500 | 77.0% |
| Two or more Races | 3,042 | 15.1% |
| Some other Race | 720 | 3.6% |
| Total | 20,130 | 100.0% |
Ancestry in Portland
The most populous ancestries reported in Portland are Mexican (7,575 | 37.6%), German (2,427 | 12.1%), English (2,374 | 11.8%), Irish (1,624 | 8.1%), and American (787 | 3.9%), together accounting for 73.5% of all Portland residents.
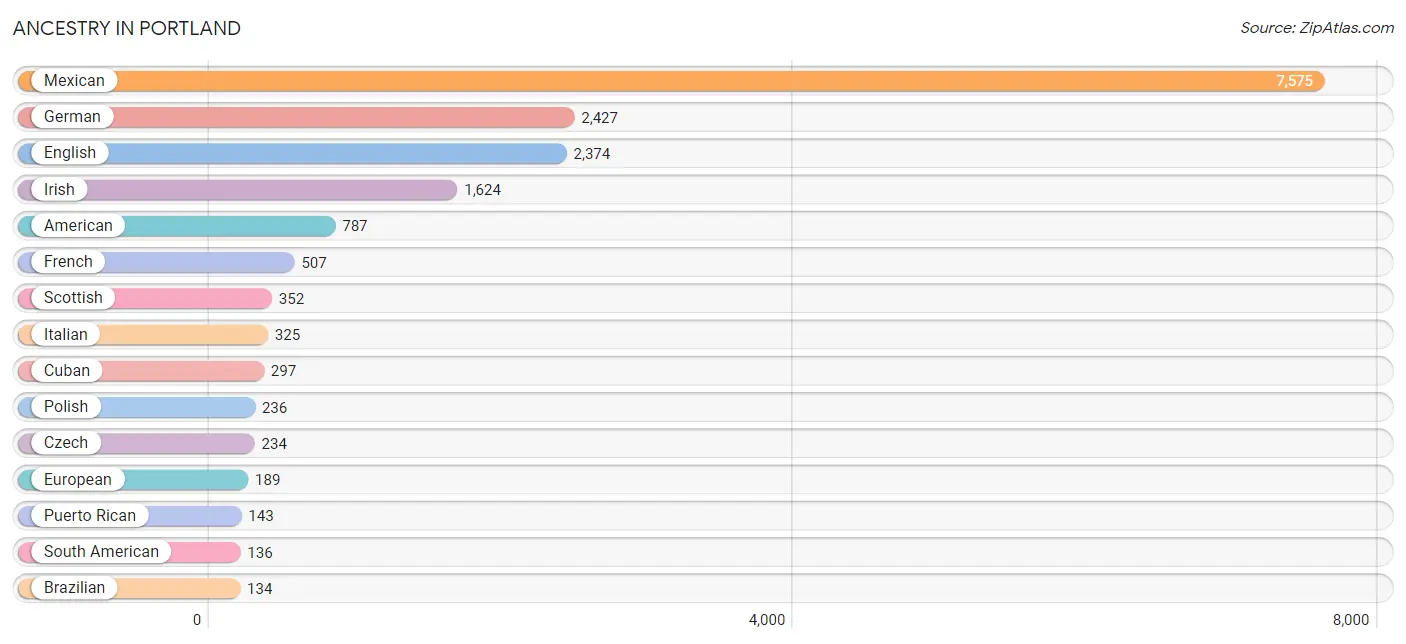
| Ancestry | # Population | % Population |
| Afghan | 25 | 0.1% |
| African | 26 | 0.1% |
| American | 787 | 3.9% |
| Apache | 31 | 0.2% |
| Arab | 3 | 0.0% |
| Argentinean | 44 | 0.2% |
| Austrian | 38 | 0.2% |
| Barbadian | 17 | 0.1% |
| Belgian | 21 | 0.1% |
| Bhutanese | 59 | 0.3% |
| Brazilian | 134 | 0.7% |
| British | 22 | 0.1% |
| Burmese | 18 | 0.1% |
| Cajun | 47 | 0.2% |
| Canadian | 26 | 0.1% |
| Celtic | 16 | 0.1% |
| Central American | 8 | 0.0% |
| Central American Indian | 57 | 0.3% |
| Cherokee | 15 | 0.1% |
| Chilean | 35 | 0.2% |
| Choctaw | 9 | 0.0% |
| Colombian | 51 | 0.3% |
| Croatian | 8 | 0.0% |
| Cuban | 297 | 1.5% |
| Czech | 234 | 1.2% |
| Czechoslovakian | 19 | 0.1% |
| Danish | 77 | 0.4% |
| Dutch | 128 | 0.6% |
| Eastern European | 21 | 0.1% |
| English | 2,374 | 11.8% |
| European | 189 | 0.9% |
| Filipino | 55 | 0.3% |
| Finnish | 61 | 0.3% |
| French | 507 | 2.5% |
| French Canadian | 76 | 0.4% |
| German | 2,427 | 12.1% |
| Greek | 46 | 0.2% |
| Guamanian / Chamorro | 54 | 0.3% |
| Hungarian | 43 | 0.2% |
| Indian (Asian) | 18 | 0.1% |
| Irish | 1,624 | 8.1% |
| Italian | 325 | 1.6% |
| Jamaican | 15 | 0.1% |
| Korean | 72 | 0.4% |
| Lebanese | 3 | 0.0% |
| Malaysian | 44 | 0.2% |
| Mexican | 7,575 | 37.6% |
| Mexican American Indian | 56 | 0.3% |
| Navajo | 54 | 0.3% |
| Nigerian | 6 | 0.0% |
| Northern European | 14 | 0.1% |
| Norwegian | 106 | 0.5% |
| Pakistani | 40 | 0.2% |
| Peruvian | 6 | 0.0% |
| Polish | 236 | 1.2% |
| Portuguese | 9 | 0.0% |
| Puerto Rican | 143 | 0.7% |
| Russian | 12 | 0.1% |
| Salvadoran | 8 | 0.0% |
| Samoan | 119 | 0.6% |
| Scandinavian | 72 | 0.4% |
| Scotch-Irish | 93 | 0.5% |
| Scottish | 352 | 1.8% |
| Slovak | 24 | 0.1% |
| South American | 136 | 0.7% |
| Spaniard | 79 | 0.4% |
| Spanish | 68 | 0.3% |
| Sri Lankan | 43 | 0.2% |
| Subsaharan African | 32 | 0.2% |
| Swedish | 102 | 0.5% |
| Swiss | 28 | 0.1% |
| Thai | 52 | 0.3% |
| Ukrainian | 87 | 0.4% |
| Welsh | 69 | 0.3% |
| West Indian | 4 | 0.0% | View All 75 Rows |
Immigrants in Portland
The most numerous immigrant groups reported in Portland came from Latin America (795 | 4.0%), Caribbean (346 | 1.7%), Cuba (297 | 1.5%), South America (255 | 1.3%), and Central America (194 | 1.0%), together accounting for 9.4% of all Portland residents.
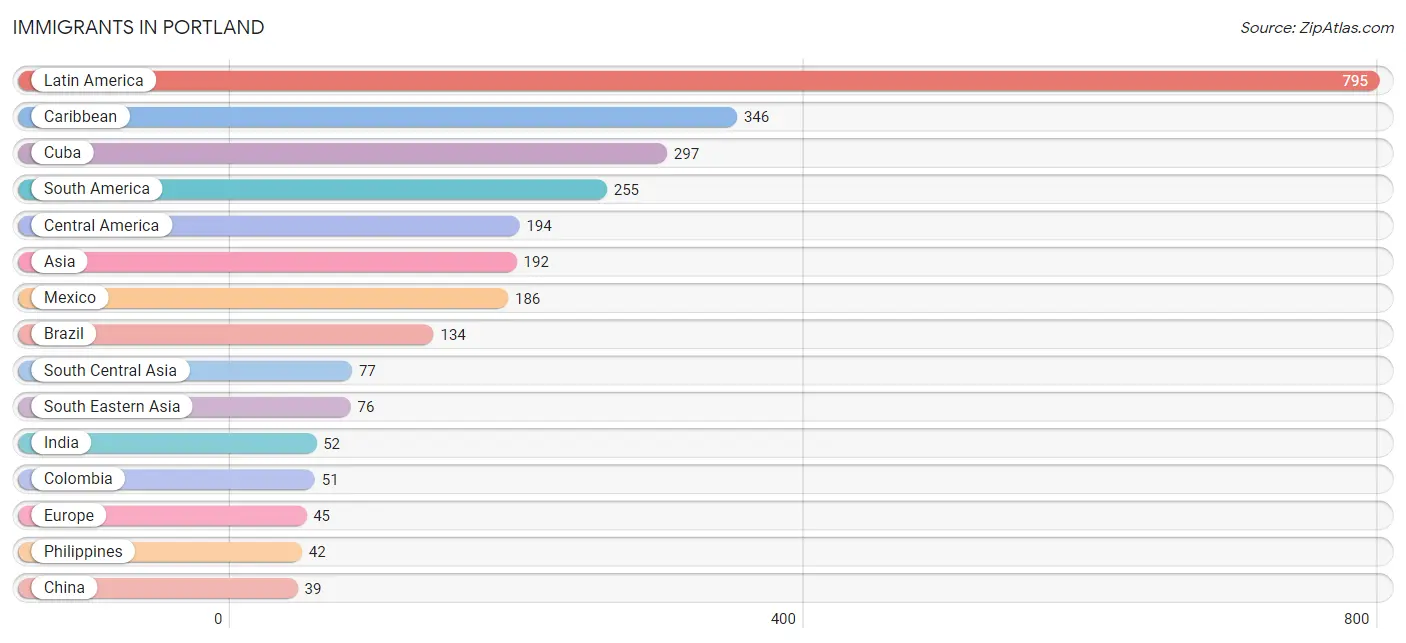
| Immigration Origin | # Population | % Population |
| Afghanistan | 25 | 0.1% |
| Argentina | 29 | 0.1% |
| Asia | 192 | 0.9% |
| Brazil | 134 | 0.7% |
| Canada | 19 | 0.1% |
| Caribbean | 346 | 1.7% |
| Central America | 194 | 1.0% |
| Chile | 35 | 0.2% |
| China | 39 | 0.2% |
| Colombia | 51 | 0.3% |
| Cuba | 297 | 1.5% |
| Eastern Asia | 39 | 0.2% |
| Eastern Europe | 7 | 0.0% |
| El Salvador | 8 | 0.0% |
| Europe | 45 | 0.2% |
| Germany | 8 | 0.0% |
| Hong Kong | 8 | 0.0% |
| India | 52 | 0.3% |
| Italy | 12 | 0.1% |
| Jamaica | 15 | 0.1% |
| Laos | 12 | 0.1% |
| Latin America | 795 | 4.0% |
| Mexico | 186 | 0.9% |
| Northern Europe | 18 | 0.1% |
| Peru | 6 | 0.0% |
| Philippines | 42 | 0.2% |
| Scotland | 10 | 0.1% |
| Singapore | 6 | 0.0% |
| South America | 255 | 1.3% |
| South Central Asia | 77 | 0.4% |
| South Eastern Asia | 76 | 0.4% |
| Southern Europe | 12 | 0.1% |
| Taiwan | 31 | 0.2% |
| Trinidad and Tobago | 34 | 0.2% |
| Ukraine | 7 | 0.0% |
| Vietnam | 16 | 0.1% |
| Western Europe | 8 | 0.0% | View All 37 Rows |
Sex and Age in Portland
Sex and Age in Portland
The most populous age groups in Portland are 30 to 34 Years (1,046 | 10.0%) for men and 40 to 44 Years (868 | 8.9%) for women.
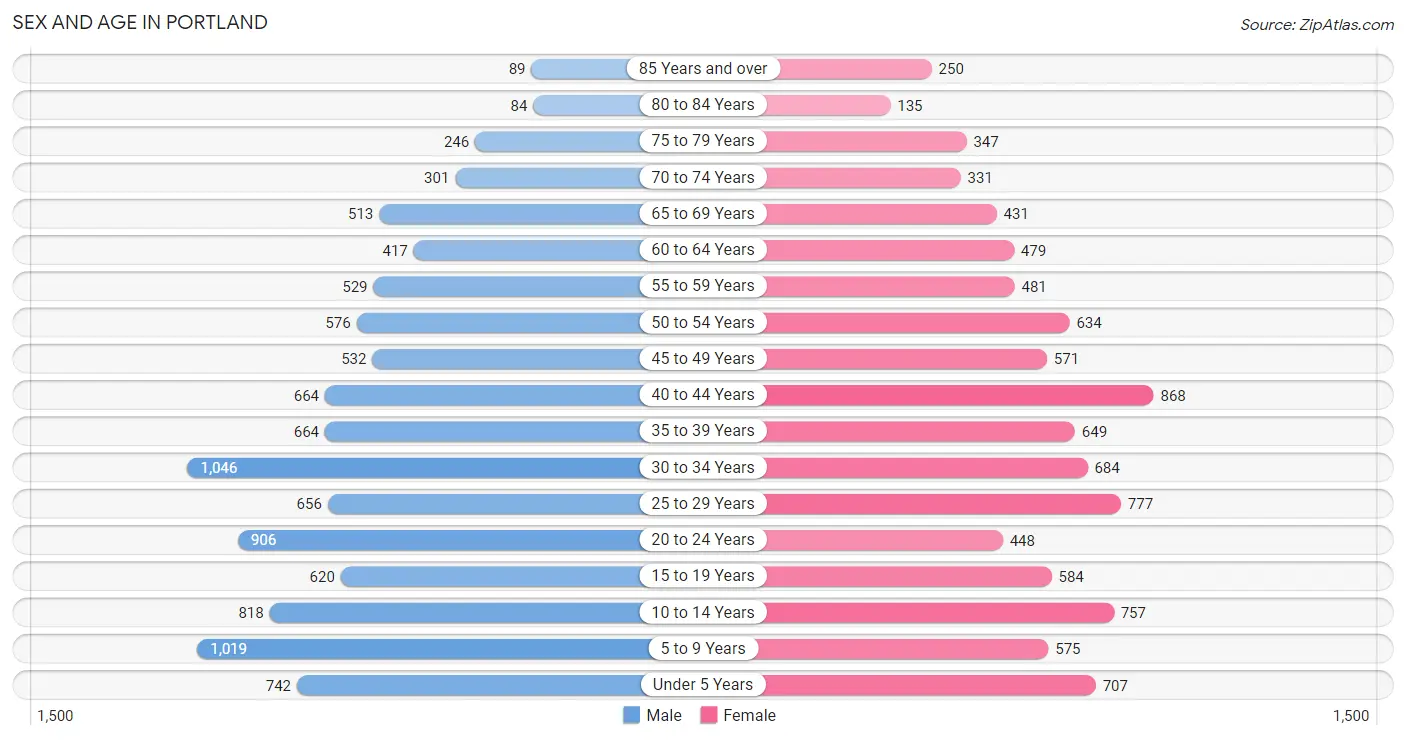
| Age Bracket | Male | Female |
| Under 5 Years | 742 (7.1%) | 707 (7.3%) |
| 5 to 9 Years | 1,019 (9.8%) | 575 (5.9%) |
| 10 to 14 Years | 818 (7.9%) | 757 (7.8%) |
| 15 to 19 Years | 620 (5.9%) | 584 (6.0%) |
| 20 to 24 Years | 906 (8.7%) | 448 (4.6%) |
| 25 to 29 Years | 656 (6.3%) | 777 (8.0%) |
| 30 to 34 Years | 1,046 (10.0%) | 684 (7.0%) |
| 35 to 39 Years | 664 (6.4%) | 649 (6.7%) |
| 40 to 44 Years | 664 (6.4%) | 868 (8.9%) |
| 45 to 49 Years | 532 (5.1%) | 571 (5.9%) |
| 50 to 54 Years | 576 (5.5%) | 634 (6.5%) |
| 55 to 59 Years | 529 (5.1%) | 481 (5.0%) |
| 60 to 64 Years | 417 (4.0%) | 479 (4.9%) |
| 65 to 69 Years | 513 (4.9%) | 431 (4.4%) |
| 70 to 74 Years | 301 (2.9%) | 331 (3.4%) |
| 75 to 79 Years | 246 (2.4%) | 347 (3.6%) |
| 80 to 84 Years | 84 (0.8%) | 135 (1.4%) |
| 85 Years and over | 89 (0.9%) | 250 (2.6%) |
| Total | 10,422 (100.0%) | 9,708 (100.0%) |
Families and Households in Portland
Median Family Size in Portland
The median family size in Portland is 3.31 persons per family, with single male/father families (324 | 6.1%) accounting for the largest median family size of 3.81 persons per family. On the other hand, married-couple families (3,859 | 72.6%) represent the smallest median family size with 3.27 persons per family.
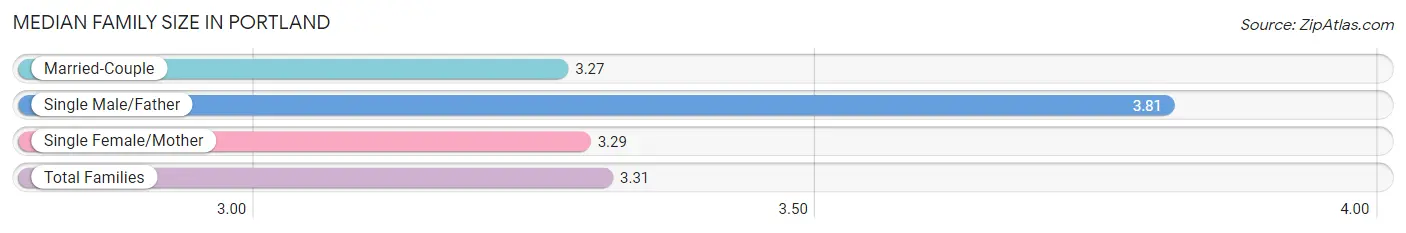
| Family Type | # Families | Family Size |
| Married-Couple | 3,859 (72.6%) | 3.27 |
| Single Male/Father | 324 (6.1%) | 3.81 |
| Single Female/Mother | 1,136 (21.4%) | 3.29 |
| Total Families | 5,319 (100.0%) | 3.31 |
Median Household Size in Portland
The median household size in Portland is 2.84 persons per household, with single male/father households (324 | 4.6%) accounting for the largest median household size of 4.04 persons per household. non-family households (1,747 | 24.7%) represent the smallest median household size with 1.26 persons per household.
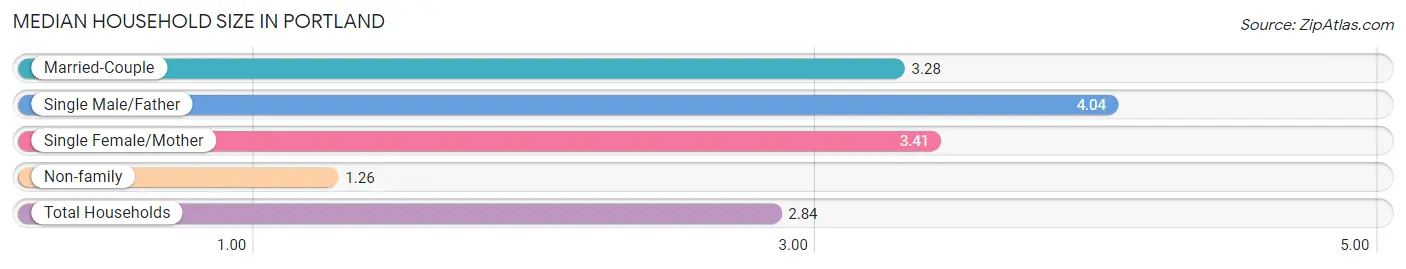
| Household Type | # Households | Household Size |
| Married-Couple | 3,859 (54.6%) | 3.28 |
| Single Male/Father | 324 (4.6%) | 4.04 |
| Single Female/Mother | 1,136 (16.1%) | 3.41 |
| Non-family | 1,747 (24.7%) | 1.26 |
| Total Households | 7,066 (100.0%) | 2.84 |
Household Size by Marriage Status in Portland
Out of a total of 7,066 households in Portland, 5,319 (75.3%) are family households, while 1,747 (24.7%) are nonfamily households. The most numerous type of family households are 2-person households, comprising 1,989, and the most common type of nonfamily households are 1-person households, comprising 1,442.
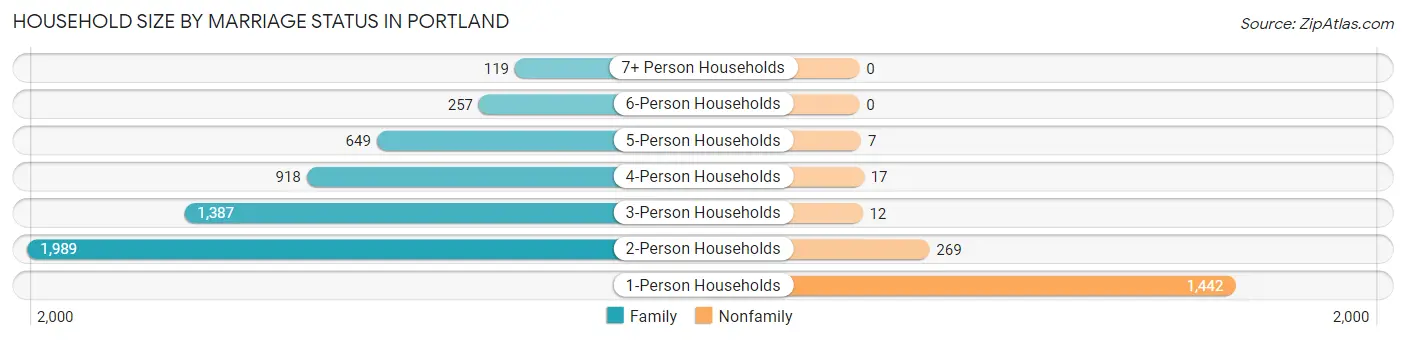
| Household Size | Family Households | Nonfamily Households |
| 1-Person Households | - | 1,442 (20.4%) |
| 2-Person Households | 1,989 (28.1%) | 269 (3.8%) |
| 3-Person Households | 1,387 (19.6%) | 12 (0.2%) |
| 4-Person Households | 918 (13.0%) | 17 (0.2%) |
| 5-Person Households | 649 (9.2%) | 7 (0.1%) |
| 6-Person Households | 257 (3.6%) | 0 (0.0%) |
| 7+ Person Households | 119 (1.7%) | 0 (0.0%) |
| Total | 5,319 (75.3%) | 1,747 (24.7%) |
Female Fertility in Portland
Fertility by Age in Portland
Average fertility rate in Portland is 76.0 births per 1,000 women. Women in the age bracket of 15 to 19 years have the highest fertility rate with 116.0 births per 1,000 women. Women in the age bracket of 20 to 34 years acount for 61.8% of all women with births.
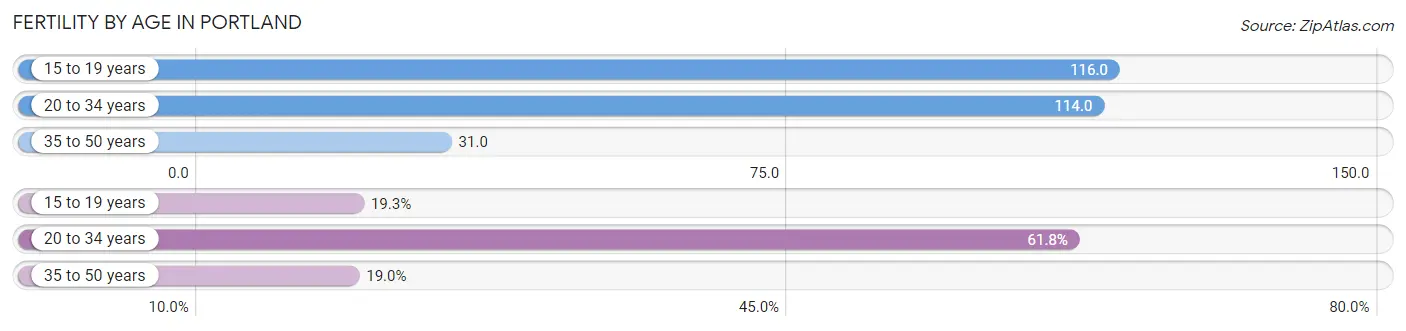
| Age Bracket | Women with Births | Births / 1,000 Women |
| 15 to 19 years | 68 (19.3%) | 116.0 |
| 20 to 34 years | 218 (61.8%) | 114.0 |
| 35 to 50 years | 67 (19.0%) | 31.0 |
| Total | 353 (100.0%) | 76.0 |
Fertility by Age by Marriage Status in Portland
93.2% of women with births (353) in Portland are married. The highest percentage of unmarried women with births falls into 35 to 50 years age bracket with 17.9% of them unmarried at the time of birth, while the lowest percentage of unmarried women with births belong to 15 to 19 years age bracket with 0.0% of them unmarried.
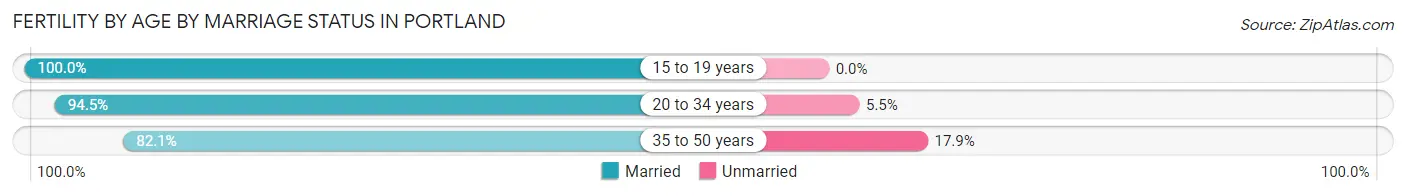
| Age Bracket | Married | Unmarried |
| 15 to 19 years | 68 (100.0%) | 0 (0.0%) |
| 20 to 34 years | 206 (94.5%) | 12 (5.5%) |
| 35 to 50 years | 55 (82.1%) | 12 (17.9%) |
| Total | 329 (93.2%) | 24 (6.8%) |
Fertility by Education in Portland
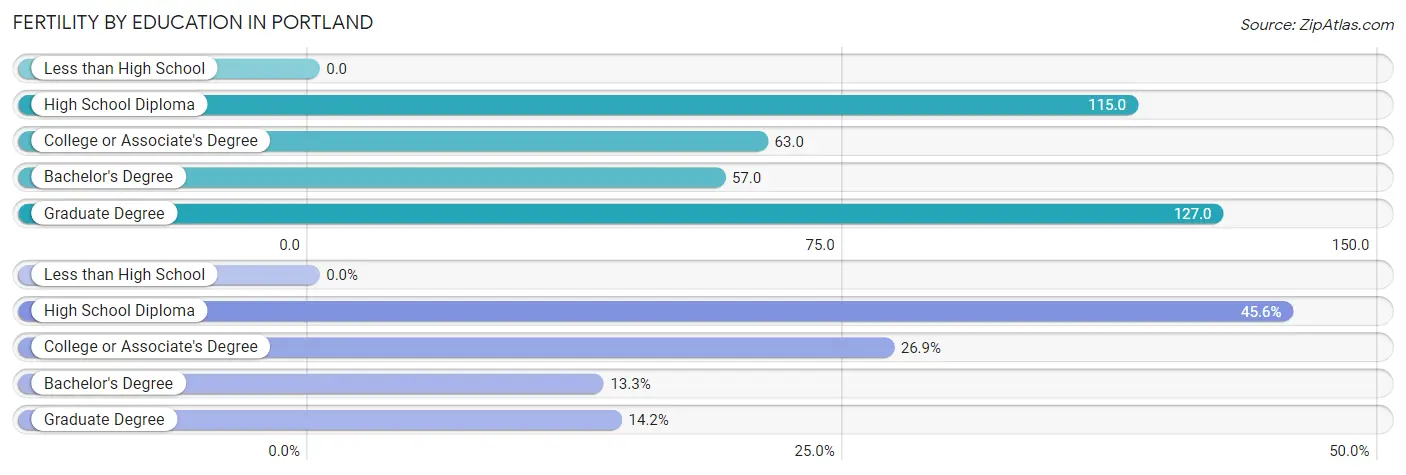
| Educational Attainment | Women with Births | Births / 1,000 Women |
| Less than High School | 0 (0.0%) | 0.0 |
| High School Diploma | 161 (45.6%) | 115.0 |
| College or Associate's Degree | 95 (26.9%) | 63.0 |
| Bachelor's Degree | 47 (13.3%) | 57.0 |
| Graduate Degree | 50 (14.2%) | 127.0 |
| Total | 353 (100.0%) | 76.0 |
Fertility by Education by Marriage Status in Portland
6.8% of women with births in Portland are unmarried. Women with the educational attainment of high school diploma are most likely to be married with 100.0% of them married at childbirth, while women with the educational attainment of graduate degree are least likely to be married with 24.0% of them unmarried at childbirth.
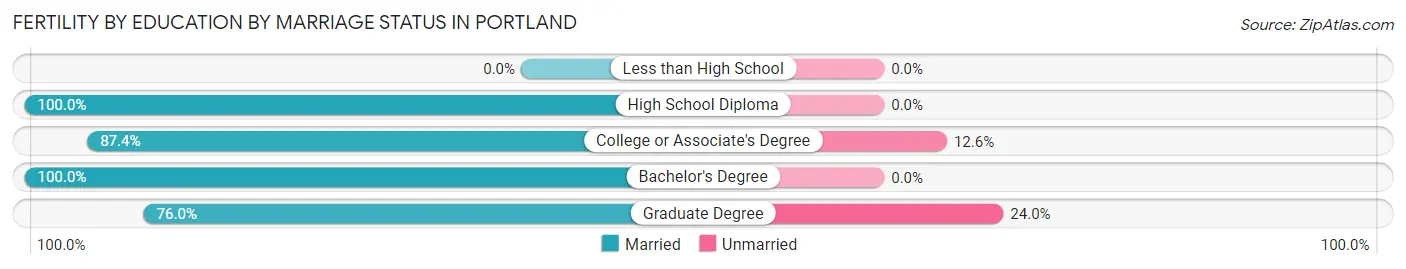
| Educational Attainment | Married | Unmarried |
| Less than High School | 0 (0.0%) | 0 (0.0%) |
| High School Diploma | 161 (100.0%) | 0 (0.0%) |
| College or Associate's Degree | 83 (87.4%) | 12 (12.6%) |
| Bachelor's Degree | 47 (100.0%) | 0 (0.0%) |
| Graduate Degree | 38 (76.0%) | 12 (24.0%) |
| Total | 329 (93.2%) | 24 (6.8%) |
Employment Characteristics in Portland
Employment by Class of Employer in Portland
Among the 9,272 employed individuals in Portland, private company employees (6,646 | 71.7%), local government employees (709 | 7.6%), and self-employed (not incorporated) (576 | 6.2%) make up the most common classes of employment.
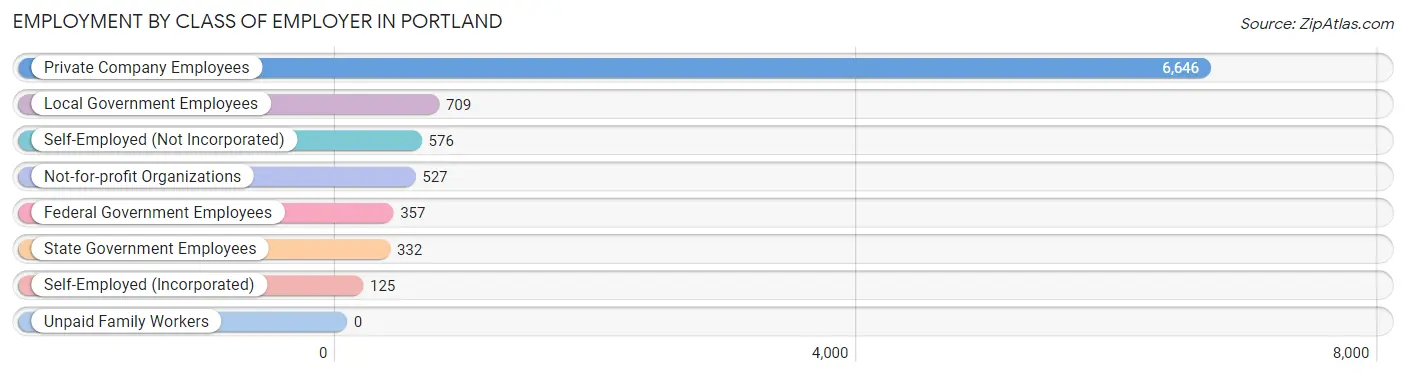
| Employer Class | # Employees | % Employees |
| Private Company Employees | 6,646 | 71.7% |
| Self-Employed (Incorporated) | 125 | 1.3% |
| Self-Employed (Not Incorporated) | 576 | 6.2% |
| Not-for-profit Organizations | 527 | 5.7% |
| Local Government Employees | 709 | 7.6% |
| State Government Employees | 332 | 3.6% |
| Federal Government Employees | 357 | 3.8% |
| Unpaid Family Workers | 0 | 0.0% |
| Total | 9,272 | 100.0% |
Employment Status by Age in Portland
According to the labor force statistics for Portland, out of the total population over 16 years of age (15,228), 64.2% or 9,776 individuals are in the labor force, with 3.1% or 303 of them unemployed. The age group with the highest labor force participation rate is 35 to 44 years, with 84.8% or 2,413 individuals in the labor force. Within the labor force, the 16 to 19 years age range has the highest percentage of unemployed individuals, with 11.7% or 30 of them being unemployed.
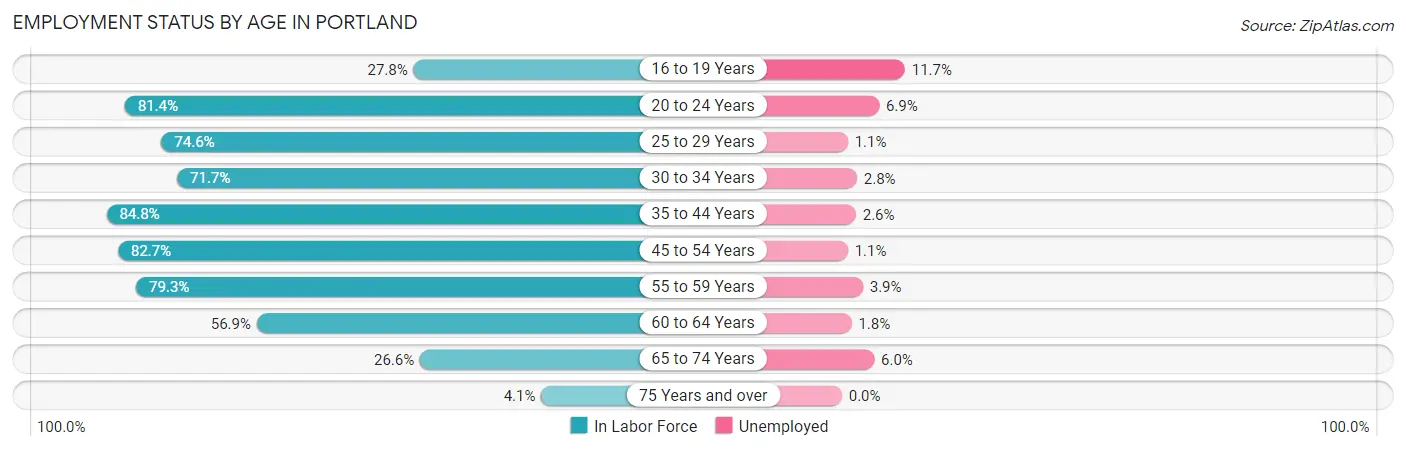
| Age Bracket | In Labor Force | Unemployed |
| 16 to 19 Years | 256 (27.8%) | 30 (11.7%) |
| 20 to 24 Years | 1,102 (81.4%) | 76 (6.9%) |
| 25 to 29 Years | 1,069 (74.6%) | 12 (1.1%) |
| 30 to 34 Years | 1,240 (71.7%) | 35 (2.8%) |
| 35 to 44 Years | 2,413 (84.8%) | 63 (2.6%) |
| 45 to 54 Years | 1,913 (82.7%) | 21 (1.1%) |
| 55 to 59 Years | 801 (79.3%) | 31 (3.9%) |
| 60 to 64 Years | 510 (56.9%) | 9 (1.8%) |
| 65 to 74 Years | 419 (26.6%) | 25 (6.0%) |
| 75 Years and over | 47 (4.1%) | 0 (0.0%) |
| Total | 9,776 (64.2%) | 303 (3.1%) |
Employment Status by Educational Attainment in Portland
According to labor force statistics for Portland, 77.7% of individuals (7,946) out of the total population between 25 and 64 years of age (10,227) are in the labor force, with 2.2% or 175 of them being unemployed. The group with the highest labor force participation rate are those with the educational attainment of bachelor's degree or higher, with 89.0% or 2,356 individuals in the labor force. Within the labor force, individuals with less than high school education have the highest percentage of unemployment, with 7.6% or 21 of them being unemployed.
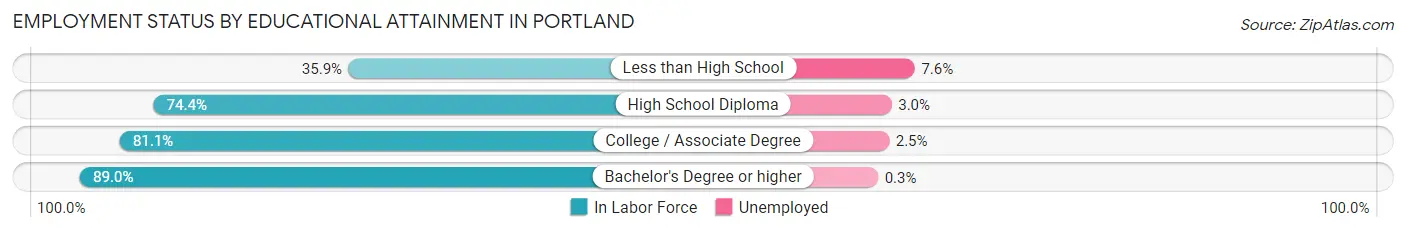
| Educational Attainment | In Labor Force | Unemployed |
| Less than High School | 275 (35.9%) | 58 (7.6%) |
| High School Diploma | 2,344 (74.4%) | 95 (3.0%) |
| College / Associate Degree | 2,970 (81.1%) | 92 (2.5%) |
| Bachelor's Degree or higher | 2,356 (89.0%) | 8 (0.3%) |
| Total | 7,946 (77.7%) | 225 (2.2%) |
Employment Occupations by Sex in Portland
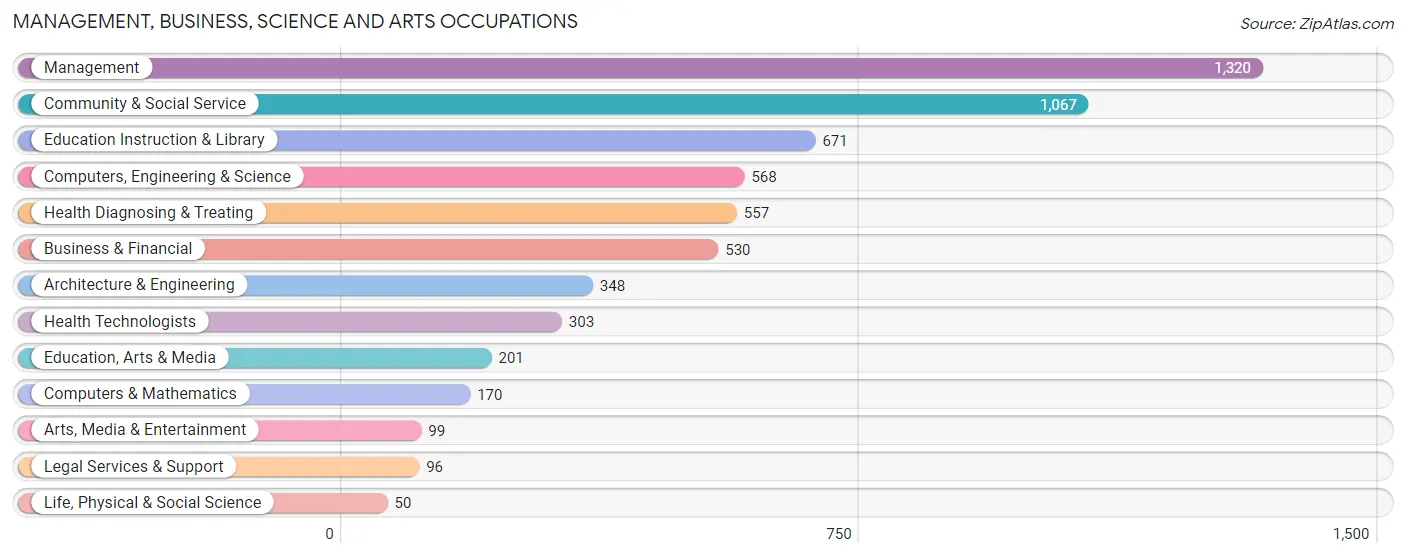
Management, Business, Science and Arts Occupations
The most common Management, Business, Science and Arts occupations in Portland are Management (1,320 | 14.0%), Community & Social Service (1,067 | 11.3%), Education Instruction & Library (671 | 7.1%), Computers, Engineering & Science (568 | 6.0%), and Health Diagnosing & Treating (557 | 5.9%).
Management, Business, Science and Arts Occupations by Sex
Within the Management, Business, Science and Arts occupations in Portland, the most male-oriented occupations are Architecture & Engineering (88.8%), Legal Services & Support (80.2%), and Computers, Engineering & Science (78.9%), while the most female-oriented occupations are Education Instruction & Library (81.8%), Education, Arts & Media (81.6%), and Community & Social Service (72.5%).
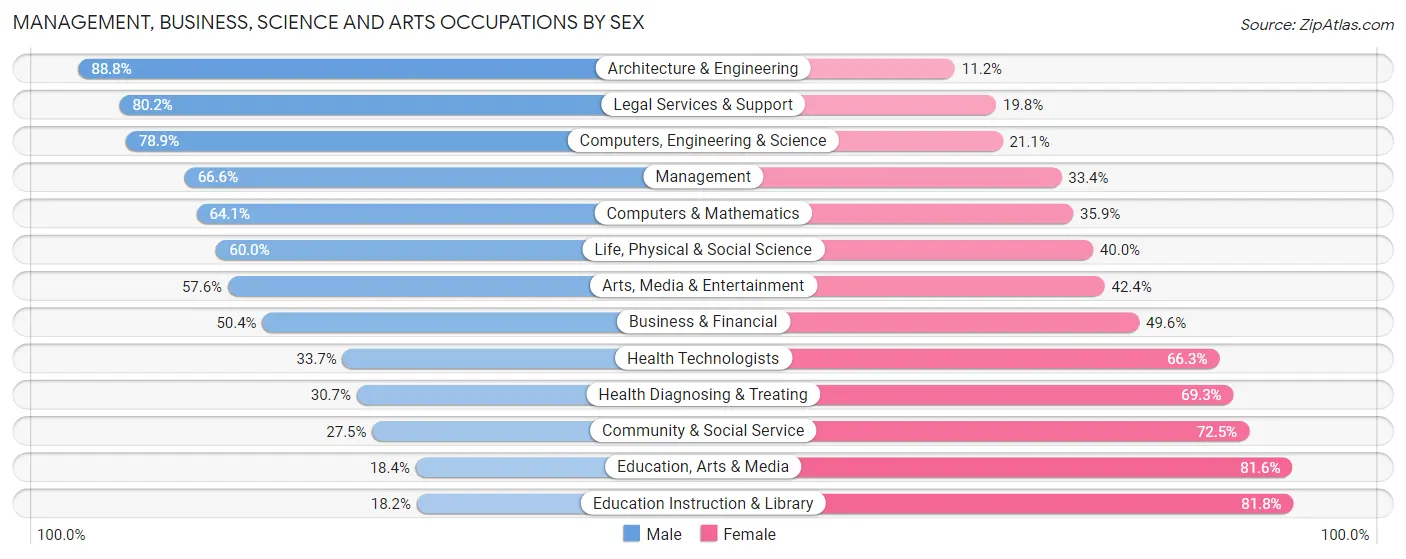
| Occupation | Male | Female |
| Management | 879 (66.6%) | 441 (33.4%) |
| Business & Financial | 267 (50.4%) | 263 (49.6%) |
| Computers, Engineering & Science | 448 (78.9%) | 120 (21.1%) |
| Computers & Mathematics | 109 (64.1%) | 61 (35.9%) |
| Architecture & Engineering | 309 (88.8%) | 39 (11.2%) |
| Life, Physical & Social Science | 30 (60.0%) | 20 (40.0%) |
| Community & Social Service | 293 (27.5%) | 774 (72.5%) |
| Education, Arts & Media | 37 (18.4%) | 164 (81.6%) |
| Legal Services & Support | 77 (80.2%) | 19 (19.8%) |
| Education Instruction & Library | 122 (18.2%) | 549 (81.8%) |
| Arts, Media & Entertainment | 57 (57.6%) | 42 (42.4%) |
| Health Diagnosing & Treating | 171 (30.7%) | 386 (69.3%) |
| Health Technologists | 102 (33.7%) | 201 (66.3%) |
| Total (Category) | 2,058 (50.9%) | 1,984 (49.1%) |
| Total (Overall) | 5,616 (59.6%) | 3,807 (40.4%) |
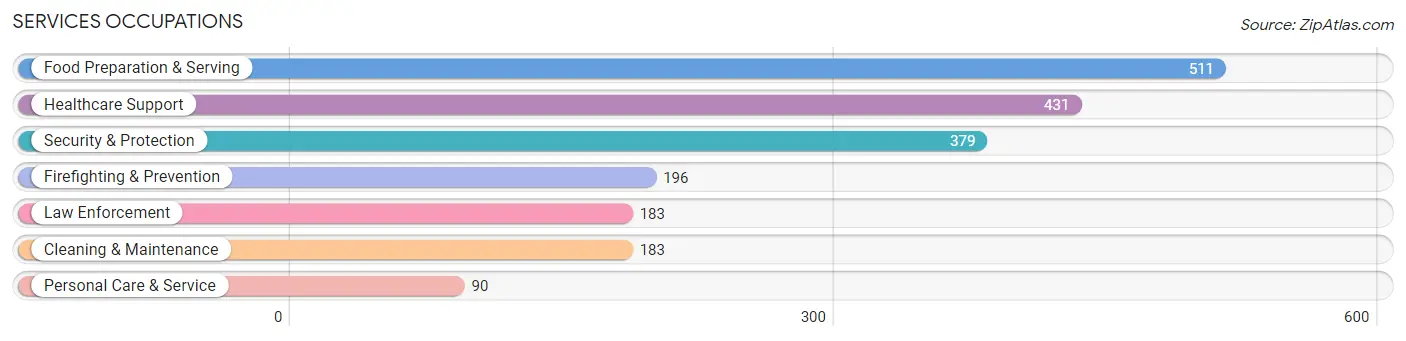
Services Occupations
The most common Services occupations in Portland are Food Preparation & Serving (511 | 5.4%), Healthcare Support (431 | 4.6%), Security & Protection (379 | 4.0%), Firefighting & Prevention (196 | 2.1%), and Law Enforcement (183 | 1.9%).
Services Occupations by Sex
Within the Services occupations in Portland, the most male-oriented occupations are Firefighting & Prevention (78.6%), Security & Protection (72.8%), and Food Preparation & Serving (72.8%), while the most female-oriented occupations are Cleaning & Maintenance (69.4%), Healthcare Support (64.0%), and Personal Care & Service (60.0%).
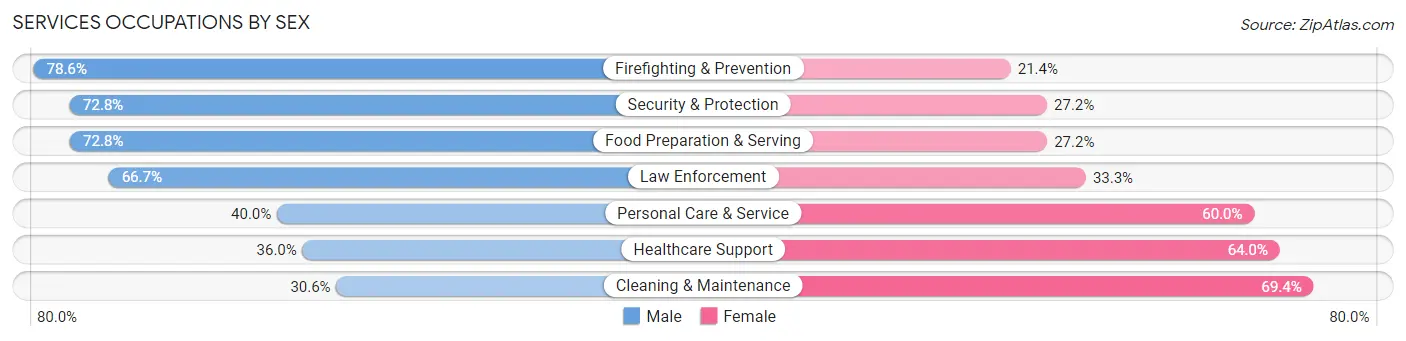
| Occupation | Male | Female |
| Healthcare Support | 155 (36.0%) | 276 (64.0%) |
| Security & Protection | 276 (72.8%) | 103 (27.2%) |
| Firefighting & Prevention | 154 (78.6%) | 42 (21.4%) |
| Law Enforcement | 122 (66.7%) | 61 (33.3%) |
| Food Preparation & Serving | 372 (72.8%) | 139 (27.2%) |
| Cleaning & Maintenance | 56 (30.6%) | 127 (69.4%) |
| Personal Care & Service | 36 (40.0%) | 54 (60.0%) |
| Total (Category) | 895 (56.1%) | 699 (43.9%) |
| Total (Overall) | 5,616 (59.6%) | 3,807 (40.4%) |
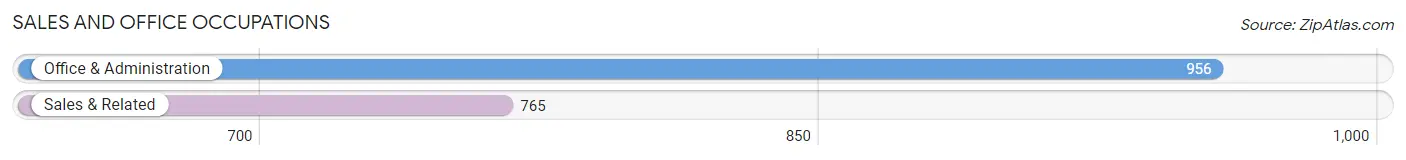
Sales and Office Occupations
The most common Sales and Office occupations in Portland are Office & Administration (956 | 10.2%), and Sales & Related (765 | 8.1%).
Sales and Office Occupations by Sex
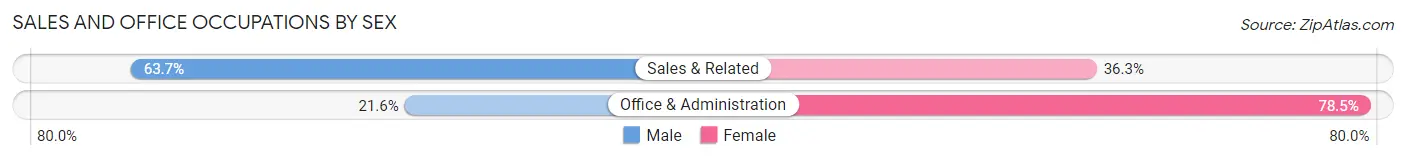
| Occupation | Male | Female |
| Sales & Related | 487 (63.7%) | 278 (36.3%) |
| Office & Administration | 206 (21.5%) | 750 (78.4%) |
| Total (Category) | 693 (40.3%) | 1,028 (59.7%) |
| Total (Overall) | 5,616 (59.6%) | 3,807 (40.4%) |
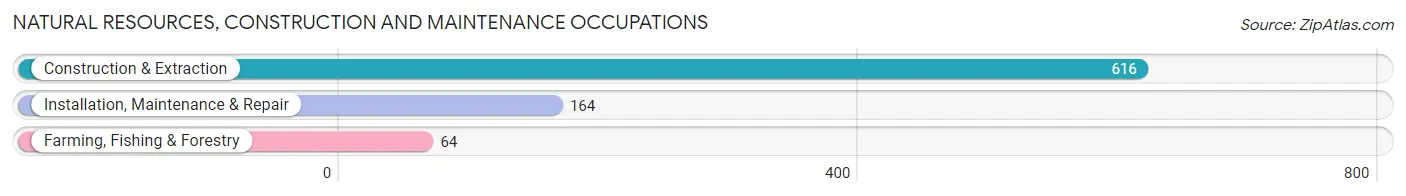
Natural Resources, Construction and Maintenance Occupations
The most common Natural Resources, Construction and Maintenance occupations in Portland are Construction & Extraction (616 | 6.5%), Installation, Maintenance & Repair (164 | 1.7%), and Farming, Fishing & Forestry (64 | 0.7%).
Natural Resources, Construction and Maintenance Occupations by Sex
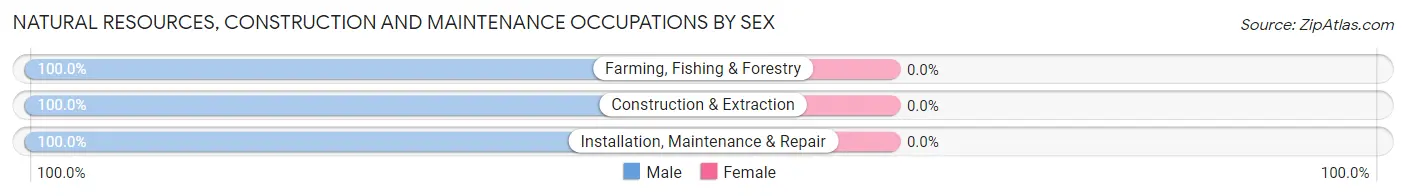
| Occupation | Male | Female |
| Farming, Fishing & Forestry | 64 (100.0%) | 0 (0.0%) |
| Construction & Extraction | 616 (100.0%) | 0 (0.0%) |
| Installation, Maintenance & Repair | 164 (100.0%) | 0 (0.0%) |
| Total (Category) | 844 (100.0%) | 0 (0.0%) |
| Total (Overall) | 5,616 (59.6%) | 3,807 (40.4%) |
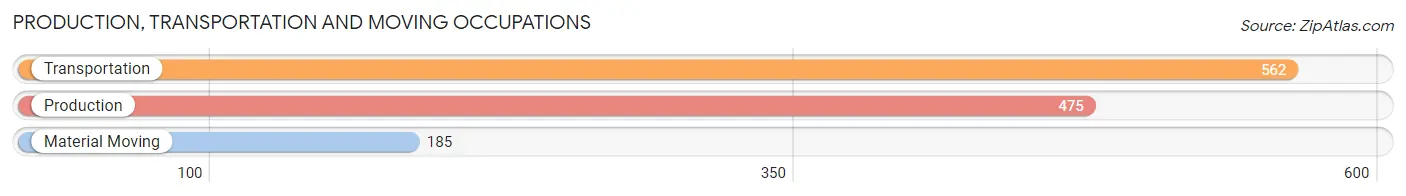
Production, Transportation and Moving Occupations
The most common Production, Transportation and Moving occupations in Portland are Transportation (562 | 6.0%), Production (475 | 5.0%), and Material Moving (185 | 2.0%).
Production, Transportation and Moving Occupations by Sex
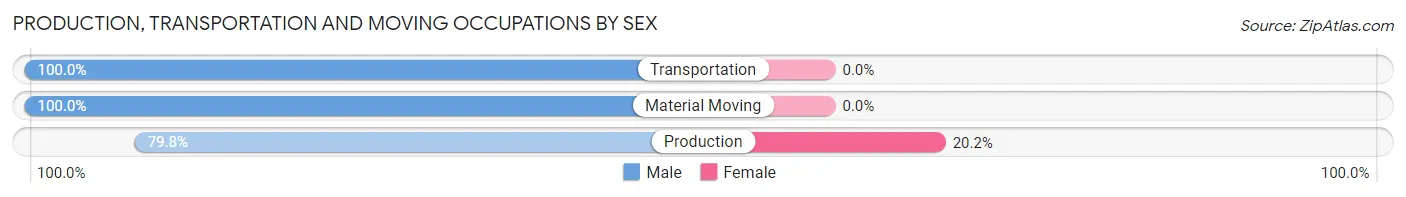
| Occupation | Male | Female |
| Production | 379 (79.8%) | 96 (20.2%) |
| Transportation | 562 (100.0%) | 0 (0.0%) |
| Material Moving | 185 (100.0%) | 0 (0.0%) |
| Total (Category) | 1,126 (92.1%) | 96 (7.9%) |
| Total (Overall) | 5,616 (59.6%) | 3,807 (40.4%) |
Employment Industries by Sex in Portland
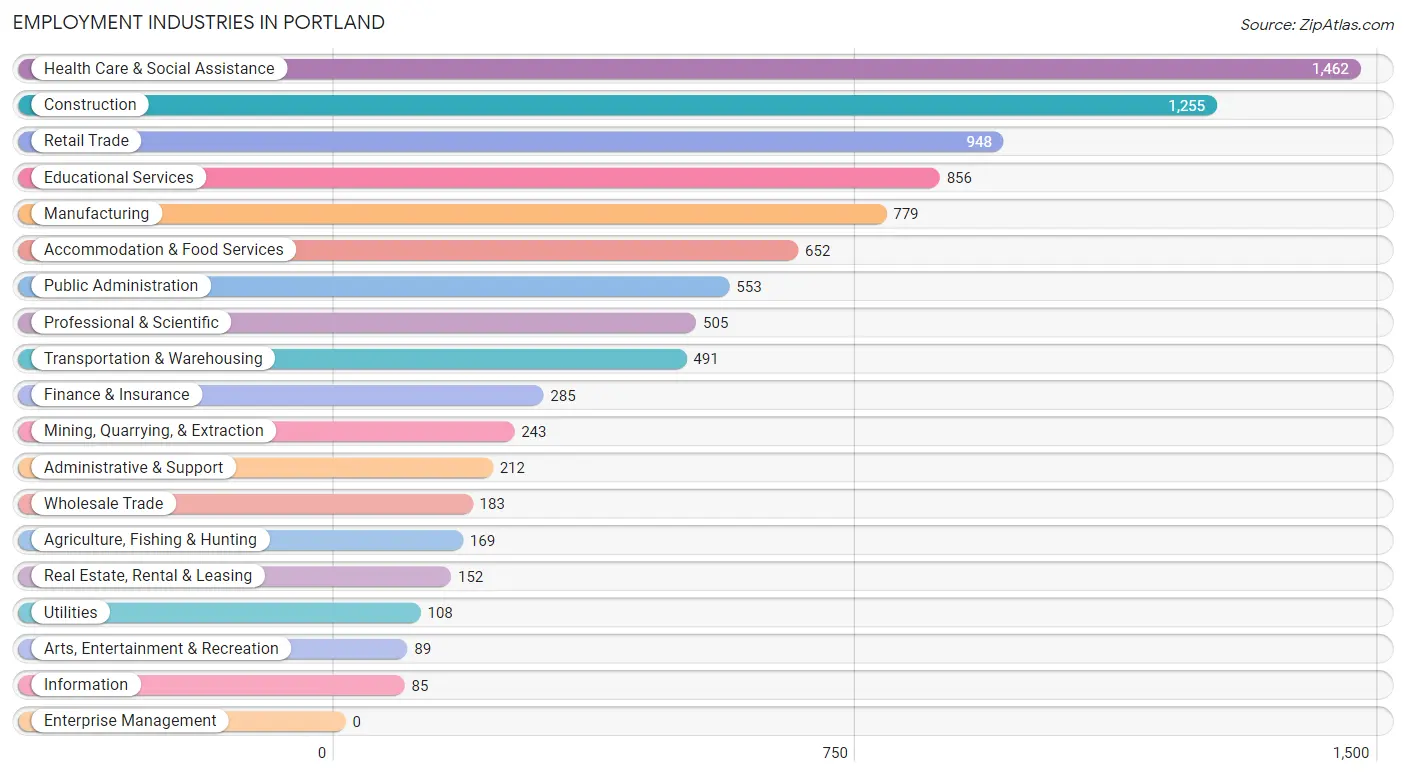
Employment Industries in Portland
The major employment industries in Portland include Health Care & Social Assistance (1,462 | 15.5%), Construction (1,255 | 13.3%), Retail Trade (948 | 10.1%), Educational Services (856 | 9.1%), and Manufacturing (779 | 8.3%).
Employment Industries by Sex in Portland
The Portland industries that see more men than women are Agriculture, Fishing & Hunting (90.5%), Utilities (88.9%), and Manufacturing (86.7%), whereas the industries that tend to have a higher number of women are Finance & Insurance (88.1%), Health Care & Social Assistance (78.0%), and Educational Services (73.4%).
| Industry | Male | Female |
| Agriculture, Fishing & Hunting | 153 (90.5%) | 16 (9.5%) |
| Mining, Quarrying, & Extraction | 172 (70.8%) | 71 (29.2%) |
| Construction | 1,055 (84.1%) | 200 (15.9%) |
| Manufacturing | 675 (86.7%) | 104 (13.4%) |
| Wholesale Trade | 113 (61.8%) | 70 (38.3%) |
| Retail Trade | 703 (74.2%) | 245 (25.8%) |
| Transportation & Warehousing | 401 (81.7%) | 90 (18.3%) |
| Utilities | 96 (88.9%) | 12 (11.1%) |
| Information | 50 (58.8%) | 35 (41.2%) |
| Finance & Insurance | 34 (11.9%) | 251 (88.1%) |
| Real Estate, Rental & Leasing | 62 (40.8%) | 90 (59.2%) |
| Professional & Scientific | 313 (62.0%) | 192 (38.0%) |
| Enterprise Management | 0 (0.0%) | 0 (0.0%) |
| Administrative & Support | 141 (66.5%) | 71 (33.5%) |
| Educational Services | 228 (26.6%) | 628 (73.4%) |
| Health Care & Social Assistance | 321 (22.0%) | 1,141 (78.0%) |
| Arts, Entertainment & Recreation | 58 (65.2%) | 31 (34.8%) |
| Accommodation & Food Services | 416 (63.8%) | 236 (36.2%) |
| Public Administration | 378 (68.3%) | 175 (31.7%) |
| Total | 5,616 (59.6%) | 3,807 (40.4%) |
Education in Portland
School Enrollment in Portland
The most common levels of schooling among the 5,000 students in Portland are elementary school (1,471 | 29.4%), middle school (1,209 | 24.2%), and high school (797 | 15.9%).
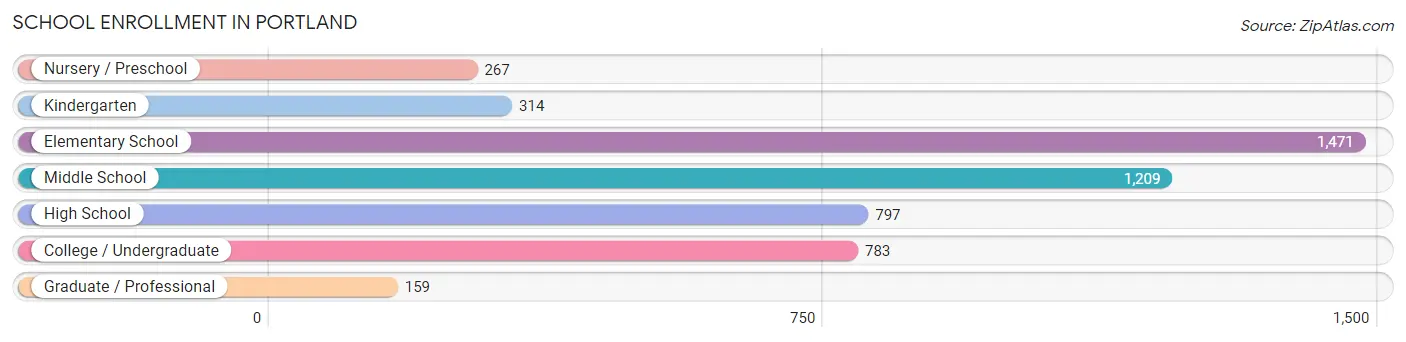
| School Level | # Students | % Students |
| Nursery / Preschool | 267 | 5.3% |
| Kindergarten | 314 | 6.3% |
| Elementary School | 1,471 | 29.4% |
| Middle School | 1,209 | 24.2% |
| High School | 797 | 15.9% |
| College / Undergraduate | 783 | 15.7% |
| Graduate / Professional | 159 | 3.2% |
| Total | 5,000 | 100.0% |
School Enrollment by Age by Funding Source in Portland
Out of a total of 5,000 students who are enrolled in schools in Portland, 265 (5.3%) attend a private institution, while the remaining 4,735 (94.7%) are enrolled in public schools. The age group of 3 to 4 year olds has the highest likelihood of being enrolled in private schools, with 52 (26.7% in the age bracket) enrolled. Conversely, the age group of 18 to 19 year olds has the lowest likelihood of being enrolled in a private school, with 204 (100.0% in the age bracket) attending a public institution.
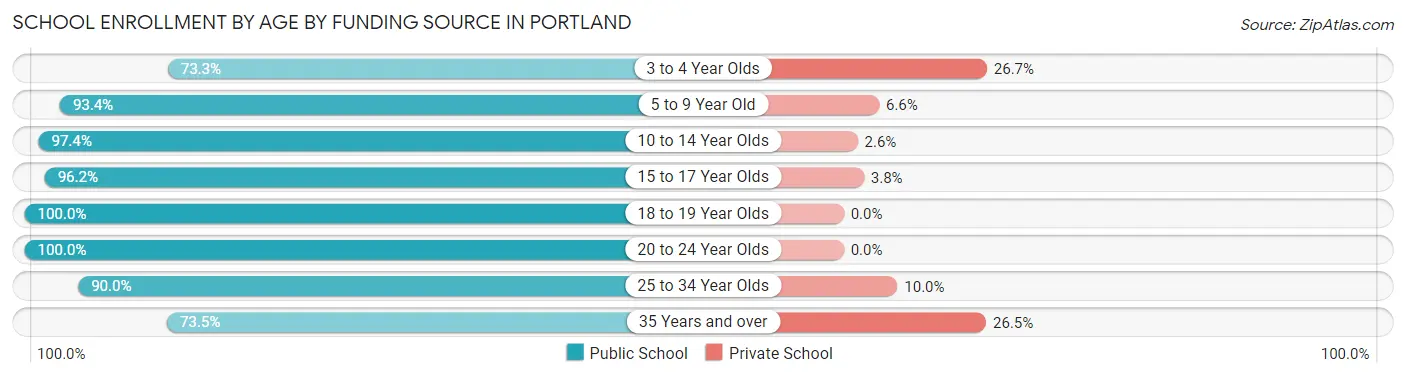
| Age Bracket | Public School | Private School |
| 3 to 4 Year Olds | 143 (73.3%) | 52 (26.7%) |
| 5 to 9 Year Old | 1,417 (93.4%) | 100 (6.6%) |
| 10 to 14 Year Olds | 1,534 (97.4%) | 41 (2.6%) |
| 15 to 17 Year Olds | 588 (96.2%) | 23 (3.8%) |
| 18 to 19 Year Olds | 204 (100.0%) | 0 (0.0%) |
| 20 to 24 Year Olds | 580 (100.0%) | 0 (0.0%) |
| 25 to 34 Year Olds | 198 (90.0%) | 22 (10.0%) |
| 35 Years and over | 72 (73.5%) | 26 (26.5%) |
| Total | 4,735 (94.7%) | 265 (5.3%) |
Educational Attainment by Field of Study in Portland
Business (654 | 16.9%), science & technology (637 | 16.5%), education (512 | 13.3%), engineering (327 | 8.5%), and arts & humanities (309 | 8.0%) are the most common fields of study among 3,865 individuals in Portland who have obtained a bachelor's degree or higher.
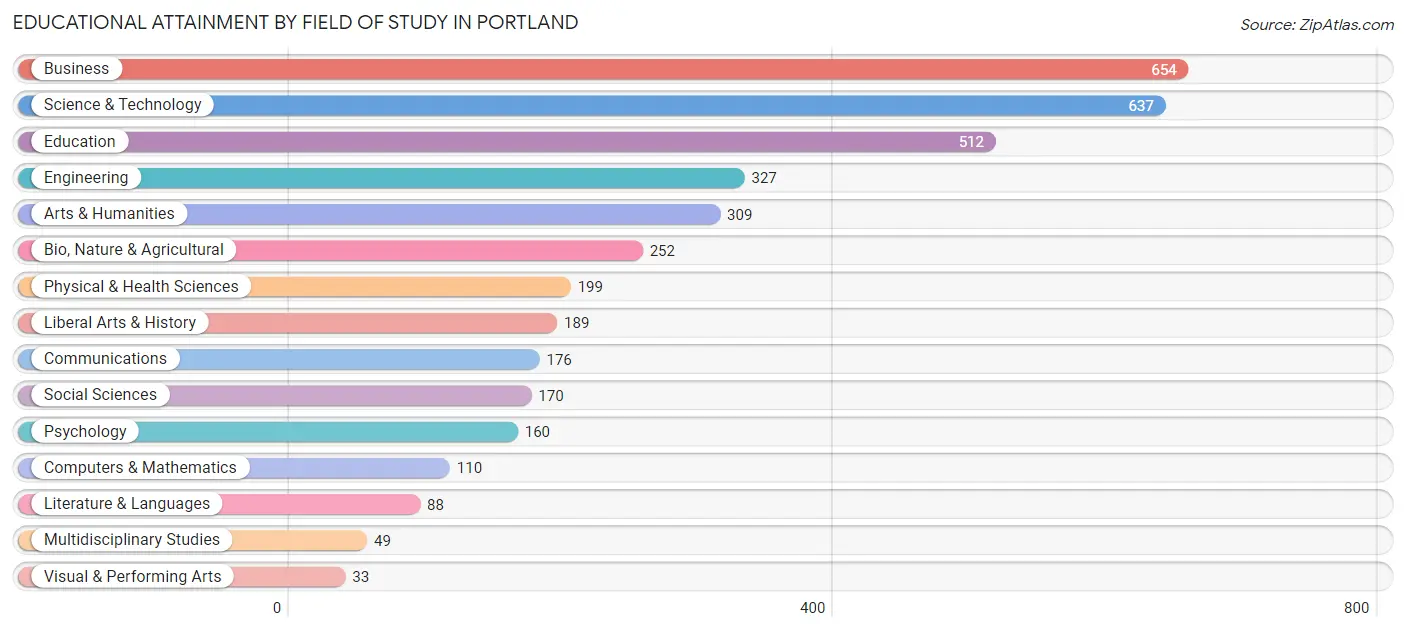
| Field of Study | # Graduates | % Graduates |
| Computers & Mathematics | 110 | 2.9% |
| Bio, Nature & Agricultural | 252 | 6.5% |
| Physical & Health Sciences | 199 | 5.1% |
| Psychology | 160 | 4.1% |
| Social Sciences | 170 | 4.4% |
| Engineering | 327 | 8.5% |
| Multidisciplinary Studies | 49 | 1.3% |
| Science & Technology | 637 | 16.5% |
| Business | 654 | 16.9% |
| Education | 512 | 13.3% |
| Literature & Languages | 88 | 2.3% |
| Liberal Arts & History | 189 | 4.9% |
| Visual & Performing Arts | 33 | 0.9% |
| Communications | 176 | 4.5% |
| Arts & Humanities | 309 | 8.0% |
| Total | 3,865 | 100.0% |
Transportation & Commute in Portland
Vehicle Availability by Sex in Portland
The most prevalent vehicle ownership categories in Portland are males with 2 vehicles (2,703, accounting for 48.5%) and females with 2 vehicles (1,761, making up 73.0%).
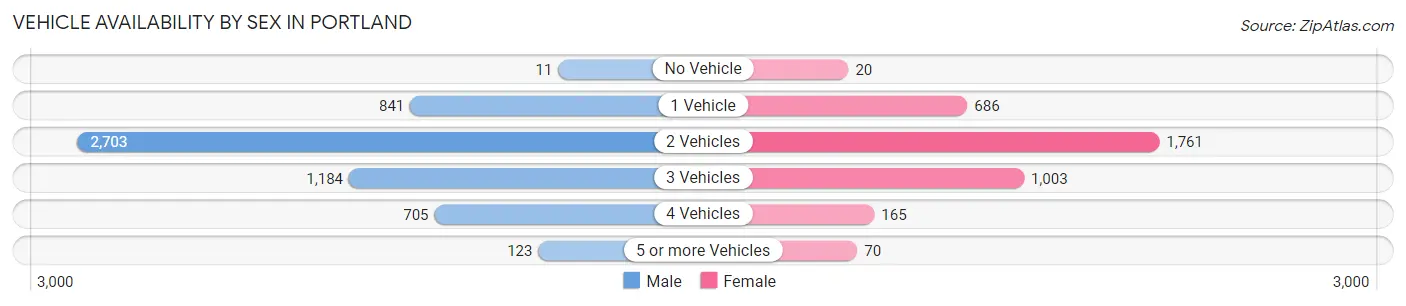
| Vehicles Available | Male | Female |
| No Vehicle | 11 (0.2%) | 20 (0.5%) |
| 1 Vehicle | 841 (15.1%) | 686 (18.5%) |
| 2 Vehicles | 2,703 (48.5%) | 1,761 (47.5%) |
| 3 Vehicles | 1,184 (21.3%) | 1,003 (27.1%) |
| 4 Vehicles | 705 (12.7%) | 165 (4.4%) |
| 5 or more Vehicles | 123 (2.2%) | 70 (1.9%) |
| Total | 5,567 (100.0%) | 3,705 (100.0%) |
Commute Time in Portland
The most frequently occuring commute durations in Portland are 20 to 24 minutes (1,606 commuters, 18.6%), 15 to 19 minutes (1,464 commuters, 16.9%), and 5 to 9 minutes (1,342 commuters, 15.5%).
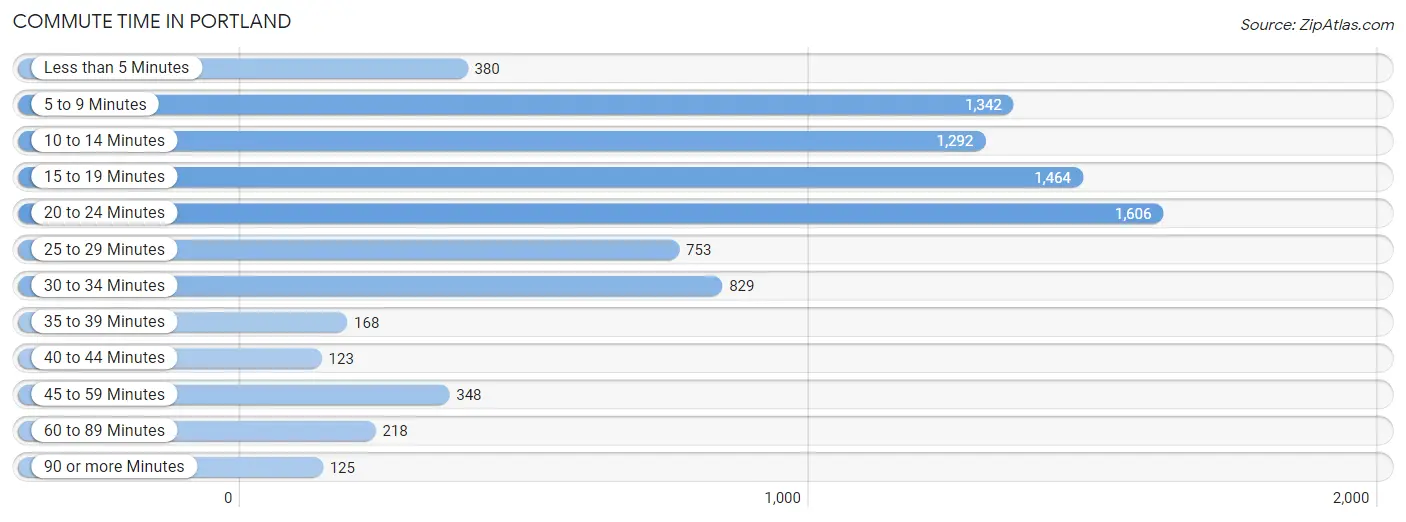
| Commute Time | # Commuters | % Commuters |
| Less than 5 Minutes | 380 | 4.4% |
| 5 to 9 Minutes | 1,342 | 15.5% |
| 10 to 14 Minutes | 1,292 | 14.9% |
| 15 to 19 Minutes | 1,464 | 16.9% |
| 20 to 24 Minutes | 1,606 | 18.6% |
| 25 to 29 Minutes | 753 | 8.7% |
| 30 to 34 Minutes | 829 | 9.6% |
| 35 to 39 Minutes | 168 | 1.9% |
| 40 to 44 Minutes | 123 | 1.4% |
| 45 to 59 Minutes | 348 | 4.0% |
| 60 to 89 Minutes | 218 | 2.5% |
| 90 or more Minutes | 125 | 1.5% |
Commute Time by Sex in Portland
The most common commute times in Portland are 15 to 19 minutes (982 commuters, 18.6%) for males and 10 to 14 minutes (659 commuters, 19.5%) for females.
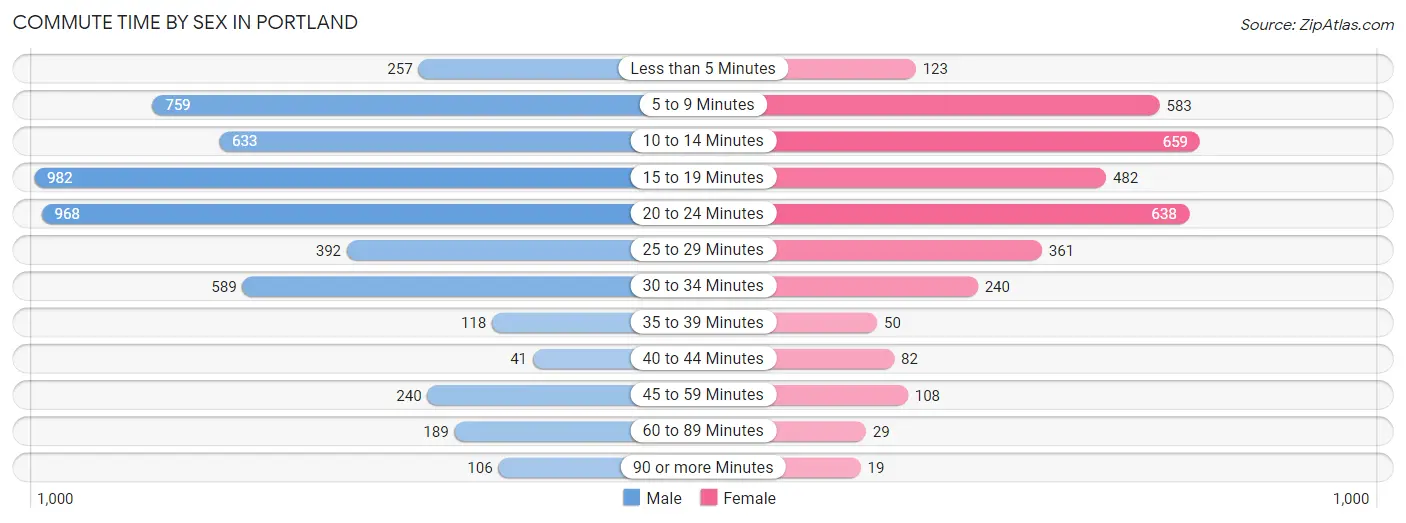
| Commute Time | Male | Female |
| Less than 5 Minutes | 257 (4.9%) | 123 (3.6%) |
| 5 to 9 Minutes | 759 (14.4%) | 583 (17.3%) |
| 10 to 14 Minutes | 633 (12.0%) | 659 (19.5%) |
| 15 to 19 Minutes | 982 (18.6%) | 482 (14.3%) |
| 20 to 24 Minutes | 968 (18.3%) | 638 (18.9%) |
| 25 to 29 Minutes | 392 (7.4%) | 361 (10.7%) |
| 30 to 34 Minutes | 589 (11.2%) | 240 (7.1%) |
| 35 to 39 Minutes | 118 (2.2%) | 50 (1.5%) |
| 40 to 44 Minutes | 41 (0.8%) | 82 (2.4%) |
| 45 to 59 Minutes | 240 (4.5%) | 108 (3.2%) |
| 60 to 89 Minutes | 189 (3.6%) | 29 (0.9%) |
| 90 or more Minutes | 106 (2.0%) | 19 (0.6%) |
Time of Departure to Work by Sex in Portland
The most frequent times of departure to work in Portland are 7:00 AM to 7:29 AM (984, 18.7%) for males and 7:30 AM to 7:59 AM (941, 27.9%) for females.
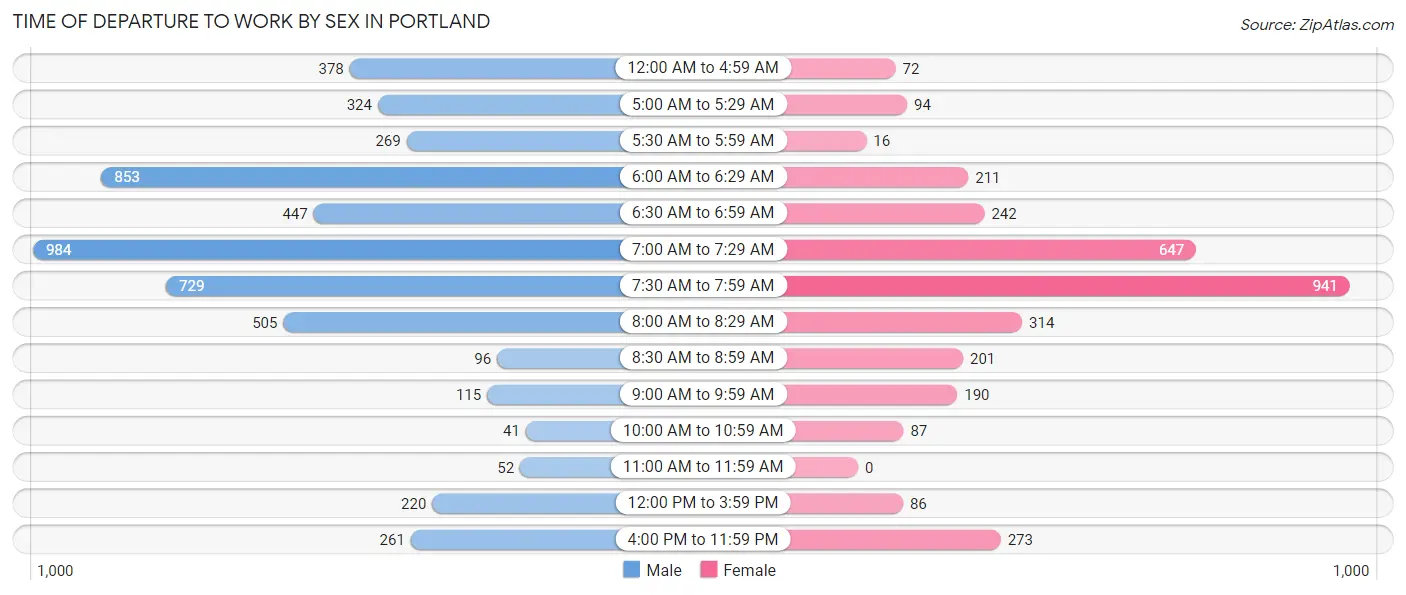
| Time of Departure | Male | Female |
| 12:00 AM to 4:59 AM | 378 (7.2%) | 72 (2.1%) |
| 5:00 AM to 5:29 AM | 324 (6.1%) | 94 (2.8%) |
| 5:30 AM to 5:59 AM | 269 (5.1%) | 16 (0.5%) |
| 6:00 AM to 6:29 AM | 853 (16.2%) | 211 (6.2%) |
| 6:30 AM to 6:59 AM | 447 (8.5%) | 242 (7.2%) |
| 7:00 AM to 7:29 AM | 984 (18.7%) | 647 (19.2%) |
| 7:30 AM to 7:59 AM | 729 (13.8%) | 941 (27.9%) |
| 8:00 AM to 8:29 AM | 505 (9.6%) | 314 (9.3%) |
| 8:30 AM to 8:59 AM | 96 (1.8%) | 201 (6.0%) |
| 9:00 AM to 9:59 AM | 115 (2.2%) | 190 (5.6%) |
| 10:00 AM to 10:59 AM | 41 (0.8%) | 87 (2.6%) |
| 11:00 AM to 11:59 AM | 52 (1.0%) | 0 (0.0%) |
| 12:00 PM to 3:59 PM | 220 (4.2%) | 86 (2.5%) |
| 4:00 PM to 11:59 PM | 261 (5.0%) | 273 (8.1%) |
| Total | 5,274 (100.0%) | 3,374 (100.0%) |
Housing Occupancy in Portland
Occupancy by Ownership in Portland
Of the total 7,066 dwellings in Portland, owner-occupied units account for 4,633 (65.6%), while renter-occupied units make up 2,433 (34.4%).
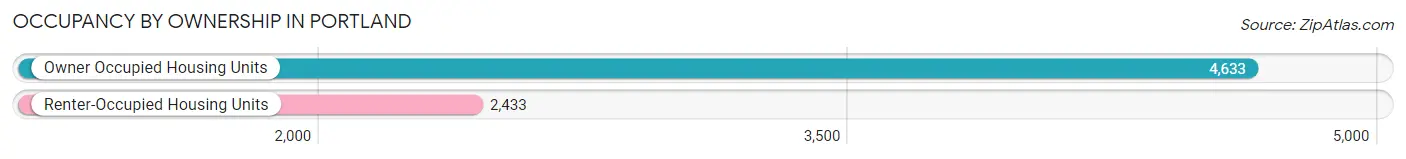
| Occupancy | # Housing Units | % Housing Units |
| Owner Occupied Housing Units | 4,633 | 65.6% |
| Renter-Occupied Housing Units | 2,433 | 34.4% |
| Total Occupied Housing Units | 7,066 | 100.0% |
Occupancy by Household Size in Portland
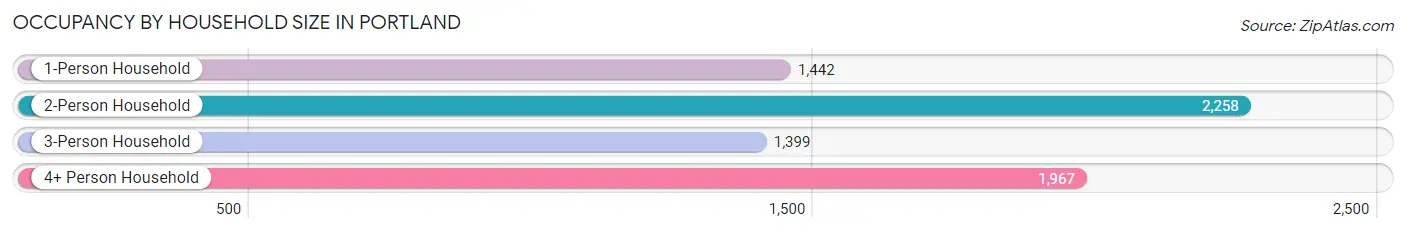
| Household Size | # Housing Units | % Housing Units |
| 1-Person Household | 1,442 | 20.4% |
| 2-Person Household | 2,258 | 32.0% |
| 3-Person Household | 1,399 | 19.8% |
| 4+ Person Household | 1,967 | 27.8% |
| Total Housing Units | 7,066 | 100.0% |
Occupancy by Ownership by Household Size in Portland
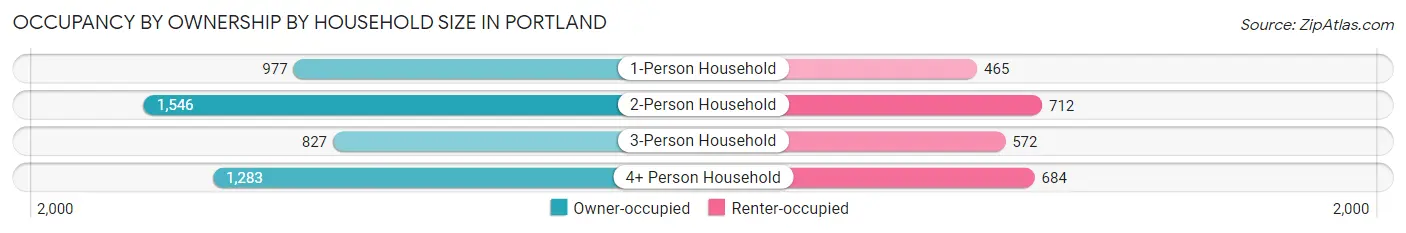
| Household Size | Owner-occupied | Renter-occupied |
| 1-Person Household | 977 (67.7%) | 465 (32.3%) |
| 2-Person Household | 1,546 (68.5%) | 712 (31.5%) |
| 3-Person Household | 827 (59.1%) | 572 (40.9%) |
| 4+ Person Household | 1,283 (65.2%) | 684 (34.8%) |
| Total Housing Units | 4,633 (65.6%) | 2,433 (34.4%) |
Occupancy by Educational Attainment in Portland
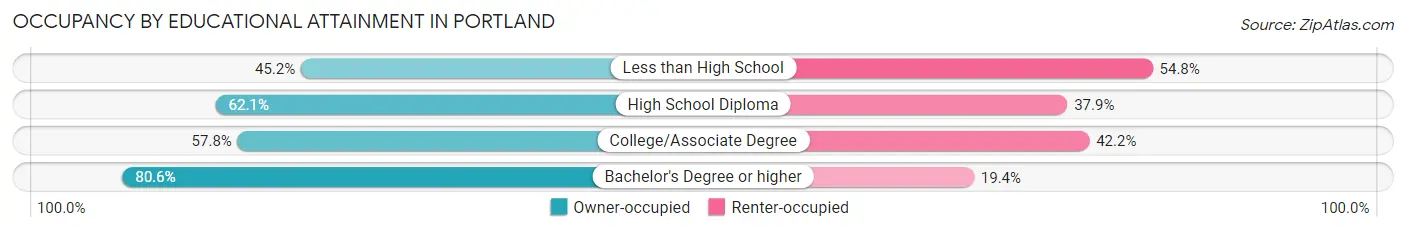
| Household Size | Owner-occupied | Renter-occupied |
| Less than High School | 169 (45.2%) | 205 (54.8%) |
| High School Diploma | 1,212 (62.1%) | 739 (37.9%) |
| College/Associate Degree | 1,441 (57.8%) | 1,054 (42.2%) |
| Bachelor's Degree or higher | 1,811 (80.6%) | 435 (19.4%) |
Occupancy by Age of Householder in Portland
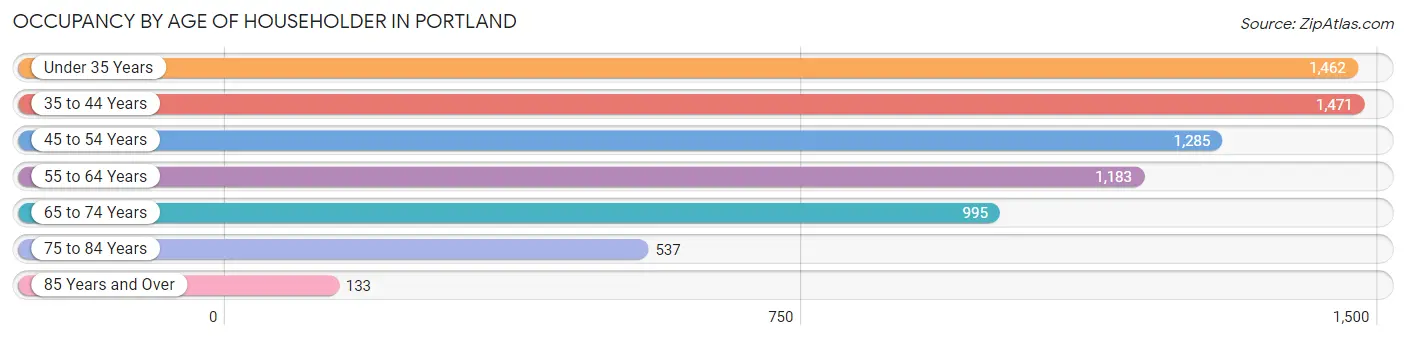
| Age Bracket | # Households | % Households |
| Under 35 Years | 1,462 | 20.7% |
| 35 to 44 Years | 1,471 | 20.8% |
| 45 to 54 Years | 1,285 | 18.2% |
| 55 to 64 Years | 1,183 | 16.7% |
| 65 to 74 Years | 995 | 14.1% |
| 75 to 84 Years | 537 | 7.6% |
| 85 Years and Over | 133 | 1.9% |
| Total | 7,066 | 100.0% |
Housing Finances in Portland
Median Income by Occupancy in Portland
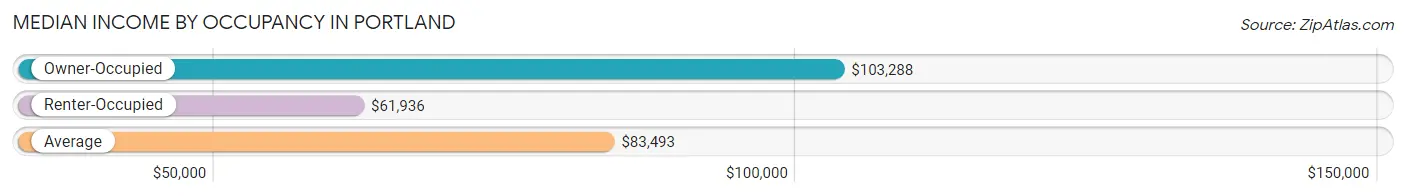
| Occupancy Type | # Households | Median Income |
| Owner-Occupied | 4,633 (65.6%) | $103,288 |
| Renter-Occupied | 2,433 (34.4%) | $61,936 |
| Average | 7,066 (100.0%) | $83,493 |
Occupancy by Householder Income Bracket in Portland
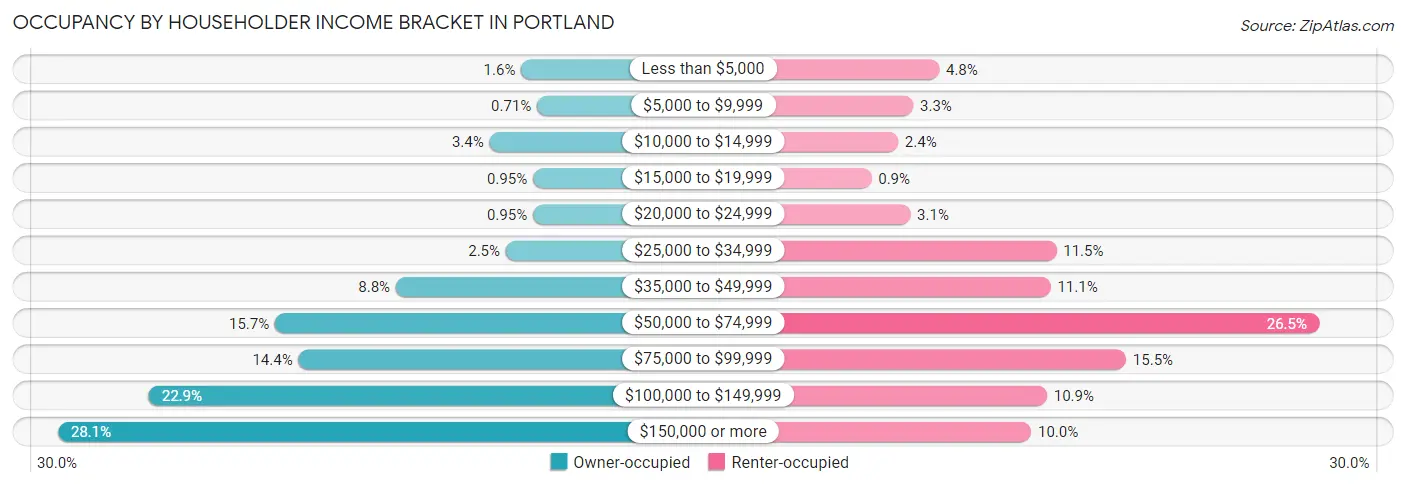
| Income Bracket | Owner-occupied | Renter-occupied |
| Less than $5,000 | 75 (1.6%) | 116 (4.8%) |
| $5,000 to $9,999 | 33 (0.7%) | 80 (3.3%) |
| $10,000 to $14,999 | 159 (3.4%) | 59 (2.4%) |
| $15,000 to $19,999 | 44 (0.9%) | 22 (0.9%) |
| $20,000 to $24,999 | 44 (0.9%) | 76 (3.1%) |
| $25,000 to $34,999 | 116 (2.5%) | 279 (11.5%) |
| $35,000 to $49,999 | 407 (8.8%) | 271 (11.1%) |
| $50,000 to $74,999 | 727 (15.7%) | 644 (26.5%) |
| $75,000 to $99,999 | 665 (14.3%) | 376 (15.4%) |
| $100,000 to $149,999 | 1,061 (22.9%) | 266 (10.9%) |
| $150,000 or more | 1,302 (28.1%) | 244 (10.0%) |
| Total | 4,633 (100.0%) | 2,433 (100.0%) |
Monthly Housing Cost Tiers in Portland
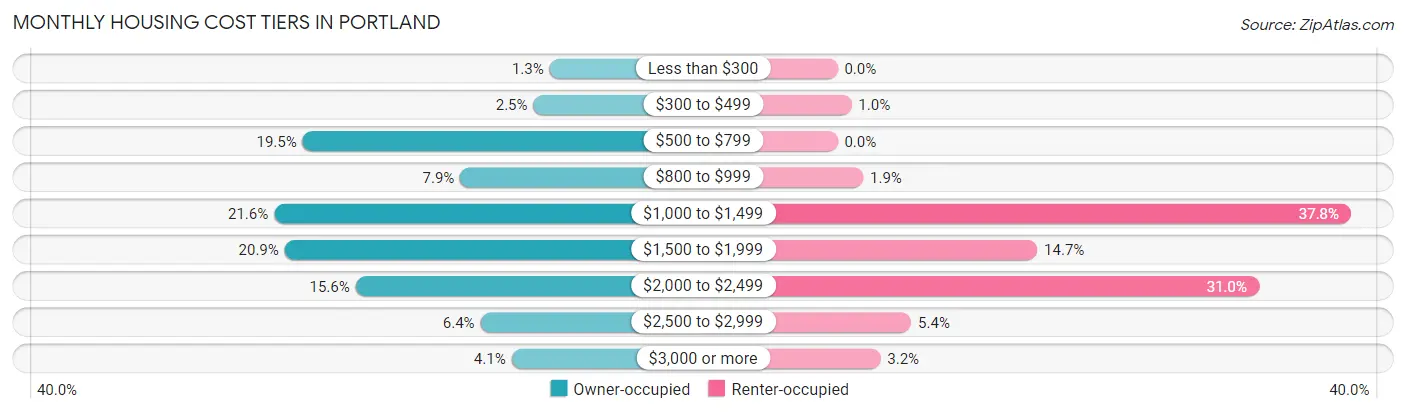
| Monthly Cost | Owner-occupied | Renter-occupied |
| Less than $300 | 62 (1.3%) | 0 (0.0%) |
| $300 to $499 | 117 (2.5%) | 25 (1.0%) |
| $500 to $799 | 905 (19.5%) | 0 (0.0%) |
| $800 to $999 | 367 (7.9%) | 46 (1.9%) |
| $1,000 to $1,499 | 1,002 (21.6%) | 920 (37.8%) |
| $1,500 to $1,999 | 966 (20.8%) | 358 (14.7%) |
| $2,000 to $2,499 | 724 (15.6%) | 755 (31.0%) |
| $2,500 to $2,999 | 298 (6.4%) | 132 (5.4%) |
| $3,000 or more | 192 (4.1%) | 77 (3.2%) |
| Total | 4,633 (100.0%) | 2,433 (100.0%) |
Physical Housing Characteristics in Portland
Housing Structures in Portland
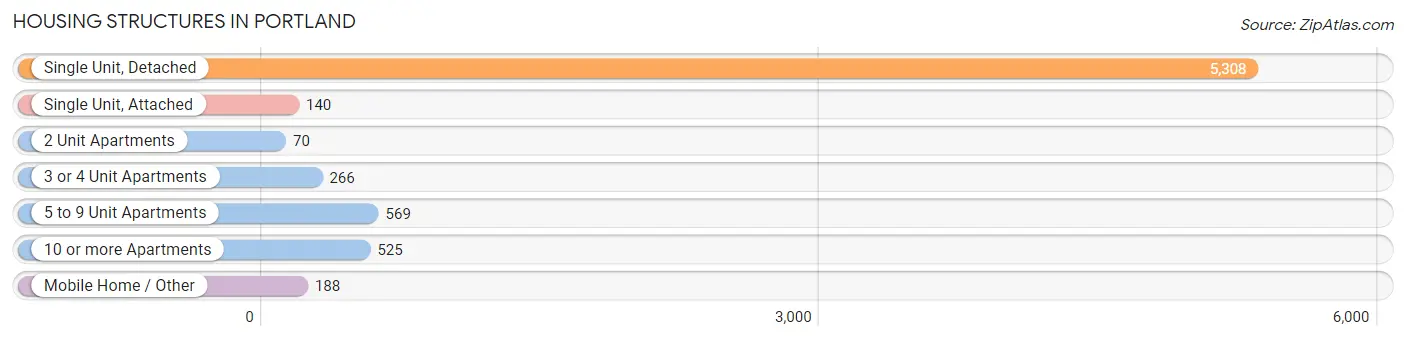
| Structure Type | # Housing Units | % Housing Units |
| Single Unit, Detached | 5,308 | 75.1% |
| Single Unit, Attached | 140 | 2.0% |
| 2 Unit Apartments | 70 | 1.0% |
| 3 or 4 Unit Apartments | 266 | 3.8% |
| 5 to 9 Unit Apartments | 569 | 8.1% |
| 10 or more Apartments | 525 | 7.4% |
| Mobile Home / Other | 188 | 2.7% |
| Total | 7,066 | 100.0% |
Housing Structures by Occupancy in Portland
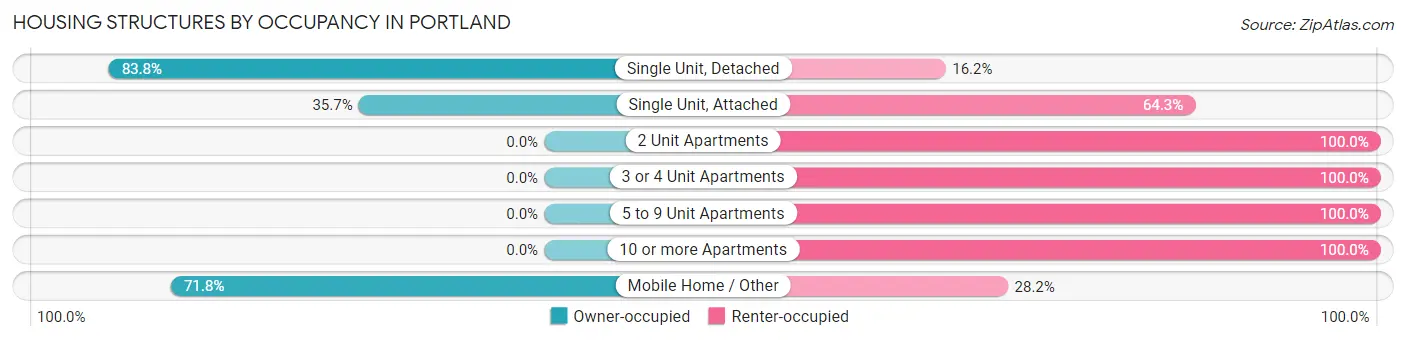
| Structure Type | Owner-occupied | Renter-occupied |
| Single Unit, Detached | 4,448 (83.8%) | 860 (16.2%) |
| Single Unit, Attached | 50 (35.7%) | 90 (64.3%) |
| 2 Unit Apartments | 0 (0.0%) | 70 (100.0%) |
| 3 or 4 Unit Apartments | 0 (0.0%) | 266 (100.0%) |
| 5 to 9 Unit Apartments | 0 (0.0%) | 569 (100.0%) |
| 10 or more Apartments | 0 (0.0%) | 525 (100.0%) |
| Mobile Home / Other | 135 (71.8%) | 53 (28.2%) |
| Total | 4,633 (65.6%) | 2,433 (34.4%) |
Housing Structures by Number of Rooms in Portland
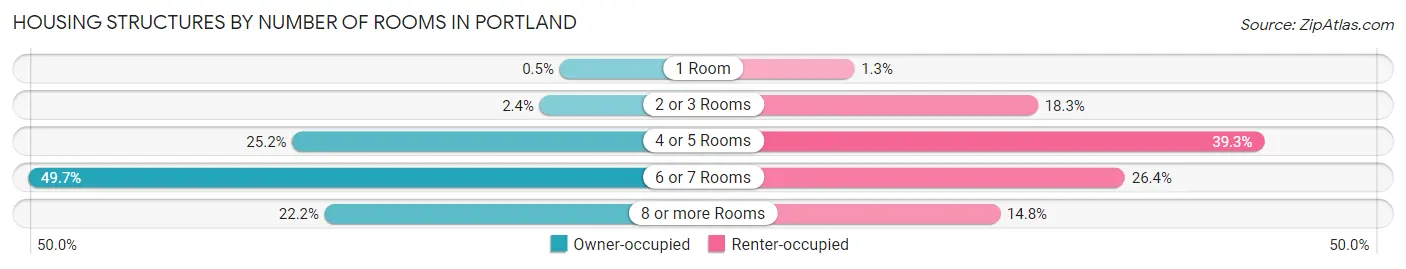
| Number of Rooms | Owner-occupied | Renter-occupied |
| 1 Room | 23 (0.5%) | 32 (1.3%) |
| 2 or 3 Rooms | 109 (2.4%) | 445 (18.3%) |
| 4 or 5 Rooms | 1,169 (25.2%) | 955 (39.3%) |
| 6 or 7 Rooms | 2,302 (49.7%) | 641 (26.4%) |
| 8 or more Rooms | 1,030 (22.2%) | 360 (14.8%) |
| Total | 4,633 (100.0%) | 2,433 (100.0%) |
Housing Structure by Heating Type in Portland
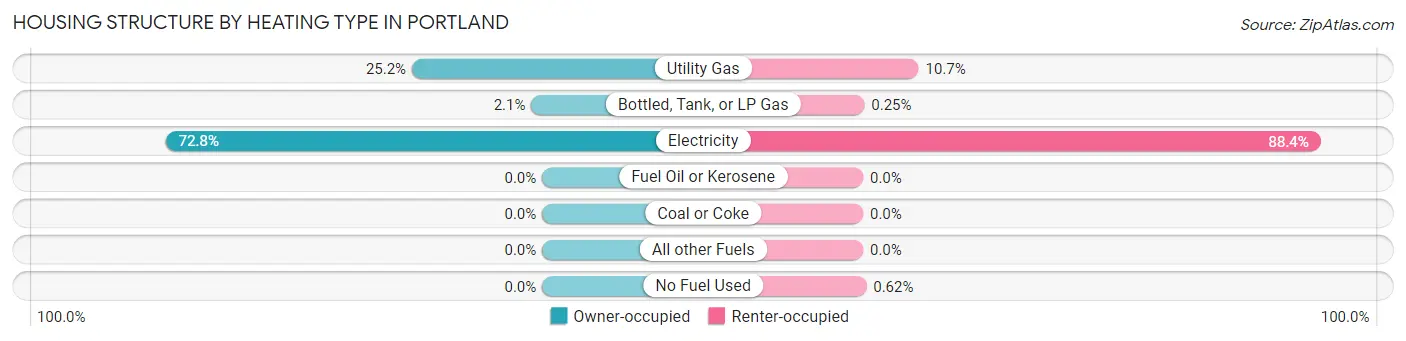
| Heating Type | Owner-occupied | Renter-occupied |
| Utility Gas | 1,165 (25.2%) | 261 (10.7%) |
| Bottled, Tank, or LP Gas | 97 (2.1%) | 6 (0.3%) |
| Electricity | 3,371 (72.8%) | 2,151 (88.4%) |
| Fuel Oil or Kerosene | 0 (0.0%) | 0 (0.0%) |
| Coal or Coke | 0 (0.0%) | 0 (0.0%) |
| All other Fuels | 0 (0.0%) | 0 (0.0%) |
| No Fuel Used | 0 (0.0%) | 15 (0.6%) |
| Total | 4,633 (100.0%) | 2,433 (100.0%) |
Household Vehicle Usage in Portland
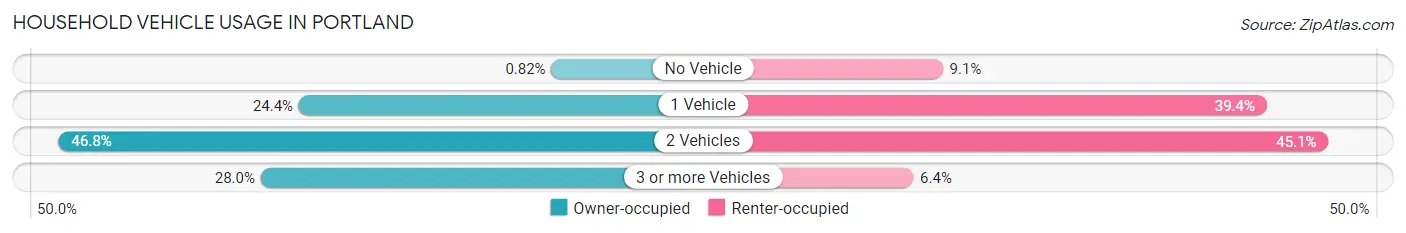
| Vehicles per Household | Owner-occupied | Renter-occupied |
| No Vehicle | 38 (0.8%) | 222 (9.1%) |
| 1 Vehicle | 1,130 (24.4%) | 958 (39.4%) |
| 2 Vehicles | 2,170 (46.8%) | 1,098 (45.1%) |
| 3 or more Vehicles | 1,295 (28.0%) | 155 (6.4%) |
| Total | 4,633 (100.0%) | 2,433 (100.0%) |
Real Estate & Mortgages in Portland
Real Estate and Mortgage Overview in Portland
| Characteristic | Without Mortgage | With Mortgage |
| Housing Units | 1,874 | 2,759 |
| Median Property Value | $213,400 | $222,700 |
| Median Household Income | $65,962 | $1,004 |
| Monthly Housing Costs | $781 | $189 |
| Real Estate Taxes | $3,515 | $60 |
Property Value by Mortgage Status in Portland
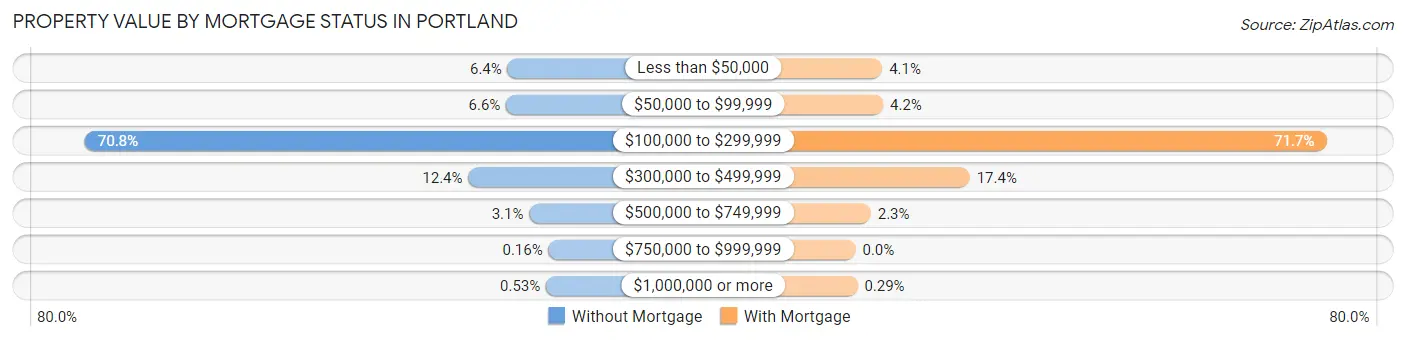
| Property Value | Without Mortgage | With Mortgage |
| Less than $50,000 | 120 (6.4%) | 112 (4.1%) |
| $50,000 to $99,999 | 124 (6.6%) | 116 (4.2%) |
| $100,000 to $299,999 | 1,327 (70.8%) | 1,979 (71.7%) |
| $300,000 to $499,999 | 232 (12.4%) | 480 (17.4%) |
| $500,000 to $749,999 | 58 (3.1%) | 64 (2.3%) |
| $750,000 to $999,999 | 3 (0.2%) | 0 (0.0%) |
| $1,000,000 or more | 10 (0.5%) | 8 (0.3%) |
| Total | 1,874 (100.0%) | 2,759 (100.0%) |
Household Income by Mortgage Status in Portland
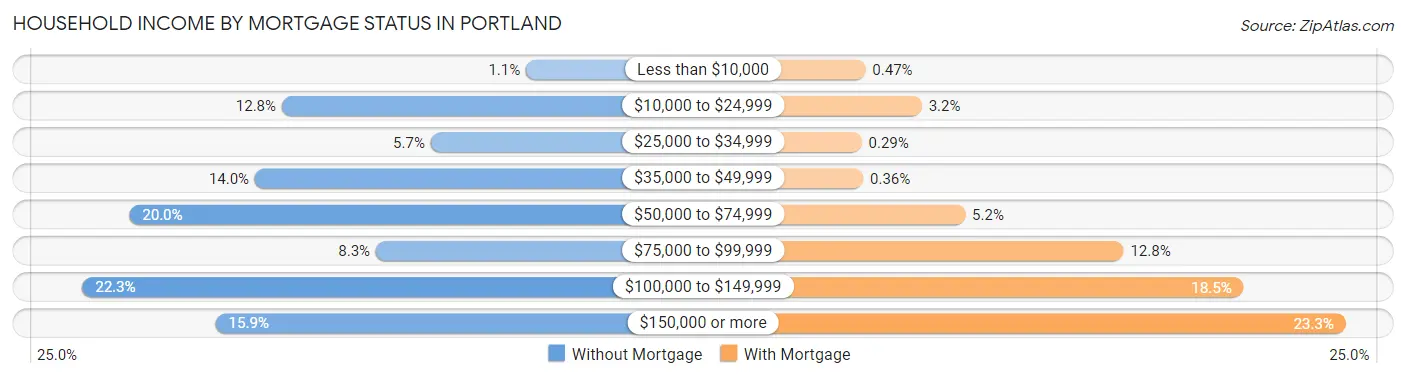
| Household Income | Without Mortgage | With Mortgage |
| Less than $10,000 | 21 (1.1%) | 13 (0.5%) |
| $10,000 to $24,999 | 239 (12.8%) | 87 (3.2%) |
| $25,000 to $34,999 | 106 (5.7%) | 8 (0.3%) |
| $35,000 to $49,999 | 263 (14.0%) | 10 (0.4%) |
| $50,000 to $74,999 | 375 (20.0%) | 144 (5.2%) |
| $75,000 to $99,999 | 155 (8.3%) | 352 (12.8%) |
| $100,000 to $149,999 | 417 (22.3%) | 510 (18.5%) |
| $150,000 or more | 298 (15.9%) | 644 (23.3%) |
| Total | 1,874 (100.0%) | 2,759 (100.0%) |
Property Value to Household Income Ratio in Portland
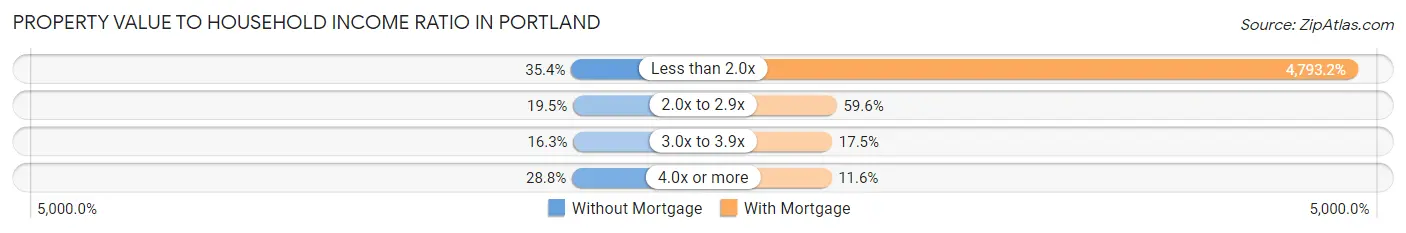
| Value-to-Income Ratio | Without Mortgage | With Mortgage |
| Less than 2.0x | 664 (35.4%) | 132,243 (4,793.1%) |
| 2.0x to 2.9x | 365 (19.5%) | 1,645 (59.6%) |
| 3.0x to 3.9x | 305 (16.3%) | 482 (17.5%) |
| 4.0x or more | 540 (28.8%) | 321 (11.6%) |
| Total | 1,874 (100.0%) | 2,759 (100.0%) |
Real Estate Taxes by Mortgage Status in Portland
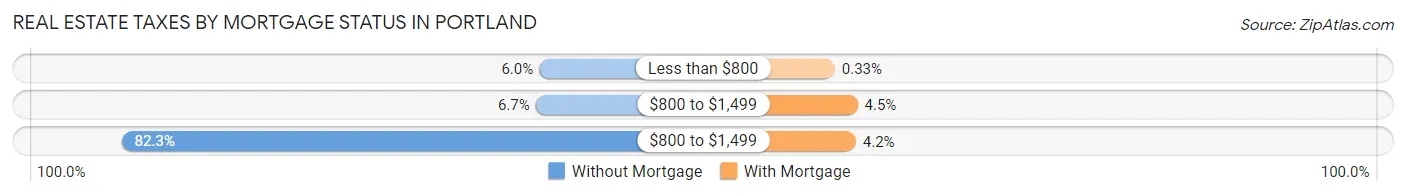
| Property Taxes | Without Mortgage | With Mortgage |
| Less than $800 | 113 (6.0%) | 9 (0.3%) |
| $800 to $1,499 | 125 (6.7%) | 124 (4.5%) |
| $800 to $1,499 | 1,542 (82.3%) | 115 (4.2%) |
| Total | 1,874 (100.0%) | 2,759 (100.0%) |
Health & Disability in Portland
Health Insurance Coverage by Age in Portland
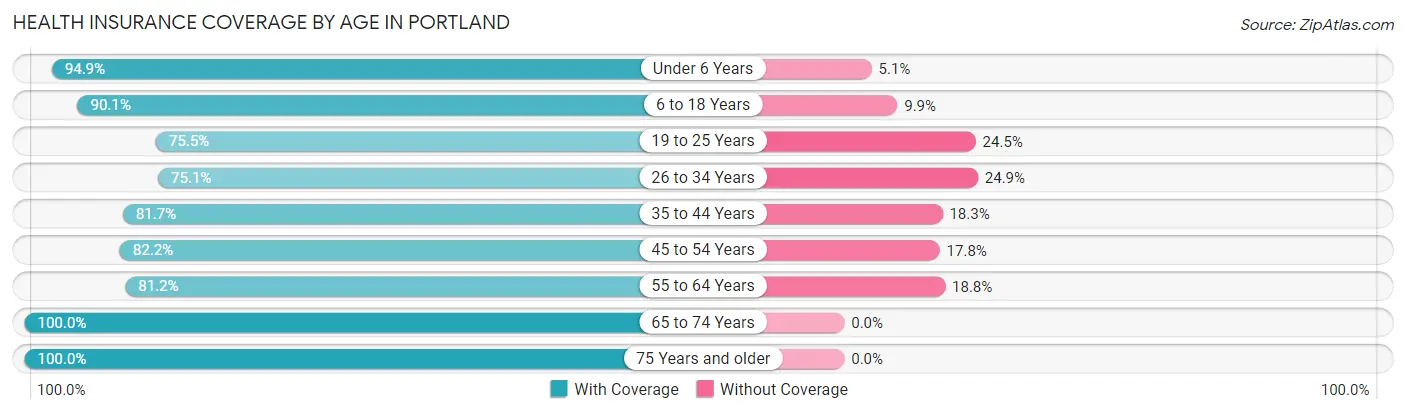
| Age Bracket | With Coverage | Without Coverage |
| Under 6 Years | 1,677 (94.9%) | 90 (5.1%) |
| 6 to 18 Years | 3,393 (90.1%) | 372 (9.9%) |
| 19 to 25 Years | 1,371 (75.5%) | 445 (24.5%) |
| 26 to 34 Years | 2,237 (75.1%) | 742 (24.9%) |
| 35 to 44 Years | 2,324 (81.7%) | 521 (18.3%) |
| 45 to 54 Years | 1,863 (82.2%) | 403 (17.8%) |
| 55 to 64 Years | 1,542 (81.2%) | 357 (18.8%) |
| 65 to 74 Years | 1,562 (100.0%) | 0 (0.0%) |
| 75 Years and older | 1,097 (100.0%) | 0 (0.0%) |
| Total | 17,066 (85.4%) | 2,930 (14.6%) |
Health Insurance Coverage by Citizenship Status in Portland
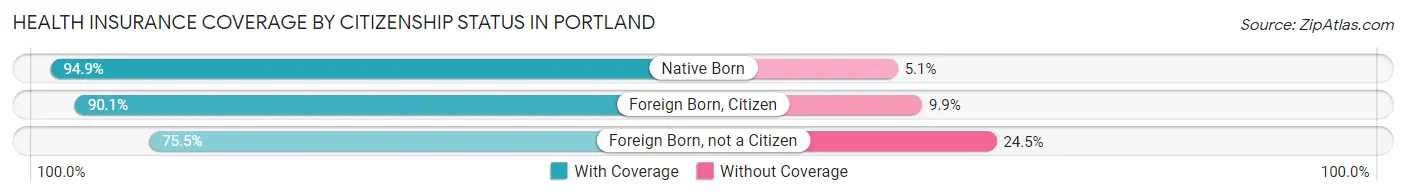
| Citizenship Status | With Coverage | Without Coverage |
| Native Born | 1,677 (94.9%) | 90 (5.1%) |
| Foreign Born, Citizen | 3,393 (90.1%) | 372 (9.9%) |
| Foreign Born, not a Citizen | 1,371 (75.5%) | 445 (24.5%) |
Health Insurance Coverage by Household Income in Portland
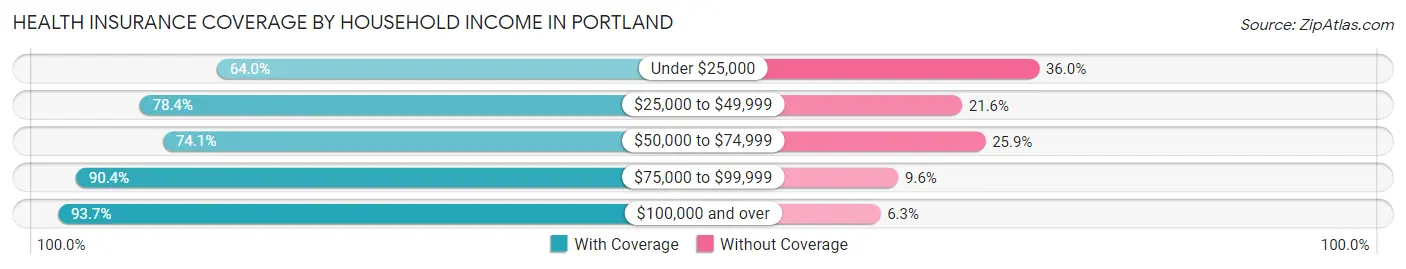
| Household Income | With Coverage | Without Coverage |
| Under $25,000 | 1,125 (64.0%) | 633 (36.0%) |
| $25,000 to $49,999 | 1,717 (78.4%) | 472 (21.6%) |
| $50,000 to $74,999 | 2,640 (74.1%) | 924 (25.9%) |
| $75,000 to $99,999 | 3,217 (90.4%) | 342 (9.6%) |
| $100,000 and over | 8,367 (93.7%) | 559 (6.3%) |
Public vs Private Health Insurance Coverage by Age in Portland
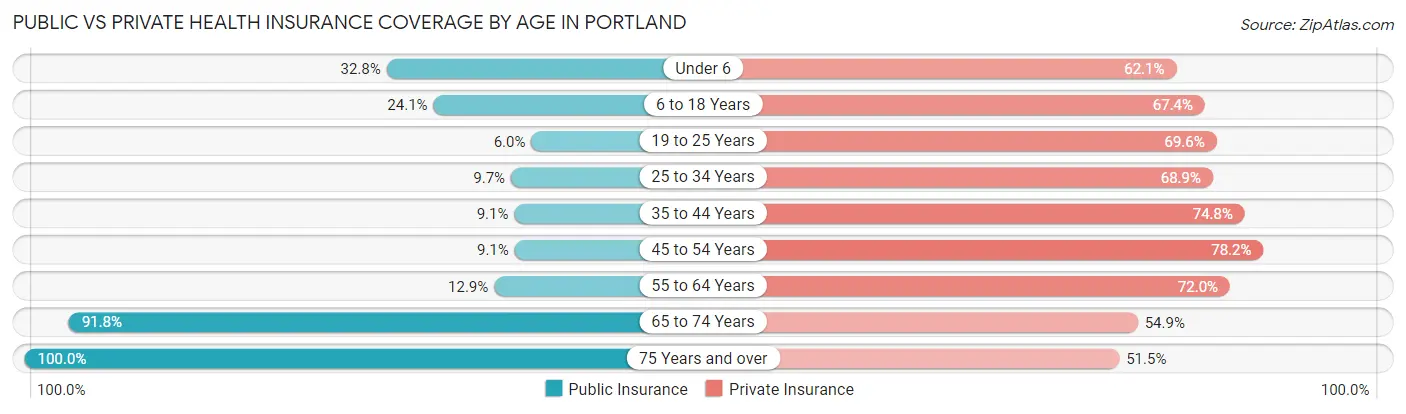
| Age Bracket | Public Insurance | Private Insurance |
| Under 6 | 580 (32.8%) | 1,097 (62.1%) |
| 6 to 18 Years | 908 (24.1%) | 2,537 (67.4%) |
| 19 to 25 Years | 108 (5.9%) | 1,263 (69.6%) |
| 25 to 34 Years | 290 (9.7%) | 2,051 (68.9%) |
| 35 to 44 Years | 259 (9.1%) | 2,128 (74.8%) |
| 45 to 54 Years | 205 (9.0%) | 1,773 (78.2%) |
| 55 to 64 Years | 244 (12.9%) | 1,368 (72.0%) |
| 65 to 74 Years | 1,434 (91.8%) | 858 (54.9%) |
| 75 Years and over | 1,097 (100.0%) | 565 (51.5%) |
| Total | 5,125 (25.6%) | 13,640 (68.2%) |
Disability Status by Sex by Age in Portland
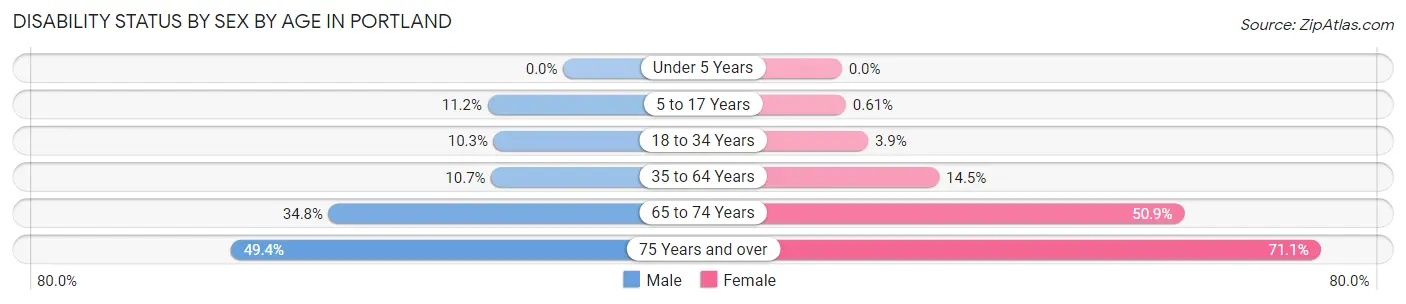
| Age Bracket | Male | Female |
| Under 5 Years | 0 (0.0%) | 0 (0.0%) |
| 5 to 17 Years | 242 (11.2%) | 10 (0.6%) |
| 18 to 34 Years | 300 (10.3%) | 85 (3.9%) |
| 35 to 64 Years | 356 (10.7%) | 531 (14.4%) |
| 65 to 74 Years | 281 (34.8%) | 384 (50.9%) |
| 75 Years and over | 202 (49.4%) | 489 (71.1%) |
Disability Class by Sex by Age in Portland
Disability Class: Hearing Difficulty
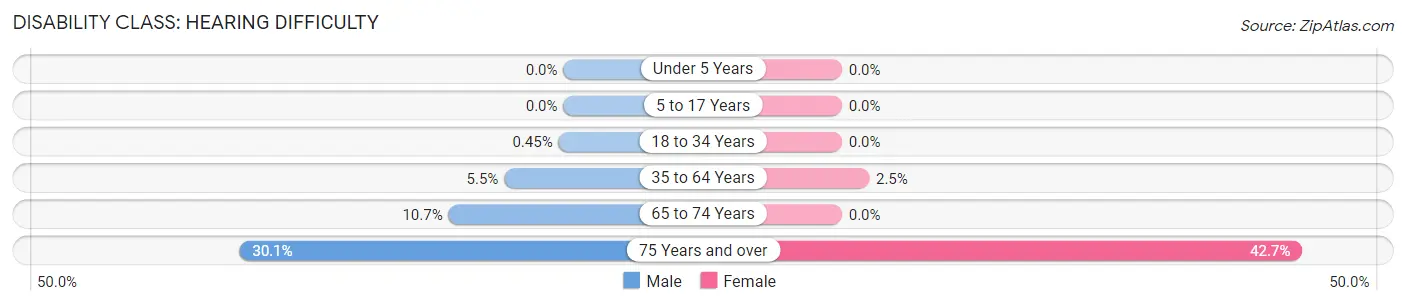
| Age Bracket | Male | Female |
| Under 5 Years | 0 (0.0%) | 0 (0.0%) |
| 5 to 17 Years | 0 (0.0%) | 0 (0.0%) |
| 18 to 34 Years | 13 (0.4%) | 0 (0.0%) |
| 35 to 64 Years | 183 (5.5%) | 93 (2.5%) |
| 65 to 74 Years | 86 (10.7%) | 0 (0.0%) |
| 75 Years and over | 123 (30.1%) | 294 (42.7%) |
Disability Class: Vision Difficulty
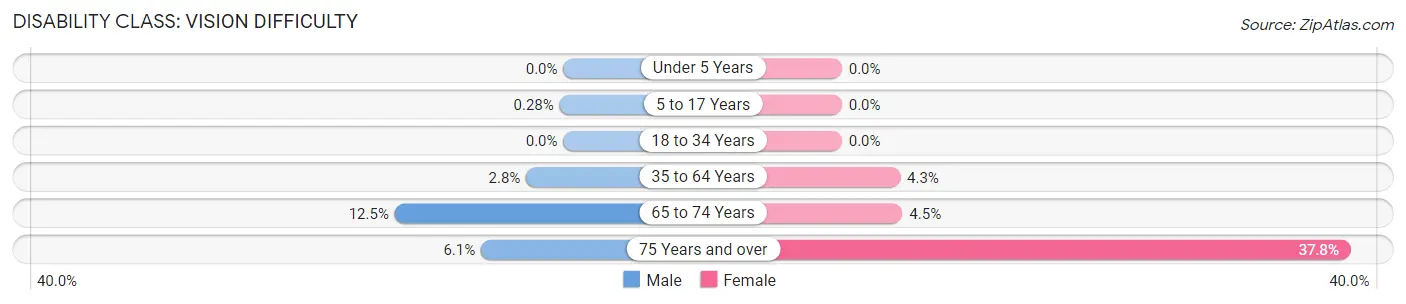
| Age Bracket | Male | Female |
| Under 5 Years | 0 (0.0%) | 0 (0.0%) |
| 5 to 17 Years | 6 (0.3%) | 0 (0.0%) |
| 18 to 34 Years | 0 (0.0%) | 0 (0.0%) |
| 35 to 64 Years | 92 (2.8%) | 159 (4.3%) |
| 65 to 74 Years | 101 (12.5%) | 34 (4.5%) |
| 75 Years and over | 25 (6.1%) | 260 (37.8%) |
Disability Class: Cognitive Difficulty
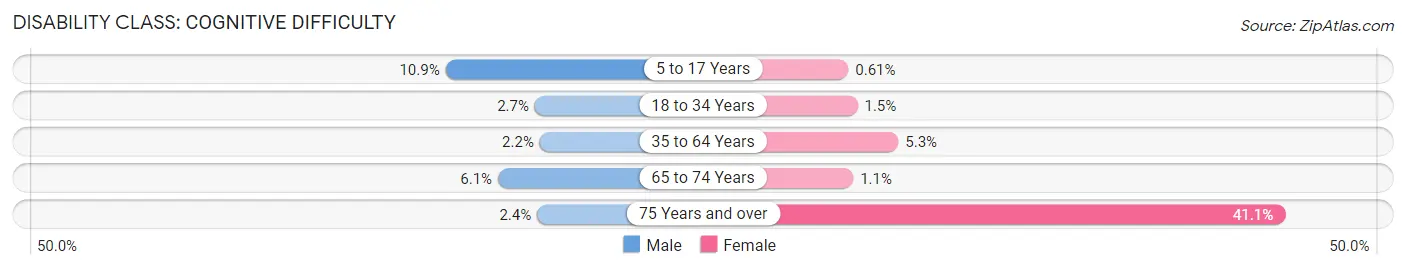
| Age Bracket | Male | Female |
| 5 to 17 Years | 236 (10.9%) | 10 (0.6%) |
| 18 to 34 Years | 77 (2.6%) | 32 (1.5%) |
| 35 to 64 Years | 73 (2.2%) | 193 (5.2%) |
| 65 to 74 Years | 49 (6.1%) | 8 (1.1%) |
| 75 Years and over | 10 (2.4%) | 283 (41.1%) |
Disability Class: Ambulatory Difficulty
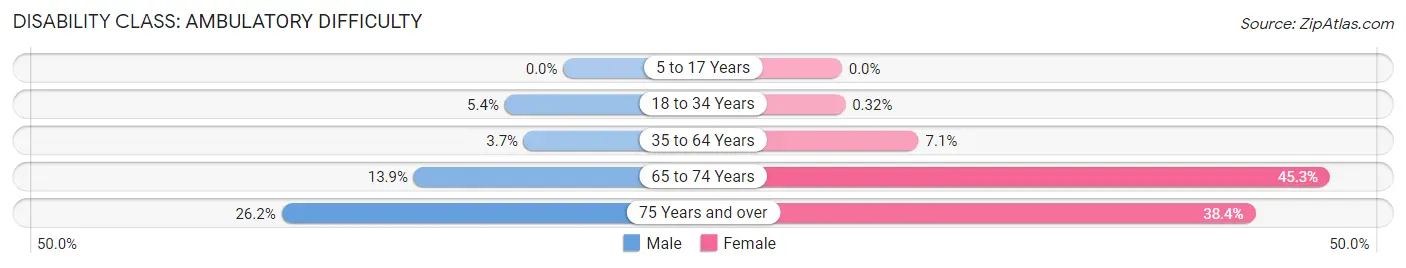
| Age Bracket | Male | Female |
| 5 to 17 Years | 0 (0.0%) | 0 (0.0%) |
| 18 to 34 Years | 158 (5.4%) | 7 (0.3%) |
| 35 to 64 Years | 122 (3.7%) | 262 (7.1%) |
| 65 to 74 Years | 112 (13.9%) | 342 (45.3%) |
| 75 Years and over | 107 (26.2%) | 264 (38.4%) |
Disability Class: Self-Care Difficulty
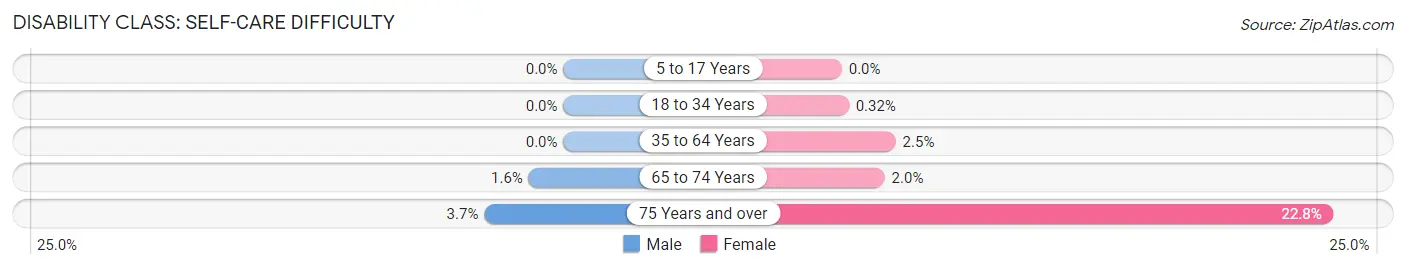
| Age Bracket | Male | Female |
| 5 to 17 Years | 0 (0.0%) | 0 (0.0%) |
| 18 to 34 Years | 0 (0.0%) | 7 (0.3%) |
| 35 to 64 Years | 0 (0.0%) | 92 (2.5%) |
| 65 to 74 Years | 13 (1.6%) | 15 (2.0%) |
| 75 Years and over | 15 (3.7%) | 157 (22.8%) |
Technology Access in Portland
Computing Device Access in Portland
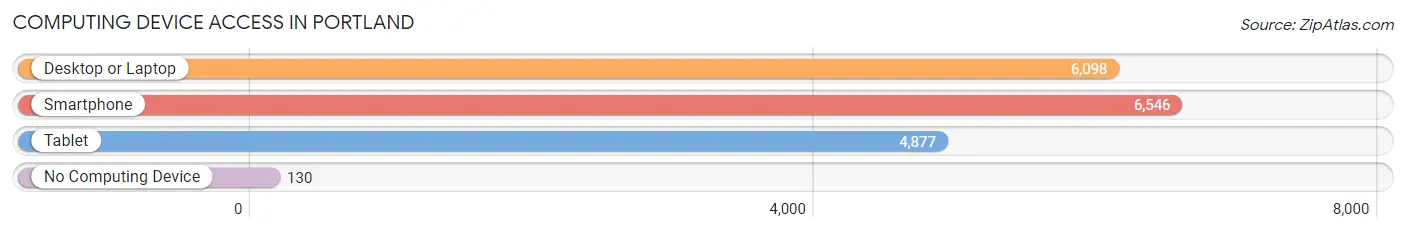
| Device Type | # Households | % Households |
| Desktop or Laptop | 6,098 | 86.3% |
| Smartphone | 6,546 | 92.6% |
| Tablet | 4,877 | 69.0% |
| No Computing Device | 130 | 1.8% |
| Total | 7,066 | 100.0% |
Internet Access in Portland
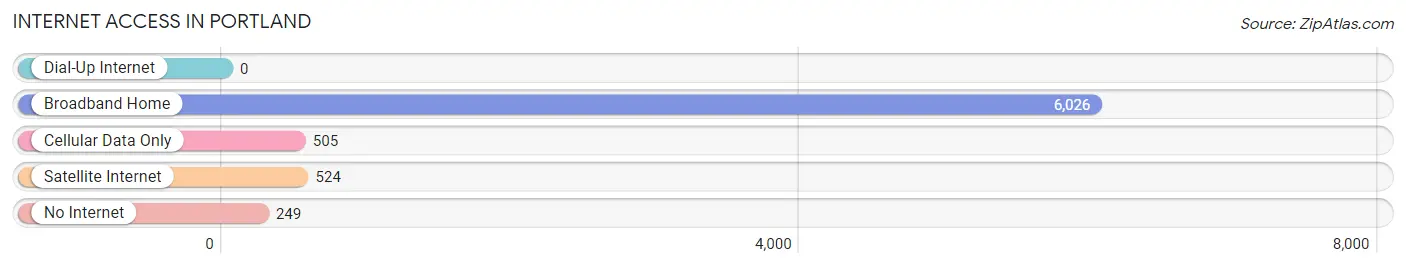
| Internet Type | # Households | % Households |
| Dial-Up Internet | 0 | 0.0% |
| Broadband Home | 6,026 | 85.3% |
| Cellular Data Only | 505 | 7.1% |
| Satellite Internet | 524 | 7.4% |
| No Internet | 249 | 3.5% |
| Total | 7,066 | 100.0% |
Portland Summary
Portland, Texas is a city located in San Patricio County, Texas, United States. It is part of the Corpus Christi Metropolitan Statistical Area. The population was estimated to be 13,903 in 2019.
History
Portland was founded in 1852 by a group of settlers from the nearby town of Refugio. The town was named after Portland, Maine, and was originally intended to be a port city. However, the town never developed into a major port, and instead became a small farming community.
In the late 19th century, the town began to grow as a result of the discovery of oil in the area. The town was incorporated in 1911, and the population grew rapidly. By the mid-20th century, Portland had become a major center for oil production and refining.
Geography
Portland is located in San Patricio County, Texas, on the Gulf Coast. It is situated on the Nueces River, about 25 miles (40 km) south of Corpus Christi. The city covers an area of 8.3 square miles (21.5 km2), and has a population density of 1,637 people per square mile (631/km2).
The climate in Portland is humid subtropical, with hot summers and mild winters. The average annual temperature is 73 °F (23 °C), and the average annual precipitation is 33.3 inches (84.6 cm).
Economy
The economy of Portland is largely based on oil and gas production and refining. The city is home to several major oil and gas companies, including Valero Energy Corporation, Chevron Corporation, and Phillips 66.
In addition to oil and gas, Portland is also home to several manufacturing companies, including a large paper mill and a plastics plant. The city is also home to several retail stores, restaurants, and other businesses.
Demographics
As of the 2019 census, the population of Portland was estimated to be 13,903. The racial makeup of the city was 79.2% White, 8.2% African American, 0.7% Native American, 0.7% Asian, 0.1% Pacific Islander, 8.7% from other races, and 2.4% from two or more races. Hispanic or Latino of any race were 18.3% of the population.
The median household income in Portland was $50,945, and the median family income was $60,945. The per capita income was $25,945. About 11.3% of the population was below the poverty line.
Conclusion
Portland, Texas is a city located in San Patricio County, Texas, United States. It is part of the Corpus Christi Metropolitan Statistical Area. The population was estimated to be 13,903 in 2019. The economy of Portland is largely based on oil and gas production and refining, and the city is also home to several manufacturing companies, retail stores, restaurants, and other businesses. The racial makeup of the city was 79.2% White, 8.2% African American, 0.7% Native American, 0.7% Asian, 0.1% Pacific Islander, 8.7% from other races, and 2.4% from two or more races. The median household income in Portland was $50,945, and the median family income was $60,945. Portland is a vibrant city with a rich history and a diverse economy.
Common Questions
What is Per Capita Income in Portland?
Per Capita income in Portland is $38,253.
What is the Median Family Income in Portland?
Median Family Income in Portland is $93,950.
What is the Median Household income in Portland?
Median Household Income in Portland is $83,493.
What is Income or Wage Gap in Portland?
Income or Wage Gap in Portland is 34.9%.
Women in Portland earn 65.1 cents for every dollar earned by a man.
What is Family Income Deficit in Portland?
Family Income Deficit in Portland is $17,005.
Families that are below poverty line in Portland earn $17,005 less on average than the poverty threshold level.
What is Inequality or Gini Index in Portland?
Inequality or Gini Index in Portland is 0.41.
What is the Total Population of Portland?
Total Population of Portland is 20,130.
What is the Total Male Population of Portland?
Total Male Population of Portland is 10,422.
What is the Total Female Population of Portland?
Total Female Population of Portland is 9,708.
What is the Ratio of Males per 100 Females in Portland?
There are 107.35 Males per 100 Females in Portland.
What is the Ratio of Females per 100 Males in Portland?
There are 93.15 Females per 100 Males in Portland.
What is the Median Population Age in Portland?
Median Population Age in Portland is 34.2 Years.
What is the Average Family Size in Portland
Average Family Size in Portland is 3.3 People.
What is the Average Household Size in Portland
Average Household Size in Portland is 2.8 People.
How Large is the Labor Force in Portland?
There are 9,776 People in the Labor Forcein in Portland.
What is the Percentage of People in the Labor Force in Portland?
64.2% of People are in the Labor Force in Portland.
What is the Unemployment Rate in Portland?
Unemployment Rate in Portland is 3.1%.