Cities with the Most Immigrants from Bolivia in Texas
RELATED REPORTS & OPTIONS
Bolivia
Texas
Compare Cities
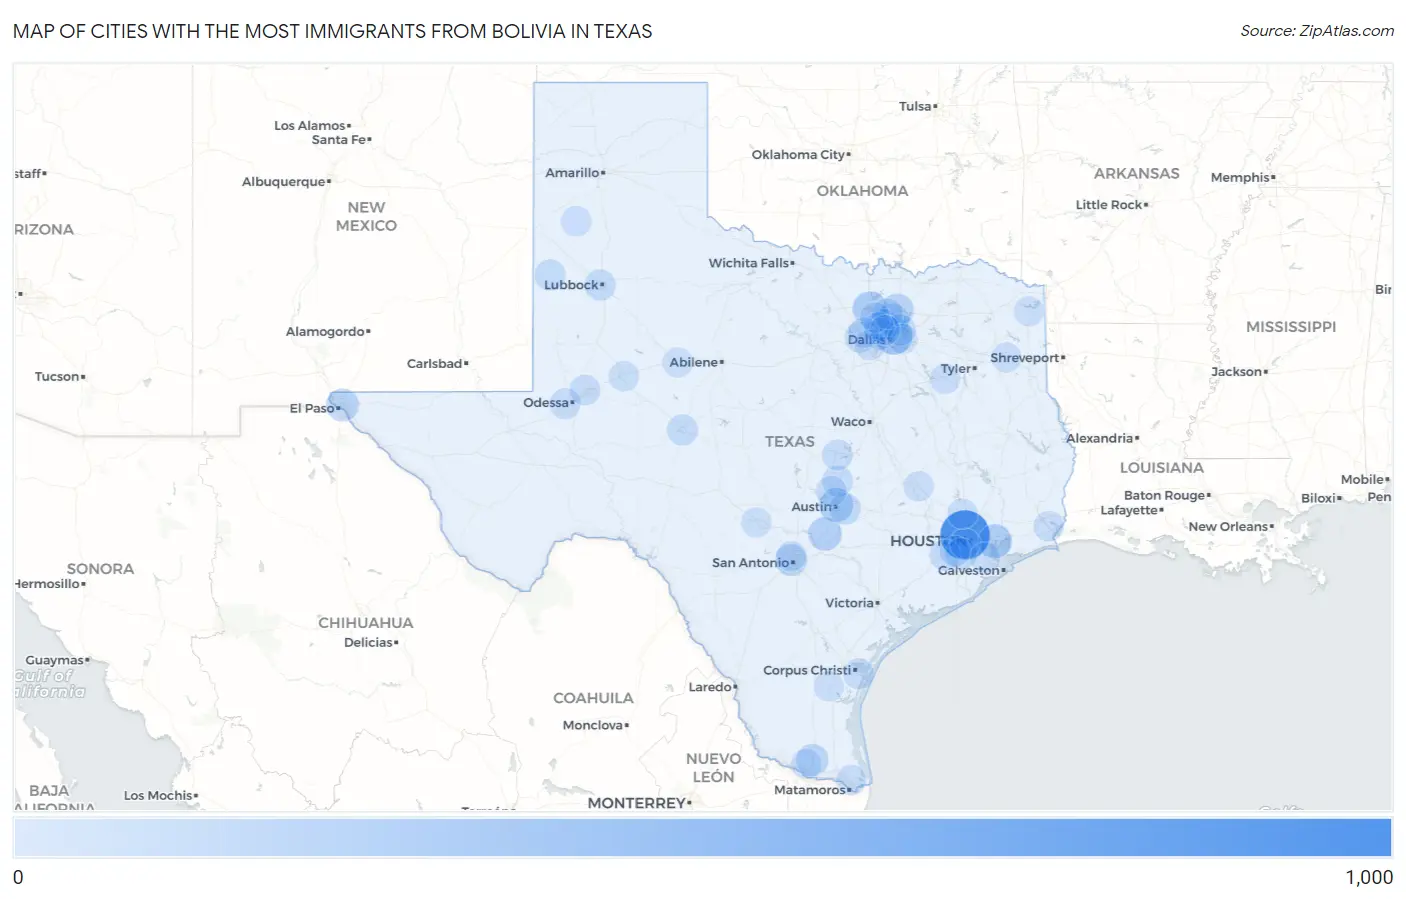
Map of Cities with the Most Immigrants from Bolivia in Texas
0
1,000
Cities with the Most Immigrants from Bolivia in Texas
| City | Bolivia | vs State | vs National | |
| 1. | Houston | 889 | 4,409(20.16%)#1 | 80,173(1.11%)#8 |
| 2. | Dallas | 302 | 4,409(6.85%)#2 | 80,173(0.38%)#38 |
| 3. | Denton | 196 | 4,409(4.45%)#3 | 80,173(0.24%)#69 |
| 4. | Baytown | 171 | 4,409(3.88%)#4 | 80,173(0.21%)#84 |
| 5. | Austin | 166 | 4,409(3.77%)#5 | 80,173(0.21%)#88 |
| 6. | San Marcos | 150 | 4,409(3.40%)#6 | 80,173(0.19%)#98 |
| 7. | El Paso | 116 | 4,409(2.63%)#7 | 80,173(0.14%)#126 |
| 8. | Plano | 108 | 4,409(2.45%)#8 | 80,173(0.13%)#137 |
| 9. | Mckinney | 108 | 4,409(2.45%)#9 | 80,173(0.13%)#138 |
| 10. | Edinburg | 84 | 4,409(1.91%)#10 | 80,173(0.10%)#179 |
| 11. | San Antonio | 83 | 4,409(1.88%)#11 | 80,173(0.10%)#182 |
| 12. | Carrollton | 67 | 4,409(1.52%)#12 | 80,173(0.08%)#224 |
| 13. | Irving | 66 | 4,409(1.50%)#13 | 80,173(0.08%)#229 |
| 14. | Missouri City | 61 | 4,409(1.38%)#14 | 80,173(0.08%)#247 |
| 15. | Garland | 59 | 4,409(1.34%)#15 | 80,173(0.07%)#254 |
| 16. | Hornsby Bend | 56 | 4,409(1.27%)#16 | 80,173(0.07%)#274 |
| 17. | Lubbock | 49 | 4,409(1.11%)#17 | 80,173(0.06%)#302 |
| 18. | Rosenberg | 43 | 4,409(0.98%)#18 | 80,173(0.05%)#333 |
| 19. | Morton | 42 | 4,409(0.95%)#19 | 80,173(0.05%)#341 |
| 20. | San Angelo | 41 | 4,409(0.93%)#20 | 80,173(0.05%)#343 |
| 21. | Georgetown | 38 | 4,409(0.86%)#21 | 80,173(0.05%)#364 |
| 22. | West Odessa | 36 | 4,409(0.82%)#22 | 80,173(0.04%)#388 |
| 23. | Frisco | 31 | 4,409(0.70%)#23 | 80,173(0.04%)#416 |
| 24. | Killeen | 31 | 4,409(0.70%)#24 | 80,173(0.04%)#417 |
| 25. | Corpus Christi | 26 | 4,409(0.59%)#25 | 80,173(0.03%)#469 |
| 26. | Midland | 26 | 4,409(0.59%)#26 | 80,173(0.03%)#472 |
| 27. | Sugar Land | 25 | 4,409(0.57%)#27 | 80,173(0.03%)#486 |
| 28. | Fort Worth | 24 | 4,409(0.54%)#28 | 80,173(0.03%)#498 |
| 29. | Coppell | 21 | 4,409(0.48%)#29 | 80,173(0.03%)#554 |
| 30. | Arlington | 19 | 4,409(0.43%)#30 | 80,173(0.02%)#579 |
| 31. | Cedar Park | 18 | 4,409(0.41%)#31 | 80,173(0.02%)#607 |
| 32. | Dimmitt | 16 | 4,409(0.36%)#32 | 80,173(0.02%)#656 |
| 33. | Nederland | 15 | 4,409(0.34%)#33 | 80,173(0.02%)#669 |
| 34. | Bellaire | 13 | 4,409(0.29%)#34 | 80,173(0.02%)#716 |
| 35. | Watauga | 11 | 4,409(0.25%)#35 | 80,173(0.01%)#767 |
| 36. | Big Spring | 10 | 4,409(0.23%)#36 | 80,173(0.01%)#792 |
| 37. | The Woodlands | 9 | 4,409(0.20%)#37 | 80,173(0.01%)#821 |
| 38. | Highland Village | 9 | 4,409(0.20%)#38 | 80,173(0.01%)#837 |
| 39. | Brownsville | 8 | 4,409(0.18%)#39 | 80,173(0.01%)#847 |
| 40. | Mcallen | 8 | 4,409(0.18%)#40 | 80,173(0.01%)#849 |
| 41. | League City | 8 | 4,409(0.18%)#41 | 80,173(0.01%)#852 |
| 42. | Athens | 8 | 4,409(0.18%)#42 | 80,173(0.01%)#870 |
| 43. | College Station | 7 | 4,409(0.16%)#43 | 80,173(0.01%)#880 |
| 44. | Kingsville | 7 | 4,409(0.16%)#44 | 80,173(0.01%)#897 |
| 45. | Kerrville | 6 | 4,409(0.14%)#45 | 80,173(0.01%)#922 |
| 46. | Castle Hills | 5 | 4,409(0.11%)#46 | 80,173(0.01%)#943 |
| 47. | Douglassville | 5 | 4,409(0.11%)#47 | 80,173(0.01%)#952 |
| 48. | Sunnyvale | 4 | 4,409(0.09%)#48 | 80,173(0.00%)#964 |
| 49. | Longview | 3 | 4,409(0.07%)#49 | 80,173(0.00%)#974 |
| 50. | Roscoe | 3 | 4,409(0.07%)#50 | 80,173(0.00%)#986 |
| 51. | Farmers Branch | 1 | 4,409(0.02%)#51 | 80,173(0.00%)#1,010 |
Common Questions
What are the Top 10 Cities with the Most Immigrants from Bolivia in Texas?
Top 10 Cities with the Most Immigrants from Bolivia in Texas are:
What city has the Most Immigrants from Bolivia in Texas?
Houston has the Most Immigrants from Bolivia in Texas with 889.
What is the Total Immigrants from Bolivia in the State of Texas?
Total Immigrants from Bolivia in Texas is 4,409.
What is the Total Immigrants from Bolivia in the United States?
Total Immigrants from Bolivia in the United States is 80,173.