Jacksboro, TX Map & Demographics
Jacksboro Map
Jacksboro Overview
$22,547
PER CAPITA INCOME
$60,781
AVG FAMILY INCOME
$38,774
AVG HOUSEHOLD INCOME
31.7%
WAGE / INCOME GAP [ % ]
68.3¢/ $1
WAGE / INCOME GAP [ $ ]
0.53
INEQUALITY / GINI INDEX
4,213
TOTAL POPULATION
2,489
MALE POPULATION
1,724
FEMALE POPULATION
144.37
MALES / 100 FEMALES
69.26
FEMALES / 100 MALES
35.7
MEDIAN AGE
3.2
AVG FAMILY SIZE
2.4
AVG HOUSEHOLD SIZE
1,365
LABOR FORCE [ PEOPLE ]
40.7%
PERCENT IN LABOR FORCE
10.2%
UNEMPLOYMENT RATE
Jacksboro Zip Codes
Jacksboro Area Codes
Income in Jacksboro
Income Overview in Jacksboro
Per Capita Income in Jacksboro is $22,547, while median incomes of families and households are $60,781 and $38,774 respectively.
| Characteristic | Number | Measure |
| Per Capita Income | 4,213 | $22,547 |
| Median Family Income | 804 | $60,781 |
| Mean Family Income | 804 | $82,646 |
| Median Household Income | 1,356 | $38,774 |
| Mean Household Income | 1,356 | $65,695 |
| Income Deficit | 804 | $0 |
| Wage / Income Gap (%) | 4,213 | 31.70% |
| Wage / Income Gap ($) | 4,213 | 68.30¢ per $1 |
| Gini / Inequality Index | 4,213 | 0.53 |
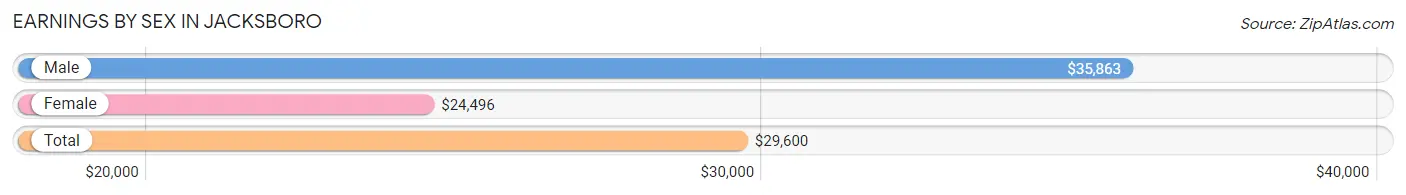
Earnings by Sex in Jacksboro
Average Earnings in Jacksboro are $29,600, $35,863 for men and $24,496 for women, a difference of 31.7%.
| Sex | Number | Average Earnings |
| Male | 993 (62.1%) | $35,863 |
| Female | 607 (37.9%) | $24,496 |
| Total | 1,600 (100.0%) | $29,600 |
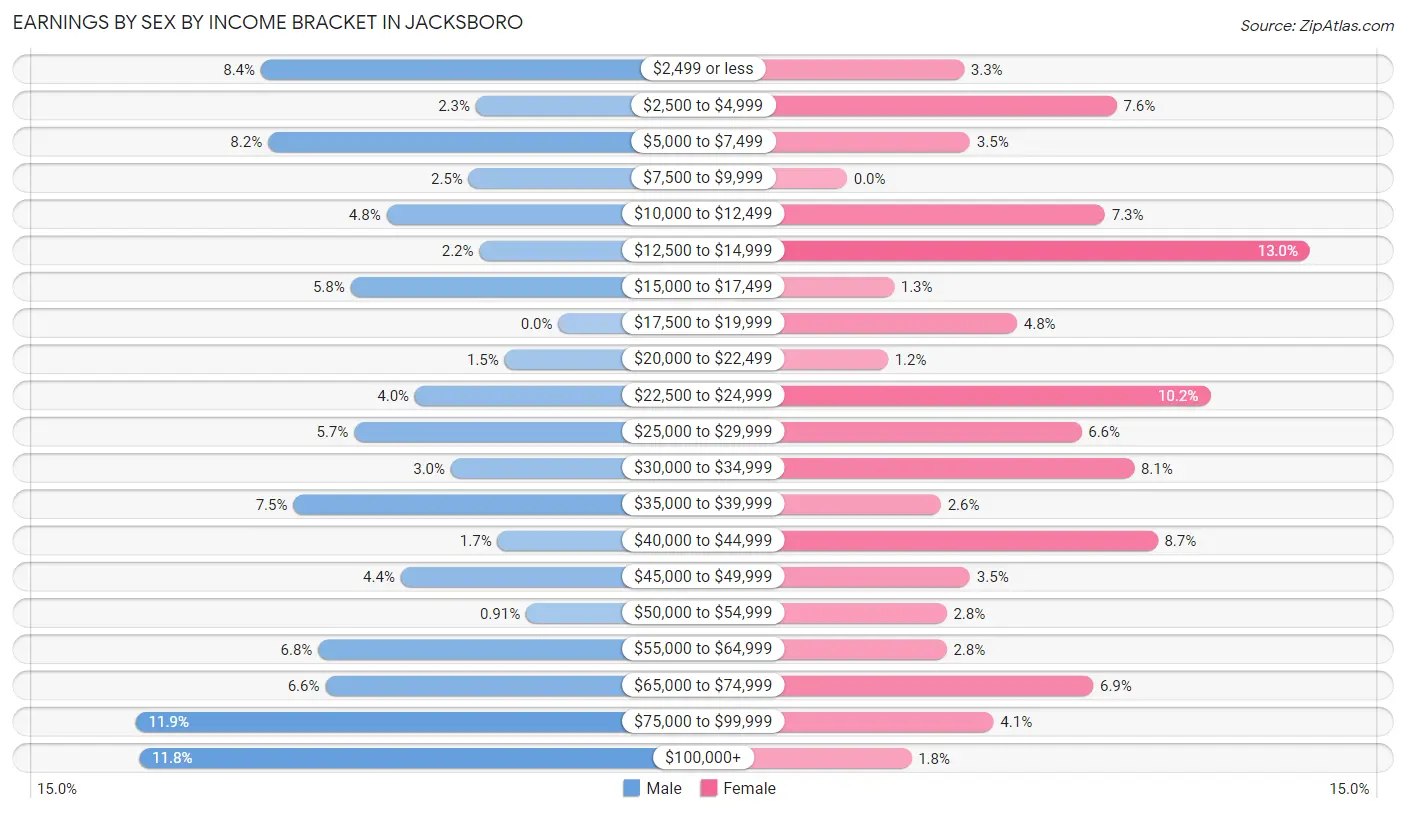
Earnings by Sex by Income Bracket in Jacksboro
The most common earnings brackets in Jacksboro are $75,000 to $99,999 for men (118 | 11.9%) and $12,500 to $14,999 for women (79 | 13.0%).
| Income | Male | Female |
| $2,499 or less | 83 (8.4%) | 20 (3.3%) |
| $2,500 to $4,999 | 23 (2.3%) | 46 (7.6%) |
| $5,000 to $7,499 | 81 (8.2%) | 21 (3.5%) |
| $7,500 to $9,999 | 25 (2.5%) | 0 (0.0%) |
| $10,000 to $12,499 | 48 (4.8%) | 44 (7.2%) |
| $12,500 to $14,999 | 22 (2.2%) | 79 (13.0%) |
| $15,000 to $17,499 | 58 (5.8%) | 8 (1.3%) |
| $17,500 to $19,999 | 0 (0.0%) | 29 (4.8%) |
| $20,000 to $22,499 | 15 (1.5%) | 7 (1.1%) |
| $22,500 to $24,999 | 40 (4.0%) | 62 (10.2%) |
| $25,000 to $29,999 | 57 (5.7%) | 40 (6.6%) |
| $30,000 to $34,999 | 30 (3.0%) | 49 (8.1%) |
| $35,000 to $39,999 | 74 (7.4%) | 16 (2.6%) |
| $40,000 to $44,999 | 17 (1.7%) | 53 (8.7%) |
| $45,000 to $49,999 | 44 (4.4%) | 21 (3.5%) |
| $50,000 to $54,999 | 9 (0.9%) | 17 (2.8%) |
| $55,000 to $64,999 | 67 (6.8%) | 17 (2.8%) |
| $65,000 to $74,999 | 65 (6.6%) | 42 (6.9%) |
| $75,000 to $99,999 | 118 (11.9%) | 25 (4.1%) |
| $100,000+ | 117 (11.8%) | 11 (1.8%) |
| Total | 993 (100.0%) | 607 (100.0%) |
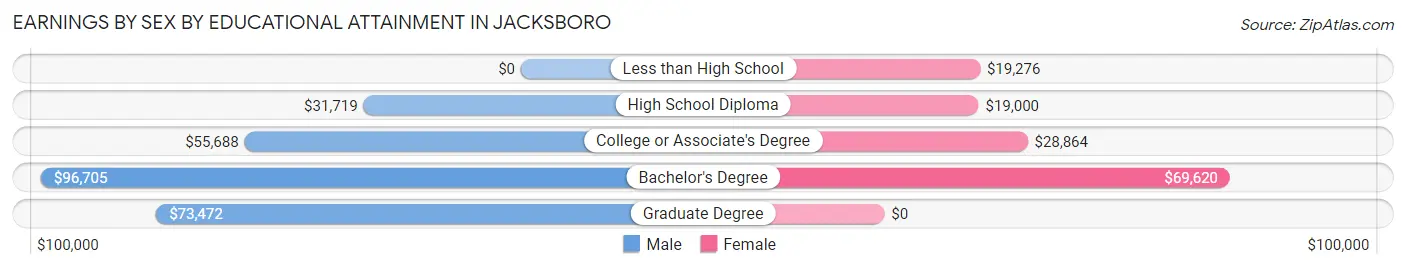
Earnings by Sex by Educational Attainment in Jacksboro
Average earnings in Jacksboro are $39,141 for men and $25,521 for women, a difference of 34.8%. Men with an educational attainment of bachelor's degree enjoy the highest average annual earnings of $96,705, while those with high school diploma education earn the least with $31,719. Women with an educational attainment of bachelor's degree earn the most with the average annual earnings of $69,620, while those with high school diploma education have the smallest earnings of $19,000.
| Educational Attainment | Male Income | Female Income |
| Less than High School | - | - |
| High School Diploma | $31,719 | $19,000 |
| College or Associate's Degree | $55,688 | $28,864 |
| Bachelor's Degree | $96,705 | $69,620 |
| Graduate Degree | $73,472 | $0 |
| Total | $39,141 | $25,521 |
Family Income in Jacksboro
Family Income Brackets in Jacksboro
According to the Jacksboro family income data, there are 146 families falling into the $50,000 to $74,999 income range, which is the most common income bracket and makes up 18.2% of all families. Conversely, the $25,000 to $34,999 income bracket is the least frequent group with only 34 families (4.2%) belonging to this category.
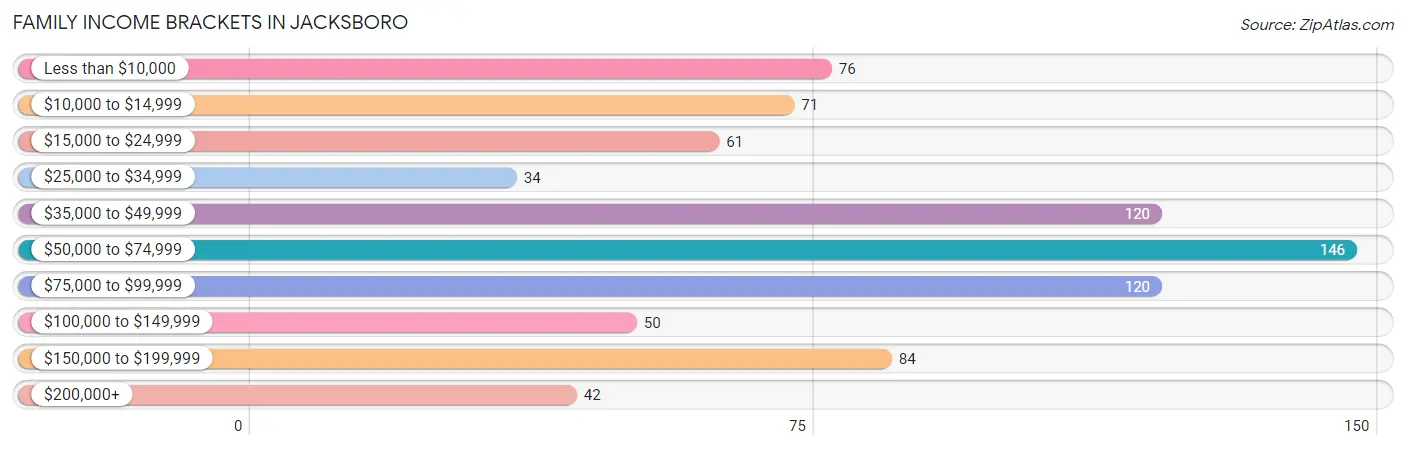
| Income Bracket | # Families | % Families |
| Less than $10,000 | 76 | 9.5% |
| $10,000 to $14,999 | 71 | 8.8% |
| $15,000 to $24,999 | 61 | 7.6% |
| $25,000 to $34,999 | 34 | 4.2% |
| $35,000 to $49,999 | 120 | 14.9% |
| $50,000 to $74,999 | 146 | 18.2% |
| $75,000 to $99,999 | 120 | 14.9% |
| $100,000 to $149,999 | 50 | 6.2% |
| $150,000 to $199,999 | 84 | 10.4% |
| $200,000+ | 42 | 5.2% |
Family Income by Famaliy Size in Jacksboro
3-person families (190 | 23.6%) account for the highest median family income in Jacksboro with $62,661 per family, while 2-person families (344 | 42.8%) have the highest median income of $28,194 per family member.
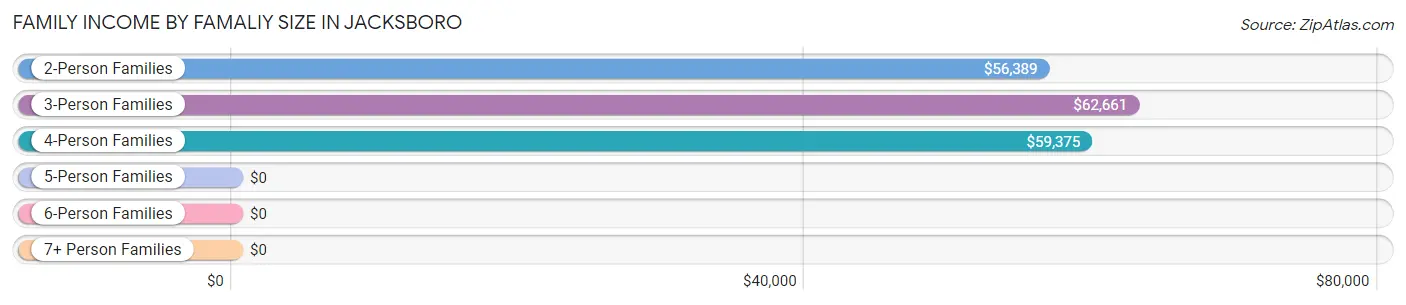
| Income Bracket | # Families | Median Income |
| 2-Person Families | 344 (42.8%) | $56,389 |
| 3-Person Families | 190 (23.6%) | $62,661 |
| 4-Person Families | 137 (17.0%) | $59,375 |
| 5-Person Families | 89 (11.1%) | $0 |
| 6-Person Families | 31 (3.9%) | $0 |
| 7+ Person Families | 13 (1.6%) | $0 |
| Total | 804 (100.0%) | $60,781 |
Family Income by Number of Earners in Jacksboro
The median family income in Jacksboro is $60,781, with families comprising 2 earners (285) having the highest median family income of $88,438, while families with no earners (176) have the lowest median family income of $18,958, accounting for 35.4% and 21.9% of families, respectively.
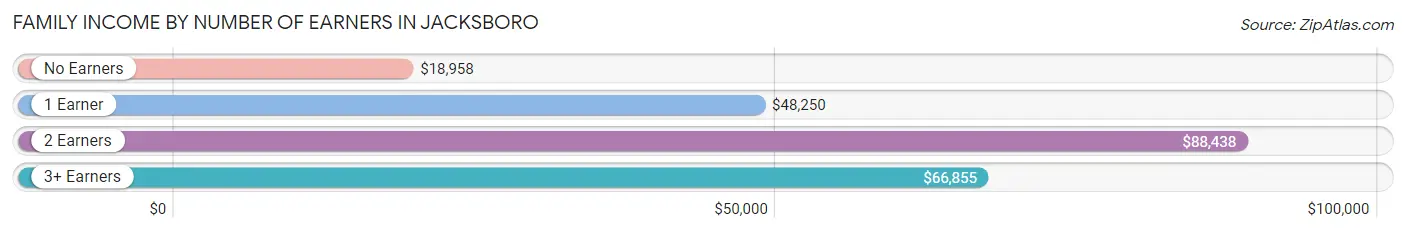
| Number of Earners | # Families | Median Income |
| No Earners | 176 (21.9%) | $18,958 |
| 1 Earner | 297 (36.9%) | $48,250 |
| 2 Earners | 285 (35.4%) | $88,438 |
| 3+ Earners | 46 (5.7%) | $66,855 |
| Total | 804 (100.0%) | $60,781 |
Household Income in Jacksboro
Household Income Brackets in Jacksboro
With 207 households falling in the category, the $50,000 to $74,999 income range is the most frequent in Jacksboro, accounting for 15.3% of all households. In contrast, only 42 households (3.1%) fall into the $200,000+ income bracket, making it the least populous group.
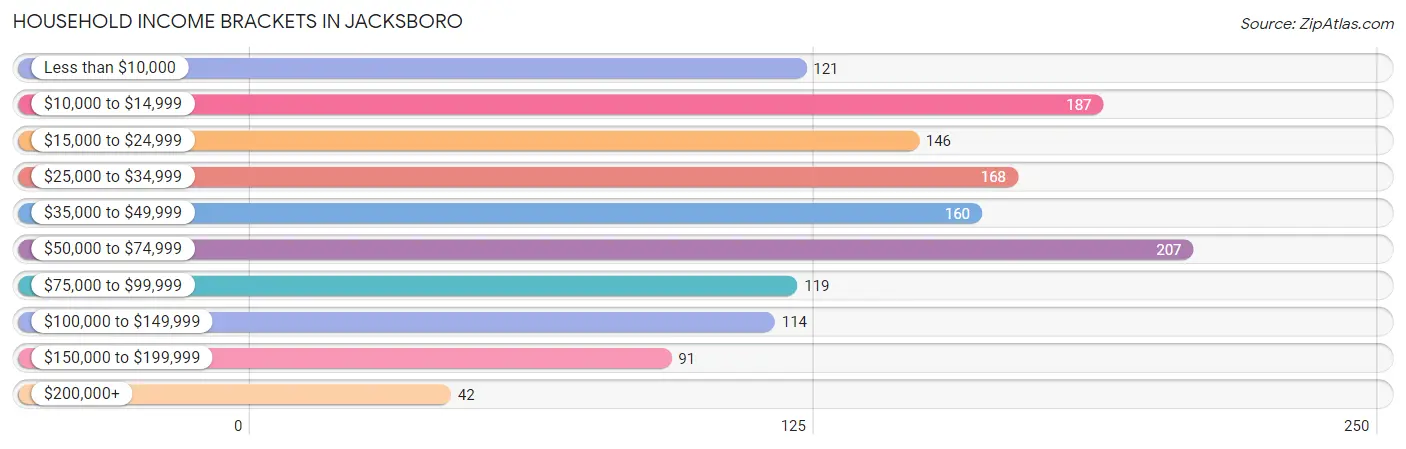
| Income Bracket | # Households | % Households |
| Less than $10,000 | 121 | 8.9% |
| $10,000 to $14,999 | 187 | 13.8% |
| $15,000 to $24,999 | 146 | 10.8% |
| $25,000 to $34,999 | 168 | 12.4% |
| $35,000 to $49,999 | 160 | 11.8% |
| $50,000 to $74,999 | 207 | 15.3% |
| $75,000 to $99,999 | 119 | 8.8% |
| $100,000 to $149,999 | 114 | 8.4% |
| $150,000 to $199,999 | 91 | 6.7% |
| $200,000+ | 42 | 3.1% |
Household Income by Householder Age in Jacksboro
The median household income in Jacksboro is $38,774, with the highest median household income of $57,596 found in the 25 to 44 years age bracket for the primary householder. A total of 488 households (36.0%) fall into this category. Meanwhile, the 15 to 24 years age bracket for the primary householder has the lowest median household income of $0, with 15 households (1.1%) in this group.
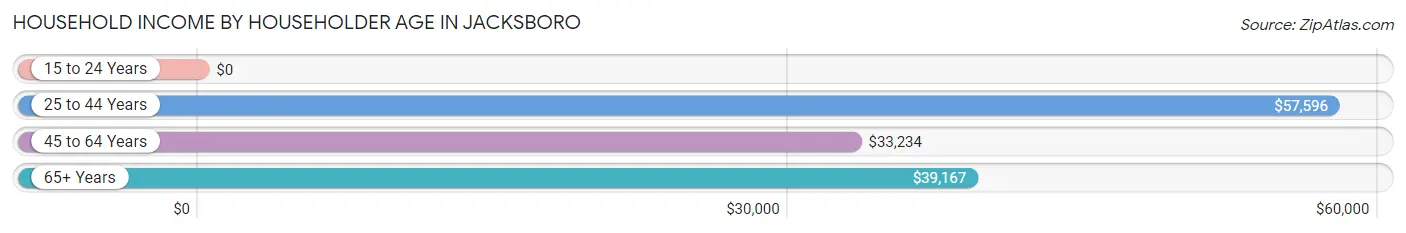
| Income Bracket | # Households | Median Income |
| 15 to 24 Years | 15 (1.1%) | $0 |
| 25 to 44 Years | 488 (36.0%) | $57,596 |
| 45 to 64 Years | 565 (41.7%) | $33,234 |
| 65+ Years | 288 (21.2%) | $39,167 |
| Total | 1,356 (100.0%) | $38,774 |
Poverty in Jacksboro
Income Below Poverty by Sex and Age in Jacksboro
With 25.8% poverty level for males and 26.7% for females among the residents of Jacksboro, under 5 year old males and 6 to 11 year old females are the most vulnerable to poverty, with 87 males (57.6%) and 74 females (67.3%) in their respective age groups living below the poverty level.
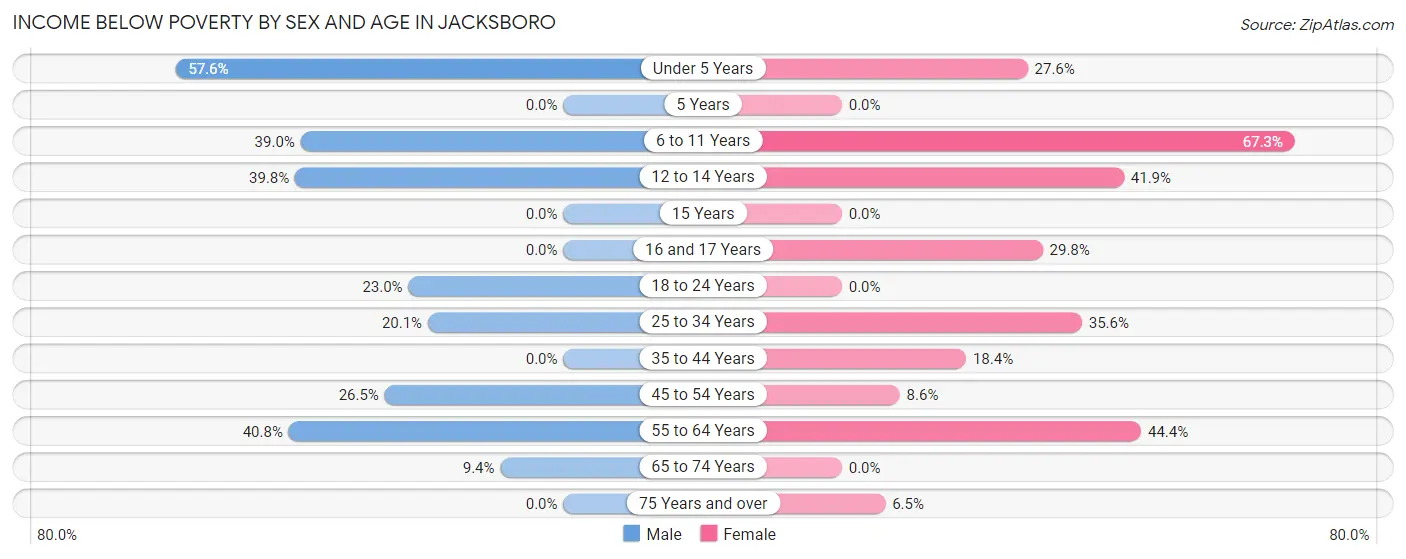
| Age Bracket | Male | Female |
| Under 5 Years | 87 (57.6%) | 24 (27.6%) |
| 5 Years | 0 (0.0%) | 0 (0.0%) |
| 6 to 11 Years | 55 (39.0%) | 74 (67.3%) |
| 12 to 14 Years | 47 (39.8%) | 80 (41.9%) |
| 15 Years | 0 (0.0%) | 0 (0.0%) |
| 16 and 17 Years | 0 (0.0%) | 17 (29.8%) |
| 18 to 24 Years | 23 (23.0%) | 0 (0.0%) |
| 25 to 34 Years | 37 (20.1%) | 103 (35.6%) |
| 35 to 44 Years | 0 (0.0%) | 33 (18.4%) |
| 45 to 54 Years | 26 (26.5%) | 14 (8.6%) |
| 55 to 64 Years | 104 (40.8%) | 96 (44.4%) |
| 65 to 74 Years | 10 (9.3%) | 0 (0.0%) |
| 75 Years and over | 0 (0.0%) | 6 (6.5%) |
| Total | 389 (25.8%) | 447 (26.7%) |
Income Above Poverty by Sex and Age in Jacksboro
According to the poverty statistics in Jacksboro, males aged 15 years and females aged 18 to 24 years are the age groups that are most secure financially, with 100.0% of males and 100.0% of females in these age groups living above the poverty line.
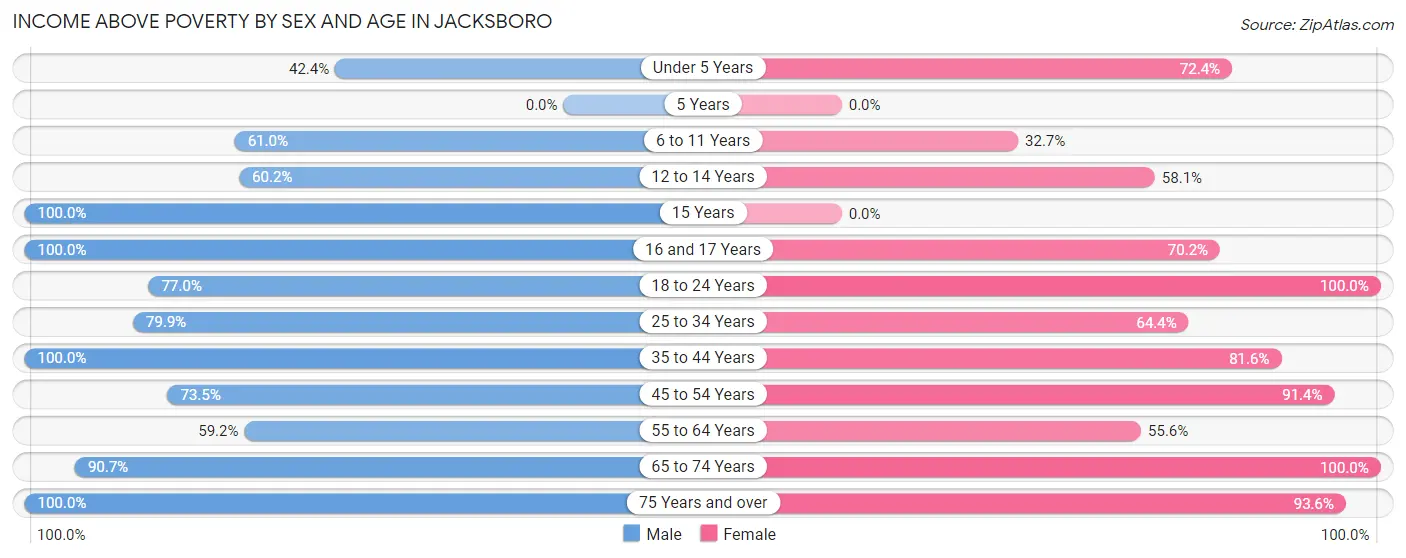
| Age Bracket | Male | Female |
| Under 5 Years | 64 (42.4%) | 63 (72.4%) |
| 5 Years | 0 (0.0%) | 0 (0.0%) |
| 6 to 11 Years | 86 (61.0%) | 36 (32.7%) |
| 12 to 14 Years | 71 (60.2%) | 111 (58.1%) |
| 15 Years | 61 (100.0%) | 0 (0.0%) |
| 16 and 17 Years | 22 (100.0%) | 40 (70.2%) |
| 18 to 24 Years | 77 (77.0%) | 72 (100.0%) |
| 25 to 34 Years | 147 (79.9%) | 186 (64.4%) |
| 35 to 44 Years | 206 (100.0%) | 146 (81.6%) |
| 45 to 54 Years | 72 (73.5%) | 149 (91.4%) |
| 55 to 64 Years | 151 (59.2%) | 120 (55.6%) |
| 65 to 74 Years | 97 (90.6%) | 218 (100.0%) |
| 75 Years and over | 66 (100.0%) | 87 (93.5%) |
| Total | 1,120 (74.2%) | 1,228 (73.3%) |
Income Below Poverty Among Married-Couple Families in Jacksboro
The poverty statistics for married-couple families in Jacksboro show that 5.0% or 27 of the total 546 families live below the poverty line. Families with 3 or 4 children have the highest poverty rate of 15.8%, comprising of 3 families. On the other hand, families with 5 or more children have the lowest poverty rate of 0.0%, which includes 0 families.
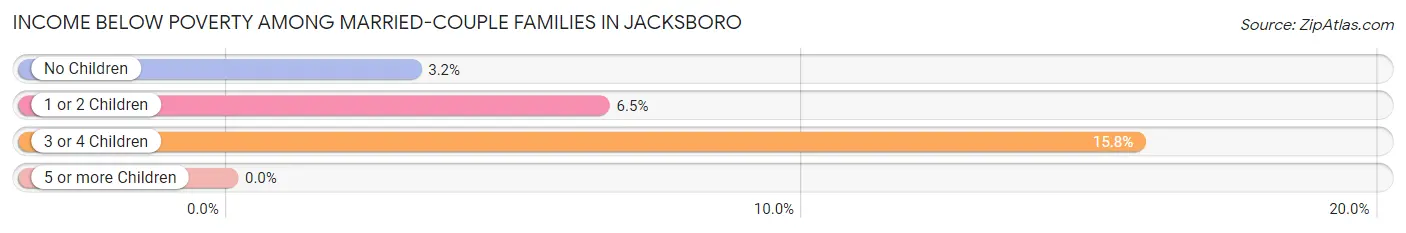
| Children | Above Poverty | Below Poverty |
| No Children | 273 (96.8%) | 9 (3.2%) |
| 1 or 2 Children | 217 (93.5%) | 15 (6.5%) |
| 3 or 4 Children | 16 (84.2%) | 3 (15.8%) |
| 5 or more Children | 13 (100.0%) | 0 (0.0%) |
| Total | 519 (95.1%) | 27 (5.0%) |
Income Below Poverty Among Single-Parent Households in Jacksboro
According to the poverty data in Jacksboro, 61.1% or 22 single-father households and 55.4% or 123 single-mother households are living below the poverty line. Among single-father households, those with 1 or 2 children have the highest poverty rate, with 22 households (71.0%) experiencing poverty. Likewise, among single-mother households, those with 1 or 2 children have the highest poverty rate, with 93 households (83.0%) falling below the poverty line.
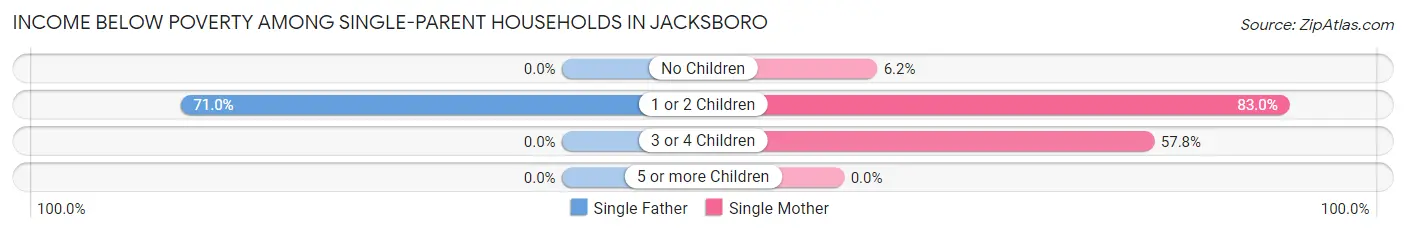
| Children | Single Father | Single Mother |
| No Children | 0 (0.0%) | 4 (6.1%) |
| 1 or 2 Children | 22 (71.0%) | 93 (83.0%) |
| 3 or 4 Children | 0 (0.0%) | 26 (57.8%) |
| 5 or more Children | 0 (0.0%) | 0 (0.0%) |
| Total | 22 (61.1%) | 123 (55.4%) |
Income Below Poverty Among Married-Couple vs Single-Parent Households in Jacksboro
The poverty data for Jacksboro shows that 27 of the married-couple family households (5.0%) and 145 of the single-parent households (56.2%) are living below the poverty level. Within the married-couple family households, those with 3 or 4 children have the highest poverty rate, with 3 households (15.8%) falling below the poverty line. Among the single-parent households, those with 1 or 2 children have the highest poverty rate, with 115 household (80.4%) living below poverty.
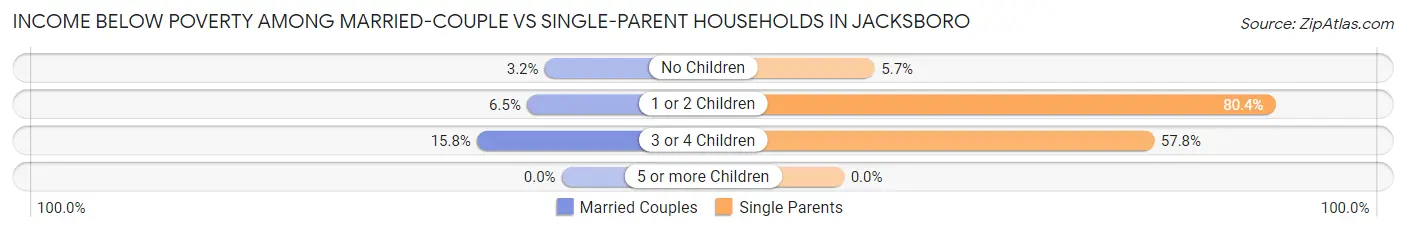
| Children | Married-Couple Families | Single-Parent Households |
| No Children | 9 (3.2%) | 4 (5.7%) |
| 1 or 2 Children | 15 (6.5%) | 115 (80.4%) |
| 3 or 4 Children | 3 (15.8%) | 26 (57.8%) |
| 5 or more Children | 0 (0.0%) | 0 (0.0%) |
| Total | 27 (5.0%) | 145 (56.2%) |
Race in Jacksboro
The most populous races in Jacksboro are White / Caucasian (3,656 | 86.8%), Hispanic or Latino (1,173 | 27.8%), and Black / African American (339 | 8.1%).
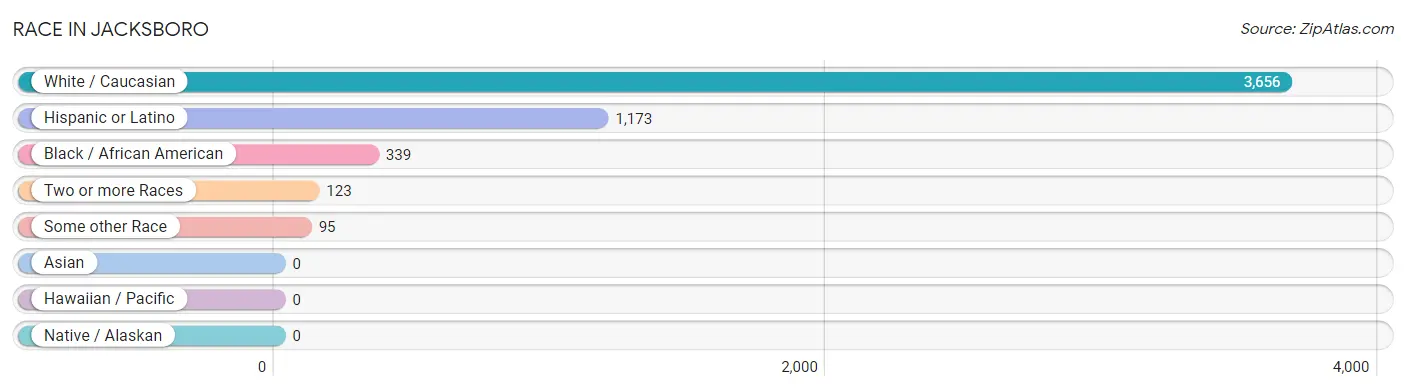
| Race | # Population | % Population |
| Asian | 0 | 0.0% |
| Black / African American | 339 | 8.1% |
| Hawaiian / Pacific | 0 | 0.0% |
| Hispanic or Latino | 1,173 | 27.8% |
| Native / Alaskan | 0 | 0.0% |
| White / Caucasian | 3,656 | 86.8% |
| Two or more Races | 123 | 2.9% |
| Some other Race | 95 | 2.2% |
| Total | 4,213 | 100.0% |
Ancestry in Jacksboro
The most populous ancestries reported in Jacksboro are Mexican (1,079 | 25.6%), English (316 | 7.5%), Irish (222 | 5.3%), German (112 | 2.7%), and American (91 | 2.2%), together accounting for 43.2% of all Jacksboro residents.
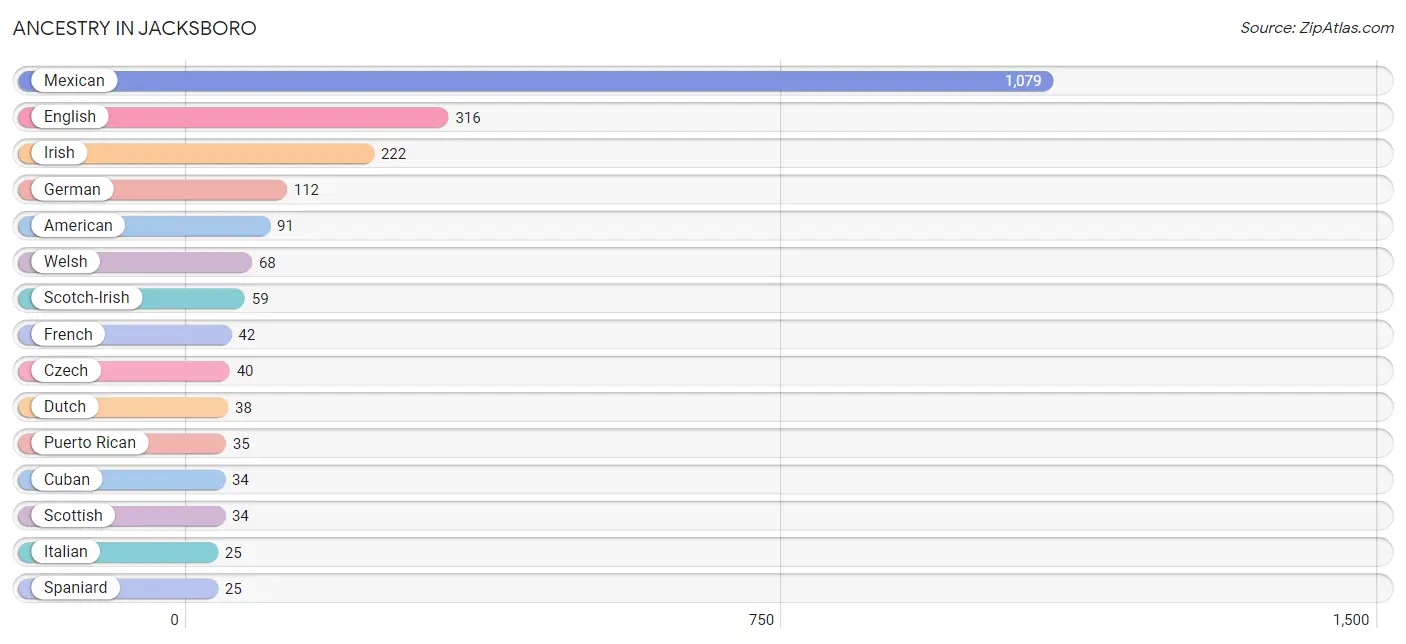
| Ancestry | # Population | % Population |
| American | 91 | 2.2% |
| Cherokee | 1 | 0.0% |
| Cuban | 34 | 0.8% |
| Czech | 40 | 0.9% |
| Dutch | 38 | 0.9% |
| English | 316 | 7.5% |
| French | 42 | 1.0% |
| German | 112 | 2.7% |
| Irish | 222 | 5.3% |
| Israeli | 5 | 0.1% |
| Italian | 25 | 0.6% |
| Mexican | 1,079 | 25.6% |
| Polish | 6 | 0.1% |
| Puerto Rican | 35 | 0.8% |
| Scandinavian | 6 | 0.1% |
| Scotch-Irish | 59 | 1.4% |
| Scottish | 34 | 0.8% |
| Spaniard | 25 | 0.6% |
| Welsh | 68 | 1.6% | View All 19 Rows |
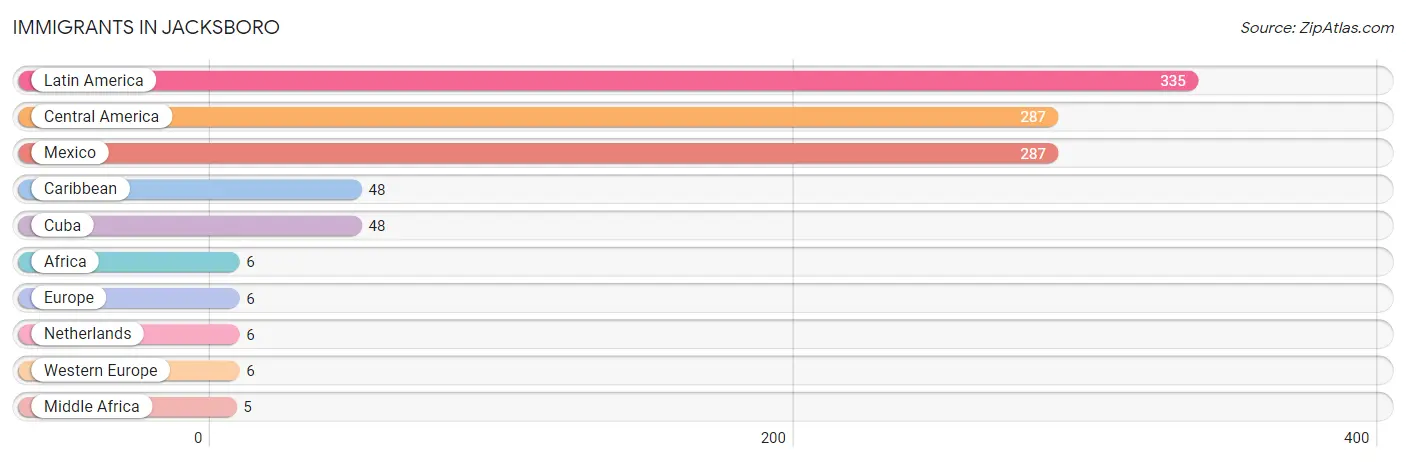
Immigrants in Jacksboro
The most numerous immigrant groups reported in Jacksboro came from Latin America (335 | 8.0%), Central America (287 | 6.8%), Mexico (287 | 6.8%), Caribbean (48 | 1.1%), and Cuba (48 | 1.1%), together accounting for 23.8% of all Jacksboro residents.
| Immigration Origin | # Population | % Population |
| Africa | 6 | 0.1% |
| Caribbean | 48 | 1.1% |
| Central America | 287 | 6.8% |
| Cuba | 48 | 1.1% |
| Europe | 6 | 0.1% |
| Latin America | 335 | 8.0% |
| Mexico | 287 | 6.8% |
| Middle Africa | 5 | 0.1% |
| Netherlands | 6 | 0.1% |
| Western Europe | 6 | 0.1% | View All 10 Rows |
Sex and Age in Jacksboro
Sex and Age in Jacksboro
The most populous age groups in Jacksboro are 30 to 34 Years (275 | 11.1%) for men and 10 to 14 Years (262 | 15.2%) for women.
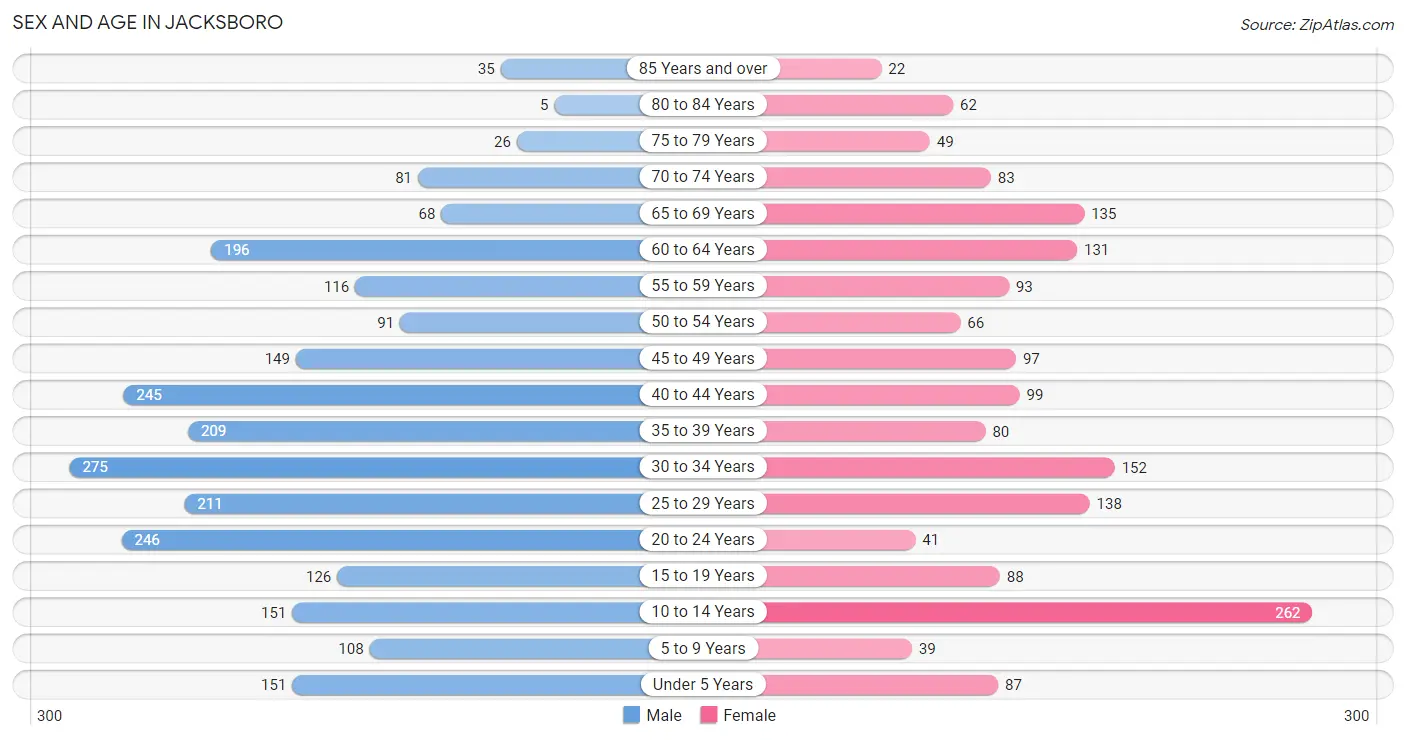
| Age Bracket | Male | Female |
| Under 5 Years | 151 (6.1%) | 87 (5.1%) |
| 5 to 9 Years | 108 (4.3%) | 39 (2.3%) |
| 10 to 14 Years | 151 (6.1%) | 262 (15.2%) |
| 15 to 19 Years | 126 (5.1%) | 88 (5.1%) |
| 20 to 24 Years | 246 (9.9%) | 41 (2.4%) |
| 25 to 29 Years | 211 (8.5%) | 138 (8.0%) |
| 30 to 34 Years | 275 (11.1%) | 152 (8.8%) |
| 35 to 39 Years | 209 (8.4%) | 80 (4.6%) |
| 40 to 44 Years | 245 (9.8%) | 99 (5.7%) |
| 45 to 49 Years | 149 (6.0%) | 97 (5.6%) |
| 50 to 54 Years | 91 (3.7%) | 66 (3.8%) |
| 55 to 59 Years | 116 (4.7%) | 93 (5.4%) |
| 60 to 64 Years | 196 (7.9%) | 131 (7.6%) |
| 65 to 69 Years | 68 (2.7%) | 135 (7.8%) |
| 70 to 74 Years | 81 (3.3%) | 83 (4.8%) |
| 75 to 79 Years | 26 (1.0%) | 49 (2.8%) |
| 80 to 84 Years | 5 (0.2%) | 62 (3.6%) |
| 85 Years and over | 35 (1.4%) | 22 (1.3%) |
| Total | 2,489 (100.0%) | 1,724 (100.0%) |
Families and Households in Jacksboro
Median Family Size in Jacksboro
The median family size in Jacksboro is 3.17 persons per family, with single male/father families (36 | 4.5%) accounting for the largest median family size of 3.28 persons per family. On the other hand, single female/mother families (222 | 27.6%) represent the smallest median family size with 3.02 persons per family.
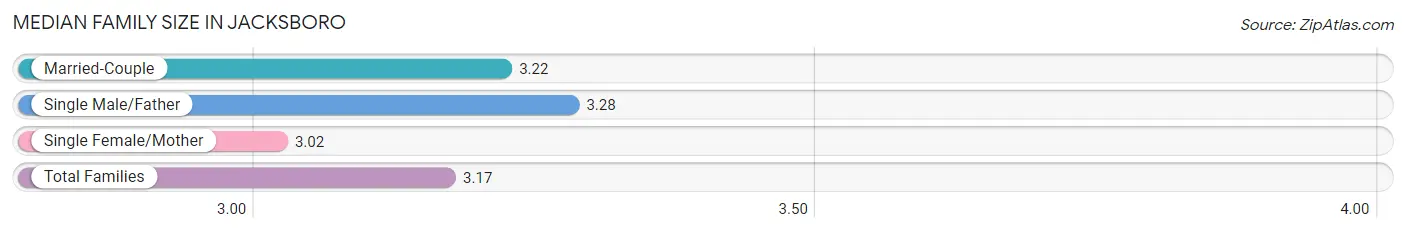
| Family Type | # Families | Family Size |
| Married-Couple | 546 (67.9%) | 3.22 |
| Single Male/Father | 36 (4.5%) | 3.28 |
| Single Female/Mother | 222 (27.6%) | 3.02 |
| Total Families | 804 (100.0%) | 3.17 |
Median Household Size in Jacksboro
The median household size in Jacksboro is 2.35 persons per household, with single male/father households (36 | 2.6%) accounting for the largest median household size of 4.14 persons per household. non-family households (552 | 40.7%) represent the smallest median household size with 1.08 persons per household.
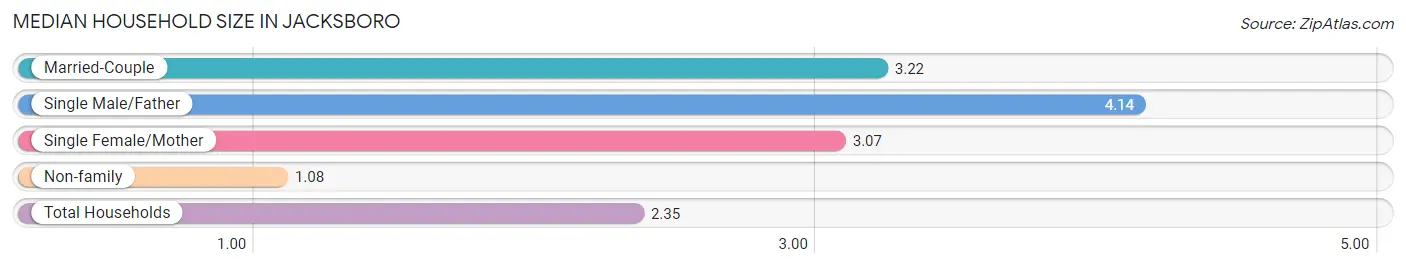
| Household Type | # Households | Household Size |
| Married-Couple | 546 (40.3%) | 3.22 |
| Single Male/Father | 36 (2.6%) | 4.14 |
| Single Female/Mother | 222 (16.4%) | 3.07 |
| Non-family | 552 (40.7%) | 1.08 |
| Total Households | 1,356 (100.0%) | 2.35 |
Household Size by Marriage Status in Jacksboro
Out of a total of 1,356 households in Jacksboro, 804 (59.3%) are family households, while 552 (40.7%) are nonfamily households. The most numerous type of family households are 2-person households, comprising 332, and the most common type of nonfamily households are 1-person households, comprising 518.
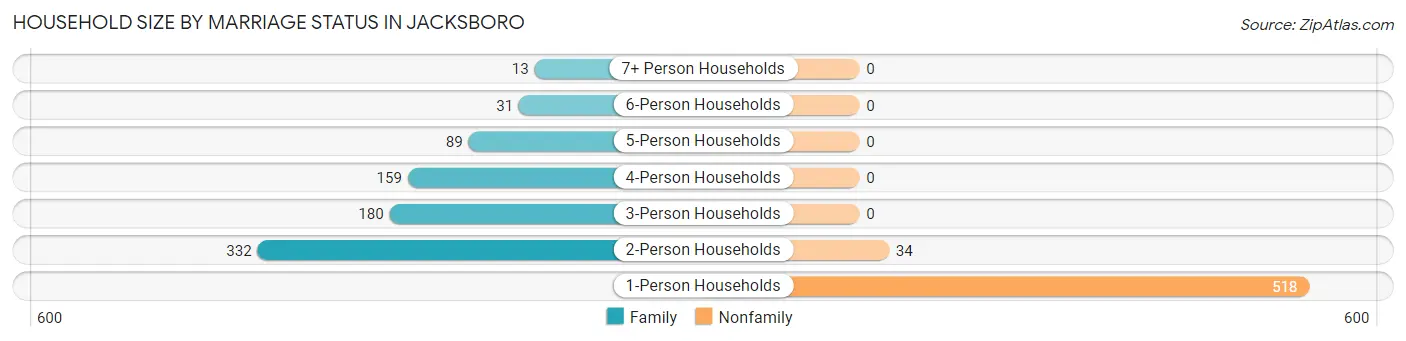
| Household Size | Family Households | Nonfamily Households |
| 1-Person Households | - | 518 (38.2%) |
| 2-Person Households | 332 (24.5%) | 34 (2.5%) |
| 3-Person Households | 180 (13.3%) | 0 (0.0%) |
| 4-Person Households | 159 (11.7%) | 0 (0.0%) |
| 5-Person Households | 89 (6.6%) | 0 (0.0%) |
| 6-Person Households | 31 (2.3%) | 0 (0.0%) |
| 7+ Person Households | 13 (1.0%) | 0 (0.0%) |
| Total | 804 (59.3%) | 552 (40.7%) |
Female Fertility in Jacksboro
Fertility by Age in Jacksboro
| Age Bracket | Women with Births | Births / 1,000 Women |
| 15 to 19 years | 0 (0.0%) | 0.0 |
| 20 to 34 years | 0 (0.0%) | 0.0 |
| 35 to 50 years | 0 (0.0%) | 0.0 |
| Total | 0 (0.0%) | 0.0 |
Fertility by Age by Marriage Status in Jacksboro
| Age Bracket | Married | Unmarried |
| 15 to 19 years | 0 (0.0%) | 0 (0.0%) |
| 20 to 34 years | 0 (0.0%) | 0 (0.0%) |
| 35 to 50 years | 0 (0.0%) | 0 (0.0%) |
| Total | 0 (0.0%) | 0 (0.0%) |
Fertility by Education in Jacksboro
| Educational Attainment | Women with Births | Births / 1,000 Women |
| Less than High School | 0 (0.0%) | 0.0 |
| High School Diploma | 0 (0.0%) | 0.0 |
| College or Associate's Degree | 0 (0.0%) | 0.0 |
| Bachelor's Degree | 0 (0.0%) | 0.0 |
| Graduate Degree | 0 (0.0%) | 0.0 |
| Total | 0 (0.0%) | 0.0 |
Fertility by Education by Marriage Status in Jacksboro
| Educational Attainment | Married | Unmarried |
| Less than High School | 0 (0.0%) | 0 (0.0%) |
| High School Diploma | 0 (0.0%) | 0 (0.0%) |
| College or Associate's Degree | 0 (0.0%) | 0 (0.0%) |
| Bachelor's Degree | 0 (0.0%) | 0 (0.0%) |
| Graduate Degree | 0 (0.0%) | 0 (0.0%) |
| Total | 0 (0.0%) | 0 (0.0%) |
Employment Characteristics in Jacksboro
Employment by Class of Employer in Jacksboro
Among the 1,225 employed individuals in Jacksboro, private company employees (832 | 67.9%), self-employed (not incorporated) (132 | 10.8%), and local government employees (73 | 6.0%) make up the most common classes of employment.
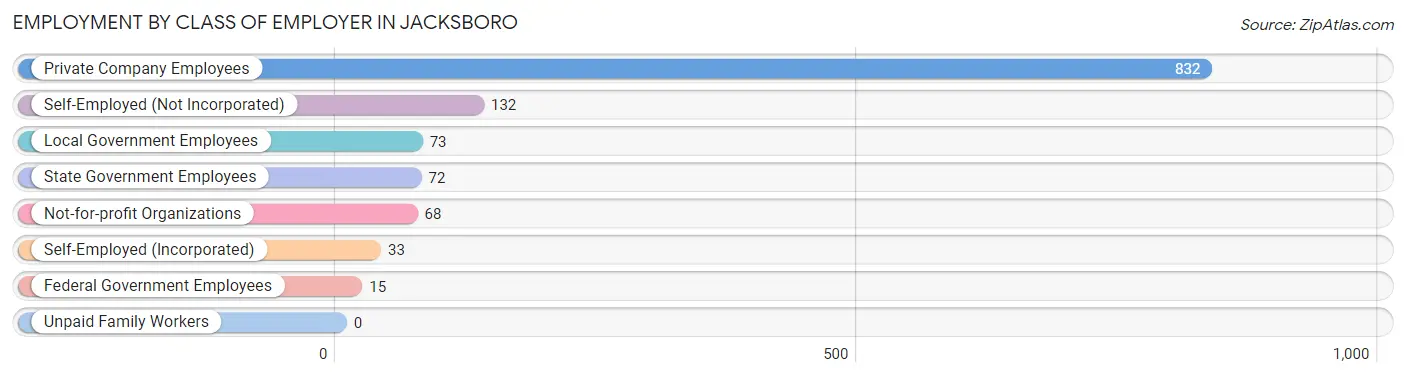
| Employer Class | # Employees | % Employees |
| Private Company Employees | 832 | 67.9% |
| Self-Employed (Incorporated) | 33 | 2.7% |
| Self-Employed (Not Incorporated) | 132 | 10.8% |
| Not-for-profit Organizations | 68 | 5.6% |
| Local Government Employees | 73 | 6.0% |
| State Government Employees | 72 | 5.9% |
| Federal Government Employees | 15 | 1.2% |
| Unpaid Family Workers | 0 | 0.0% |
| Total | 1,225 | 100.0% |
Employment Status by Age in Jacksboro
According to the labor force statistics for Jacksboro, out of the total population over 16 years of age (3,354), 40.7% or 1,365 individuals are in the labor force, with 10.2% or 139 of them unemployed. The age group with the highest labor force participation rate is 60 to 64 years, with 52.3% or 171 individuals in the labor force. Within the labor force, the 30 to 34 years age range has the highest percentage of unemployed individuals, with 27.7% or 56 of them being unemployed.
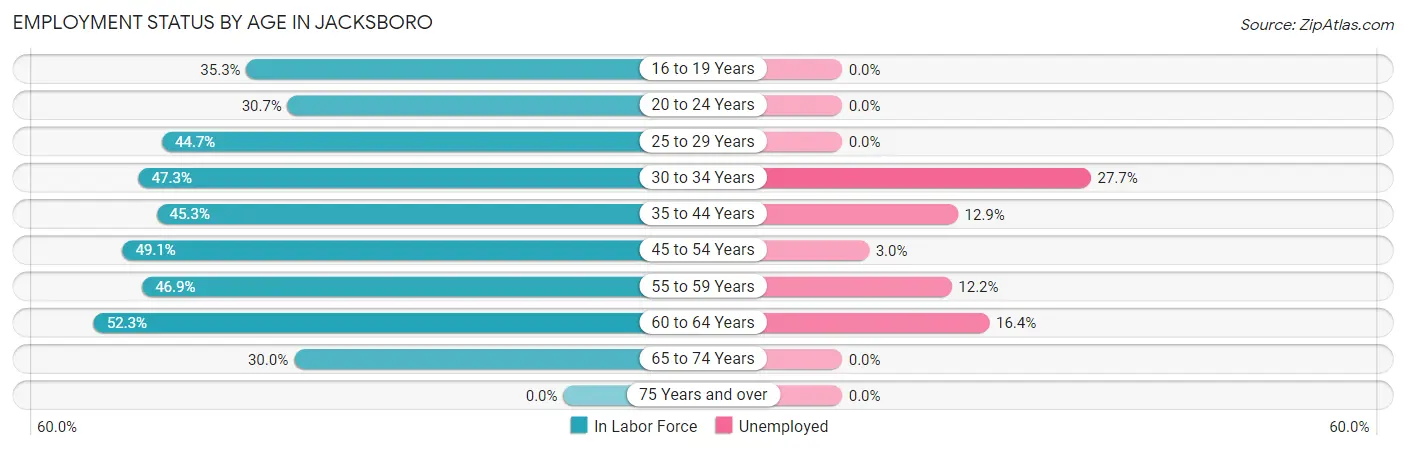
| Age Bracket | In Labor Force | Unemployed |
| 16 to 19 Years | 54 (35.3%) | 0 (0.0%) |
| 20 to 24 Years | 88 (30.7%) | 0 (0.0%) |
| 25 to 29 Years | 156 (44.7%) | 0 (0.0%) |
| 30 to 34 Years | 202 (47.3%) | 56 (27.7%) |
| 35 to 44 Years | 287 (45.3%) | 37 (12.9%) |
| 45 to 54 Years | 198 (49.1%) | 6 (3.0%) |
| 55 to 59 Years | 98 (46.9%) | 12 (12.2%) |
| 60 to 64 Years | 171 (52.3%) | 28 (16.4%) |
| 65 to 74 Years | 110 (30.0%) | 0 (0.0%) |
| 75 Years and over | 0 (0.0%) | 0 (0.0%) |
| Total | 1,365 (40.7%) | 139 (10.2%) |
Employment Status by Educational Attainment in Jacksboro
According to labor force statistics for Jacksboro, 47.4% of individuals (1,113) out of the total population between 25 and 64 years of age (2,348) are in the labor force, with 12.5% or 139 of them being unemployed. The group with the highest labor force participation rate are those with the educational attainment of bachelor's degree or higher, with 87.7% or 264 individuals in the labor force. Within the labor force, individuals with less than high school education have the highest percentage of unemployment, with 45.2% or 103 of them being unemployed.
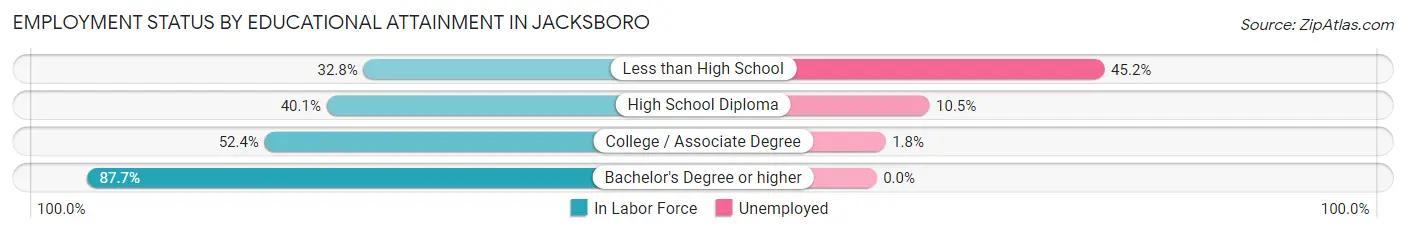
| Educational Attainment | In Labor Force | Unemployed |
| Less than High School | 228 (32.8%) | 314 (45.2%) |
| High School Diploma | 287 (40.1%) | 75 (10.5%) |
| College / Associate Degree | 333 (52.4%) | 11 (1.8%) |
| Bachelor's Degree or higher | 264 (87.7%) | 0 (0.0%) |
| Total | 1,113 (47.4%) | 294 (12.5%) |
Employment Occupations by Sex in Jacksboro
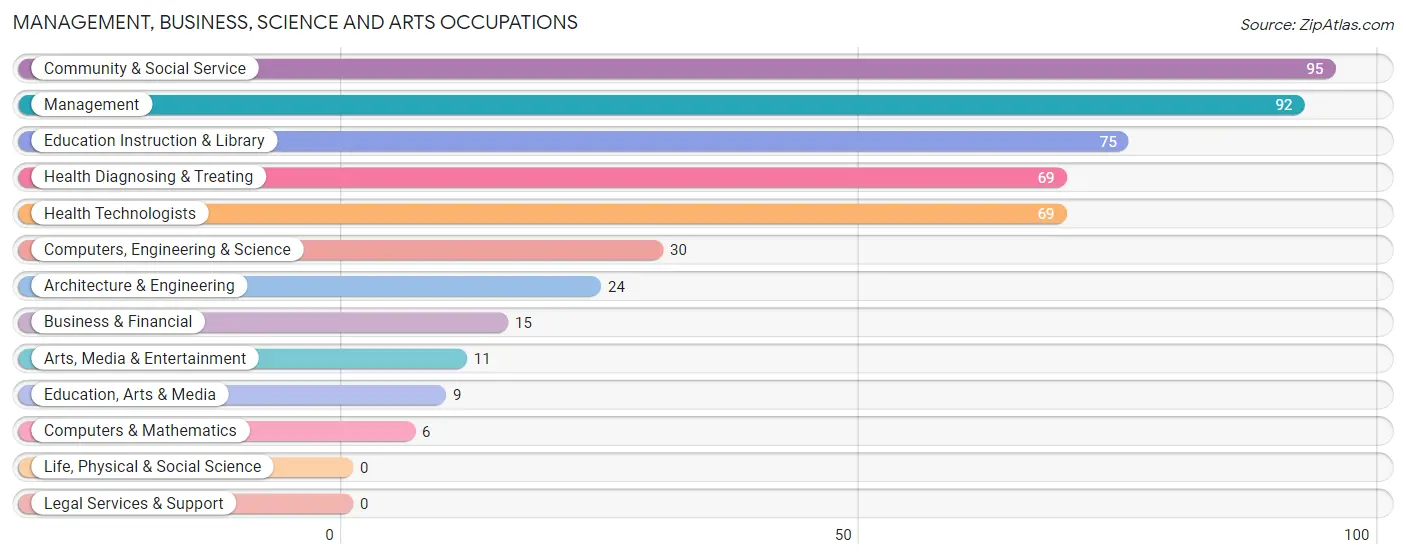
Management, Business, Science and Arts Occupations
The most common Management, Business, Science and Arts occupations in Jacksboro are Community & Social Service (95 | 7.8%), Management (92 | 7.5%), Education Instruction & Library (75 | 6.1%), Health Diagnosing & Treating (69 | 5.6%), and Health Technologists (69 | 5.6%).
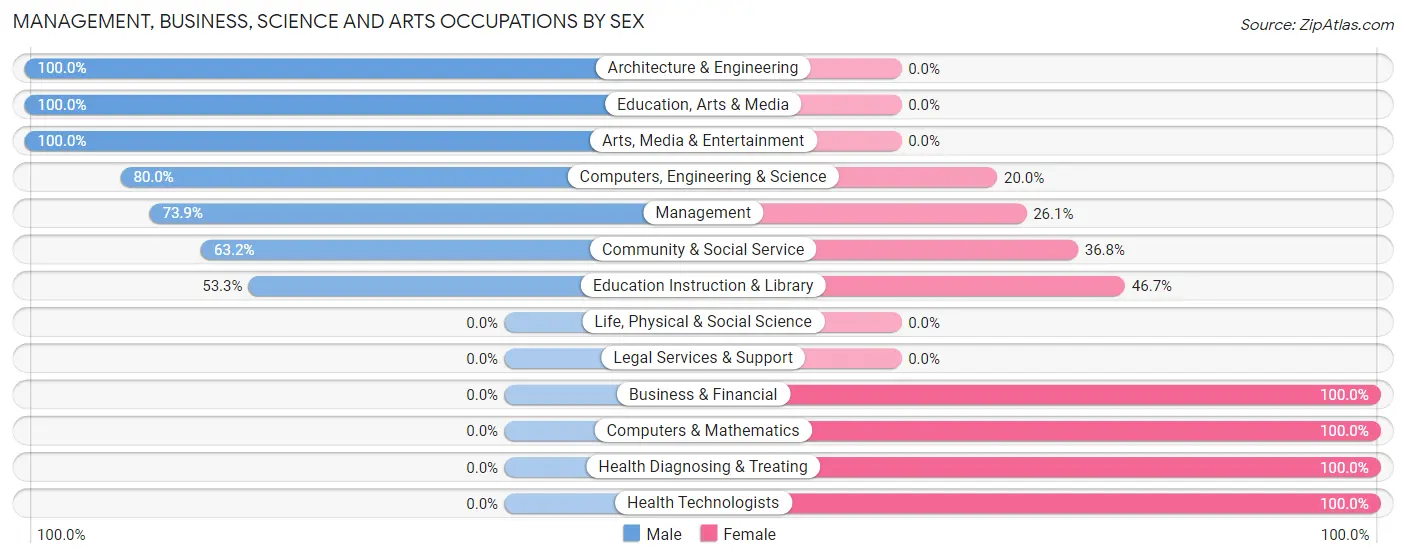
Management, Business, Science and Arts Occupations by Sex
Within the Management, Business, Science and Arts occupations in Jacksboro, the most male-oriented occupations are Architecture & Engineering (100.0%), Education, Arts & Media (100.0%), and Arts, Media & Entertainment (100.0%), while the most female-oriented occupations are Business & Financial (100.0%), Computers & Mathematics (100.0%), and Health Diagnosing & Treating (100.0%).
| Occupation | Male | Female |
| Management | 68 (73.9%) | 24 (26.1%) |
| Business & Financial | 0 (0.0%) | 15 (100.0%) |
| Computers, Engineering & Science | 24 (80.0%) | 6 (20.0%) |
| Computers & Mathematics | 0 (0.0%) | 6 (100.0%) |
| Architecture & Engineering | 24 (100.0%) | 0 (0.0%) |
| Life, Physical & Social Science | 0 (0.0%) | 0 (0.0%) |
| Community & Social Service | 60 (63.2%) | 35 (36.8%) |
| Education, Arts & Media | 9 (100.0%) | 0 (0.0%) |
| Legal Services & Support | 0 (0.0%) | 0 (0.0%) |
| Education Instruction & Library | 40 (53.3%) | 35 (46.7%) |
| Arts, Media & Entertainment | 11 (100.0%) | 0 (0.0%) |
| Health Diagnosing & Treating | 0 (0.0%) | 69 (100.0%) |
| Health Technologists | 0 (0.0%) | 69 (100.0%) |
| Total (Category) | 152 (50.5%) | 149 (49.5%) |
| Total (Overall) | 703 (57.4%) | 522 (42.6%) |
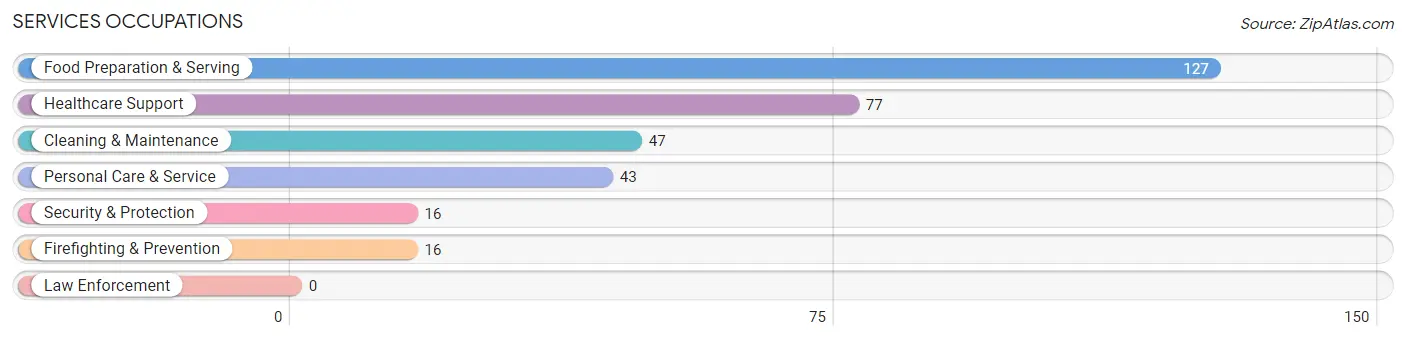
Services Occupations
The most common Services occupations in Jacksboro are Food Preparation & Serving (127 | 10.4%), Healthcare Support (77 | 6.3%), Cleaning & Maintenance (47 | 3.8%), Personal Care & Service (43 | 3.5%), and Security & Protection (16 | 1.3%).
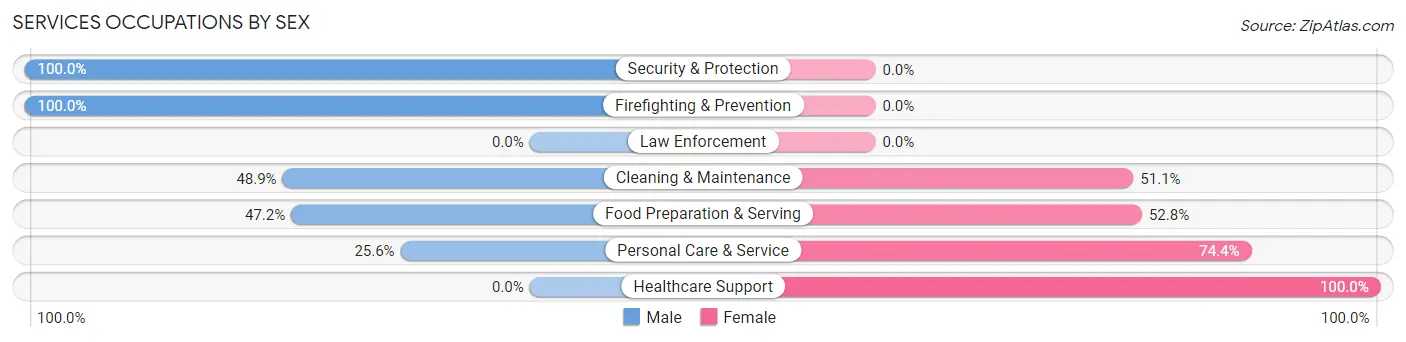
Services Occupations by Sex
Within the Services occupations in Jacksboro, the most male-oriented occupations are Security & Protection (100.0%), Firefighting & Prevention (100.0%), and Cleaning & Maintenance (48.9%), while the most female-oriented occupations are Healthcare Support (100.0%), Personal Care & Service (74.4%), and Food Preparation & Serving (52.8%).
| Occupation | Male | Female |
| Healthcare Support | 0 (0.0%) | 77 (100.0%) |
| Security & Protection | 16 (100.0%) | 0 (0.0%) |
| Firefighting & Prevention | 16 (100.0%) | 0 (0.0%) |
| Law Enforcement | 0 (0.0%) | 0 (0.0%) |
| Food Preparation & Serving | 60 (47.2%) | 67 (52.8%) |
| Cleaning & Maintenance | 23 (48.9%) | 24 (51.1%) |
| Personal Care & Service | 11 (25.6%) | 32 (74.4%) |
| Total (Category) | 110 (35.5%) | 200 (64.5%) |
| Total (Overall) | 703 (57.4%) | 522 (42.6%) |
Sales and Office Occupations
The most common Sales and Office occupations in Jacksboro are Sales & Related (143 | 11.7%), and Office & Administration (66 | 5.4%).
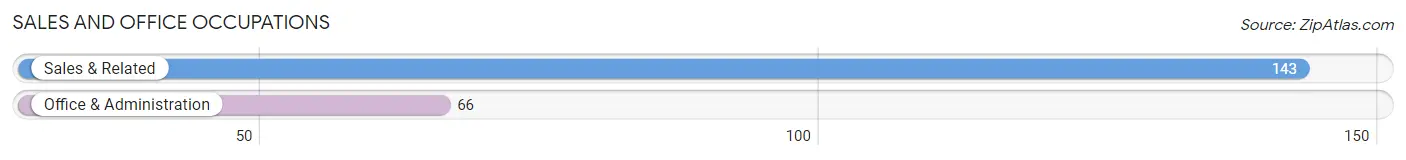
Sales and Office Occupations by Sex
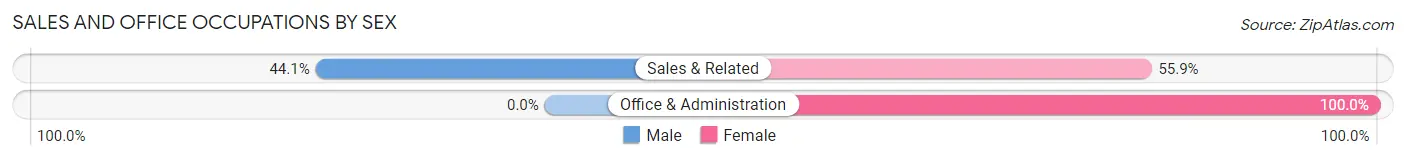
| Occupation | Male | Female |
| Sales & Related | 63 (44.1%) | 80 (55.9%) |
| Office & Administration | 0 (0.0%) | 66 (100.0%) |
| Total (Category) | 63 (30.1%) | 146 (69.9%) |
| Total (Overall) | 703 (57.4%) | 522 (42.6%) |
Natural Resources, Construction and Maintenance Occupations
The most common Natural Resources, Construction and Maintenance occupations in Jacksboro are Construction & Extraction (137 | 11.2%), Installation, Maintenance & Repair (19 | 1.5%), and Farming, Fishing & Forestry (7 | 0.6%).
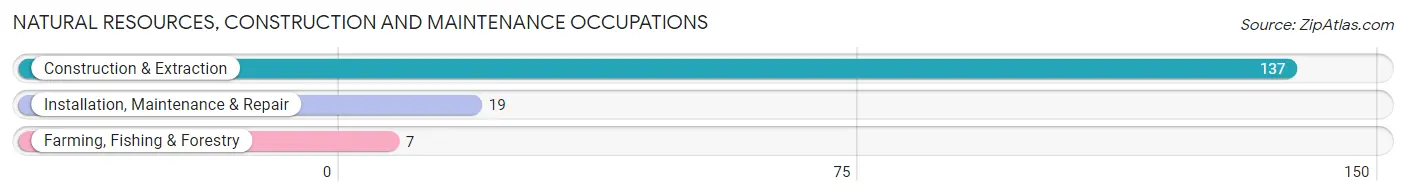
Natural Resources, Construction and Maintenance Occupations by Sex
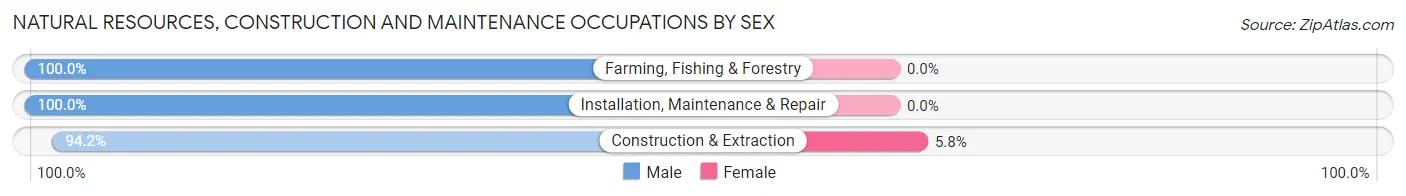
| Occupation | Male | Female |
| Farming, Fishing & Forestry | 7 (100.0%) | 0 (0.0%) |
| Construction & Extraction | 129 (94.2%) | 8 (5.8%) |
| Installation, Maintenance & Repair | 19 (100.0%) | 0 (0.0%) |
| Total (Category) | 155 (95.1%) | 8 (4.9%) |
| Total (Overall) | 703 (57.4%) | 522 (42.6%) |
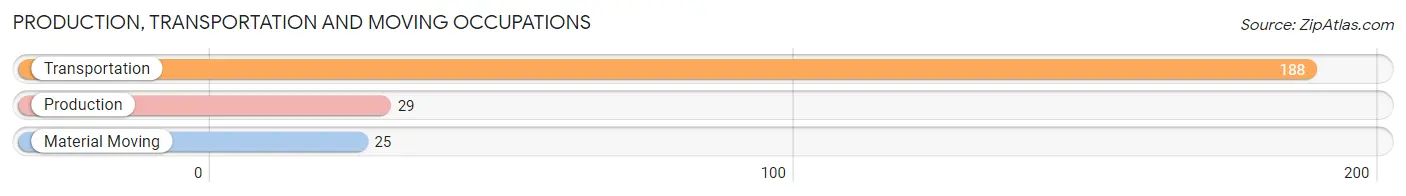
Production, Transportation and Moving Occupations
The most common Production, Transportation and Moving occupations in Jacksboro are Transportation (188 | 15.3%), Production (29 | 2.4%), and Material Moving (25 | 2.0%).
Production, Transportation and Moving Occupations by Sex
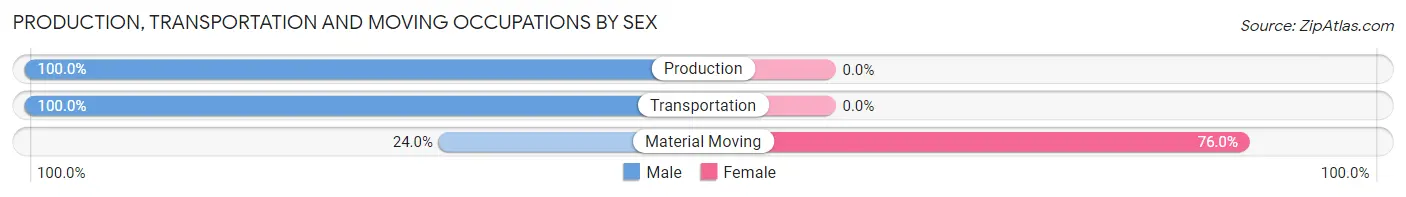
| Occupation | Male | Female |
| Production | 29 (100.0%) | 0 (0.0%) |
| Transportation | 188 (100.0%) | 0 (0.0%) |
| Material Moving | 6 (24.0%) | 19 (76.0%) |
| Total (Category) | 223 (92.1%) | 19 (7.9%) |
| Total (Overall) | 703 (57.4%) | 522 (42.6%) |
Employment Industries by Sex in Jacksboro
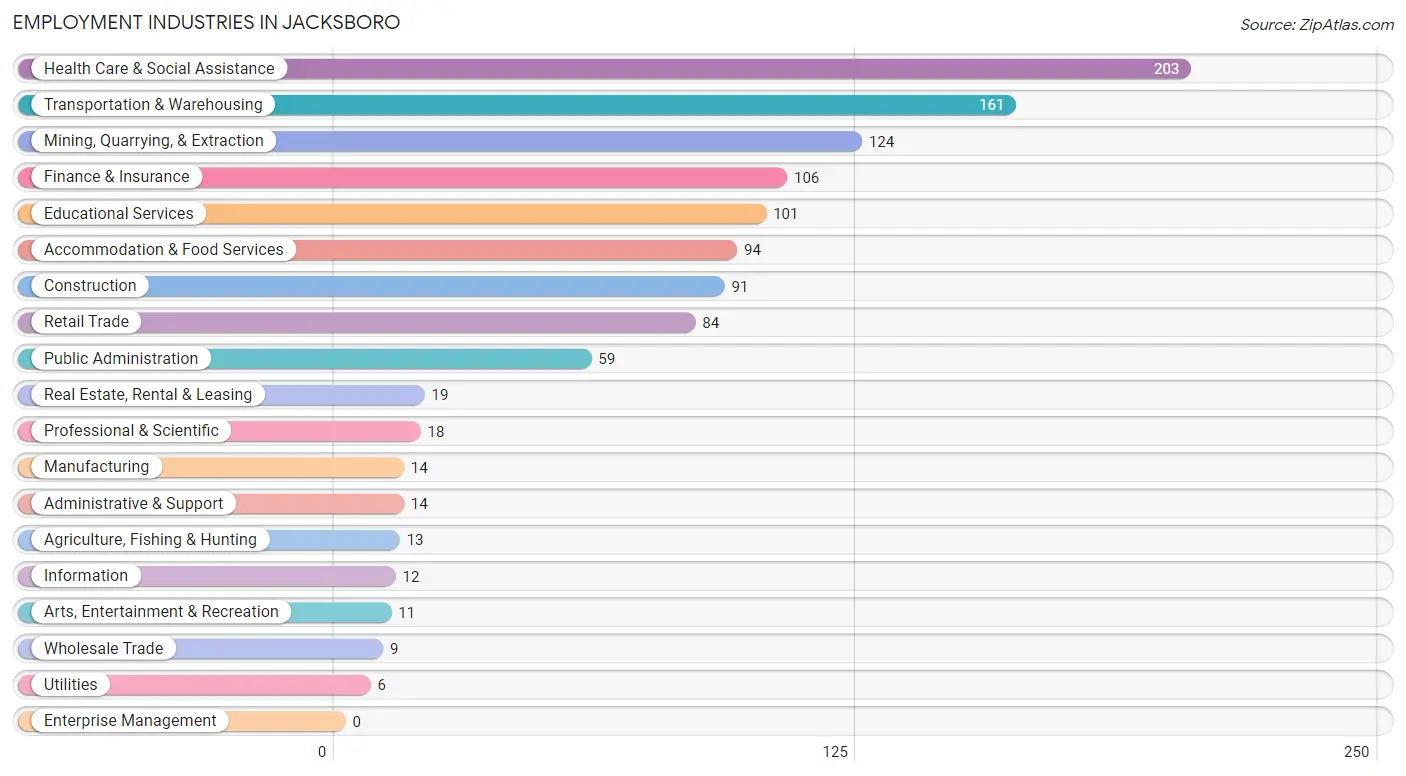
Employment Industries in Jacksboro
The major employment industries in Jacksboro include Health Care & Social Assistance (203 | 16.6%), Transportation & Warehousing (161 | 13.1%), Mining, Quarrying, & Extraction (124 | 10.1%), Finance & Insurance (106 | 8.6%), and Educational Services (101 | 8.2%).
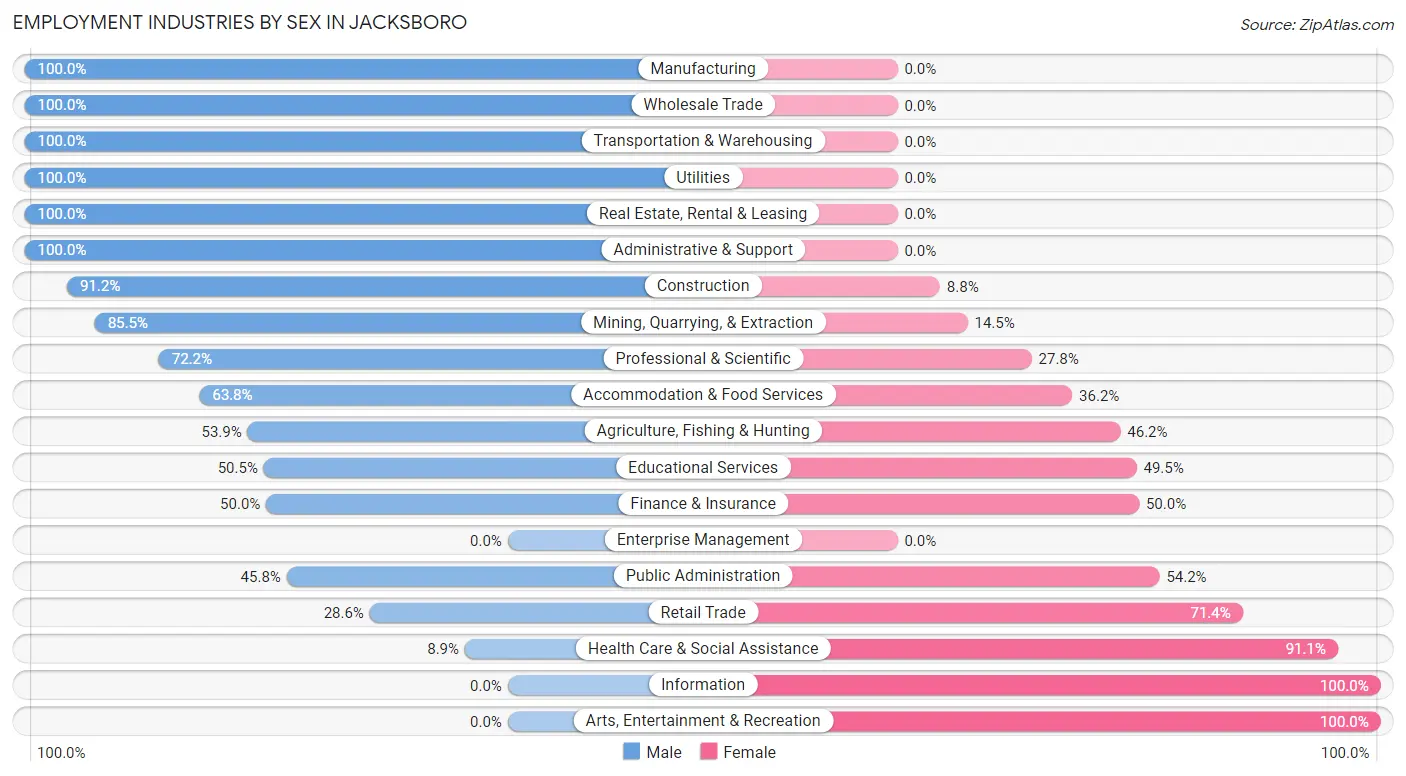
Employment Industries by Sex in Jacksboro
The Jacksboro industries that see more men than women are Manufacturing (100.0%), Wholesale Trade (100.0%), and Transportation & Warehousing (100.0%), whereas the industries that tend to have a higher number of women are Information (100.0%), Arts, Entertainment & Recreation (100.0%), and Health Care & Social Assistance (91.1%).
| Industry | Male | Female |
| Agriculture, Fishing & Hunting | 7 (53.8%) | 6 (46.2%) |
| Mining, Quarrying, & Extraction | 106 (85.5%) | 18 (14.5%) |
| Construction | 83 (91.2%) | 8 (8.8%) |
| Manufacturing | 14 (100.0%) | 0 (0.0%) |
| Wholesale Trade | 9 (100.0%) | 0 (0.0%) |
| Retail Trade | 24 (28.6%) | 60 (71.4%) |
| Transportation & Warehousing | 161 (100.0%) | 0 (0.0%) |
| Utilities | 6 (100.0%) | 0 (0.0%) |
| Information | 0 (0.0%) | 12 (100.0%) |
| Finance & Insurance | 53 (50.0%) | 53 (50.0%) |
| Real Estate, Rental & Leasing | 19 (100.0%) | 0 (0.0%) |
| Professional & Scientific | 13 (72.2%) | 5 (27.8%) |
| Enterprise Management | 0 (0.0%) | 0 (0.0%) |
| Administrative & Support | 14 (100.0%) | 0 (0.0%) |
| Educational Services | 51 (50.5%) | 50 (49.5%) |
| Health Care & Social Assistance | 18 (8.9%) | 185 (91.1%) |
| Arts, Entertainment & Recreation | 0 (0.0%) | 11 (100.0%) |
| Accommodation & Food Services | 60 (63.8%) | 34 (36.2%) |
| Public Administration | 27 (45.8%) | 32 (54.2%) |
| Total | 703 (57.4%) | 522 (42.6%) |
Education in Jacksboro
School Enrollment in Jacksboro
The most common levels of schooling among the 852 students in Jacksboro are middle school (353 | 41.4%), high school (241 | 28.3%), and elementary school (117 | 13.7%).
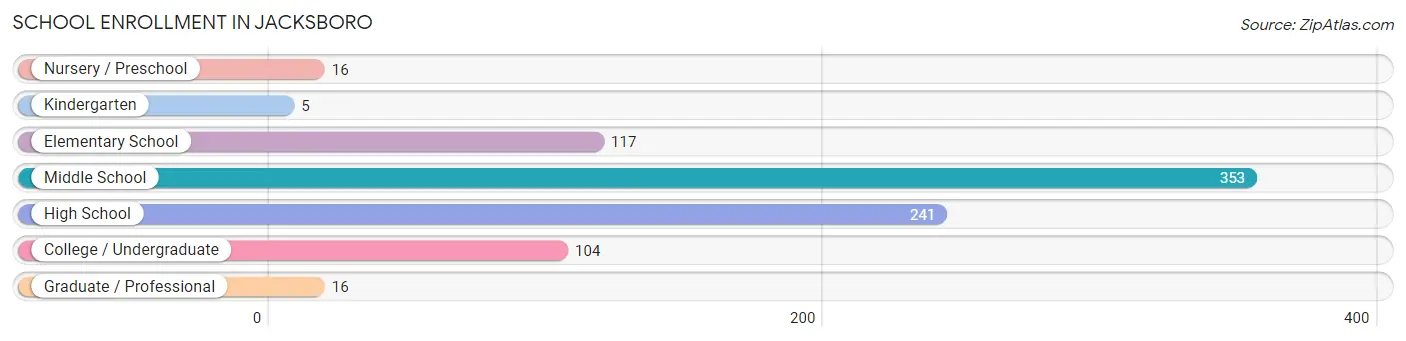
| School Level | # Students | % Students |
| Nursery / Preschool | 16 | 1.9% |
| Kindergarten | 5 | 0.6% |
| Elementary School | 117 | 13.7% |
| Middle School | 353 | 41.4% |
| High School | 241 | 28.3% |
| College / Undergraduate | 104 | 12.2% |
| Graduate / Professional | 16 | 1.9% |
| Total | 852 | 100.0% |
School Enrollment by Age by Funding Source in Jacksboro
Out of a total of 852 students who are enrolled in schools in Jacksboro, 45 (5.3%) attend a private institution, while the remaining 807 (94.7%) are enrolled in public schools. The age group of 20 to 24 year olds has the highest likelihood of being enrolled in private schools, with 16 (61.5% in the age bracket) enrolled. Conversely, the age group of 5 to 9 year old has the lowest likelihood of being enrolled in a private school, with 147 (100.0% in the age bracket) attending a public institution.
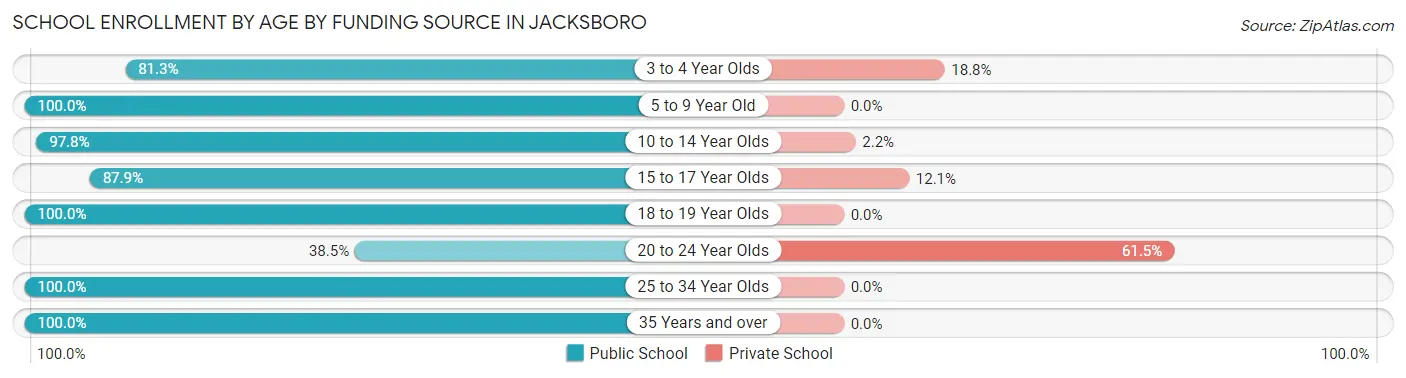
| Age Bracket | Public School | Private School |
| 3 to 4 Year Olds | 13 (81.2%) | 3 (18.8%) |
| 5 to 9 Year Old | 147 (100.0%) | 0 (0.0%) |
| 10 to 14 Year Olds | 404 (97.8%) | 9 (2.2%) |
| 15 to 17 Year Olds | 123 (87.9%) | 17 (12.1%) |
| 18 to 19 Year Olds | 23 (100.0%) | 0 (0.0%) |
| 20 to 24 Year Olds | 10 (38.5%) | 16 (61.5%) |
| 25 to 34 Year Olds | 83 (100.0%) | 0 (0.0%) |
| 35 Years and over | 4 (100.0%) | 0 (0.0%) |
| Total | 807 (94.7%) | 45 (5.3%) |
Educational Attainment by Field of Study in Jacksboro
Business (86 | 23.3%), education (81 | 22.0%), literature & languages (59 | 16.0%), science & technology (41 | 11.1%), and bio, nature & agricultural (39 | 10.6%) are the most common fields of study among 369 individuals in Jacksboro who have obtained a bachelor's degree or higher.
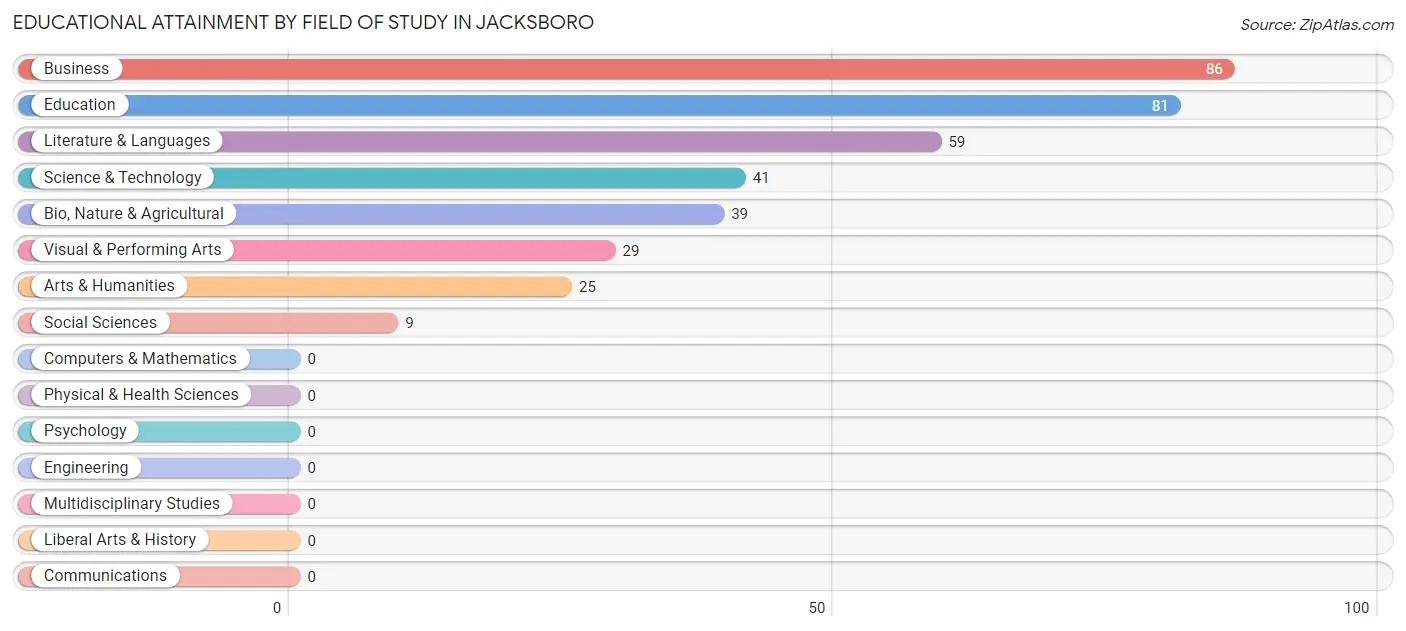
| Field of Study | # Graduates | % Graduates |
| Computers & Mathematics | 0 | 0.0% |
| Bio, Nature & Agricultural | 39 | 10.6% |
| Physical & Health Sciences | 0 | 0.0% |
| Psychology | 0 | 0.0% |
| Social Sciences | 9 | 2.4% |
| Engineering | 0 | 0.0% |
| Multidisciplinary Studies | 0 | 0.0% |
| Science & Technology | 41 | 11.1% |
| Business | 86 | 23.3% |
| Education | 81 | 22.0% |
| Literature & Languages | 59 | 16.0% |
| Liberal Arts & History | 0 | 0.0% |
| Visual & Performing Arts | 29 | 7.9% |
| Communications | 0 | 0.0% |
| Arts & Humanities | 25 | 6.8% |
| Total | 369 | 100.0% |
Transportation & Commute in Jacksboro
Vehicle Availability by Sex in Jacksboro
The most prevalent vehicle ownership categories in Jacksboro are males with 2 vehicles (348, accounting for 49.5%) and females with 2 vehicles (212, making up 66.7%).
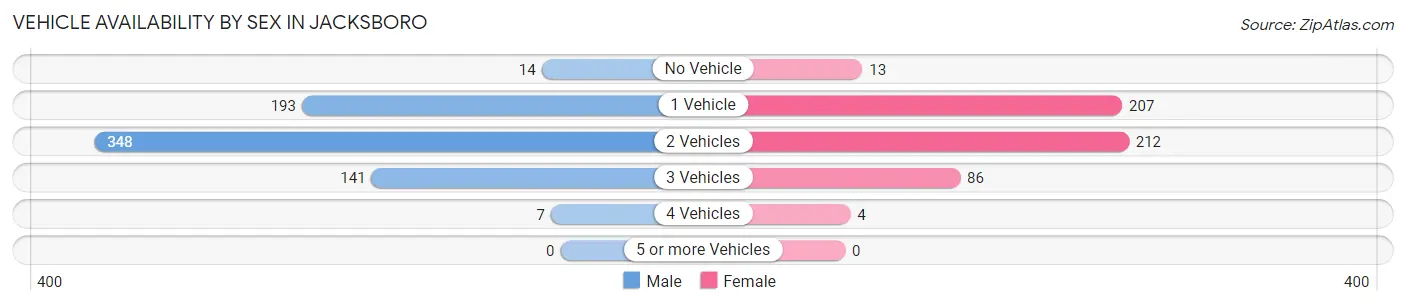
| Vehicles Available | Male | Female |
| No Vehicle | 14 (2.0%) | 13 (2.5%) |
| 1 Vehicle | 193 (27.5%) | 207 (39.7%) |
| 2 Vehicles | 348 (49.5%) | 212 (40.6%) |
| 3 Vehicles | 141 (20.1%) | 86 (16.5%) |
| 4 Vehicles | 7 (1.0%) | 4 (0.8%) |
| 5 or more Vehicles | 0 (0.0%) | 0 (0.0%) |
| Total | 703 (100.0%) | 522 (100.0%) |
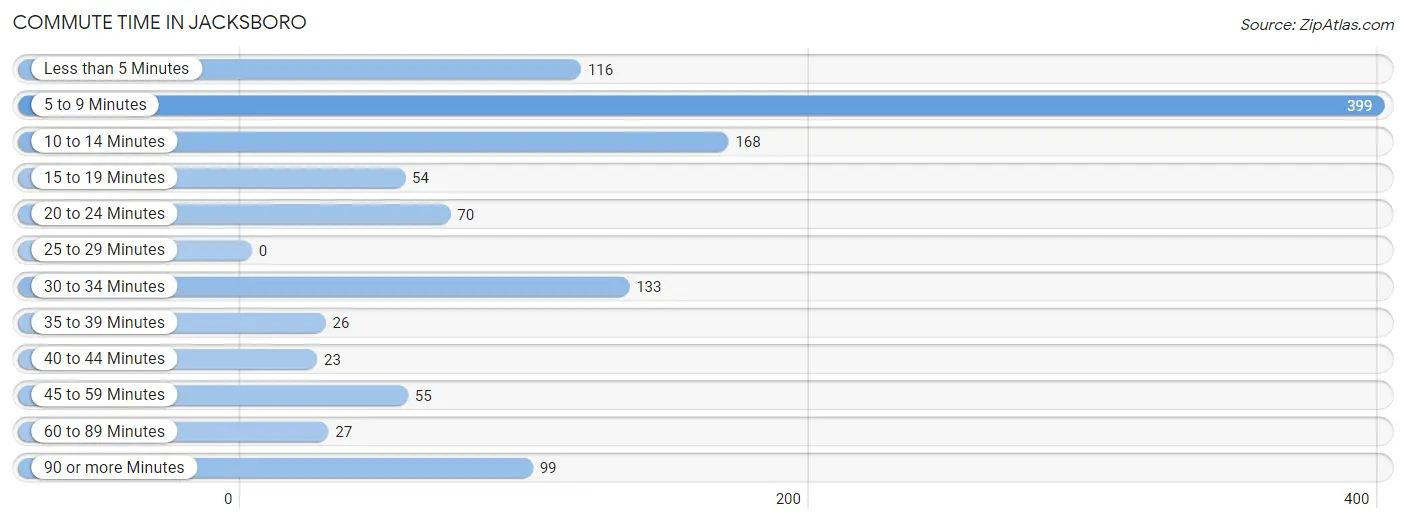
Commute Time in Jacksboro
The most frequently occuring commute durations in Jacksboro are 5 to 9 minutes (399 commuters, 34.1%), 10 to 14 minutes (168 commuters, 14.4%), and 30 to 34 minutes (133 commuters, 11.4%).
| Commute Time | # Commuters | % Commuters |
| Less than 5 Minutes | 116 | 9.9% |
| 5 to 9 Minutes | 399 | 34.1% |
| 10 to 14 Minutes | 168 | 14.4% |
| 15 to 19 Minutes | 54 | 4.6% |
| 20 to 24 Minutes | 70 | 6.0% |
| 25 to 29 Minutes | 0 | 0.0% |
| 30 to 34 Minutes | 133 | 11.4% |
| 35 to 39 Minutes | 26 | 2.2% |
| 40 to 44 Minutes | 23 | 2.0% |
| 45 to 59 Minutes | 55 | 4.7% |
| 60 to 89 Minutes | 27 | 2.3% |
| 90 or more Minutes | 99 | 8.5% |
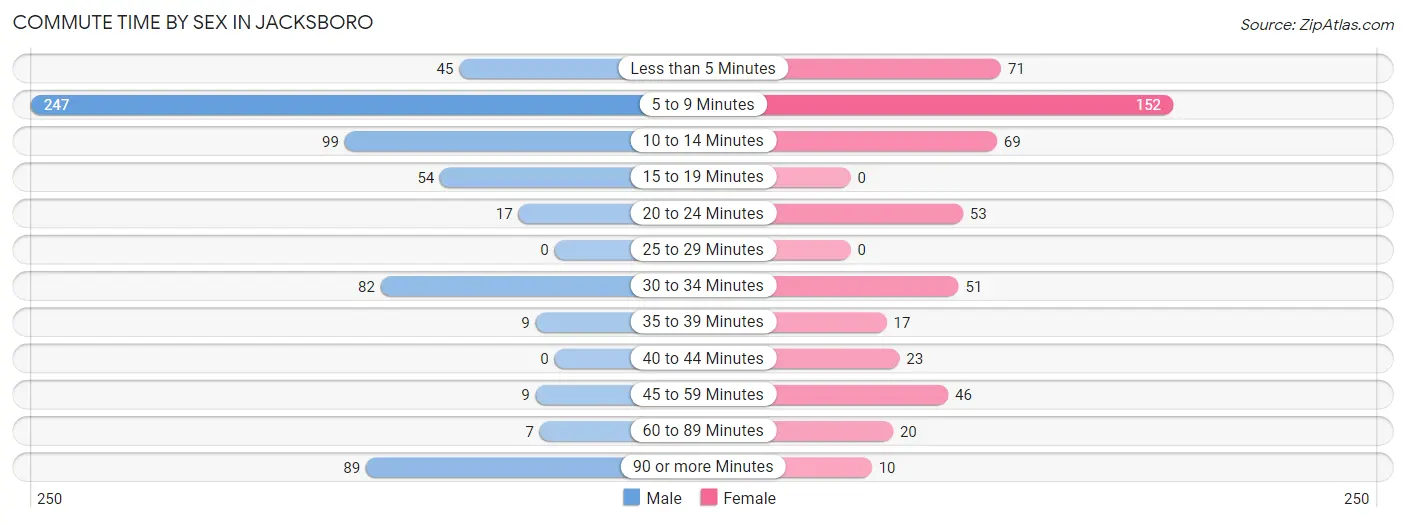
Commute Time by Sex in Jacksboro
The most common commute times in Jacksboro are 5 to 9 minutes (247 commuters, 37.5%) for males and 5 to 9 minutes (152 commuters, 29.7%) for females.
| Commute Time | Male | Female |
| Less than 5 Minutes | 45 (6.8%) | 71 (13.9%) |
| 5 to 9 Minutes | 247 (37.5%) | 152 (29.7%) |
| 10 to 14 Minutes | 99 (15.0%) | 69 (13.5%) |
| 15 to 19 Minutes | 54 (8.2%) | 0 (0.0%) |
| 20 to 24 Minutes | 17 (2.6%) | 53 (10.3%) |
| 25 to 29 Minutes | 0 (0.0%) | 0 (0.0%) |
| 30 to 34 Minutes | 82 (12.5%) | 51 (10.0%) |
| 35 to 39 Minutes | 9 (1.4%) | 17 (3.3%) |
| 40 to 44 Minutes | 0 (0.0%) | 23 (4.5%) |
| 45 to 59 Minutes | 9 (1.4%) | 46 (9.0%) |
| 60 to 89 Minutes | 7 (1.1%) | 20 (3.9%) |
| 90 or more Minutes | 89 (13.5%) | 10 (1.9%) |
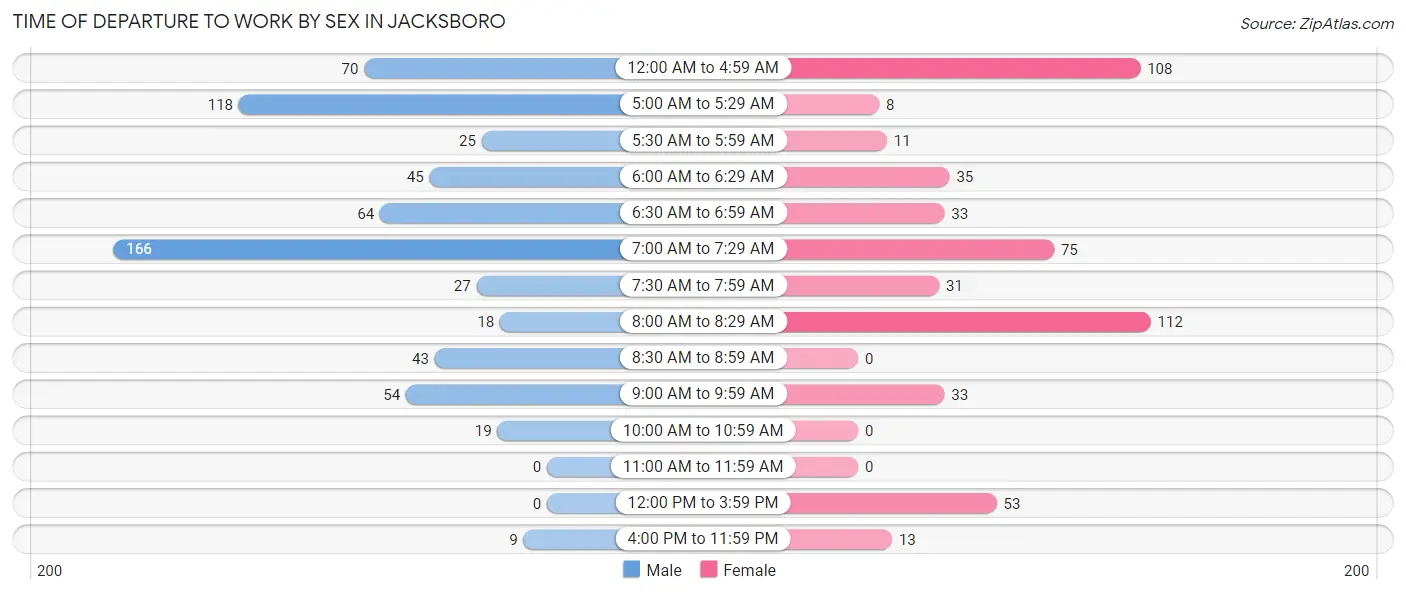
Time of Departure to Work by Sex in Jacksboro
The most frequent times of departure to work in Jacksboro are 7:00 AM to 7:29 AM (166, 25.2%) for males and 8:00 AM to 8:29 AM (112, 21.9%) for females.
| Time of Departure | Male | Female |
| 12:00 AM to 4:59 AM | 70 (10.6%) | 108 (21.1%) |
| 5:00 AM to 5:29 AM | 118 (17.9%) | 8 (1.6%) |
| 5:30 AM to 5:59 AM | 25 (3.8%) | 11 (2.1%) |
| 6:00 AM to 6:29 AM | 45 (6.8%) | 35 (6.8%) |
| 6:30 AM to 6:59 AM | 64 (9.7%) | 33 (6.5%) |
| 7:00 AM to 7:29 AM | 166 (25.2%) | 75 (14.6%) |
| 7:30 AM to 7:59 AM | 27 (4.1%) | 31 (6.0%) |
| 8:00 AM to 8:29 AM | 18 (2.7%) | 112 (21.9%) |
| 8:30 AM to 8:59 AM | 43 (6.5%) | 0 (0.0%) |
| 9:00 AM to 9:59 AM | 54 (8.2%) | 33 (6.5%) |
| 10:00 AM to 10:59 AM | 19 (2.9%) | 0 (0.0%) |
| 11:00 AM to 11:59 AM | 0 (0.0%) | 0 (0.0%) |
| 12:00 PM to 3:59 PM | 0 (0.0%) | 53 (10.3%) |
| 4:00 PM to 11:59 PM | 9 (1.4%) | 13 (2.5%) |
| Total | 658 (100.0%) | 512 (100.0%) |
Housing Occupancy in Jacksboro
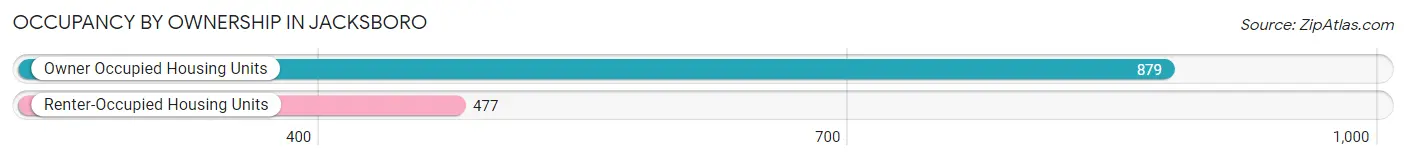
Occupancy by Ownership in Jacksboro
Of the total 1,356 dwellings in Jacksboro, owner-occupied units account for 879 (64.8%), while renter-occupied units make up 477 (35.2%).
| Occupancy | # Housing Units | % Housing Units |
| Owner Occupied Housing Units | 879 | 64.8% |
| Renter-Occupied Housing Units | 477 | 35.2% |
| Total Occupied Housing Units | 1,356 | 100.0% |
Occupancy by Household Size in Jacksboro
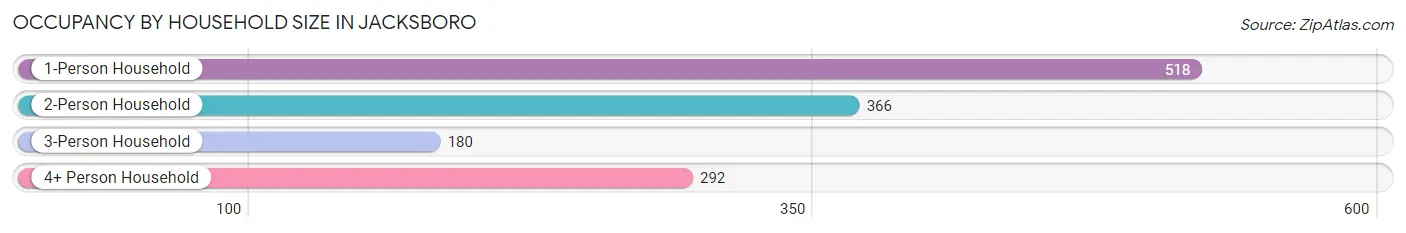
| Household Size | # Housing Units | % Housing Units |
| 1-Person Household | 518 | 38.2% |
| 2-Person Household | 366 | 27.0% |
| 3-Person Household | 180 | 13.3% |
| 4+ Person Household | 292 | 21.5% |
| Total Housing Units | 1,356 | 100.0% |
Occupancy by Ownership by Household Size in Jacksboro
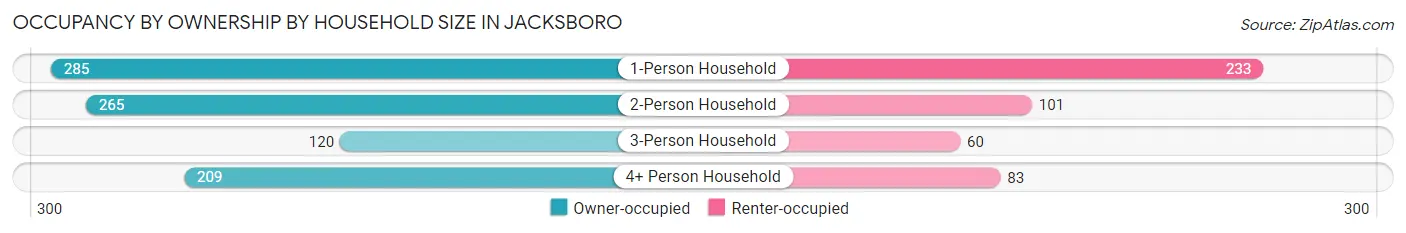
| Household Size | Owner-occupied | Renter-occupied |
| 1-Person Household | 285 (55.0%) | 233 (45.0%) |
| 2-Person Household | 265 (72.4%) | 101 (27.6%) |
| 3-Person Household | 120 (66.7%) | 60 (33.3%) |
| 4+ Person Household | 209 (71.6%) | 83 (28.4%) |
| Total Housing Units | 879 (64.8%) | 477 (35.2%) |
Occupancy by Educational Attainment in Jacksboro
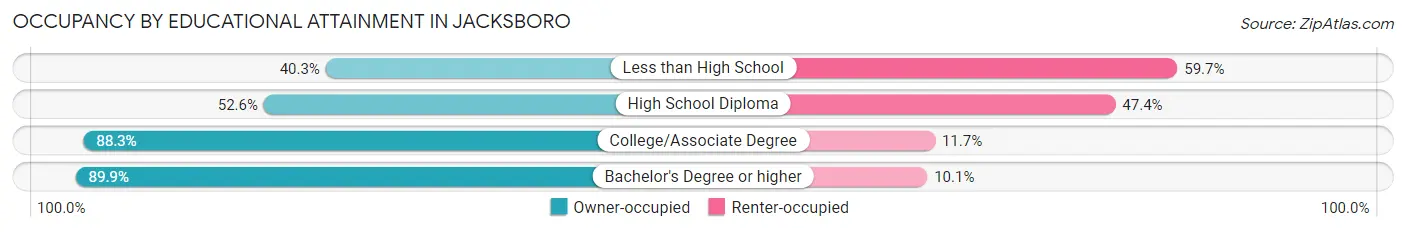
| Household Size | Owner-occupied | Renter-occupied |
| Less than High School | 160 (40.3%) | 237 (59.7%) |
| High School Diploma | 194 (52.6%) | 175 (47.4%) |
| College/Associate Degree | 303 (88.3%) | 40 (11.7%) |
| Bachelor's Degree or higher | 222 (89.9%) | 25 (10.1%) |
Occupancy by Age of Householder in Jacksboro
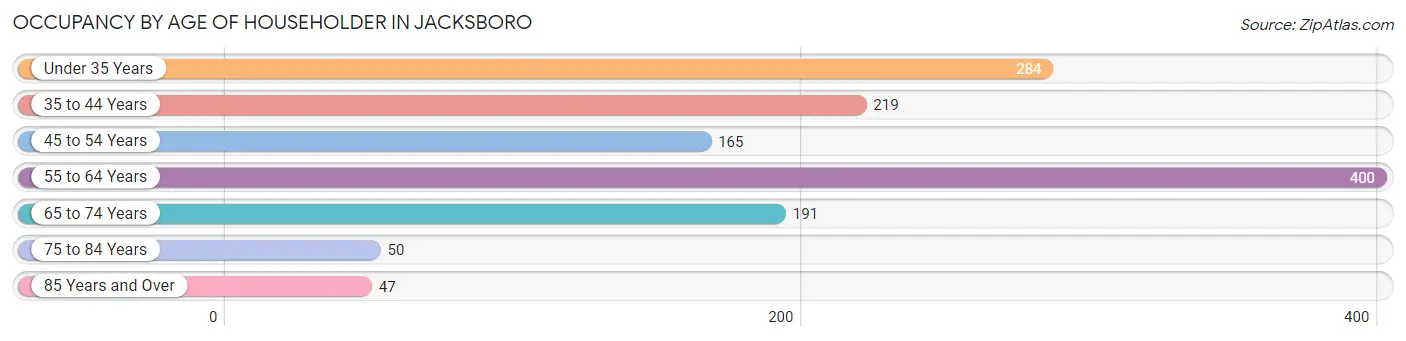
| Age Bracket | # Households | % Households |
| Under 35 Years | 284 | 20.9% |
| 35 to 44 Years | 219 | 16.2% |
| 45 to 54 Years | 165 | 12.2% |
| 55 to 64 Years | 400 | 29.5% |
| 65 to 74 Years | 191 | 14.1% |
| 75 to 84 Years | 50 | 3.7% |
| 85 Years and Over | 47 | 3.5% |
| Total | 1,356 | 100.0% |
Housing Finances in Jacksboro
Median Income by Occupancy in Jacksboro
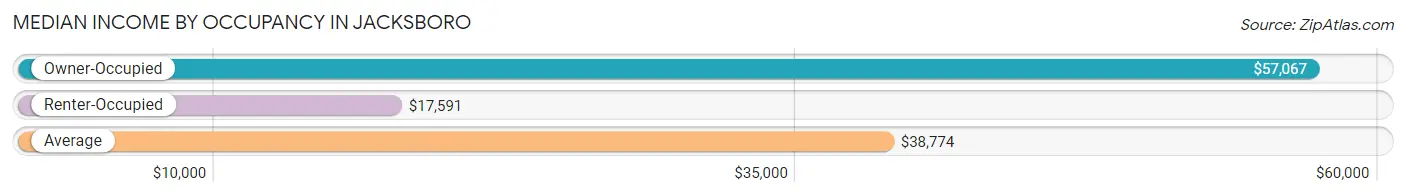
| Occupancy Type | # Households | Median Income |
| Owner-Occupied | 879 (64.8%) | $57,067 |
| Renter-Occupied | 477 (35.2%) | $17,591 |
| Average | 1,356 (100.0%) | $38,774 |
Occupancy by Householder Income Bracket in Jacksboro
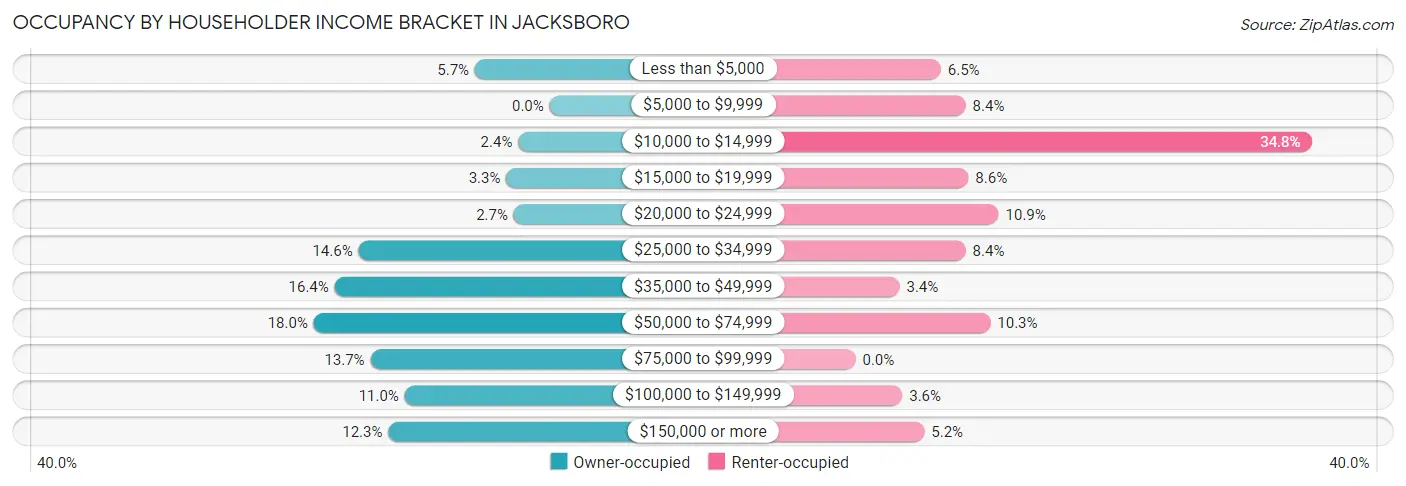
| Income Bracket | Owner-occupied | Renter-occupied |
| Less than $5,000 | 50 (5.7%) | 31 (6.5%) |
| $5,000 to $9,999 | 0 (0.0%) | 40 (8.4%) |
| $10,000 to $14,999 | 21 (2.4%) | 166 (34.8%) |
| $15,000 to $19,999 | 29 (3.3%) | 41 (8.6%) |
| $20,000 to $24,999 | 24 (2.7%) | 52 (10.9%) |
| $25,000 to $34,999 | 128 (14.6%) | 40 (8.4%) |
| $35,000 to $49,999 | 144 (16.4%) | 16 (3.4%) |
| $50,000 to $74,999 | 158 (18.0%) | 49 (10.3%) |
| $75,000 to $99,999 | 120 (13.7%) | 0 (0.0%) |
| $100,000 to $149,999 | 97 (11.0%) | 17 (3.6%) |
| $150,000 or more | 108 (12.3%) | 25 (5.2%) |
| Total | 879 (100.0%) | 477 (100.0%) |
Monthly Housing Cost Tiers in Jacksboro
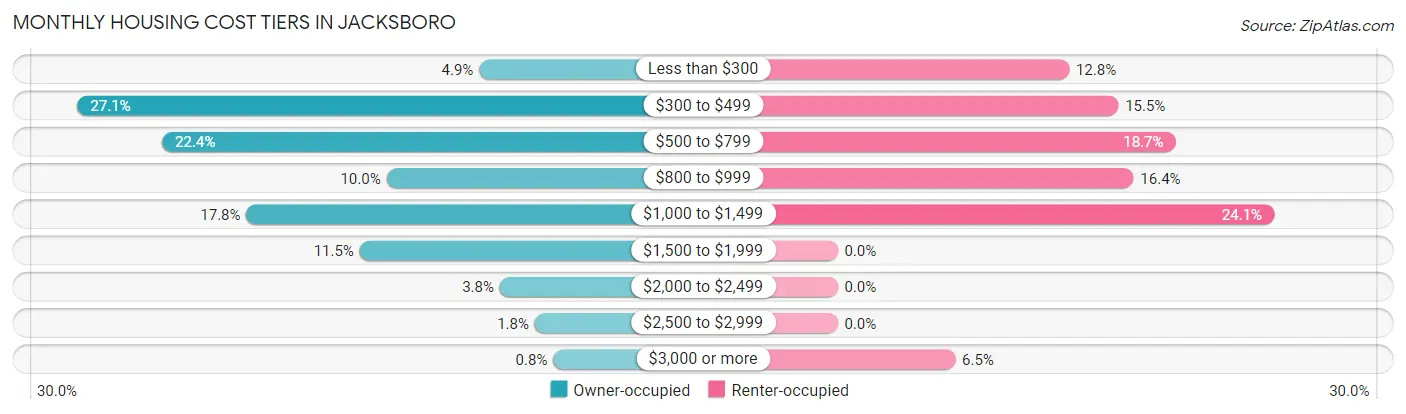
| Monthly Cost | Owner-occupied | Renter-occupied |
| Less than $300 | 43 (4.9%) | 61 (12.8%) |
| $300 to $499 | 238 (27.1%) | 74 (15.5%) |
| $500 to $799 | 197 (22.4%) | 89 (18.7%) |
| $800 to $999 | 88 (10.0%) | 78 (16.4%) |
| $1,000 to $1,499 | 156 (17.7%) | 115 (24.1%) |
| $1,500 to $1,999 | 101 (11.5%) | 0 (0.0%) |
| $2,000 to $2,499 | 33 (3.7%) | 0 (0.0%) |
| $2,500 to $2,999 | 16 (1.8%) | 0 (0.0%) |
| $3,000 or more | 7 (0.8%) | 31 (6.5%) |
| Total | 879 (100.0%) | 477 (100.0%) |
Physical Housing Characteristics in Jacksboro
Housing Structures in Jacksboro
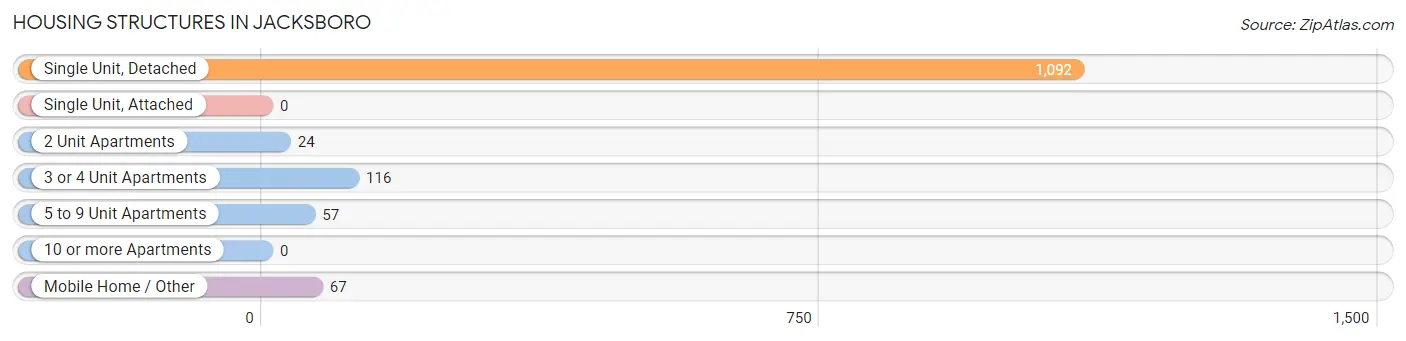
| Structure Type | # Housing Units | % Housing Units |
| Single Unit, Detached | 1,092 | 80.5% |
| Single Unit, Attached | 0 | 0.0% |
| 2 Unit Apartments | 24 | 1.8% |
| 3 or 4 Unit Apartments | 116 | 8.6% |
| 5 to 9 Unit Apartments | 57 | 4.2% |
| 10 or more Apartments | 0 | 0.0% |
| Mobile Home / Other | 67 | 4.9% |
| Total | 1,356 | 100.0% |
Housing Structures by Occupancy in Jacksboro
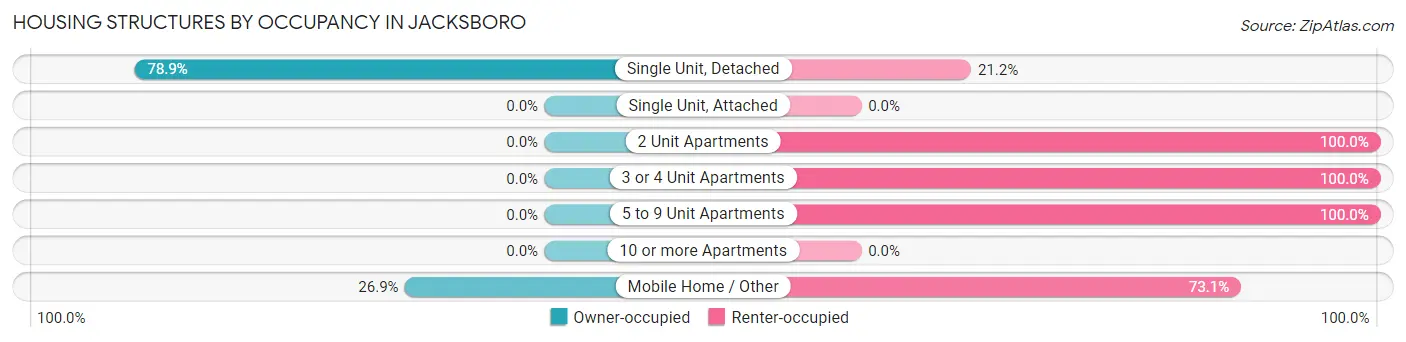
| Structure Type | Owner-occupied | Renter-occupied |
| Single Unit, Detached | 861 (78.8%) | 231 (21.1%) |
| Single Unit, Attached | 0 (0.0%) | 0 (0.0%) |
| 2 Unit Apartments | 0 (0.0%) | 24 (100.0%) |
| 3 or 4 Unit Apartments | 0 (0.0%) | 116 (100.0%) |
| 5 to 9 Unit Apartments | 0 (0.0%) | 57 (100.0%) |
| 10 or more Apartments | 0 (0.0%) | 0 (0.0%) |
| Mobile Home / Other | 18 (26.9%) | 49 (73.1%) |
| Total | 879 (64.8%) | 477 (35.2%) |
Housing Structures by Number of Rooms in Jacksboro
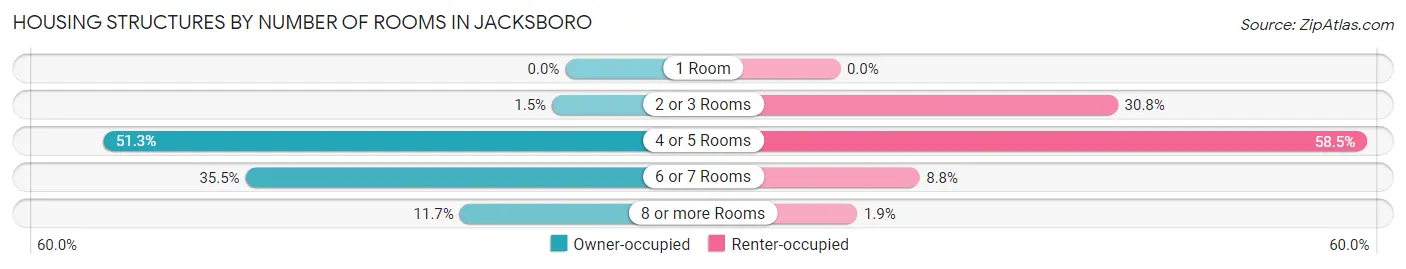
| Number of Rooms | Owner-occupied | Renter-occupied |
| 1 Room | 0 (0.0%) | 0 (0.0%) |
| 2 or 3 Rooms | 13 (1.5%) | 147 (30.8%) |
| 4 or 5 Rooms | 451 (51.3%) | 279 (58.5%) |
| 6 or 7 Rooms | 312 (35.5%) | 42 (8.8%) |
| 8 or more Rooms | 103 (11.7%) | 9 (1.9%) |
| Total | 879 (100.0%) | 477 (100.0%) |
Housing Structure by Heating Type in Jacksboro
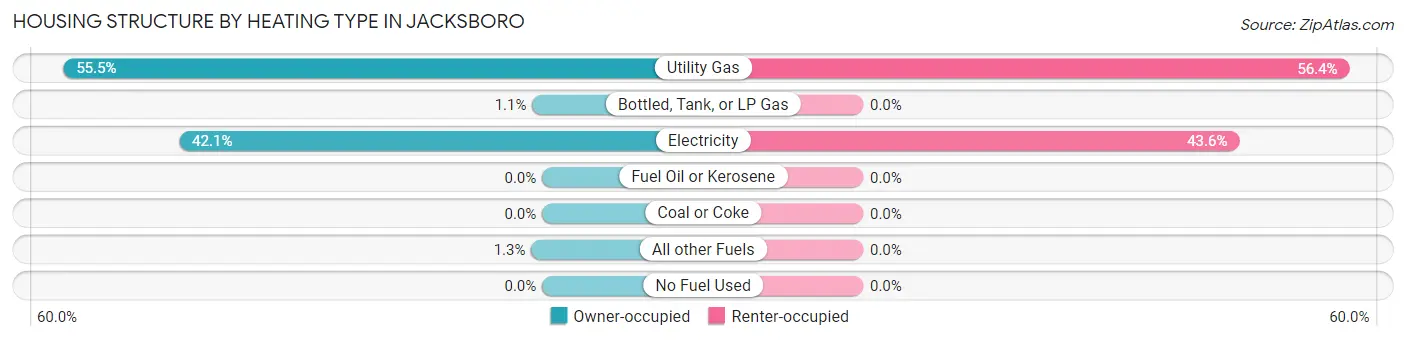
| Heating Type | Owner-occupied | Renter-occupied |
| Utility Gas | 488 (55.5%) | 269 (56.4%) |
| Bottled, Tank, or LP Gas | 10 (1.1%) | 0 (0.0%) |
| Electricity | 370 (42.1%) | 208 (43.6%) |
| Fuel Oil or Kerosene | 0 (0.0%) | 0 (0.0%) |
| Coal or Coke | 0 (0.0%) | 0 (0.0%) |
| All other Fuels | 11 (1.3%) | 0 (0.0%) |
| No Fuel Used | 0 (0.0%) | 0 (0.0%) |
| Total | 879 (100.0%) | 477 (100.0%) |
Household Vehicle Usage in Jacksboro
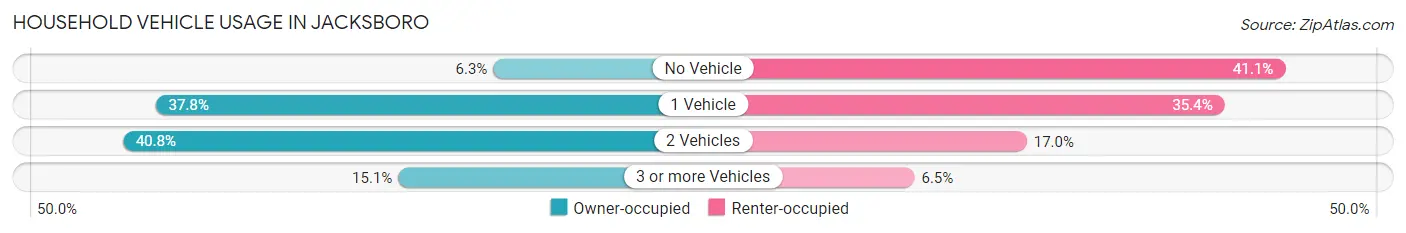
| Vehicles per Household | Owner-occupied | Renter-occupied |
| No Vehicle | 55 (6.3%) | 196 (41.1%) |
| 1 Vehicle | 332 (37.8%) | 169 (35.4%) |
| 2 Vehicles | 359 (40.8%) | 81 (17.0%) |
| 3 or more Vehicles | 133 (15.1%) | 31 (6.5%) |
| Total | 879 (100.0%) | 477 (100.0%) |
Real Estate & Mortgages in Jacksboro
Real Estate and Mortgage Overview in Jacksboro
| Characteristic | Without Mortgage | With Mortgage |
| Housing Units | 500 | 379 |
| Median Property Value | $60,000 | $120,300 |
| Median Household Income | $42,273 | $69 |
| Monthly Housing Costs | $478 | $7 |
| Real Estate Taxes | $1,777 | $0 |
Property Value by Mortgage Status in Jacksboro
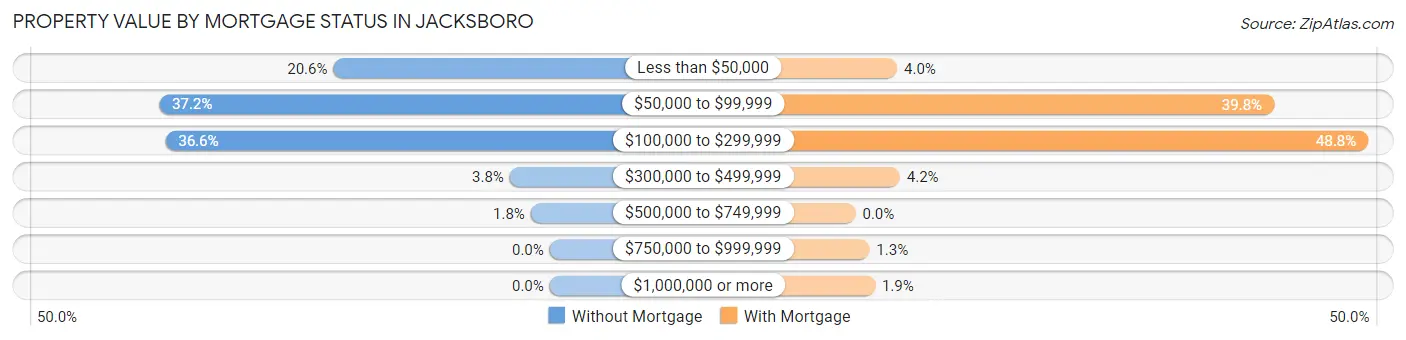
| Property Value | Without Mortgage | With Mortgage |
| Less than $50,000 | 103 (20.6%) | 15 (4.0%) |
| $50,000 to $99,999 | 186 (37.2%) | 151 (39.8%) |
| $100,000 to $299,999 | 183 (36.6%) | 185 (48.8%) |
| $300,000 to $499,999 | 19 (3.8%) | 16 (4.2%) |
| $500,000 to $749,999 | 9 (1.8%) | 0 (0.0%) |
| $750,000 to $999,999 | 0 (0.0%) | 5 (1.3%) |
| $1,000,000 or more | 0 (0.0%) | 7 (1.8%) |
| Total | 500 (100.0%) | 379 (100.0%) |
Household Income by Mortgage Status in Jacksboro
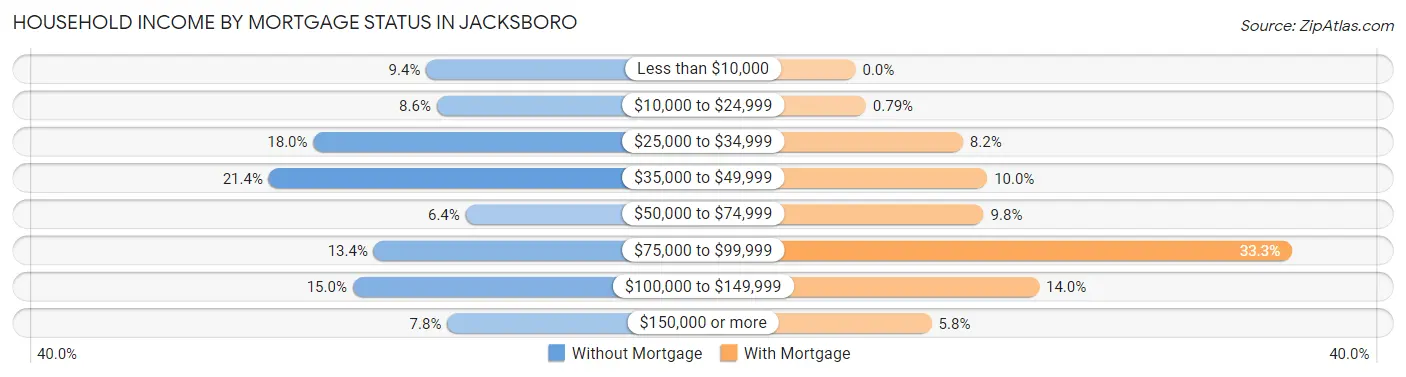
| Household Income | Without Mortgage | With Mortgage |
| Less than $10,000 | 47 (9.4%) | 0 (0.0%) |
| $10,000 to $24,999 | 43 (8.6%) | 3 (0.8%) |
| $25,000 to $34,999 | 90 (18.0%) | 31 (8.2%) |
| $35,000 to $49,999 | 107 (21.4%) | 38 (10.0%) |
| $50,000 to $74,999 | 32 (6.4%) | 37 (9.8%) |
| $75,000 to $99,999 | 67 (13.4%) | 126 (33.3%) |
| $100,000 to $149,999 | 75 (15.0%) | 53 (14.0%) |
| $150,000 or more | 39 (7.8%) | 22 (5.8%) |
| Total | 500 (100.0%) | 379 (100.0%) |
Property Value to Household Income Ratio in Jacksboro
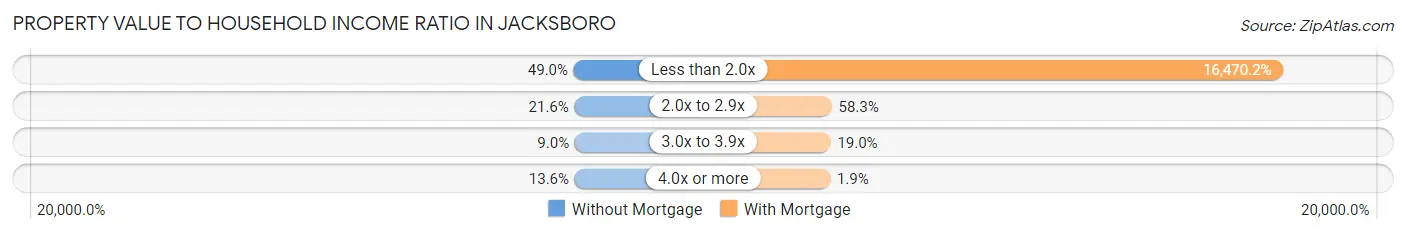
| Value-to-Income Ratio | Without Mortgage | With Mortgage |
| Less than 2.0x | 245 (49.0%) | 62,422 (16,470.2%) |
| 2.0x to 2.9x | 108 (21.6%) | 221 (58.3%) |
| 3.0x to 3.9x | 45 (9.0%) | 72 (19.0%) |
| 4.0x or more | 68 (13.6%) | 7 (1.8%) |
| Total | 500 (100.0%) | 379 (100.0%) |
Real Estate Taxes by Mortgage Status in Jacksboro
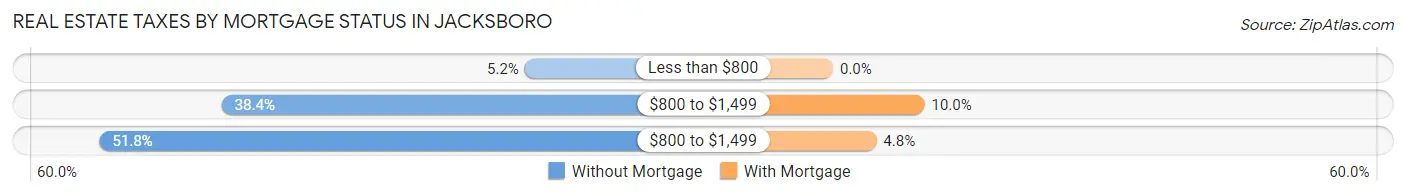
| Property Taxes | Without Mortgage | With Mortgage |
| Less than $800 | 26 (5.2%) | 0 (0.0%) |
| $800 to $1,499 | 192 (38.4%) | 38 (10.0%) |
| $800 to $1,499 | 259 (51.8%) | 18 (4.8%) |
| Total | 500 (100.0%) | 379 (100.0%) |
Health & Disability in Jacksboro
Health Insurance Coverage by Age in Jacksboro
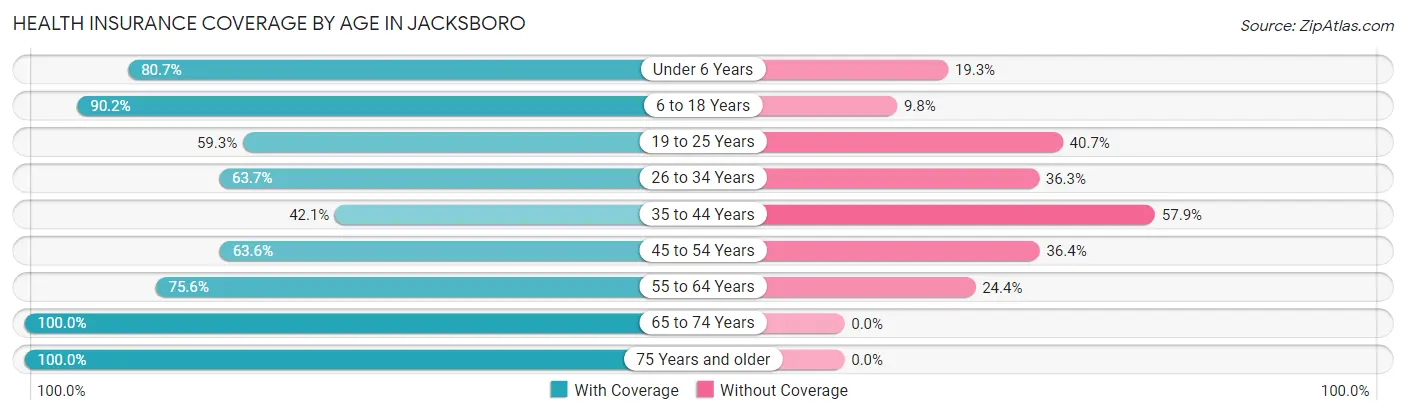
| Age Bracket | With Coverage | Without Coverage |
| Under 6 Years | 192 (80.7%) | 46 (19.3%) |
| 6 to 18 Years | 670 (90.2%) | 73 (9.8%) |
| 19 to 25 Years | 115 (59.3%) | 79 (40.7%) |
| 26 to 34 Years | 260 (63.7%) | 148 (36.3%) |
| 35 to 44 Years | 162 (42.1%) | 223 (57.9%) |
| 45 to 54 Years | 166 (63.6%) | 95 (36.4%) |
| 55 to 64 Years | 356 (75.6%) | 115 (24.4%) |
| 65 to 74 Years | 325 (100.0%) | 0 (0.0%) |
| 75 Years and older | 159 (100.0%) | 0 (0.0%) |
| Total | 2,405 (75.5%) | 779 (24.5%) |
Health Insurance Coverage by Citizenship Status in Jacksboro
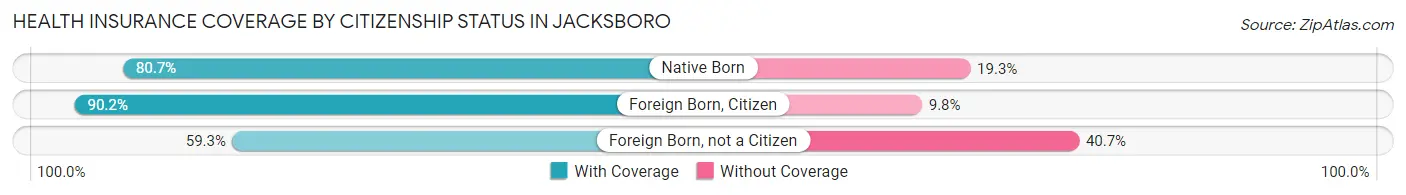
| Citizenship Status | With Coverage | Without Coverage |
| Native Born | 192 (80.7%) | 46 (19.3%) |
| Foreign Born, Citizen | 670 (90.2%) | 73 (9.8%) |
| Foreign Born, not a Citizen | 115 (59.3%) | 79 (40.7%) |
Health Insurance Coverage by Household Income in Jacksboro
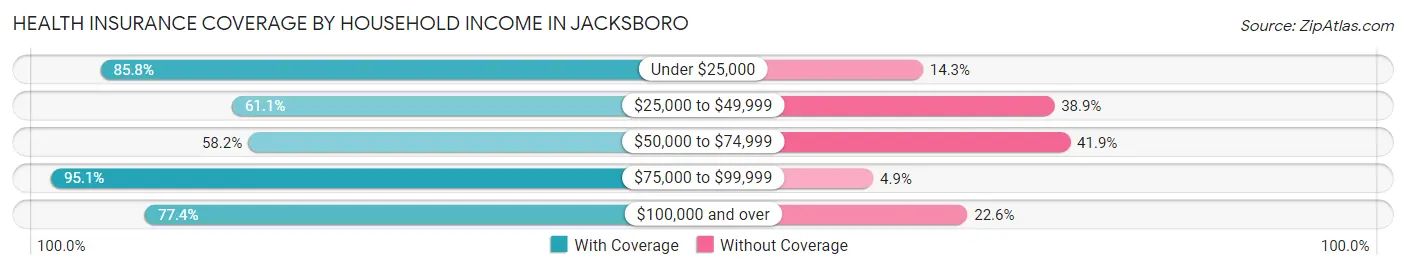
| Household Income | With Coverage | Without Coverage |
| Under $25,000 | 746 (85.8%) | 124 (14.2%) |
| $25,000 to $49,999 | 420 (61.1%) | 267 (38.9%) |
| $50,000 to $74,999 | 321 (58.2%) | 231 (41.8%) |
| $75,000 to $99,999 | 462 (95.1%) | 24 (4.9%) |
| $100,000 and over | 456 (77.4%) | 133 (22.6%) |
Public vs Private Health Insurance Coverage by Age in Jacksboro
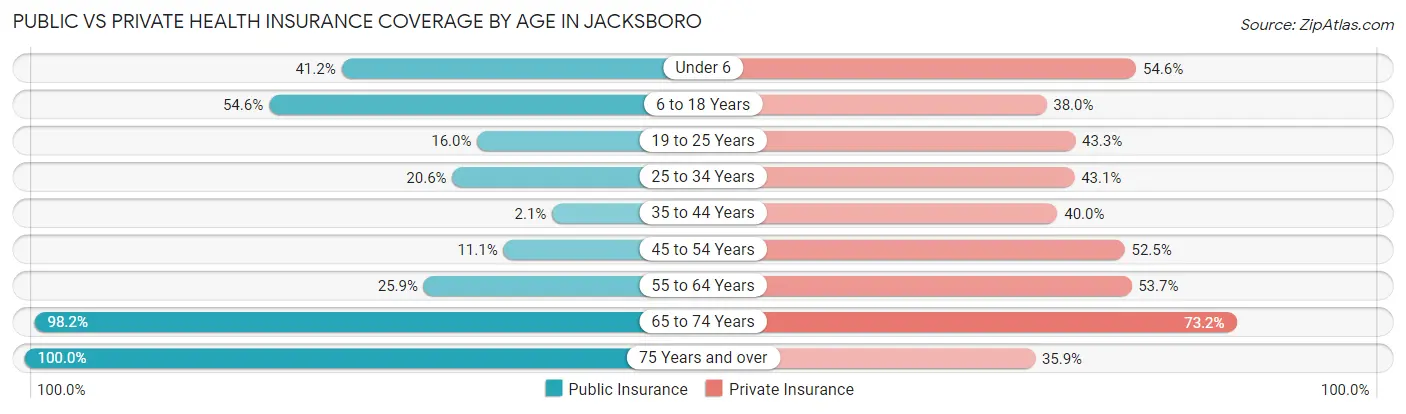
| Age Bracket | Public Insurance | Private Insurance |
| Under 6 | 98 (41.2%) | 130 (54.6%) |
| 6 to 18 Years | 406 (54.6%) | 282 (38.0%) |
| 19 to 25 Years | 31 (16.0%) | 84 (43.3%) |
| 25 to 34 Years | 84 (20.6%) | 176 (43.1%) |
| 35 to 44 Years | 8 (2.1%) | 154 (40.0%) |
| 45 to 54 Years | 29 (11.1%) | 137 (52.5%) |
| 55 to 64 Years | 122 (25.9%) | 253 (53.7%) |
| 65 to 74 Years | 319 (98.2%) | 238 (73.2%) |
| 75 Years and over | 159 (100.0%) | 57 (35.8%) |
| Total | 1,256 (39.5%) | 1,511 (47.5%) |
Disability Status by Sex by Age in Jacksboro
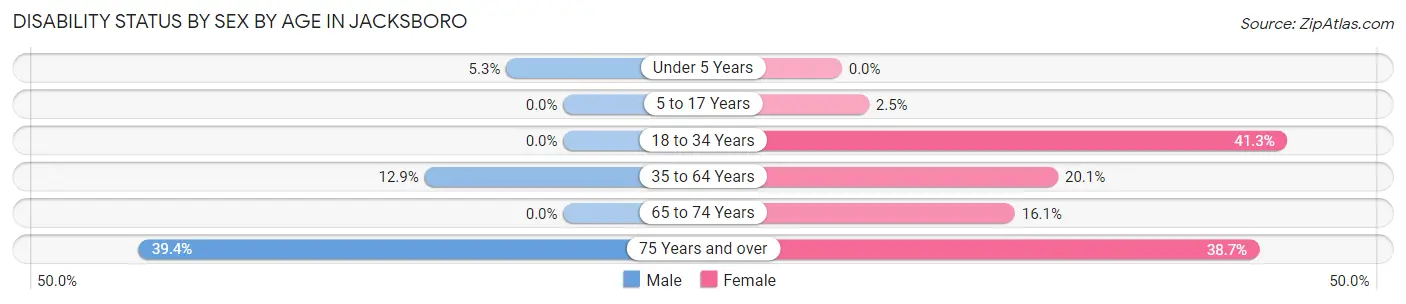
| Age Bracket | Male | Female |
| Under 5 Years | 8 (5.3%) | 0 (0.0%) |
| 5 to 17 Years | 0 (0.0%) | 9 (2.5%) |
| 18 to 34 Years | 0 (0.0%) | 149 (41.3%) |
| 35 to 64 Years | 72 (12.9%) | 112 (20.1%) |
| 65 to 74 Years | 0 (0.0%) | 35 (16.1%) |
| 75 Years and over | 26 (39.4%) | 36 (38.7%) |
Disability Class by Sex by Age in Jacksboro
Disability Class: Hearing Difficulty
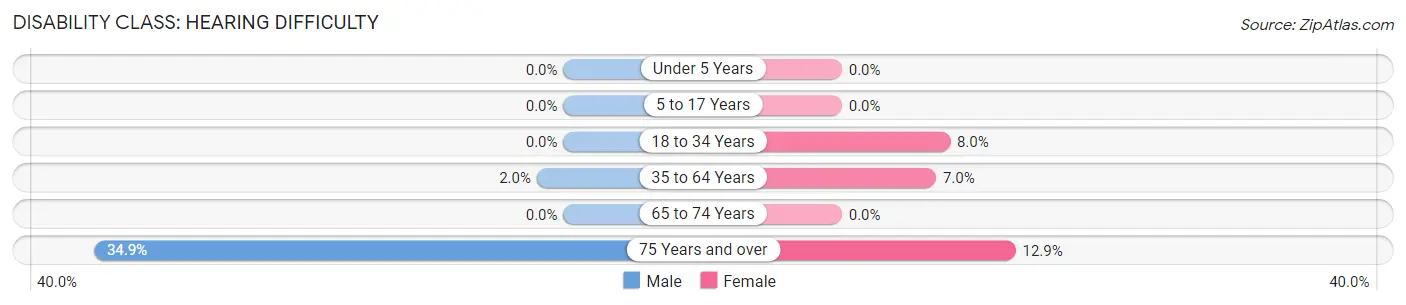
| Age Bracket | Male | Female |
| Under 5 Years | 0 (0.0%) | 0 (0.0%) |
| 5 to 17 Years | 0 (0.0%) | 0 (0.0%) |
| 18 to 34 Years | 0 (0.0%) | 29 (8.0%) |
| 35 to 64 Years | 11 (2.0%) | 39 (7.0%) |
| 65 to 74 Years | 0 (0.0%) | 0 (0.0%) |
| 75 Years and over | 23 (34.8%) | 12 (12.9%) |
Disability Class: Vision Difficulty
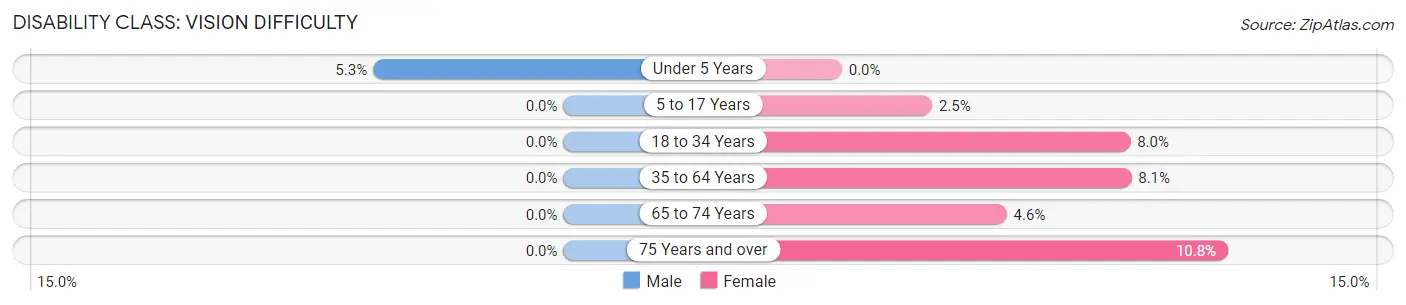
| Age Bracket | Male | Female |
| Under 5 Years | 8 (5.3%) | 0 (0.0%) |
| 5 to 17 Years | 0 (0.0%) | 9 (2.5%) |
| 18 to 34 Years | 0 (0.0%) | 29 (8.0%) |
| 35 to 64 Years | 0 (0.0%) | 45 (8.1%) |
| 65 to 74 Years | 0 (0.0%) | 10 (4.6%) |
| 75 Years and over | 0 (0.0%) | 10 (10.7%) |
Disability Class: Cognitive Difficulty
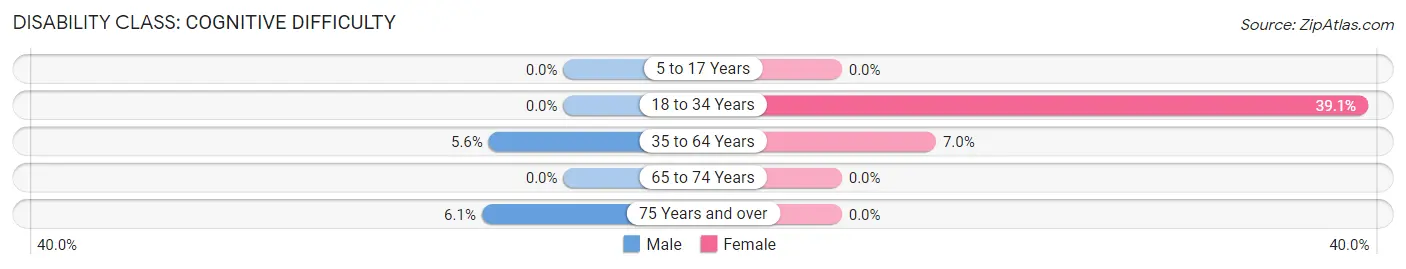
| Age Bracket | Male | Female |
| 5 to 17 Years | 0 (0.0%) | 0 (0.0%) |
| 18 to 34 Years | 0 (0.0%) | 141 (39.1%) |
| 35 to 64 Years | 31 (5.6%) | 39 (7.0%) |
| 65 to 74 Years | 0 (0.0%) | 0 (0.0%) |
| 75 Years and over | 4 (6.1%) | 0 (0.0%) |
Disability Class: Ambulatory Difficulty
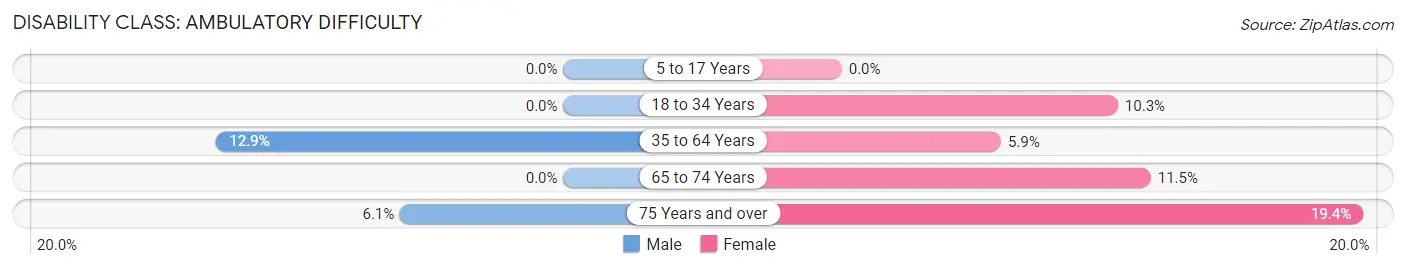
| Age Bracket | Male | Female |
| 5 to 17 Years | 0 (0.0%) | 0 (0.0%) |
| 18 to 34 Years | 0 (0.0%) | 37 (10.2%) |
| 35 to 64 Years | 72 (12.9%) | 33 (5.9%) |
| 65 to 74 Years | 0 (0.0%) | 25 (11.5%) |
| 75 Years and over | 4 (6.1%) | 18 (19.4%) |
Disability Class: Self-Care Difficulty
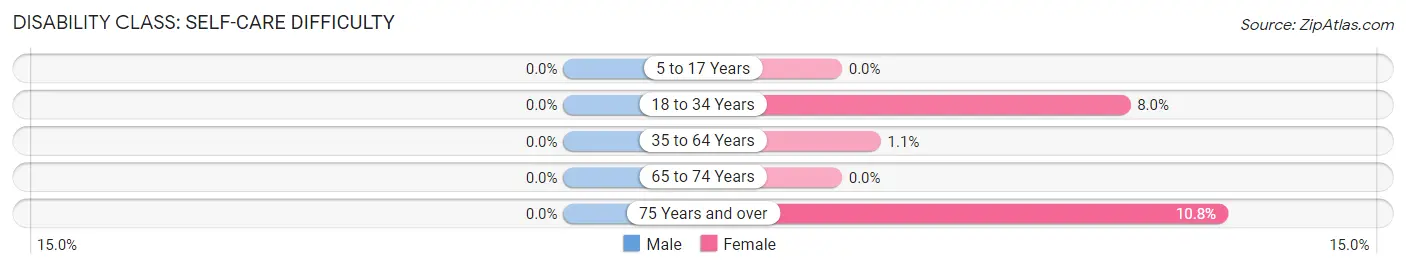
| Age Bracket | Male | Female |
| 5 to 17 Years | 0 (0.0%) | 0 (0.0%) |
| 18 to 34 Years | 0 (0.0%) | 29 (8.0%) |
| 35 to 64 Years | 0 (0.0%) | 6 (1.1%) |
| 65 to 74 Years | 0 (0.0%) | 0 (0.0%) |
| 75 Years and over | 0 (0.0%) | 10 (10.7%) |
Technology Access in Jacksboro
Computing Device Access in Jacksboro
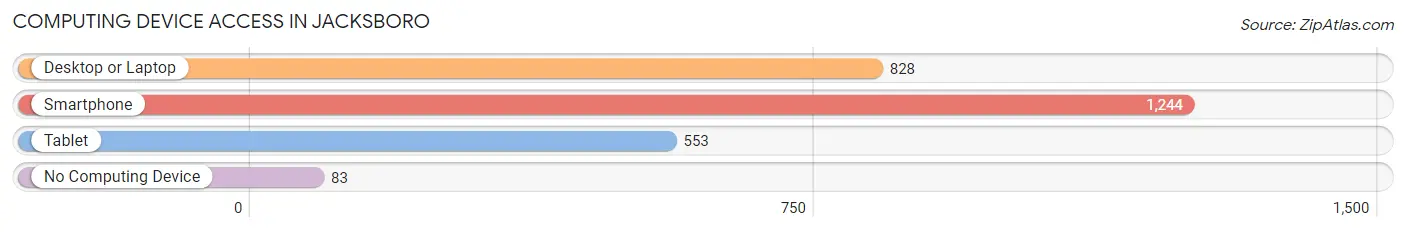
| Device Type | # Households | % Households |
| Desktop or Laptop | 828 | 61.1% |
| Smartphone | 1,244 | 91.7% |
| Tablet | 553 | 40.8% |
| No Computing Device | 83 | 6.1% |
| Total | 1,356 | 100.0% |
Internet Access in Jacksboro
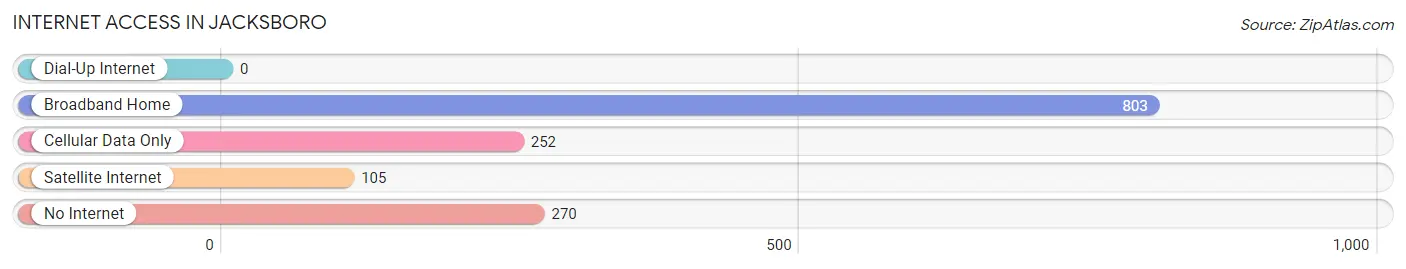
| Internet Type | # Households | % Households |
| Dial-Up Internet | 0 | 0.0% |
| Broadband Home | 803 | 59.2% |
| Cellular Data Only | 252 | 18.6% |
| Satellite Internet | 105 | 7.7% |
| No Internet | 270 | 19.9% |
| Total | 1,356 | 100.0% |
Jacksboro Summary
Jacksboro is a city located in Jack County, Texas, United States. The population was 4,511 at the 2010 census. It is the county seat of Jack County.
History
Jacksboro was founded in 1856 by settlers from Tennessee and Kentucky. The town was named after a local rancher, Jacksboro Smith. The town was incorporated in 1876 and became the county seat of Jack County in 1879.
Jacksboro was an important stop on the Chisholm Trail, which was used by cattle drives from Texas to Kansas. The town was also a major stop on the Texas and Pacific Railway, which was built in 1881.
The town was the site of a major battle during the Red River War of 1874. The battle, known as the Battle of Jacksboro, was fought between the United States Army and a group of Native Americans led by Chief Quanah Parker. The Native Americans were defeated and the town was saved from destruction.
In the early 20th century, Jacksboro was a major center for oil production. The town was also the site of a major prison camp during World War II.
Geography
Jacksboro is located at the intersection of U.S. Route 281 and State Highway 199, about 70 miles northwest of Fort Worth. The city is situated in the rolling hills of the Eastern Cross Timbers region of North Central Texas.
The city has a total area of 4.2 square miles, all of which is land. The elevation is 890 feet above sea level.
Economy
The economy of Jacksboro is largely based on agriculture and oil production. The town is home to several large ranches and farms, as well as several oil and gas production companies.
The town is also home to several manufacturing companies, including a plastics plant and a metal fabrication plant.
Demographics
As of the 2010 census, there were 4,511 people, 1,845 households, and 1,179 families residing in the city. The population density was 1,077.3 people per square mile. The racial makeup of the city was 81.3% White, 11.2% African American, 0.7% Native American, 0.4% Asian, 0.1% Pacific Islander, 4.7% from other races, and 1.8% from two or more races. Hispanic or Latino of any race were 11.2% of the population.
The median income for a household in the city was $31,250, and the median income for a family was $37,500. Males had a median income of $30,000 versus $20,000 for females. The per capita income for the city was $15,945. About 14.2% of families and 17.2% of the population were below the poverty line, including 22.2% of those under age 18 and 14.3% of those age 65 or over.
Common Questions
What is Per Capita Income in Jacksboro?
Per Capita income in Jacksboro is $22,547.
What is the Median Family Income in Jacksboro?
Median Family Income in Jacksboro is $60,781.
What is the Median Household income in Jacksboro?
Median Household Income in Jacksboro is $38,774.
What is Income or Wage Gap in Jacksboro?
Income or Wage Gap in Jacksboro is 31.7%.
Women in Jacksboro earn 68.3 cents for every dollar earned by a man.
What is Inequality or Gini Index in Jacksboro?
Inequality or Gini Index in Jacksboro is 0.53.
What is the Total Population of Jacksboro?
Total Population of Jacksboro is 4,213.
What is the Total Male Population of Jacksboro?
Total Male Population of Jacksboro is 2,489.
What is the Total Female Population of Jacksboro?
Total Female Population of Jacksboro is 1,724.
What is the Ratio of Males per 100 Females in Jacksboro?
There are 144.37 Males per 100 Females in Jacksboro.
What is the Ratio of Females per 100 Males in Jacksboro?
There are 69.26 Females per 100 Males in Jacksboro.
What is the Median Population Age in Jacksboro?
Median Population Age in Jacksboro is 35.7 Years.
What is the Average Family Size in Jacksboro
Average Family Size in Jacksboro is 3.2 People.
What is the Average Household Size in Jacksboro
Average Household Size in Jacksboro is 2.4 People.
How Large is the Labor Force in Jacksboro?
There are 1,365 People in the Labor Forcein in Jacksboro.
What is the Percentage of People in the Labor Force in Jacksboro?
40.7% of People are in the Labor Force in Jacksboro.
What is the Unemployment Rate in Jacksboro?
Unemployment Rate in Jacksboro is 10.2%.