Cities with the Highest Percentage of Immigrants from Southern Europe in Texas
RELATED REPORTS & OPTIONS
Southern Europe
Texas
Compare Cities
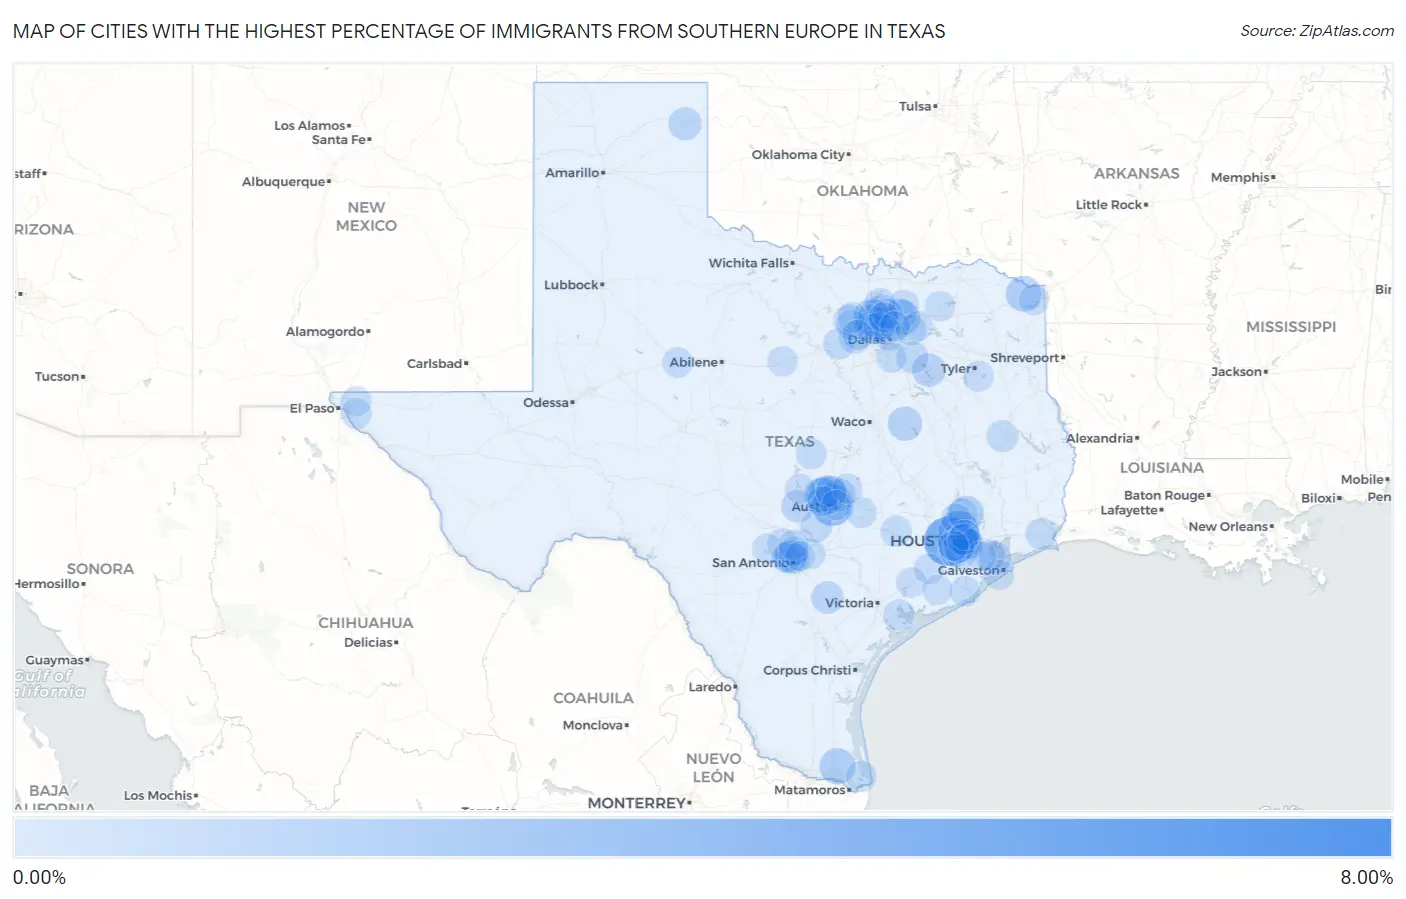
Map of Cities with the Highest Percentage of Immigrants from Southern Europe in Texas
0.00%
8.00%
Cities with the Highest Percentage of Immigrants from Southern Europe in Texas
| City | Southern Europe | vs State | vs National | |
| 1. | South Frydek | 6.05% | 0.078%(+5.97)#1 | 0.22%(+5.83)#58 |
| 2. | Cinco Ranch | 3.79% | 0.078%(+3.71)#2 | 0.22%(+3.57)#100 |
| 3. | West Lake Hills | 2.29% | 0.078%(+2.21)#3 | 0.22%(+2.07)#239 |
| 4. | Jersey Village | 2.18% | 0.078%(+2.10)#4 | 0.22%(+1.96)#255 |
| 5. | Volente | 1.80% | 0.078%(+1.72)#5 | 0.22%(+1.58)#337 |
| 6. | Copper Canyon | 1.60% | 0.078%(+1.52)#6 | 0.22%(+1.38)#397 |
| 7. | Hedwig Village | 1.51% | 0.078%(+1.43)#7 | 0.22%(+1.29)#432 |
| 8. | Combes | 1.24% | 0.078%(+1.16)#8 | 0.22%(+1.02)#570 |
| 9. | New Boston | 1.19% | 0.078%(+1.11)#9 | 0.22%(+0.969)#604 |
| 10. | Oak Ridge North | 1.15% | 0.078%(+1.08)#10 | 0.22%(+0.934)#635 |
| 11. | Lucas | 1.07% | 0.078%(+0.993)#11 | 0.22%(+0.851)#712 |
| 12. | Lago Vista | 0.94% | 0.078%(+0.866)#12 | 0.22%(+0.724)#838 |
| 13. | Groesbeck | 0.93% | 0.078%(+0.850)#13 | 0.22%(+0.709)#853 |
| 14. | Garner | 0.80% | 0.078%(+0.726)#14 | 0.22%(+0.584)#995 |
| 15. | Hunters Creek Village | 0.80% | 0.078%(+0.720)#15 | 0.22%(+0.578)#1,006 |
| 16. | Southside Place | 0.78% | 0.078%(+0.703)#16 | 0.22%(+0.562)#1,033 |
| 17. | Gun Barrel City | 0.77% | 0.078%(+0.690)#17 | 0.22%(+0.548)#1,052 |
| 18. | Canadian | 0.73% | 0.078%(+0.651)#18 | 0.22%(+0.510)#1,116 |
| 19. | Wells Branch | 0.71% | 0.078%(+0.632)#19 | 0.22%(+0.490)#1,160 |
| 20. | Little Elm | 0.63% | 0.078%(+0.550)#20 | 0.22%(+0.408)#1,352 |
| 21. | Fairview | 0.62% | 0.078%(+0.540)#21 | 0.22%(+0.398)#1,378 |
| 22. | Hebron | 0.59% | 0.078%(+0.508)#22 | 0.22%(+0.366)#1,445 |
| 23. | Balcones Heights | 0.59% | 0.078%(+0.508)#23 | 0.22%(+0.366)#1,446 |
| 24. | San Leon | 0.58% | 0.078%(+0.500)#24 | 0.22%(+0.358)#1,462 |
| 25. | Karnes City | 0.58% | 0.078%(+0.500)#25 | 0.22%(+0.358)#1,463 |
| 26. | Johnson City | 0.57% | 0.078%(+0.492)#26 | 0.22%(+0.350)#1,479 |
| 27. | Scurry | 0.49% | 0.078%(+0.409)#27 | 0.22%(+0.267)#1,717 |
| 28. | Sansom Park | 0.46% | 0.078%(+0.386)#28 | 0.22%(+0.244)#1,791 |
| 29. | Wimberley | 0.45% | 0.078%(+0.377)#29 | 0.22%(+0.235)#1,819 |
| 30. | Hudson | 0.44% | 0.078%(+0.366)#30 | 0.22%(+0.224)#1,865 |
| 31. | Castle Hills | 0.40% | 0.078%(+0.324)#31 | 0.22%(+0.182)#2,007 |
| 32. | Sugar Land | 0.38% | 0.078%(+0.301)#32 | 0.22%(+0.160)#2,103 |
| 33. | Jonestown | 0.38% | 0.078%(+0.297)#33 | 0.22%(+0.156)#2,122 |
| 34. | Southlake | 0.37% | 0.078%(+0.292)#34 | 0.22%(+0.150)#2,146 |
| 35. | Cedar Park | 0.36% | 0.078%(+0.285)#35 | 0.22%(+0.143)#2,172 |
| 36. | University Park | 0.36% | 0.078%(+0.283)#36 | 0.22%(+0.141)#2,182 |
| 37. | Taylor Landing | 0.36% | 0.078%(+0.278)#37 | 0.22%(+0.136)#2,211 |
| 38. | Annetta North | 0.35% | 0.078%(+0.275)#38 | 0.22%(+0.133)#2,229 |
| 39. | Fayetteville | 0.35% | 0.078%(+0.269)#39 | 0.22%(+0.127)#2,264 |
| 40. | Port Lavaca | 0.35% | 0.078%(+0.268)#40 | 0.22%(+0.126)#2,266 |
| 41. | Stockton Bend | 0.34% | 0.078%(+0.260)#41 | 0.22%(+0.118)#2,300 |
| 42. | Aubrey | 0.34% | 0.078%(+0.259)#42 | 0.22%(+0.117)#2,308 |
| 43. | Camp Swift | 0.33% | 0.078%(+0.255)#43 | 0.22%(+0.113)#2,329 |
| 44. | Double Oak | 0.33% | 0.078%(+0.251)#44 | 0.22%(+0.109)#2,352 |
| 45. | Aurora | 0.32% | 0.078%(+0.244)#45 | 0.22%(+0.102)#2,389 |
| 46. | Cibolo | 0.31% | 0.078%(+0.234)#46 | 0.22%(+0.092)#2,431 |
| 47. | Horizon City | 0.30% | 0.078%(+0.223)#47 | 0.22%(+0.082)#2,495 |
| 48. | Mission Bend | 0.30% | 0.078%(+0.220)#48 | 0.22%(+0.078)#2,506 |
| 49. | The Woodlands | 0.29% | 0.078%(+0.210)#49 | 0.22%(+0.068)#2,558 |
| 50. | Lampasas | 0.28% | 0.078%(+0.206)#50 | 0.22%(+0.065)#2,580 |
| 51. | Spring Valley Village | 0.28% | 0.078%(+0.206)#51 | 0.22%(+0.064)#2,584 |
| 52. | Scenic Oaks | 0.28% | 0.078%(+0.200)#52 | 0.22%(+0.058)#2,620 |
| 53. | Roscoe | 0.27% | 0.078%(+0.195)#53 | 0.22%(+0.053)#2,651 |
| 54. | Belterra | 0.27% | 0.078%(+0.191)#54 | 0.22%(+0.049)#2,686 |
| 55. | Grapevine | 0.26% | 0.078%(+0.186)#55 | 0.22%(+0.044)#2,722 |
| 56. | Olmos Park | 0.26% | 0.078%(+0.184)#56 | 0.22%(+0.042)#2,730 |
| 57. | Corinth | 0.26% | 0.078%(+0.184)#57 | 0.22%(+0.042)#2,734 |
| 58. | Missouri City | 0.26% | 0.078%(+0.181)#58 | 0.22%(+0.039)#2,761 |
| 59. | Farmers Branch | 0.26% | 0.078%(+0.180)#59 | 0.22%(+0.038)#2,768 |
| 60. | Jones Creek | 0.26% | 0.078%(+0.180)#60 | 0.22%(+0.038)#2,769 |
| 61. | Laguna Vista | 0.25% | 0.078%(+0.175)#61 | 0.22%(+0.033)#2,802 |
| 62. | Pecan Acres | 0.25% | 0.078%(+0.173)#62 | 0.22%(+0.031)#2,820 |
| 63. | Melissa | 0.25% | 0.078%(+0.171)#63 | 0.22%(+0.029)#2,830 |
| 64. | West University Place | 0.25% | 0.078%(+0.169)#64 | 0.22%(+0.027)#2,840 |
| 65. | Whitehouse | 0.25% | 0.078%(+0.168)#65 | 0.22%(+0.027)#2,845 |
| 66. | New Fairview | 0.24% | 0.078%(+0.166)#66 | 0.22%(+0.024)#2,859 |
| 67. | Clear Lake Shores | 0.24% | 0.078%(+0.165)#67 | 0.22%(+0.023)#2,864 |
| 68. | Sienna | 0.24% | 0.078%(+0.164)#68 | 0.22%(+0.022)#2,869 |
| 69. | Galveston | 0.24% | 0.078%(+0.158)#69 | 0.22%(+0.017)#2,908 |
| 70. | Lakehills | 0.24% | 0.078%(+0.157)#70 | 0.22%(+0.015)#2,919 |
| 71. | Meadows Place | 0.23% | 0.078%(+0.155)#71 | 0.22%(+0.013)#2,930 |
| 72. | Coppell | 0.23% | 0.078%(+0.155)#72 | 0.22%(+0.013)#2,933 |
| 73. | Saginaw | 0.23% | 0.078%(+0.150)#73 | 0.22%(+0.008)#2,971 |
| 74. | Rockwall | 0.23% | 0.078%(+0.149)#74 | 0.22%(+0.008)#2,974 |
| 75. | Piney Point Village | 0.22% | 0.078%(+0.146)#75 | 0.22%(+0.005)#2,997 |
| 76. | Homestead Meadows North | 0.22% | 0.078%(+0.145)#76 | 0.22%(+0.004)#3,005 |
| 77. | Commerce | 0.22% | 0.078%(+0.142)#77 | 0.22%(+0.000)#3,018 |
| 78. | Tomball | 0.21% | 0.078%(+0.135)#78 | 0.22%(-0.006)#3,070 |
| 79. | Lakeside Town Tarrant County | 0.21% | 0.078%(+0.132)#79 | 0.22%(-0.009)#3,090 |
| 80. | Leon Valley | 0.21% | 0.078%(+0.131)#80 | 0.22%(-0.011)#3,114 |
| 81. | Louise | 0.21% | 0.078%(+0.130)#81 | 0.22%(-0.012)#3,123 |
| 82. | Wharton | 0.21% | 0.078%(+0.129)#82 | 0.22%(-0.012)#3,124 |
| 83. | Redwater | 0.20% | 0.078%(+0.124)#83 | 0.22%(-0.018)#3,175 |
| 84. | The Hills | 0.20% | 0.078%(+0.121)#84 | 0.22%(-0.020)#3,193 |
| 85. | Ranger | 0.20% | 0.078%(+0.120)#85 | 0.22%(-0.022)#3,209 |
| 86. | Horseshoe Bay | 0.20% | 0.078%(+0.117)#86 | 0.22%(-0.024)#3,233 |
| 87. | Hutto | 0.19% | 0.078%(+0.112)#87 | 0.22%(-0.030)#3,285 |
| 88. | Royse City | 0.19% | 0.078%(+0.108)#88 | 0.22%(-0.034)#3,318 |
| 89. | Red Oak | 0.18% | 0.078%(+0.103)#89 | 0.22%(-0.038)#3,356 |
| 90. | Frisco | 0.18% | 0.078%(+0.101)#90 | 0.22%(-0.040)#3,383 |
| 91. | Timberwood Park | 0.18% | 0.078%(+0.100)#91 | 0.22%(-0.042)#3,394 |
| 92. | Friendswood | 0.18% | 0.078%(+0.098)#92 | 0.22%(-0.044)#3,412 |
| 93. | The Colony | 0.17% | 0.078%(+0.095)#93 | 0.22%(-0.046)#3,429 |
| 94. | Richardson | 0.17% | 0.078%(+0.094)#94 | 0.22%(-0.048)#3,441 |
| 95. | Austin | 0.17% | 0.078%(+0.089)#95 | 0.22%(-0.053)#3,491 |
| 96. | Houston | 0.16% | 0.078%(+0.085)#96 | 0.22%(-0.057)#3,521 |
| 97. | Bay City | 0.16% | 0.078%(+0.084)#97 | 0.22%(-0.058)#3,527 |
| 98. | Hollywood Park | 0.16% | 0.078%(+0.082)#98 | 0.22%(-0.060)#3,548 |
| 99. | Four Corners | 0.16% | 0.078%(+0.078)#99 | 0.22%(-0.064)#3,577 |
| 100. | Windcrest | 0.15% | 0.078%(+0.076)#100 | 0.22%(-0.066)#3,595 |
Common Questions
What are the Top 10 Cities with the Highest Percentage of Immigrants from Southern Europe in Texas?
Top 10 Cities with the Highest Percentage of Immigrants from Southern Europe in Texas are:
#1
3.79%
#2
2.29%
#3
2.18%
#4
1.80%
#5
1.60%
#6
1.51%
#7
1.24%
#8
1.19%
#9
1.15%
#10
1.07%
What city has the Highest Percentage of Immigrants from Southern Europe in Texas?
Cinco Ranch has the Highest Percentage of Immigrants from Southern Europe in Texas with 3.79%.
What is the Percentage of Immigrants from Southern Europe in the State of Texas?
Percentage of Immigrants from Southern Europe in Texas is 0.078%.
What is the Percentage of Immigrants from Southern Europe in the United States?
Percentage of Immigrants from Southern Europe in the United States is 0.22%.