Haslet, TX Map & Demographics
Haslet Map
Haslet Overview
$71,200
PER CAPITA INCOME
$166,534
AVG FAMILY INCOME
$160,481
AVG HOUSEHOLD INCOME
26.6%
WAGE / INCOME GAP [ % ]
73.4¢/ $1
WAGE / INCOME GAP [ $ ]
0.38
INEQUALITY / GINI INDEX
2,336
TOTAL POPULATION
1,199
MALE POPULATION
1,137
FEMALE POPULATION
105.45
MALES / 100 FEMALES
94.83
FEMALES / 100 MALES
48.6
MEDIAN AGE
3.1
AVG FAMILY SIZE
2.8
AVG HOUSEHOLD SIZE
1,340
LABOR FORCE [ PEOPLE ]
68.0%
PERCENT IN LABOR FORCE
0.4%
UNEMPLOYMENT RATE
Haslet Zip Codes
Haslet Area Codes
Income in Haslet
Income Overview in Haslet
Per Capita Income in Haslet is $71,200, while median incomes of families and households are $166,534 and $160,481 respectively.
| Characteristic | Number | Measure |
| Per Capita Income | 2,336 | $71,200 |
| Median Family Income | 686 | $166,534 |
| Mean Family Income | 686 | $216,296 |
| Median Household Income | 829 | $160,481 |
| Mean Household Income | 829 | $200,076 |
| Income Deficit | 686 | $0 |
| Wage / Income Gap (%) | 2,336 | 26.65% |
| Wage / Income Gap ($) | 2,336 | 73.35¢ per $1 |
| Gini / Inequality Index | 2,336 | 0.38 |
Earnings by Sex in Haslet
Average Earnings in Haslet are $82,333, $89,609 for men and $65,729 for women, a difference of 26.7%.
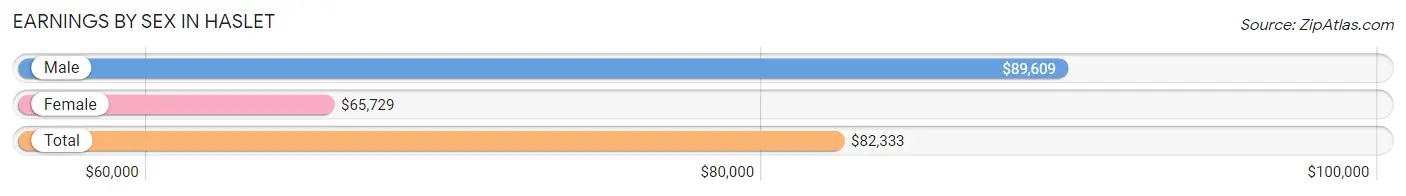
| Sex | Number | Average Earnings |
| Male | 815 (57.1%) | $89,609 |
| Female | 613 (42.9%) | $65,729 |
| Total | 1,428 (100.0%) | $82,333 |
Earnings by Sex by Income Bracket in Haslet
The most common earnings brackets in Haslet are $100,000+ for men (351 | 43.1%) and $100,000+ for women (218 | 35.6%).
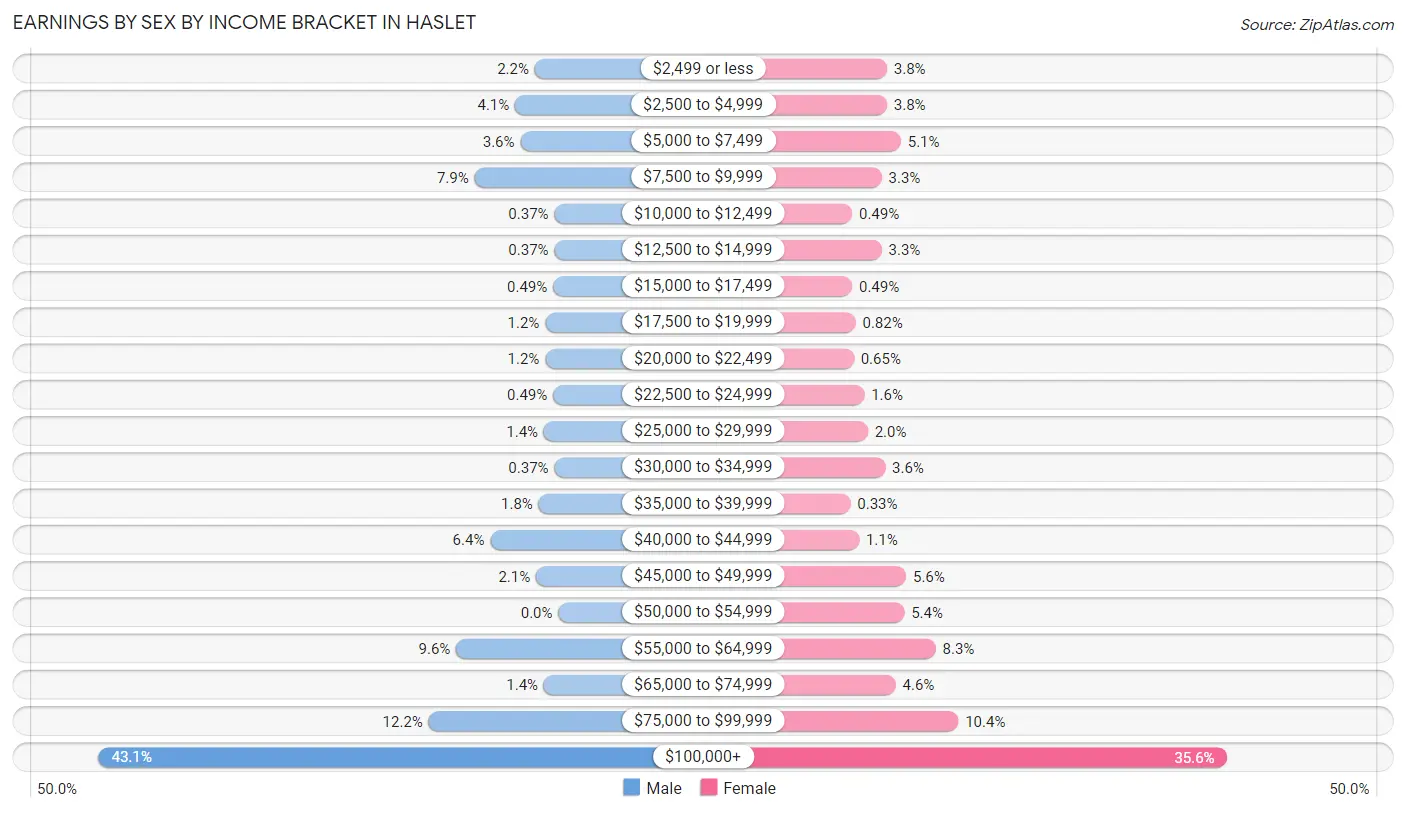
| Income | Male | Female |
| $2,499 or less | 18 (2.2%) | 23 (3.7%) |
| $2,500 to $4,999 | 33 (4.1%) | 23 (3.7%) |
| $5,000 to $7,499 | 29 (3.6%) | 31 (5.1%) |
| $7,500 to $9,999 | 64 (7.9%) | 20 (3.3%) |
| $10,000 to $12,499 | 3 (0.4%) | 3 (0.5%) |
| $12,500 to $14,999 | 3 (0.4%) | 20 (3.3%) |
| $15,000 to $17,499 | 4 (0.5%) | 3 (0.5%) |
| $17,500 to $19,999 | 10 (1.2%) | 5 (0.8%) |
| $20,000 to $22,499 | 10 (1.2%) | 4 (0.6%) |
| $22,500 to $24,999 | 4 (0.5%) | 10 (1.6%) |
| $25,000 to $29,999 | 11 (1.3%) | 12 (2.0%) |
| $30,000 to $34,999 | 3 (0.4%) | 22 (3.6%) |
| $35,000 to $39,999 | 15 (1.8%) | 2 (0.3%) |
| $40,000 to $44,999 | 52 (6.4%) | 7 (1.1%) |
| $45,000 to $49,999 | 17 (2.1%) | 34 (5.6%) |
| $50,000 to $54,999 | 0 (0.0%) | 33 (5.4%) |
| $55,000 to $64,999 | 78 (9.6%) | 51 (8.3%) |
| $65,000 to $74,999 | 11 (1.3%) | 28 (4.6%) |
| $75,000 to $99,999 | 99 (12.1%) | 64 (10.4%) |
| $100,000+ | 351 (43.1%) | 218 (35.6%) |
| Total | 815 (100.0%) | 613 (100.0%) |
Earnings by Sex by Educational Attainment in Haslet
Average earnings in Haslet are $93,056 for men and $83,125 for women, a difference of 10.7%. Men with an educational attainment of bachelor's degree enjoy the highest average annual earnings of $141,875, while those with high school diploma education earn the least with $56,163. Women with an educational attainment of graduate degree earn the most with the average annual earnings of $104,185, while those with high school diploma education have the smallest earnings of $53,750.
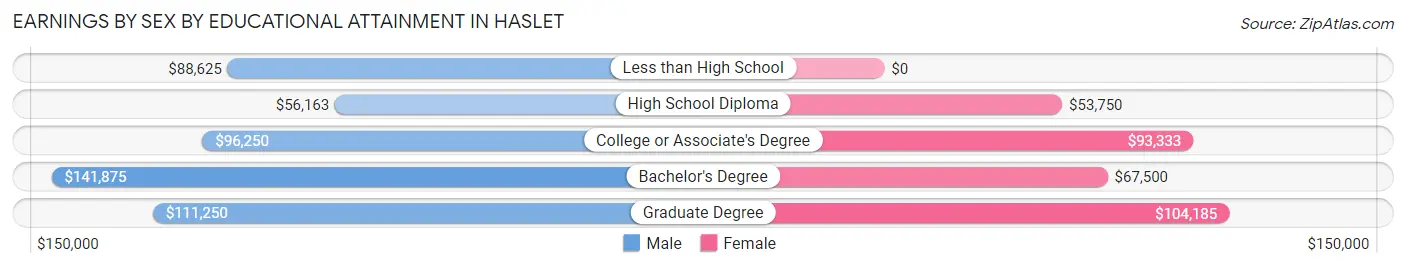
| Educational Attainment | Male Income | Female Income |
| Less than High School | $88,625 | $0 |
| High School Diploma | $56,163 | $53,750 |
| College or Associate's Degree | $96,250 | $93,333 |
| Bachelor's Degree | $141,875 | $67,500 |
| Graduate Degree | $111,250 | $104,185 |
| Total | $93,056 | $83,125 |
Family Income in Haslet
Family Income Brackets in Haslet
According to the Haslet family income data, there are 279 families falling into the $200,000+ income range, which is the most common income bracket and makes up 40.7% of all families.
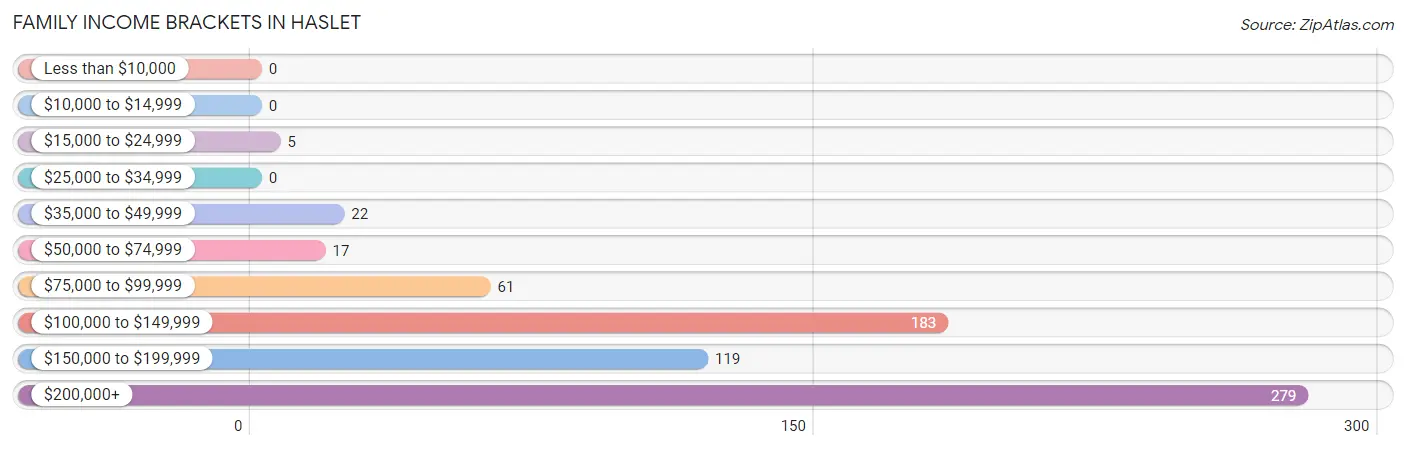
| Income Bracket | # Families | % Families |
| Less than $10,000 | 0 | 0.0% |
| $10,000 to $14,999 | 0 | 0.0% |
| $15,000 to $24,999 | 5 | 0.7% |
| $25,000 to $34,999 | 0 | 0.0% |
| $35,000 to $49,999 | 22 | 3.2% |
| $50,000 to $74,999 | 17 | 2.5% |
| $75,000 to $99,999 | 61 | 8.9% |
| $100,000 to $149,999 | 183 | 26.7% |
| $150,000 to $199,999 | 119 | 17.3% |
| $200,000+ | 279 | 40.7% |
Family Income by Famaliy Size in Haslet
5-person families (105 | 15.3%) account for the highest median family income in Haslet with $250,001 per family, while 2-person families (299 | 43.6%) have the highest median income of $67,764 per family member.
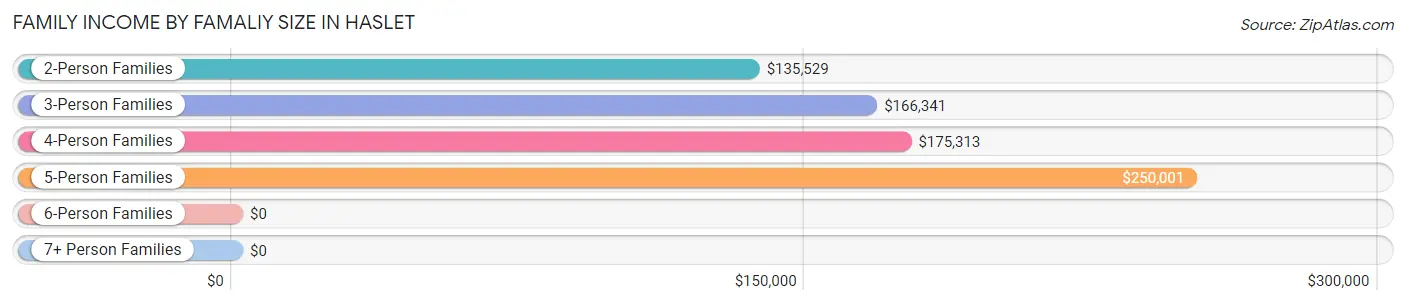
| Income Bracket | # Families | Median Income |
| 2-Person Families | 299 (43.6%) | $135,529 |
| 3-Person Families | 170 (24.8%) | $166,341 |
| 4-Person Families | 109 (15.9%) | $175,313 |
| 5-Person Families | 105 (15.3%) | $250,001 |
| 6-Person Families | 3 (0.4%) | $0 |
| 7+ Person Families | 0 (0.0%) | $0 |
| Total | 686 (100.0%) | $166,534 |
Family Income by Number of Earners in Haslet
The median family income in Haslet is $166,534, with families comprising 3+ earners (135) having the highest median family income of $250,001, while families with no earners (77) have the lowest median family income of $88,542, accounting for 19.7% and 11.2% of families, respectively.
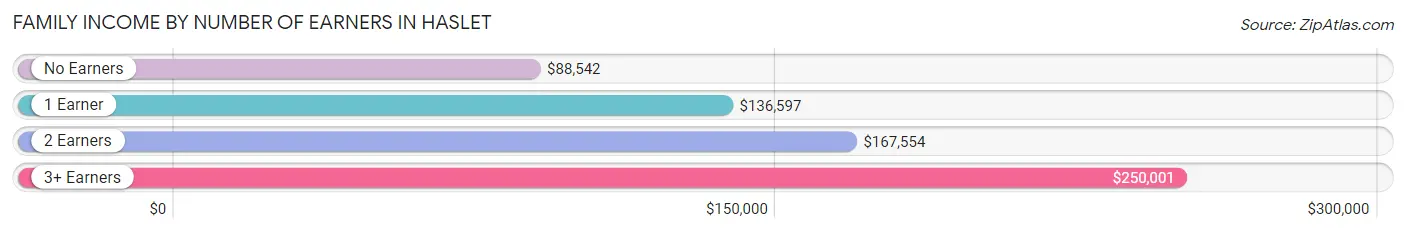
| Number of Earners | # Families | Median Income |
| No Earners | 77 (11.2%) | $88,542 |
| 1 Earner | 145 (21.1%) | $136,597 |
| 2 Earners | 329 (48.0%) | $167,554 |
| 3+ Earners | 135 (19.7%) | $250,001 |
| Total | 686 (100.0%) | $166,534 |
Household Income in Haslet
Household Income Brackets in Haslet
With 300 households falling in the category, the $200,000+ income range is the most frequent in Haslet, accounting for 36.2% of all households.
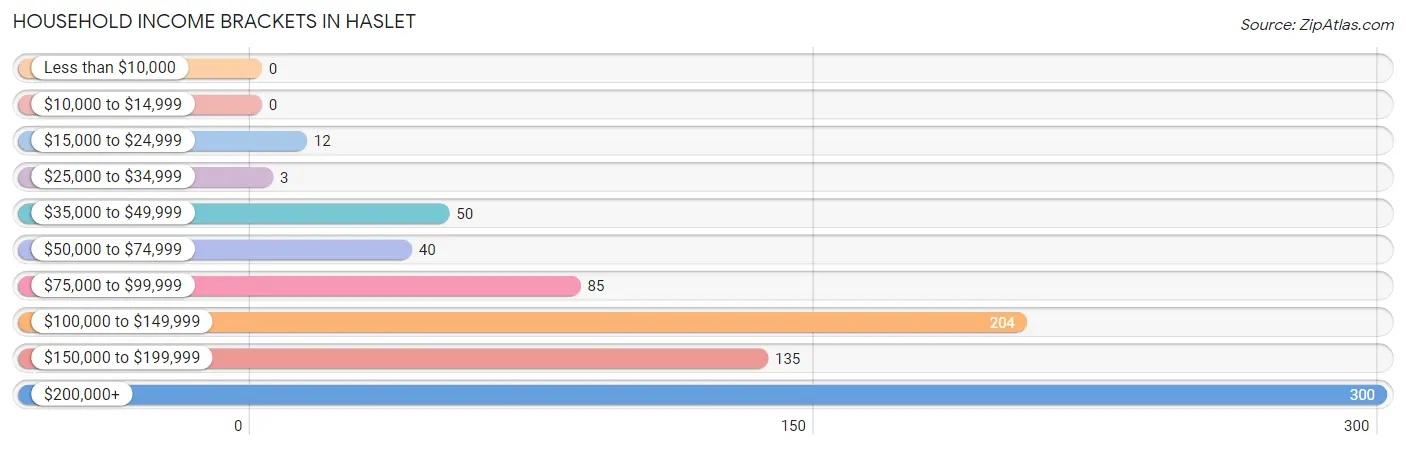
| Income Bracket | # Households | % Households |
| Less than $10,000 | 0 | 0.0% |
| $10,000 to $14,999 | 0 | 0.0% |
| $15,000 to $24,999 | 12 | 1.4% |
| $25,000 to $34,999 | 3 | 0.4% |
| $35,000 to $49,999 | 50 | 6.0% |
| $50,000 to $74,999 | 40 | 4.8% |
| $75,000 to $99,999 | 85 | 10.3% |
| $100,000 to $149,999 | 204 | 24.6% |
| $150,000 to $199,999 | 135 | 16.3% |
| $200,000+ | 300 | 36.2% |
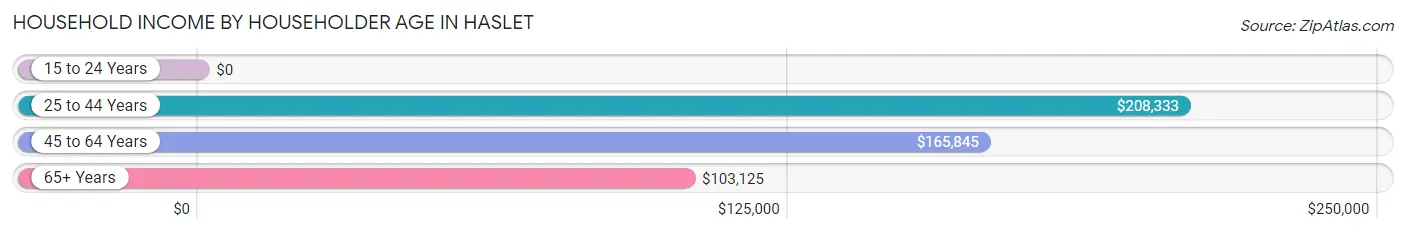
Household Income by Householder Age in Haslet
The median household income in Haslet is $160,481, with the highest median household income of $208,333 found in the 25 to 44 years age bracket for the primary householder. A total of 186 households (22.4%) fall into this category.
| Income Bracket | # Households | Median Income |
| 15 to 24 Years | 0 (0.0%) | $0 |
| 25 to 44 Years | 186 (22.4%) | $208,333 |
| 45 to 64 Years | 447 (53.9%) | $165,845 |
| 65+ Years | 196 (23.6%) | $103,125 |
| Total | 829 (100.0%) | $160,481 |
Poverty in Haslet
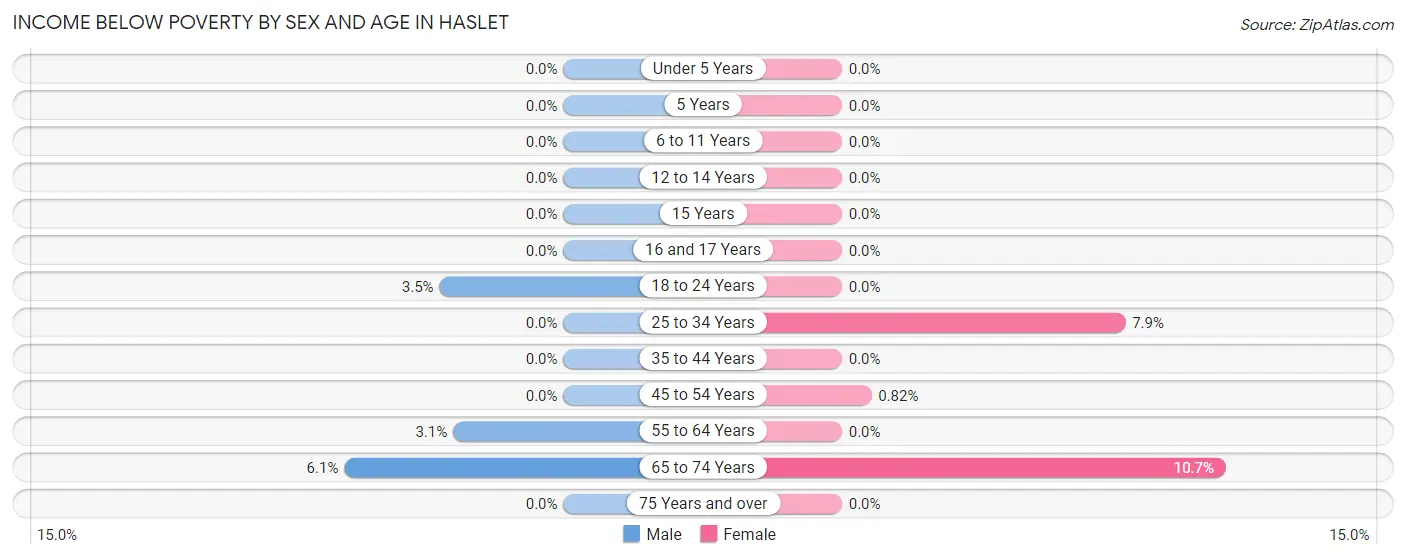
Income Below Poverty by Sex and Age in Haslet
With 1.7% poverty level for males and 1.7% for females among the residents of Haslet, 65 to 74 year old males and 65 to 74 year old females are the most vulnerable to poverty, with 10 males (6.1%) and 14 females (10.7%) in their respective age groups living below the poverty level.
| Age Bracket | Male | Female |
| Under 5 Years | 0 (0.0%) | 0 (0.0%) |
| 5 Years | 0 (0.0%) | 0 (0.0%) |
| 6 to 11 Years | 0 (0.0%) | 0 (0.0%) |
| 12 to 14 Years | 0 (0.0%) | 0 (0.0%) |
| 15 Years | 0 (0.0%) | 0 (0.0%) |
| 16 and 17 Years | 0 (0.0%) | 0 (0.0%) |
| 18 to 24 Years | 3 (3.5%) | 0 (0.0%) |
| 25 to 34 Years | 0 (0.0%) | 3 (7.9%) |
| 35 to 44 Years | 0 (0.0%) | 0 (0.0%) |
| 45 to 54 Years | 0 (0.0%) | 2 (0.8%) |
| 55 to 64 Years | 7 (3.1%) | 0 (0.0%) |
| 65 to 74 Years | 10 (6.1%) | 14 (10.7%) |
| 75 Years and over | 0 (0.0%) | 0 (0.0%) |
| Total | 20 (1.7%) | 19 (1.7%) |
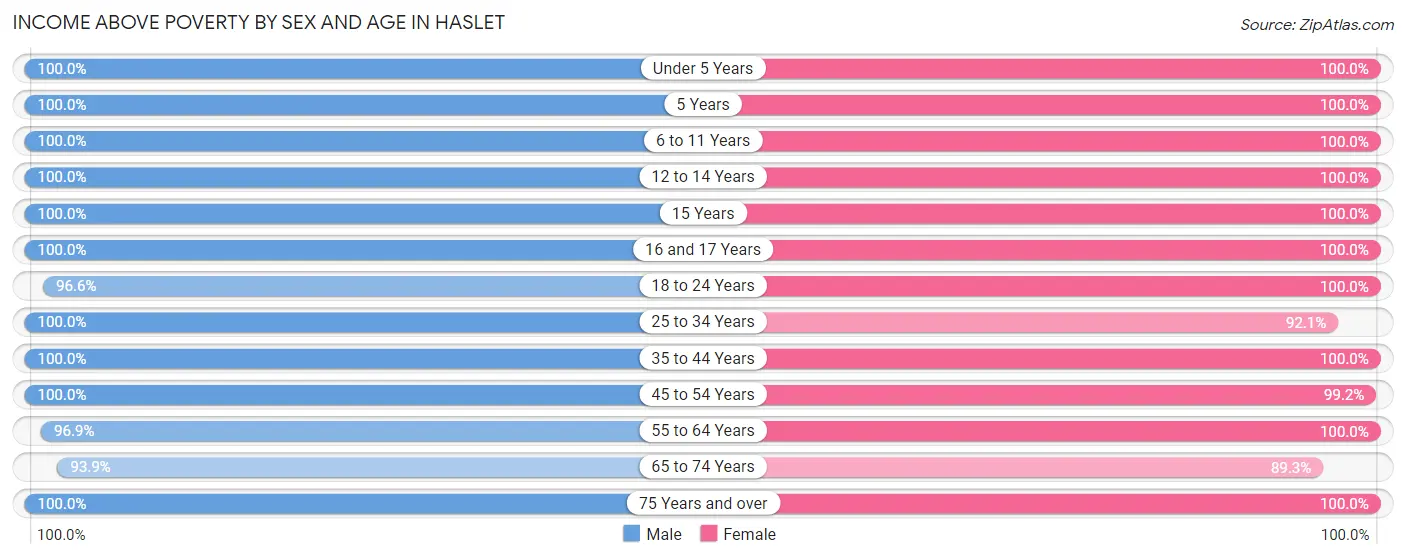
Income Above Poverty by Sex and Age in Haslet
According to the poverty statistics in Haslet, males aged under 5 years and females aged under 5 years are the age groups that are most secure financially, with 100.0% of males and 100.0% of females in these age groups living above the poverty line.
| Age Bracket | Male | Female |
| Under 5 Years | 25 (100.0%) | 47 (100.0%) |
| 5 Years | 8 (100.0%) | 15 (100.0%) |
| 6 to 11 Years | 99 (100.0%) | 54 (100.0%) |
| 12 to 14 Years | 20 (100.0%) | 66 (100.0%) |
| 15 Years | 25 (100.0%) | 7 (100.0%) |
| 16 and 17 Years | 70 (100.0%) | 49 (100.0%) |
| 18 to 24 Years | 84 (96.6%) | 56 (100.0%) |
| 25 to 34 Years | 119 (100.0%) | 35 (92.1%) |
| 35 to 44 Years | 116 (100.0%) | 135 (100.0%) |
| 45 to 54 Years | 176 (100.0%) | 241 (99.2%) |
| 55 to 64 Years | 221 (96.9%) | 222 (100.0%) |
| 65 to 74 Years | 154 (93.9%) | 117 (89.3%) |
| 75 Years and over | 62 (100.0%) | 74 (100.0%) |
| Total | 1,179 (98.3%) | 1,118 (98.3%) |
Income Below Poverty Among Married-Couple Families in Haslet
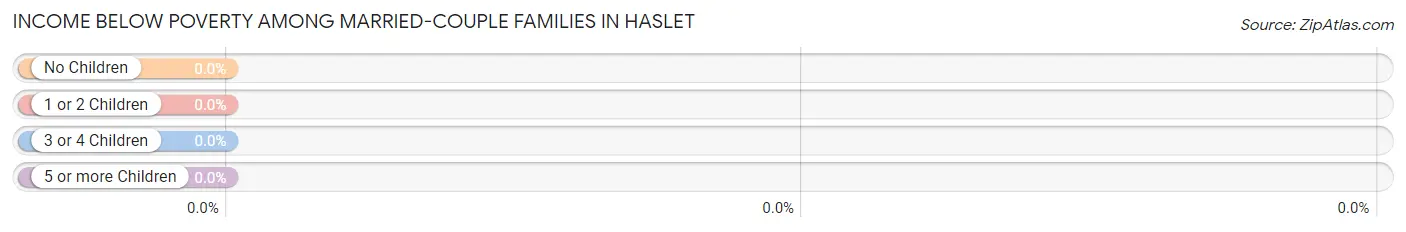
| Children | Above Poverty | Below Poverty |
| No Children | 389 (100.0%) | 0 (0.0%) |
| 1 or 2 Children | 197 (100.0%) | 0 (0.0%) |
| 3 or 4 Children | 45 (100.0%) | 0 (0.0%) |
| 5 or more Children | 0 (0.0%) | 0 (0.0%) |
| Total | 631 (100.0%) | 0 (0.0%) |
Income Below Poverty Among Single-Parent Households in Haslet
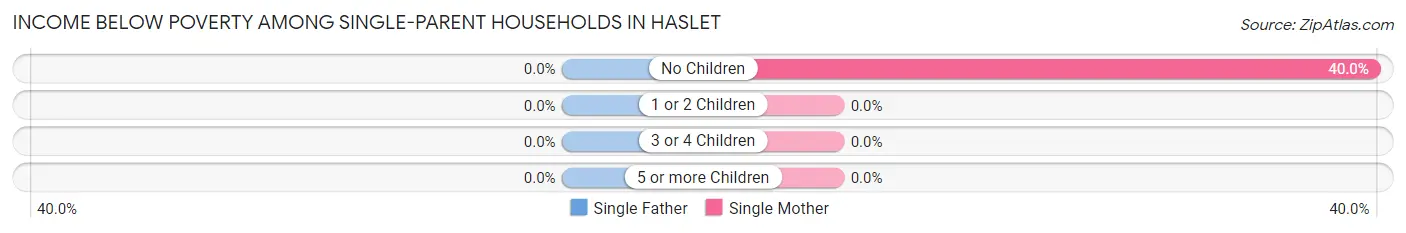
| Children | Single Father | Single Mother |
| No Children | 0 (0.0%) | 2 (40.0%) |
| 1 or 2 Children | 0 (0.0%) | 0 (0.0%) |
| 3 or 4 Children | 0 (0.0%) | 0 (0.0%) |
| 5 or more Children | 0 (0.0%) | 0 (0.0%) |
| Total | 0 (0.0%) | 2 (6.5%) |
Income Below Poverty Among Married-Couple vs Single-Parent Households in Haslet
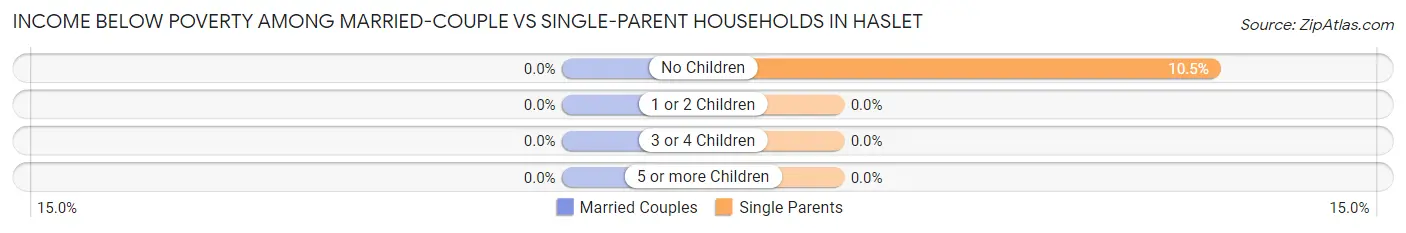
| Children | Married-Couple Families | Single-Parent Households |
| No Children | 0 (0.0%) | 2 (10.5%) |
| 1 or 2 Children | 0 (0.0%) | 0 (0.0%) |
| 3 or 4 Children | 0 (0.0%) | 0 (0.0%) |
| 5 or more Children | 0 (0.0%) | 0 (0.0%) |
| Total | 0 (0.0%) | 2 (3.6%) |
Race in Haslet
The most populous races in Haslet are White / Caucasian (1,947 | 83.4%), Hispanic or Latino (214 | 9.2%), and Two or more Races (161 | 6.9%).
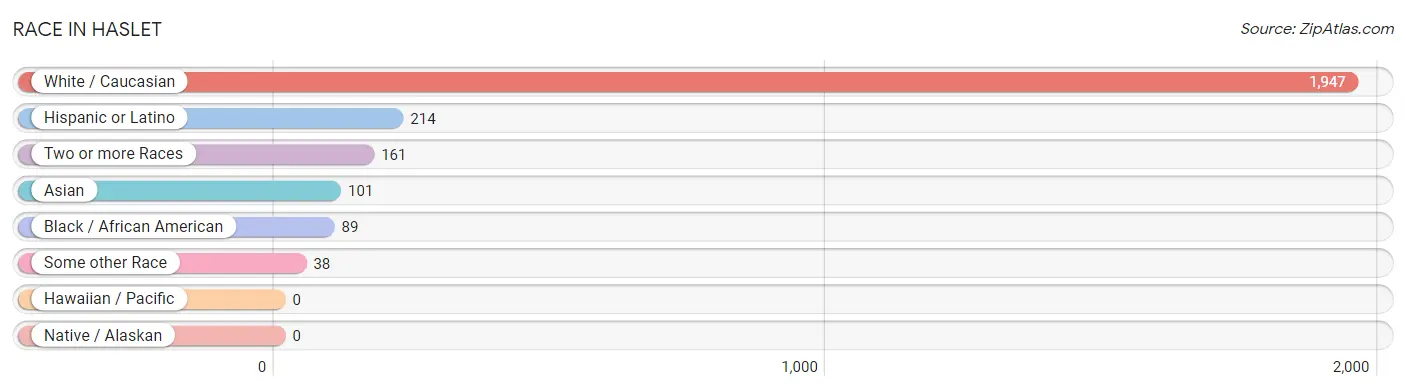
| Race | # Population | % Population |
| Asian | 101 | 4.3% |
| Black / African American | 89 | 3.8% |
| Hawaiian / Pacific | 0 | 0.0% |
| Hispanic or Latino | 214 | 9.2% |
| Native / Alaskan | 0 | 0.0% |
| White / Caucasian | 1,947 | 83.4% |
| Two or more Races | 161 | 6.9% |
| Some other Race | 38 | 1.6% |
| Total | 2,336 | 100.0% |
Ancestry in Haslet
The most populous ancestries reported in Haslet are German (362 | 15.5%), English (278 | 11.9%), American (242 | 10.4%), Mexican (169 | 7.2%), and Irish (168 | 7.2%), together accounting for 52.2% of all Haslet residents.
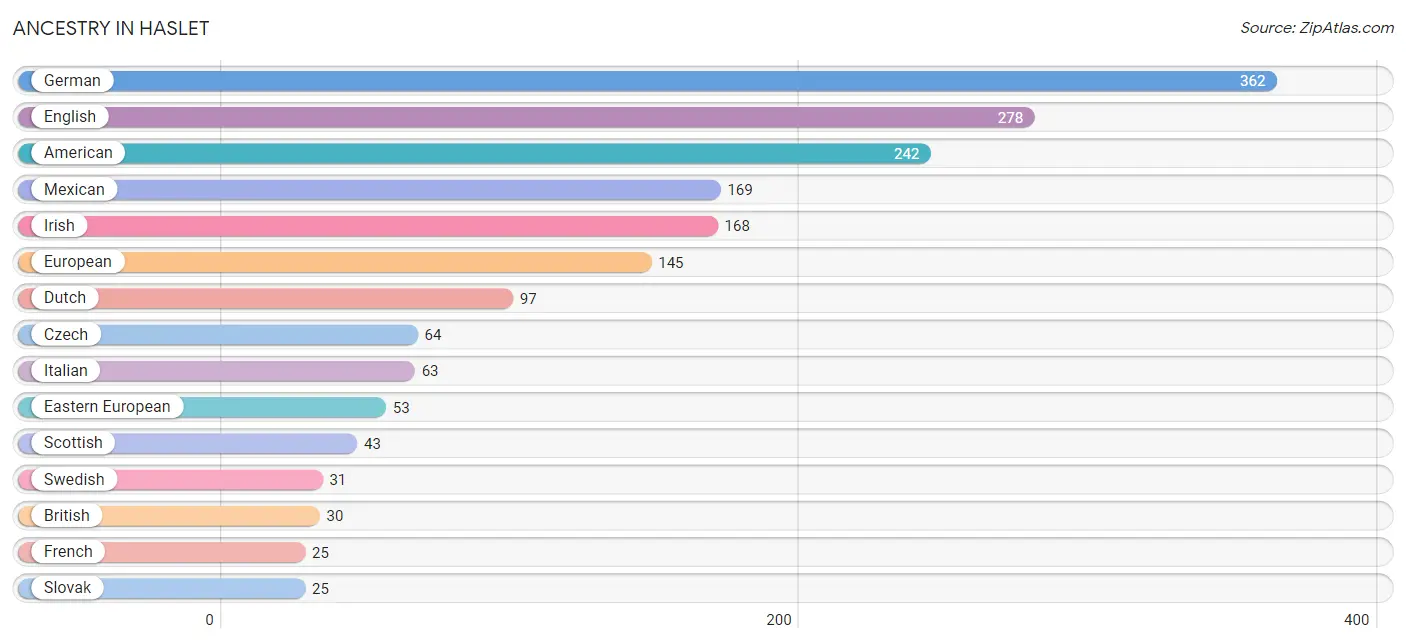
| Ancestry | # Population | % Population |
| American | 242 | 10.4% |
| Arab | 9 | 0.4% |
| Armenian | 3 | 0.1% |
| Belgian | 3 | 0.1% |
| Belizean | 9 | 0.4% |
| British | 30 | 1.3% |
| Burmese | 8 | 0.3% |
| Canadian | 7 | 0.3% |
| Central American | 5 | 0.2% |
| Cherokee | 23 | 1.0% |
| Croatian | 16 | 0.7% |
| Czech | 64 | 2.7% |
| Danish | 19 | 0.8% |
| Dutch | 97 | 4.2% |
| Dutch West Indian | 3 | 0.1% |
| Eastern European | 53 | 2.3% |
| English | 278 | 11.9% |
| European | 145 | 6.2% |
| French | 25 | 1.1% |
| German | 362 | 15.5% |
| Greek | 3 | 0.1% |
| Haitian | 3 | 0.1% |
| Indian (Asian) | 19 | 0.8% |
| Irish | 168 | 7.2% |
| Italian | 63 | 2.7% |
| Korean | 7 | 0.3% |
| Lebanese | 9 | 0.4% |
| Mexican | 169 | 7.2% |
| New Zealander | 4 | 0.2% |
| Northern European | 10 | 0.4% |
| Norwegian | 6 | 0.3% |
| Pakistani | 5 | 0.2% |
| Panamanian | 5 | 0.2% |
| Polish | 16 | 0.7% |
| Portuguese | 3 | 0.1% |
| Puerto Rican | 3 | 0.1% |
| Russian | 13 | 0.6% |
| Scandinavian | 8 | 0.3% |
| Scotch-Irish | 12 | 0.5% |
| Scottish | 43 | 1.8% |
| Slovak | 25 | 1.1% |
| South American | 15 | 0.6% |
| Spaniard | 6 | 0.3% |
| Spanish | 16 | 0.7% |
| Sri Lankan | 4 | 0.2% |
| Swedish | 31 | 1.3% |
| Trinidadian and Tobagonian | 3 | 0.1% |
| Venezuelan | 15 | 0.6% |
| Welsh | 6 | 0.3% | View All 49 Rows |
Immigrants in Haslet
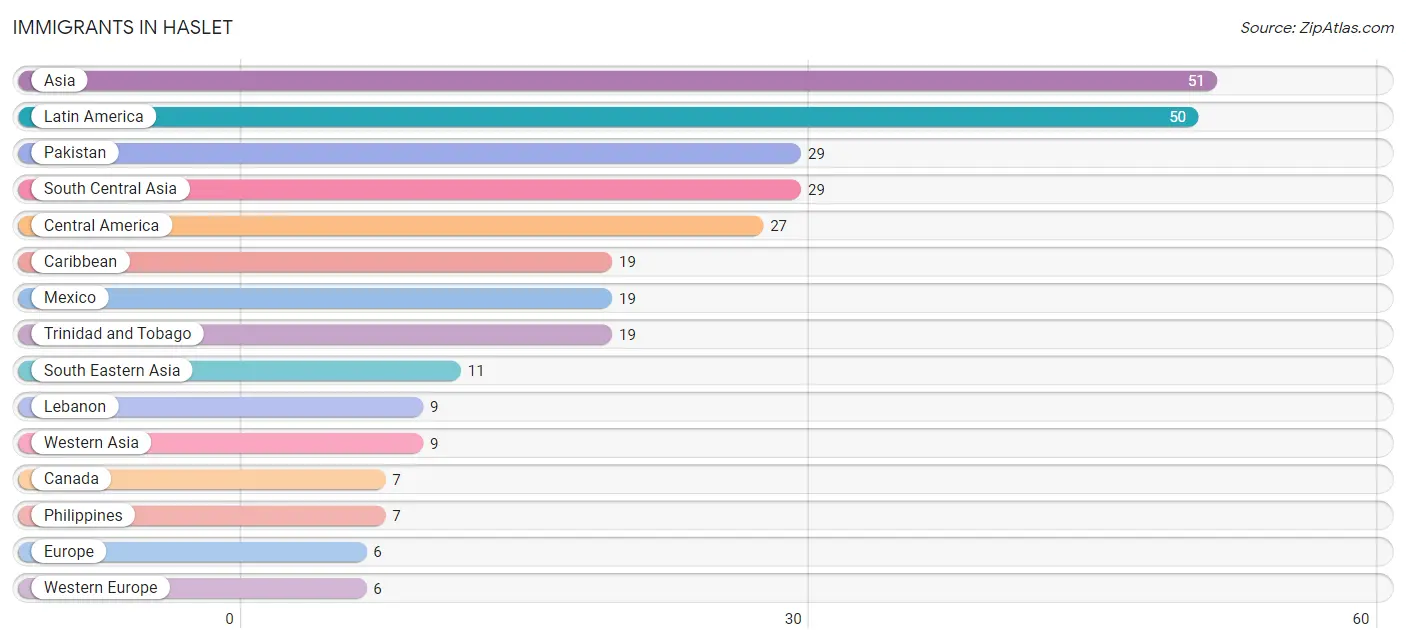
The most numerous immigrant groups reported in Haslet came from Asia (51 | 2.2%), Latin America (50 | 2.1%), Pakistan (29 | 1.2%), South Central Asia (29 | 1.2%), and Central America (27 | 1.2%), together accounting for 8.0% of all Haslet residents.
| Immigration Origin | # Population | % Population |
| Asia | 51 | 2.2% |
| Belgium | 3 | 0.1% |
| Belize | 3 | 0.1% |
| Canada | 7 | 0.3% |
| Caribbean | 19 | 0.8% |
| Central America | 27 | 1.2% |
| China | 2 | 0.1% |
| Eastern Asia | 2 | 0.1% |
| Europe | 6 | 0.3% |
| Latin America | 50 | 2.1% |
| Lebanon | 9 | 0.4% |
| Mexico | 19 | 0.8% |
| Netherlands | 3 | 0.1% |
| Pakistan | 29 | 1.2% |
| Panama | 5 | 0.2% |
| Philippines | 7 | 0.3% |
| South America | 4 | 0.2% |
| South Central Asia | 29 | 1.2% |
| South Eastern Asia | 11 | 0.5% |
| Taiwan | 2 | 0.1% |
| Trinidad and Tobago | 19 | 0.8% |
| Venezuela | 4 | 0.2% |
| Vietnam | 4 | 0.2% |
| Western Asia | 9 | 0.4% |
| Western Europe | 6 | 0.3% | View All 25 Rows |
Sex and Age in Haslet
Sex and Age in Haslet
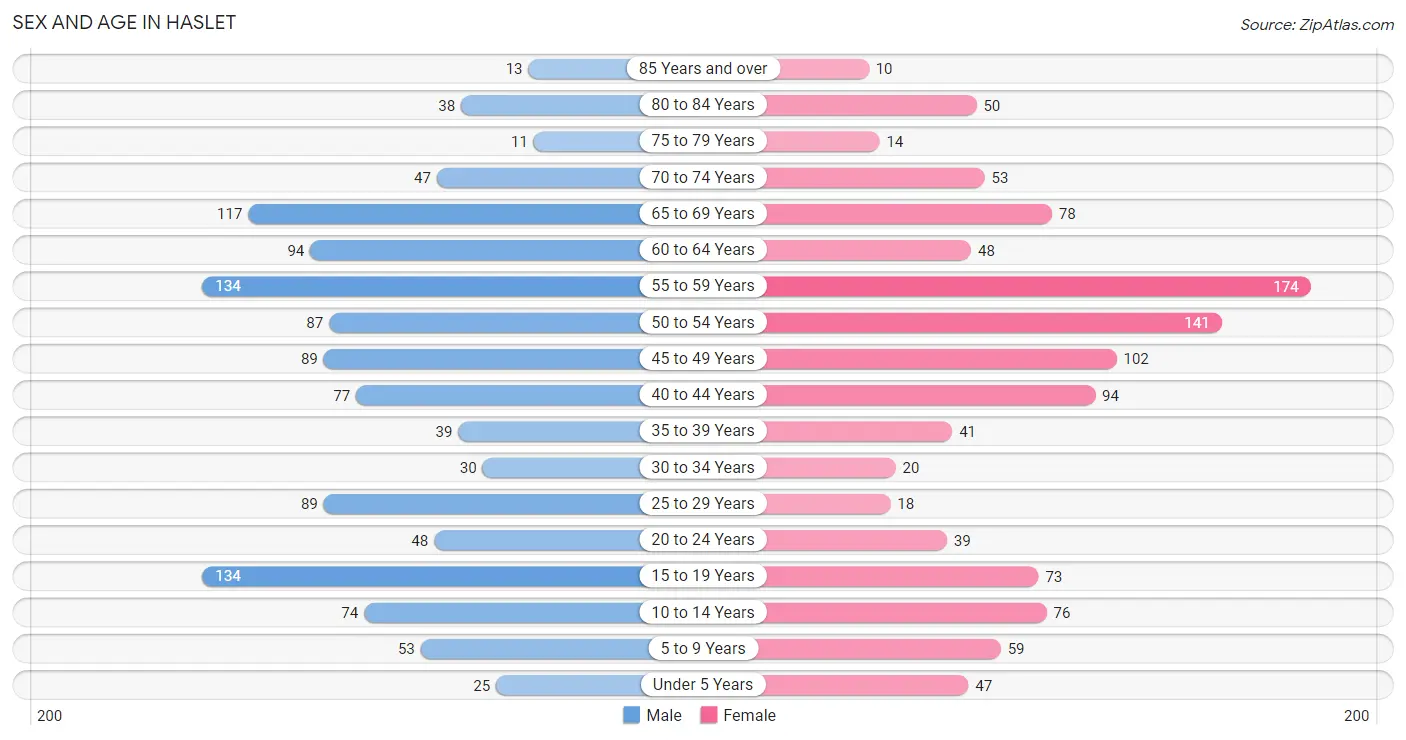
The most populous age groups in Haslet are 15 to 19 Years (134 | 11.2%) for men and 55 to 59 Years (174 | 15.3%) for women.
| Age Bracket | Male | Female |
| Under 5 Years | 25 (2.1%) | 47 (4.1%) |
| 5 to 9 Years | 53 (4.4%) | 59 (5.2%) |
| 10 to 14 Years | 74 (6.2%) | 76 (6.7%) |
| 15 to 19 Years | 134 (11.2%) | 73 (6.4%) |
| 20 to 24 Years | 48 (4.0%) | 39 (3.4%) |
| 25 to 29 Years | 89 (7.4%) | 18 (1.6%) |
| 30 to 34 Years | 30 (2.5%) | 20 (1.8%) |
| 35 to 39 Years | 39 (3.3%) | 41 (3.6%) |
| 40 to 44 Years | 77 (6.4%) | 94 (8.3%) |
| 45 to 49 Years | 89 (7.4%) | 102 (9.0%) |
| 50 to 54 Years | 87 (7.3%) | 141 (12.4%) |
| 55 to 59 Years | 134 (11.2%) | 174 (15.3%) |
| 60 to 64 Years | 94 (7.8%) | 48 (4.2%) |
| 65 to 69 Years | 117 (9.8%) | 78 (6.9%) |
| 70 to 74 Years | 47 (3.9%) | 53 (4.7%) |
| 75 to 79 Years | 11 (0.9%) | 14 (1.2%) |
| 80 to 84 Years | 38 (3.2%) | 50 (4.4%) |
| 85 Years and over | 13 (1.1%) | 10 (0.9%) |
| Total | 1,199 (100.0%) | 1,137 (100.0%) |
Families and Households in Haslet
Median Family Size in Haslet
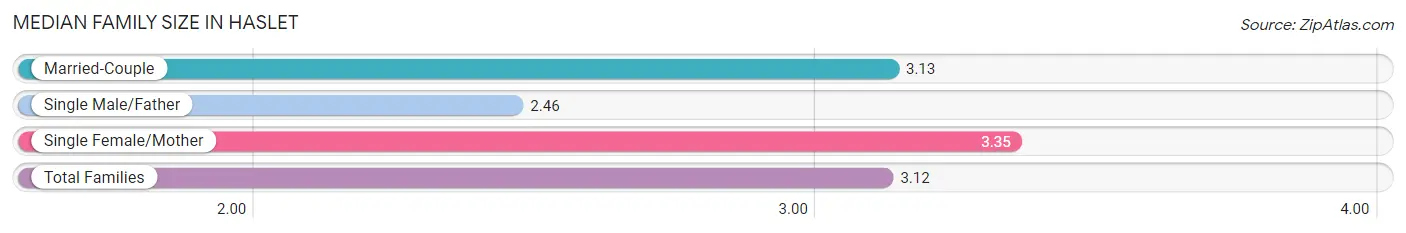
The median family size in Haslet is 3.12 persons per family, with single female/mother families (31 | 4.5%) accounting for the largest median family size of 3.35 persons per family. On the other hand, single male/father families (24 | 3.5%) represent the smallest median family size with 2.46 persons per family.
| Family Type | # Families | Family Size |
| Married-Couple | 631 (92.0%) | 3.13 |
| Single Male/Father | 24 (3.5%) | 2.46 |
| Single Female/Mother | 31 (4.5%) | 3.35 |
| Total Families | 686 (100.0%) | 3.12 |
Median Household Size in Haslet
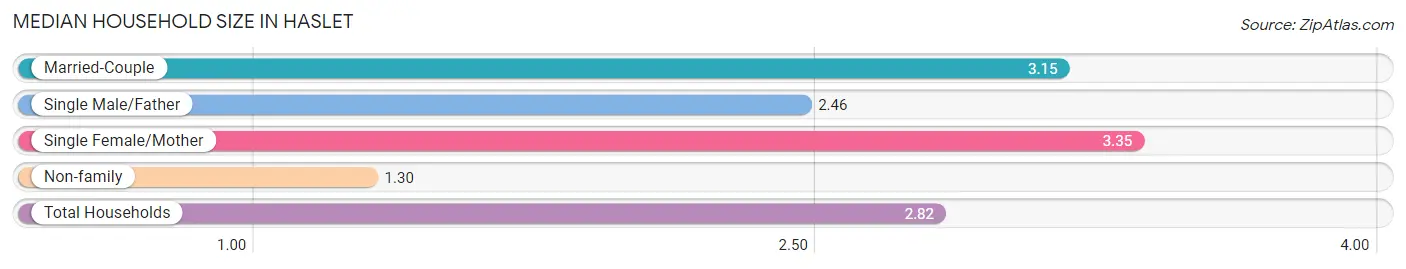
The median household size in Haslet is 2.82 persons per household, with single female/mother households (31 | 3.7%) accounting for the largest median household size of 3.35 persons per household. non-family households (143 | 17.2%) represent the smallest median household size with 1.30 persons per household.
| Household Type | # Households | Household Size |
| Married-Couple | 631 (76.1%) | 3.15 |
| Single Male/Father | 24 (2.9%) | 2.46 |
| Single Female/Mother | 31 (3.7%) | 3.35 |
| Non-family | 143 (17.2%) | 1.30 |
| Total Households | 829 (100.0%) | 2.82 |
Household Size by Marriage Status in Haslet
Out of a total of 829 households in Haslet, 686 (82.8%) are family households, while 143 (17.2%) are nonfamily households. The most numerous type of family households are 2-person households, comprising 293, and the most common type of nonfamily households are 1-person households, comprising 107.
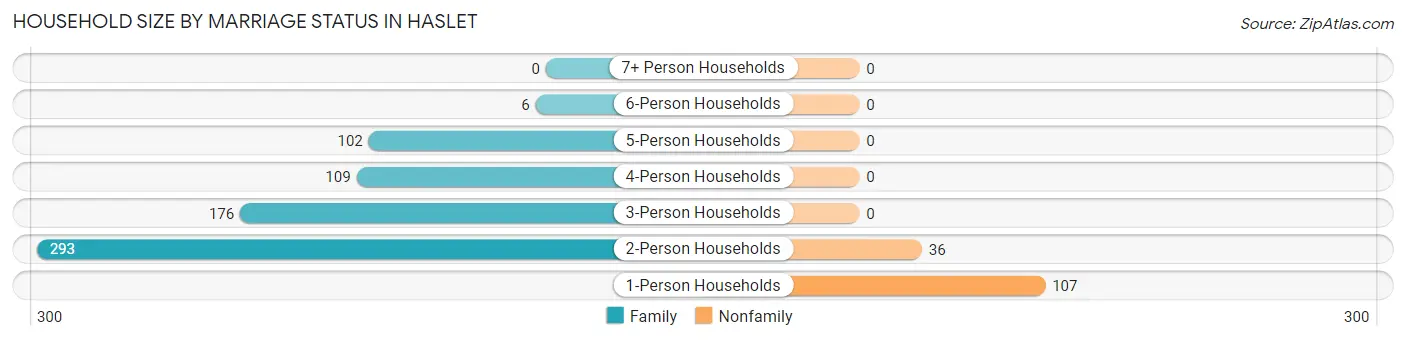
| Household Size | Family Households | Nonfamily Households |
| 1-Person Households | - | 107 (12.9%) |
| 2-Person Households | 293 (35.3%) | 36 (4.3%) |
| 3-Person Households | 176 (21.2%) | 0 (0.0%) |
| 4-Person Households | 109 (13.2%) | 0 (0.0%) |
| 5-Person Households | 102 (12.3%) | 0 (0.0%) |
| 6-Person Households | 6 (0.7%) | 0 (0.0%) |
| 7+ Person Households | 0 (0.0%) | 0 (0.0%) |
| Total | 686 (82.8%) | 143 (17.2%) |
Female Fertility in Haslet
Fertility by Age in Haslet
Average fertility rate in Haslet is 7.0 births per 1,000 women. Women in the age bracket of 20 to 34 years have the highest fertility rate with 39.0 births per 1,000 women. Women in the age bracket of 20 to 34 years acount for 100.0% of all women with births.
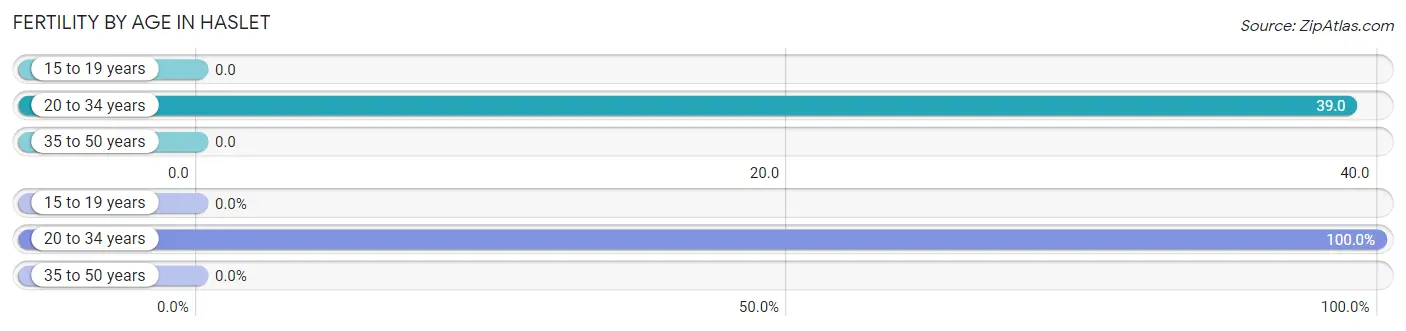
| Age Bracket | Women with Births | Births / 1,000 Women |
| 15 to 19 years | 0 (0.0%) | 0.0 |
| 20 to 34 years | 3 (100.0%) | 39.0 |
| 35 to 50 years | 0 (0.0%) | 0.0 |
| Total | 3 (100.0%) | 7.0 |
Fertility by Age by Marriage Status in Haslet
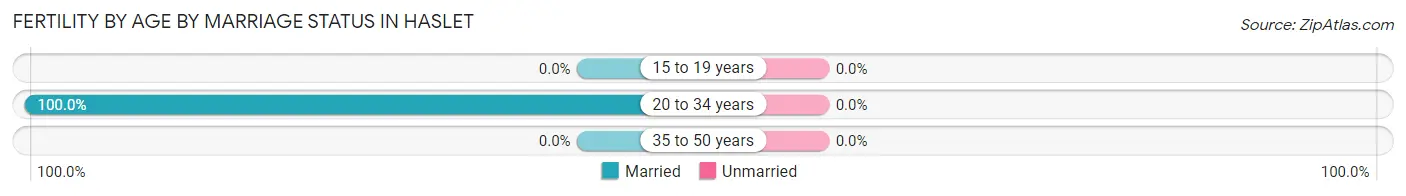
| Age Bracket | Married | Unmarried |
| 15 to 19 years | 0 (0.0%) | 0 (0.0%) |
| 20 to 34 years | 3 (100.0%) | 0 (0.0%) |
| 35 to 50 years | 0 (0.0%) | 0 (0.0%) |
| Total | 3 (100.0%) | 0 (0.0%) |
Fertility by Education in Haslet
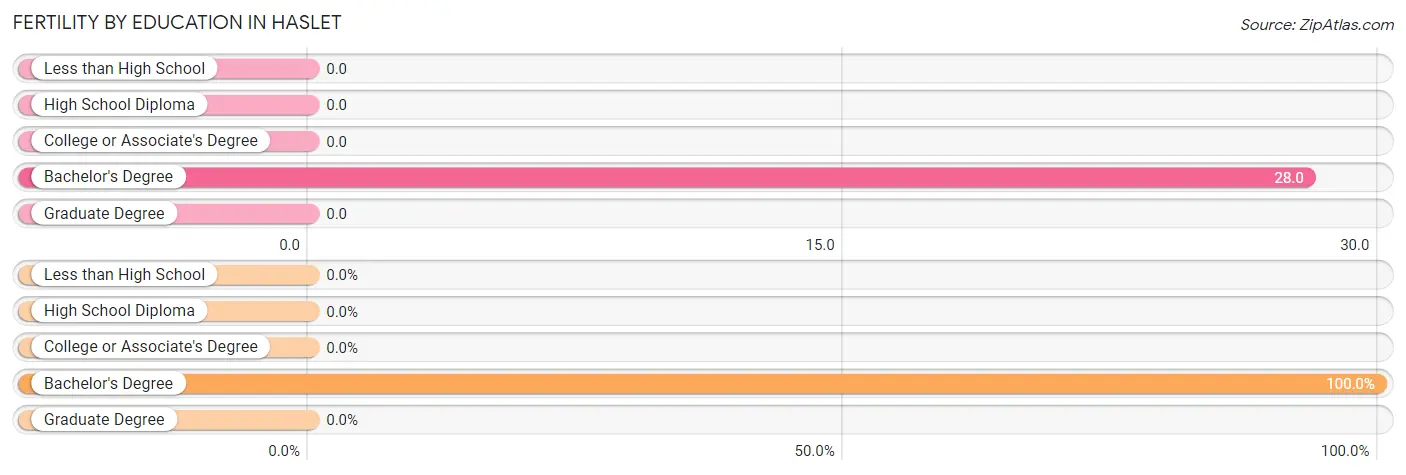
| Educational Attainment | Women with Births | Births / 1,000 Women |
| Less than High School | 0 (0.0%) | 0.0 |
| High School Diploma | 0 (0.0%) | 0.0 |
| College or Associate's Degree | 0 (0.0%) | 0.0 |
| Bachelor's Degree | 3 (100.0%) | 28.0 |
| Graduate Degree | 0 (0.0%) | 0.0 |
| Total | 3 (100.0%) | 7.0 |
Fertility by Education by Marriage Status in Haslet
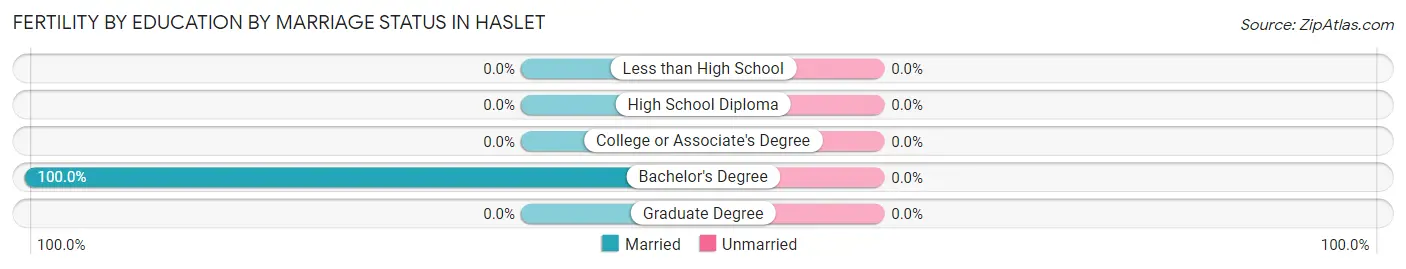
| Educational Attainment | Married | Unmarried |
| Less than High School | 0 (0.0%) | 0 (0.0%) |
| High School Diploma | 0 (0.0%) | 0 (0.0%) |
| College or Associate's Degree | 0 (0.0%) | 0 (0.0%) |
| Bachelor's Degree | 3 (100.0%) | 0 (0.0%) |
| Graduate Degree | 0 (0.0%) | 0 (0.0%) |
| Total | 3 (100.0%) | 0 (0.0%) |
Employment Characteristics in Haslet
Employment by Class of Employer in Haslet
Among the 1,319 employed individuals in Haslet, private company employees (870 | 66.0%), self-employed (incorporated) (102 | 7.7%), and self-employed (not incorporated) (90 | 6.8%) make up the most common classes of employment.
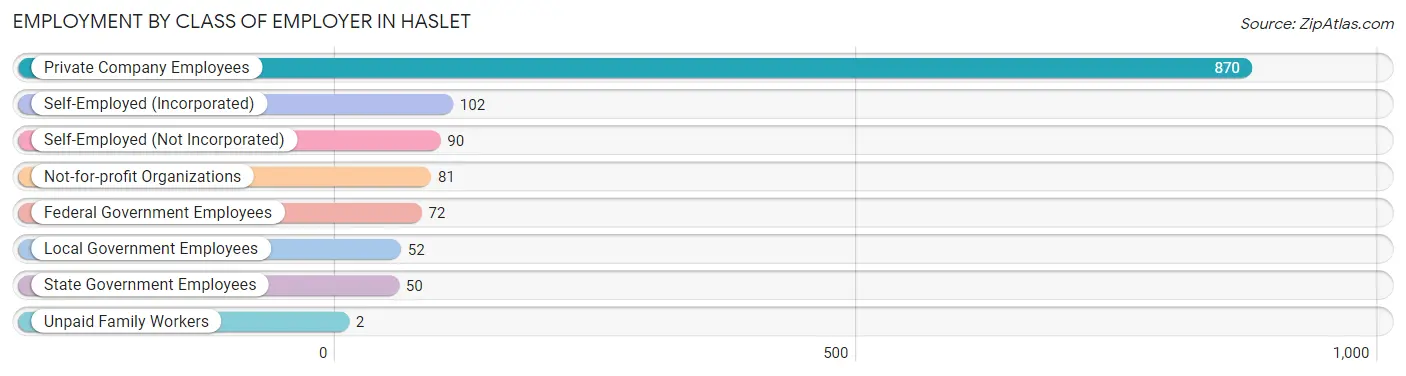
| Employer Class | # Employees | % Employees |
| Private Company Employees | 870 | 66.0% |
| Self-Employed (Incorporated) | 102 | 7.7% |
| Self-Employed (Not Incorporated) | 90 | 6.8% |
| Not-for-profit Organizations | 81 | 6.1% |
| Local Government Employees | 52 | 3.9% |
| State Government Employees | 50 | 3.8% |
| Federal Government Employees | 72 | 5.5% |
| Unpaid Family Workers | 2 | 0.2% |
| Total | 1,319 | 100.0% |
Employment Status by Age in Haslet
According to the labor force statistics for Haslet, out of the total population over 16 years of age (1,970), 68.0% or 1,340 individuals are in the labor force, with 0.4% or 5 of them unemployed. The age group with the highest labor force participation rate is 35 to 44 years, with 96.8% or 243 individuals in the labor force. Within the labor force, the 20 to 24 years age range has the highest percentage of unemployed individuals, with 4.0% or 3 of them being unemployed.
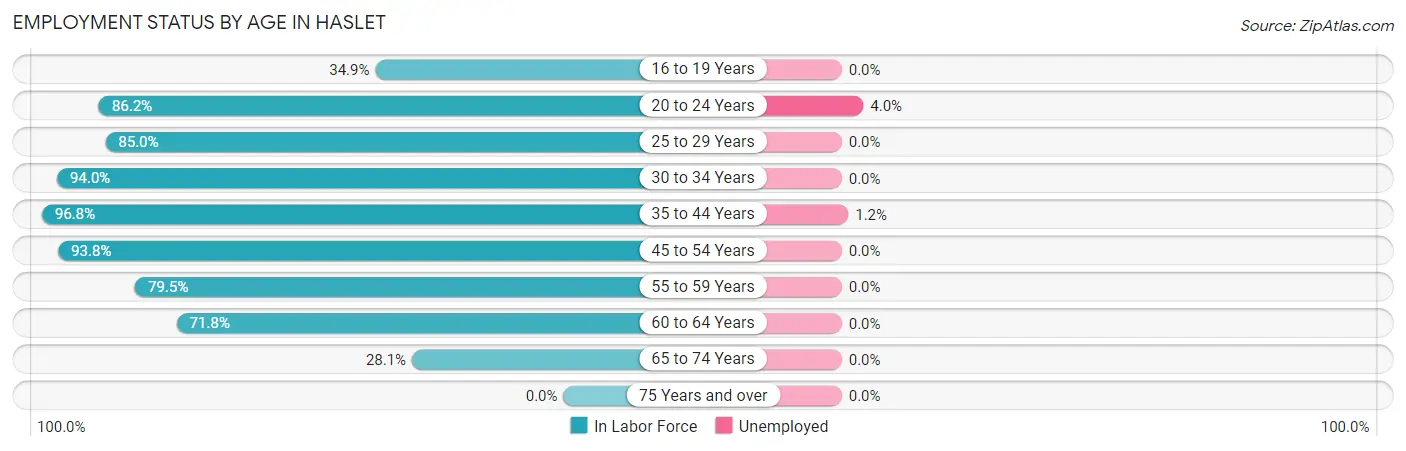
| Age Bracket | In Labor Force | Unemployed |
| 16 to 19 Years | 61 (34.9%) | 0 (0.0%) |
| 20 to 24 Years | 75 (86.2%) | 3 (4.0%) |
| 25 to 29 Years | 91 (85.0%) | 0 (0.0%) |
| 30 to 34 Years | 47 (94.0%) | 0 (0.0%) |
| 35 to 44 Years | 243 (96.8%) | 3 (1.2%) |
| 45 to 54 Years | 393 (93.8%) | 0 (0.0%) |
| 55 to 59 Years | 245 (79.5%) | 0 (0.0%) |
| 60 to 64 Years | 102 (71.8%) | 0 (0.0%) |
| 65 to 74 Years | 83 (28.1%) | 0 (0.0%) |
| 75 Years and over | 0 (0.0%) | 0 (0.0%) |
| Total | 1,340 (68.0%) | 5 (0.4%) |
Employment Status by Educational Attainment in Haslet
According to labor force statistics for Haslet, 87.8% of individuals (1,121) out of the total population between 25 and 64 years of age (1,277) are in the labor force, with 0.3% or 3 of them being unemployed. The group with the highest labor force participation rate are those with the educational attainment of high school diploma, with 90.7% or 196 individuals in the labor force. Within the labor force, individuals with college / associate degree education have the highest percentage of unemployment, with 0.7% or 3 of them being unemployed.
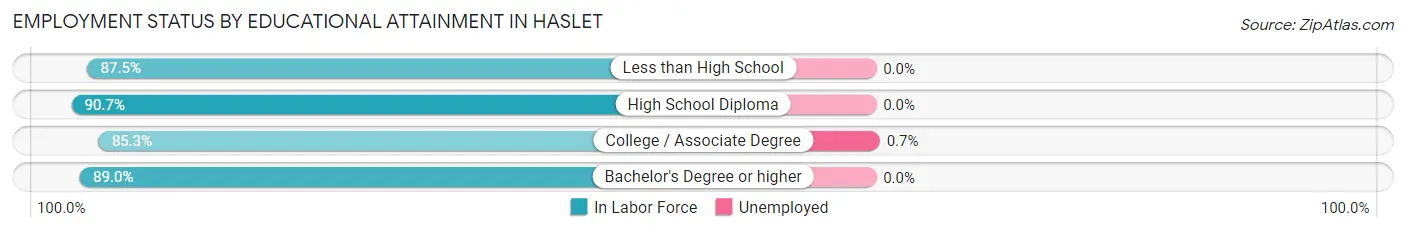
| Educational Attainment | In Labor Force | Unemployed |
| Less than High School | 35 (87.5%) | 0 (0.0%) |
| High School Diploma | 196 (90.7%) | 0 (0.0%) |
| College / Associate Degree | 430 (85.3%) | 4 (0.7%) |
| Bachelor's Degree or higher | 460 (89.0%) | 0 (0.0%) |
| Total | 1,121 (87.8%) | 4 (0.3%) |
Employment Occupations by Sex in Haslet
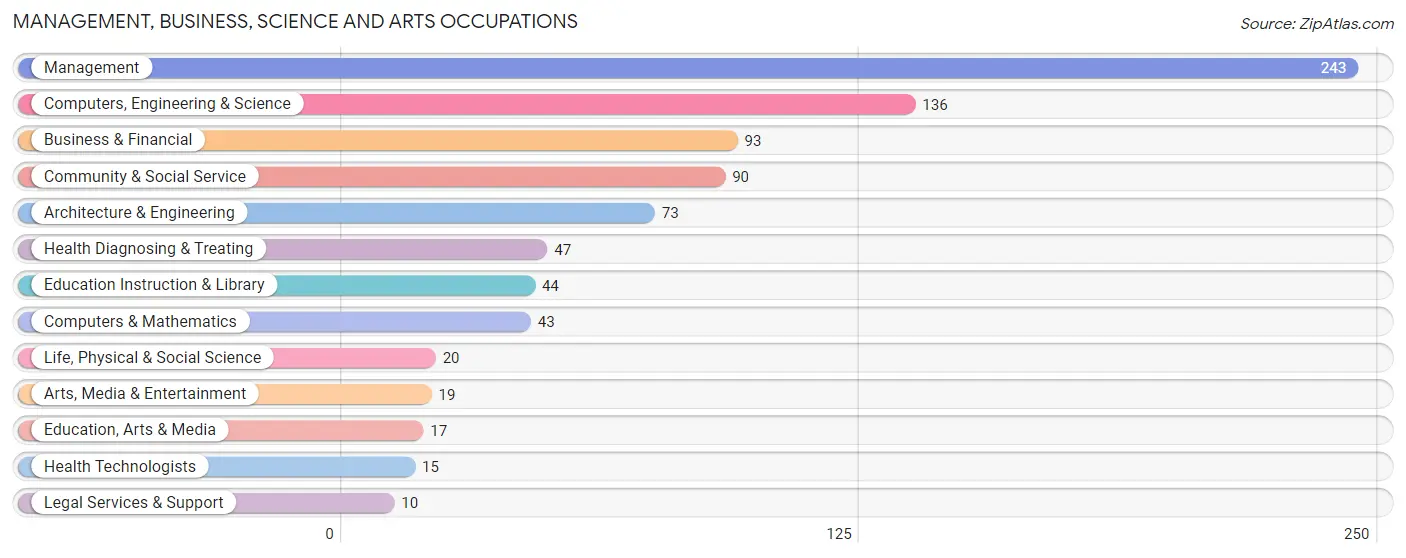
Management, Business, Science and Arts Occupations
The most common Management, Business, Science and Arts occupations in Haslet are Management (243 | 18.2%), Computers, Engineering & Science (136 | 10.2%), Business & Financial (93 | 7.0%), Community & Social Service (90 | 6.8%), and Architecture & Engineering (73 | 5.5%).
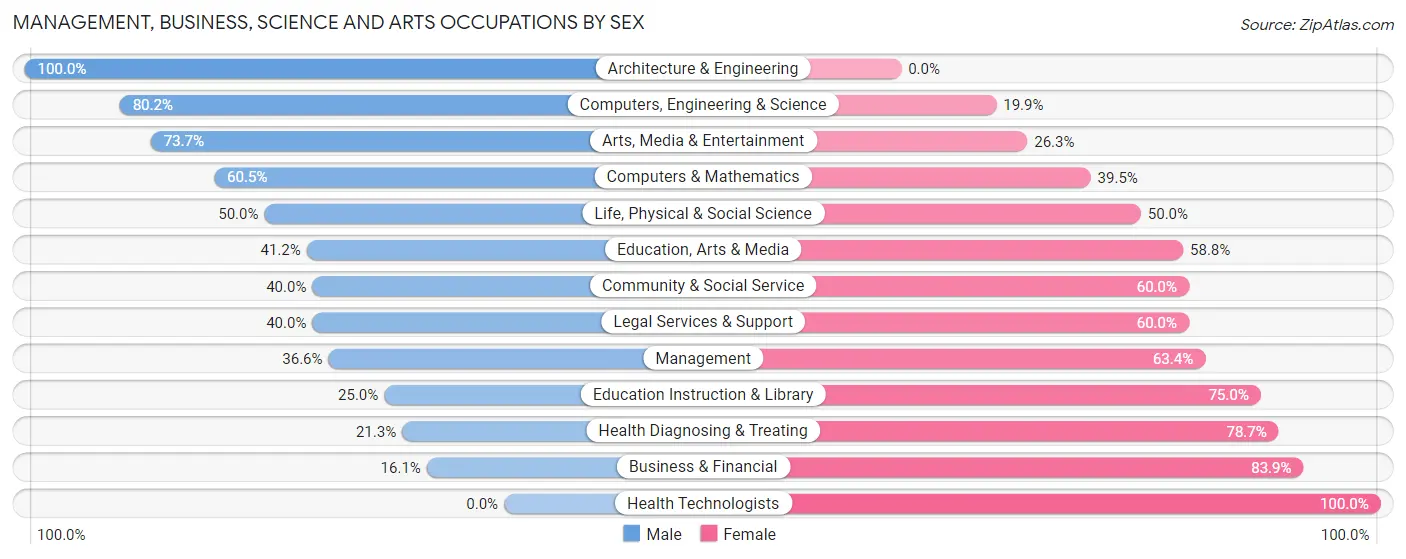
Management, Business, Science and Arts Occupations by Sex
Within the Management, Business, Science and Arts occupations in Haslet, the most male-oriented occupations are Architecture & Engineering (100.0%), Computers, Engineering & Science (80.1%), and Arts, Media & Entertainment (73.7%), while the most female-oriented occupations are Health Technologists (100.0%), Business & Financial (83.9%), and Health Diagnosing & Treating (78.7%).
| Occupation | Male | Female |
| Management | 89 (36.6%) | 154 (63.4%) |
| Business & Financial | 15 (16.1%) | 78 (83.9%) |
| Computers, Engineering & Science | 109 (80.1%) | 27 (19.9%) |
| Computers & Mathematics | 26 (60.5%) | 17 (39.5%) |
| Architecture & Engineering | 73 (100.0%) | 0 (0.0%) |
| Life, Physical & Social Science | 10 (50.0%) | 10 (50.0%) |
| Community & Social Service | 36 (40.0%) | 54 (60.0%) |
| Education, Arts & Media | 7 (41.2%) | 10 (58.8%) |
| Legal Services & Support | 4 (40.0%) | 6 (60.0%) |
| Education Instruction & Library | 11 (25.0%) | 33 (75.0%) |
| Arts, Media & Entertainment | 14 (73.7%) | 5 (26.3%) |
| Health Diagnosing & Treating | 10 (21.3%) | 37 (78.7%) |
| Health Technologists | 0 (0.0%) | 15 (100.0%) |
| Total (Category) | 259 (42.5%) | 350 (57.5%) |
| Total (Overall) | 734 (55.0%) | 600 (45.0%) |
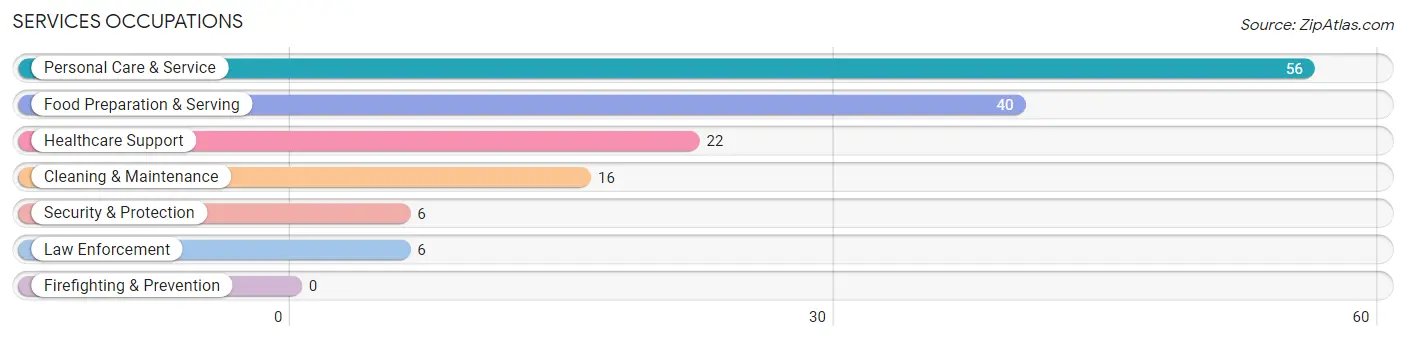
Services Occupations
The most common Services occupations in Haslet are Personal Care & Service (56 | 4.2%), Food Preparation & Serving (40 | 3.0%), Healthcare Support (22 | 1.7%), Cleaning & Maintenance (16 | 1.2%), and Security & Protection (6 | 0.4%).
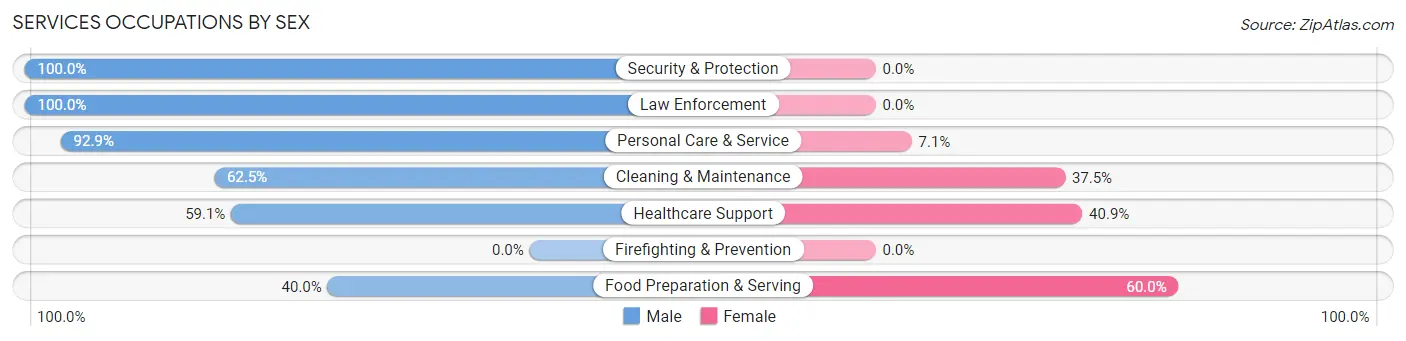
Services Occupations by Sex
Within the Services occupations in Haslet, the most male-oriented occupations are Security & Protection (100.0%), Law Enforcement (100.0%), and Personal Care & Service (92.9%), while the most female-oriented occupations are Food Preparation & Serving (60.0%), Healthcare Support (40.9%), and Cleaning & Maintenance (37.5%).
| Occupation | Male | Female |
| Healthcare Support | 13 (59.1%) | 9 (40.9%) |
| Security & Protection | 6 (100.0%) | 0 (0.0%) |
| Firefighting & Prevention | 0 (0.0%) | 0 (0.0%) |
| Law Enforcement | 6 (100.0%) | 0 (0.0%) |
| Food Preparation & Serving | 16 (40.0%) | 24 (60.0%) |
| Cleaning & Maintenance | 10 (62.5%) | 6 (37.5%) |
| Personal Care & Service | 52 (92.9%) | 4 (7.1%) |
| Total (Category) | 97 (69.3%) | 43 (30.7%) |
| Total (Overall) | 734 (55.0%) | 600 (45.0%) |
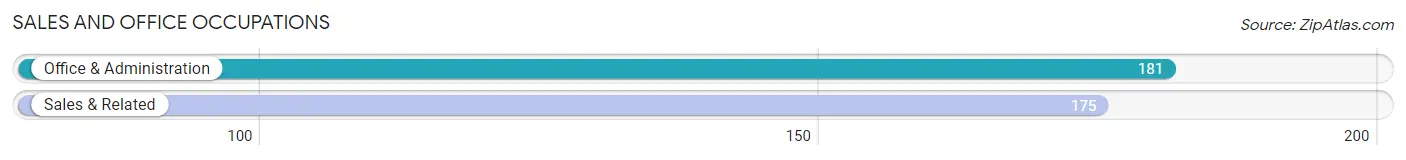
Sales and Office Occupations
The most common Sales and Office occupations in Haslet are Office & Administration (181 | 13.6%), and Sales & Related (175 | 13.1%).
Sales and Office Occupations by Sex
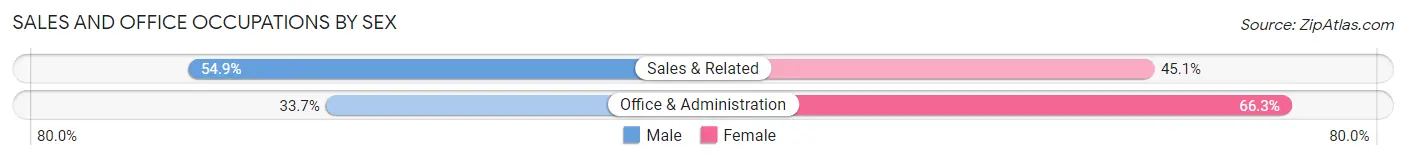
| Occupation | Male | Female |
| Sales & Related | 96 (54.9%) | 79 (45.1%) |
| Office & Administration | 61 (33.7%) | 120 (66.3%) |
| Total (Category) | 157 (44.1%) | 199 (55.9%) |
| Total (Overall) | 734 (55.0%) | 600 (45.0%) |
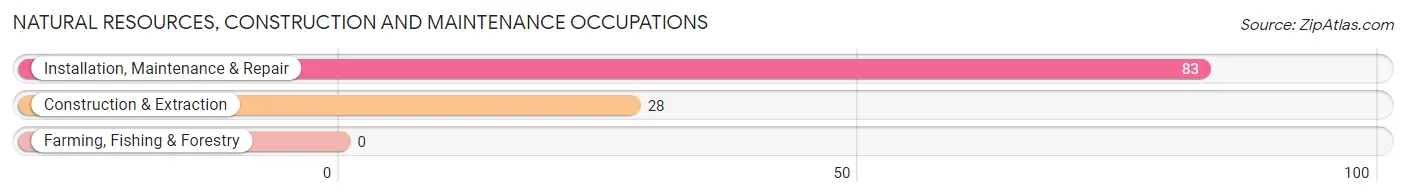
Natural Resources, Construction and Maintenance Occupations
The most common Natural Resources, Construction and Maintenance occupations in Haslet are Installation, Maintenance & Repair (83 | 6.2%), and Construction & Extraction (28 | 2.1%).
Natural Resources, Construction and Maintenance Occupations by Sex
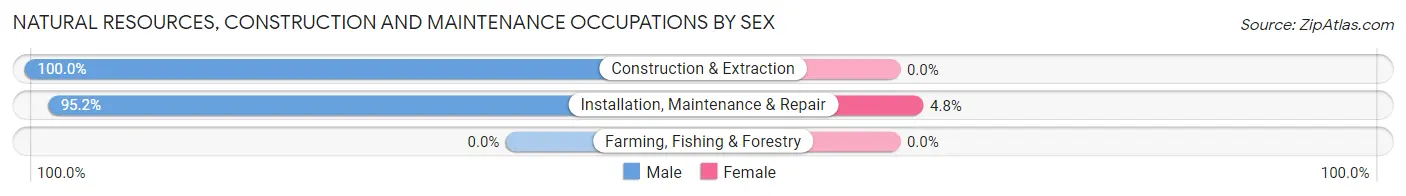
| Occupation | Male | Female |
| Farming, Fishing & Forestry | 0 (0.0%) | 0 (0.0%) |
| Construction & Extraction | 28 (100.0%) | 0 (0.0%) |
| Installation, Maintenance & Repair | 79 (95.2%) | 4 (4.8%) |
| Total (Category) | 107 (96.4%) | 4 (3.6%) |
| Total (Overall) | 734 (55.0%) | 600 (45.0%) |
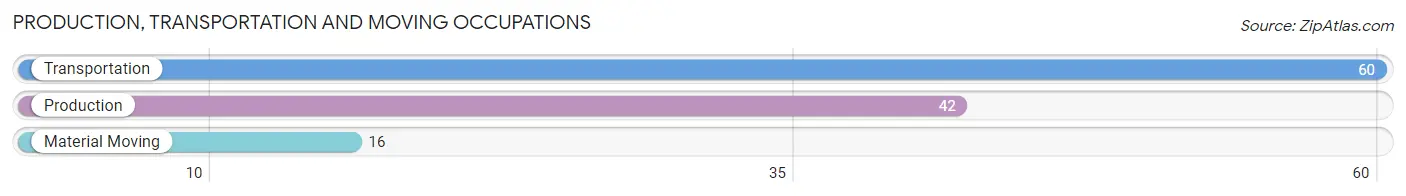
Production, Transportation and Moving Occupations
The most common Production, Transportation and Moving occupations in Haslet are Transportation (60 | 4.5%), Production (42 | 3.2%), and Material Moving (16 | 1.2%).
Production, Transportation and Moving Occupations by Sex
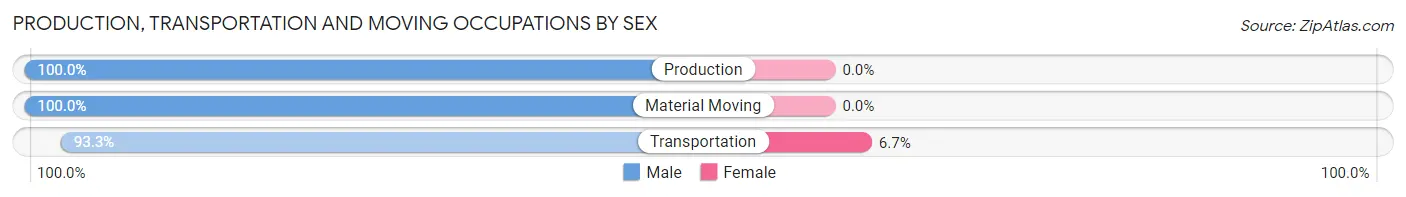
| Occupation | Male | Female |
| Production | 42 (100.0%) | 0 (0.0%) |
| Transportation | 56 (93.3%) | 4 (6.7%) |
| Material Moving | 16 (100.0%) | 0 (0.0%) |
| Total (Category) | 114 (96.6%) | 4 (3.4%) |
| Total (Overall) | 734 (55.0%) | 600 (45.0%) |
Employment Industries by Sex in Haslet
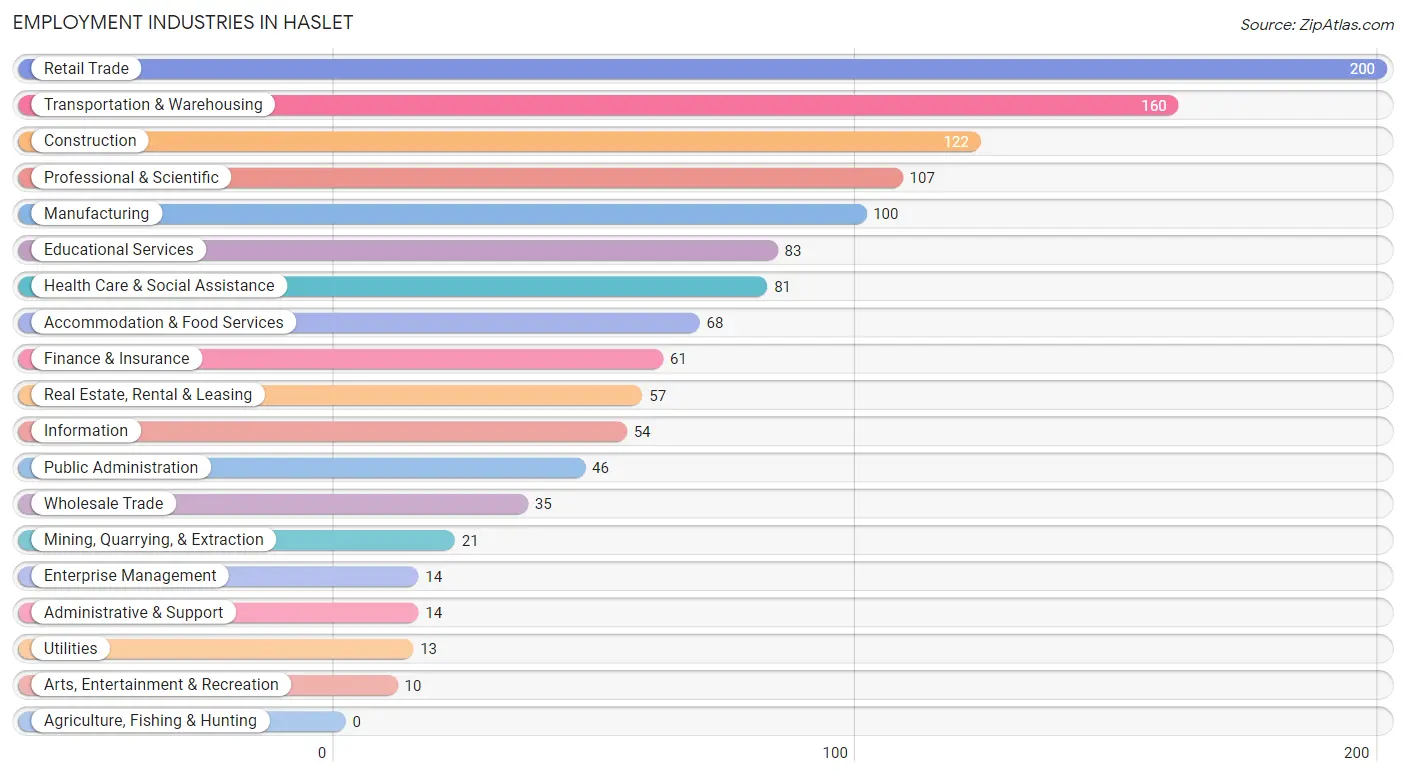
Employment Industries in Haslet
The major employment industries in Haslet include Retail Trade (200 | 15.0%), Transportation & Warehousing (160 | 12.0%), Construction (122 | 9.1%), Professional & Scientific (107 | 8.0%), and Manufacturing (100 | 7.5%).
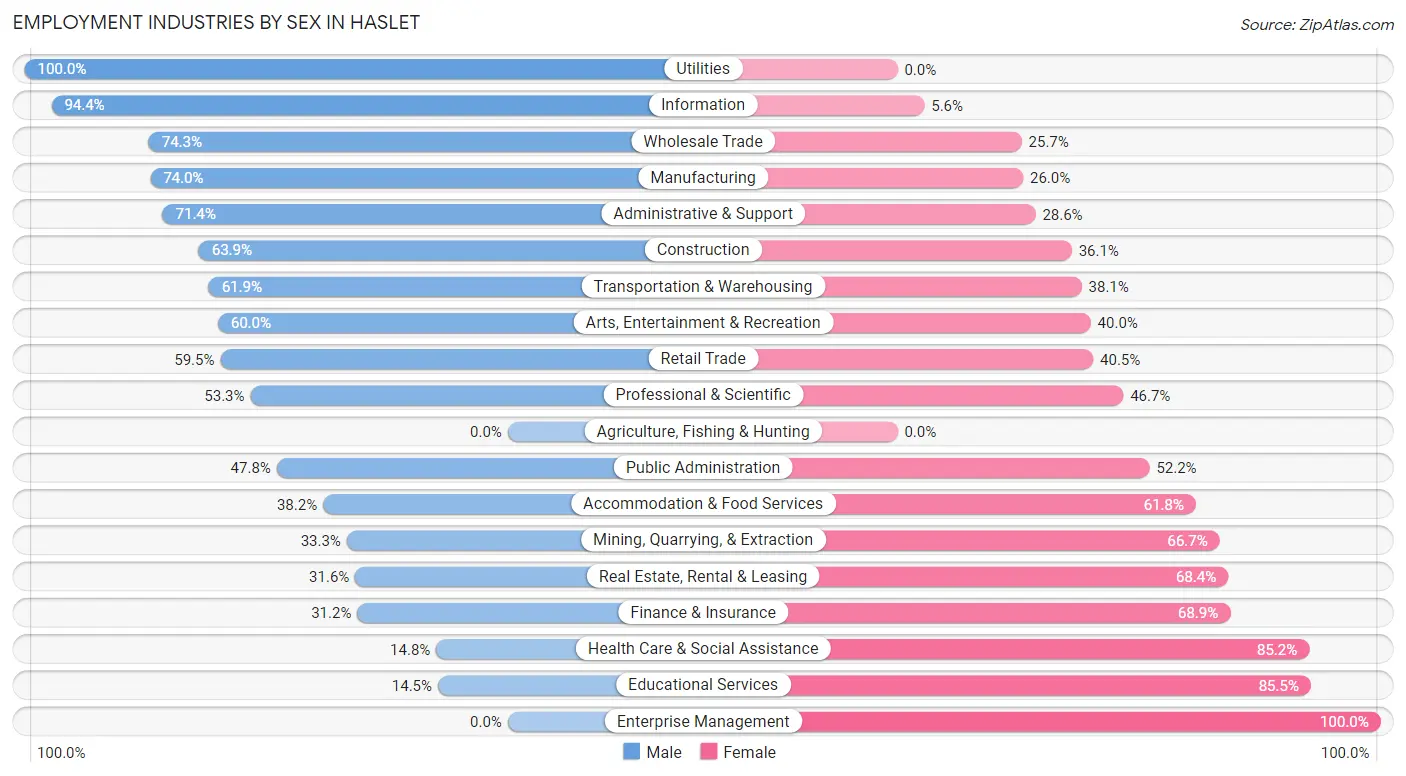
Employment Industries by Sex in Haslet
The Haslet industries that see more men than women are Utilities (100.0%), Information (94.4%), and Wholesale Trade (74.3%), whereas the industries that tend to have a higher number of women are Enterprise Management (100.0%), Educational Services (85.5%), and Health Care & Social Assistance (85.2%).
| Industry | Male | Female |
| Agriculture, Fishing & Hunting | 0 (0.0%) | 0 (0.0%) |
| Mining, Quarrying, & Extraction | 7 (33.3%) | 14 (66.7%) |
| Construction | 78 (63.9%) | 44 (36.1%) |
| Manufacturing | 74 (74.0%) | 26 (26.0%) |
| Wholesale Trade | 26 (74.3%) | 9 (25.7%) |
| Retail Trade | 119 (59.5%) | 81 (40.5%) |
| Transportation & Warehousing | 99 (61.9%) | 61 (38.1%) |
| Utilities | 13 (100.0%) | 0 (0.0%) |
| Information | 51 (94.4%) | 3 (5.6%) |
| Finance & Insurance | 19 (31.1%) | 42 (68.9%) |
| Real Estate, Rental & Leasing | 18 (31.6%) | 39 (68.4%) |
| Professional & Scientific | 57 (53.3%) | 50 (46.7%) |
| Enterprise Management | 0 (0.0%) | 14 (100.0%) |
| Administrative & Support | 10 (71.4%) | 4 (28.6%) |
| Educational Services | 12 (14.5%) | 71 (85.5%) |
| Health Care & Social Assistance | 12 (14.8%) | 69 (85.2%) |
| Arts, Entertainment & Recreation | 6 (60.0%) | 4 (40.0%) |
| Accommodation & Food Services | 26 (38.2%) | 42 (61.8%) |
| Public Administration | 22 (47.8%) | 24 (52.2%) |
| Total | 734 (55.0%) | 600 (45.0%) |
Education in Haslet
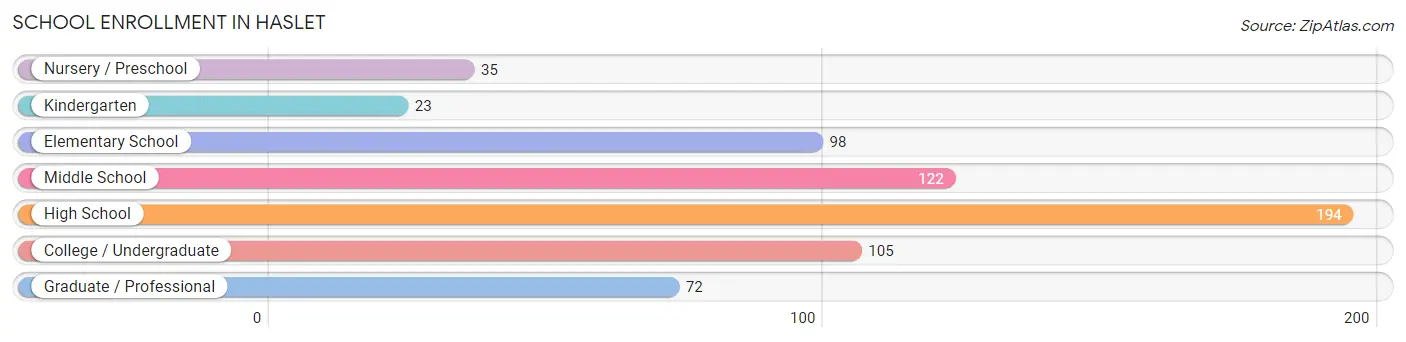
School Enrollment in Haslet
The most common levels of schooling among the 649 students in Haslet are high school (194 | 29.9%), middle school (122 | 18.8%), and college / undergraduate (105 | 16.2%).
| School Level | # Students | % Students |
| Nursery / Preschool | 35 | 5.4% |
| Kindergarten | 23 | 3.5% |
| Elementary School | 98 | 15.1% |
| Middle School | 122 | 18.8% |
| High School | 194 | 29.9% |
| College / Undergraduate | 105 | 16.2% |
| Graduate / Professional | 72 | 11.1% |
| Total | 649 | 100.0% |
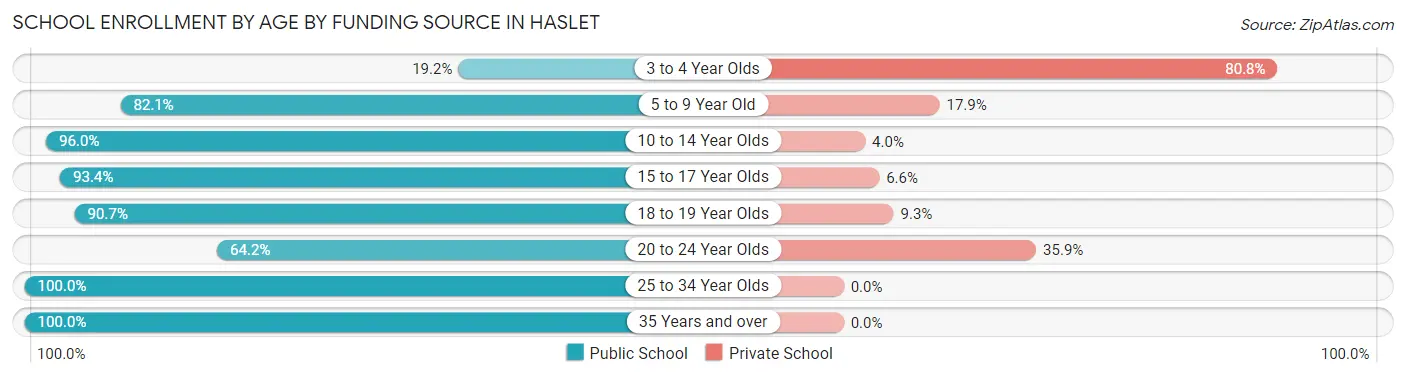
School Enrollment by Age by Funding Source in Haslet
Out of a total of 649 students who are enrolled in schools in Haslet, 80 (12.3%) attend a private institution, while the remaining 569 (87.7%) are enrolled in public schools. The age group of 3 to 4 year olds has the highest likelihood of being enrolled in private schools, with 21 (80.8% in the age bracket) enrolled. Conversely, the age group of 25 to 34 year olds has the lowest likelihood of being enrolled in a private school, with 64 (100.0% in the age bracket) attending a public institution.
| Age Bracket | Public School | Private School |
| 3 to 4 Year Olds | 5 (19.2%) | 21 (80.8%) |
| 5 to 9 Year Old | 92 (82.1%) | 20 (17.9%) |
| 10 to 14 Year Olds | 144 (96.0%) | 6 (4.0%) |
| 15 to 17 Year Olds | 141 (93.4%) | 10 (6.6%) |
| 18 to 19 Year Olds | 39 (90.7%) | 4 (9.3%) |
| 20 to 24 Year Olds | 34 (64.1%) | 19 (35.8%) |
| 25 to 34 Year Olds | 64 (100.0%) | 0 (0.0%) |
| 35 Years and over | 50 (100.0%) | 0 (0.0%) |
| Total | 569 (87.7%) | 80 (12.3%) |
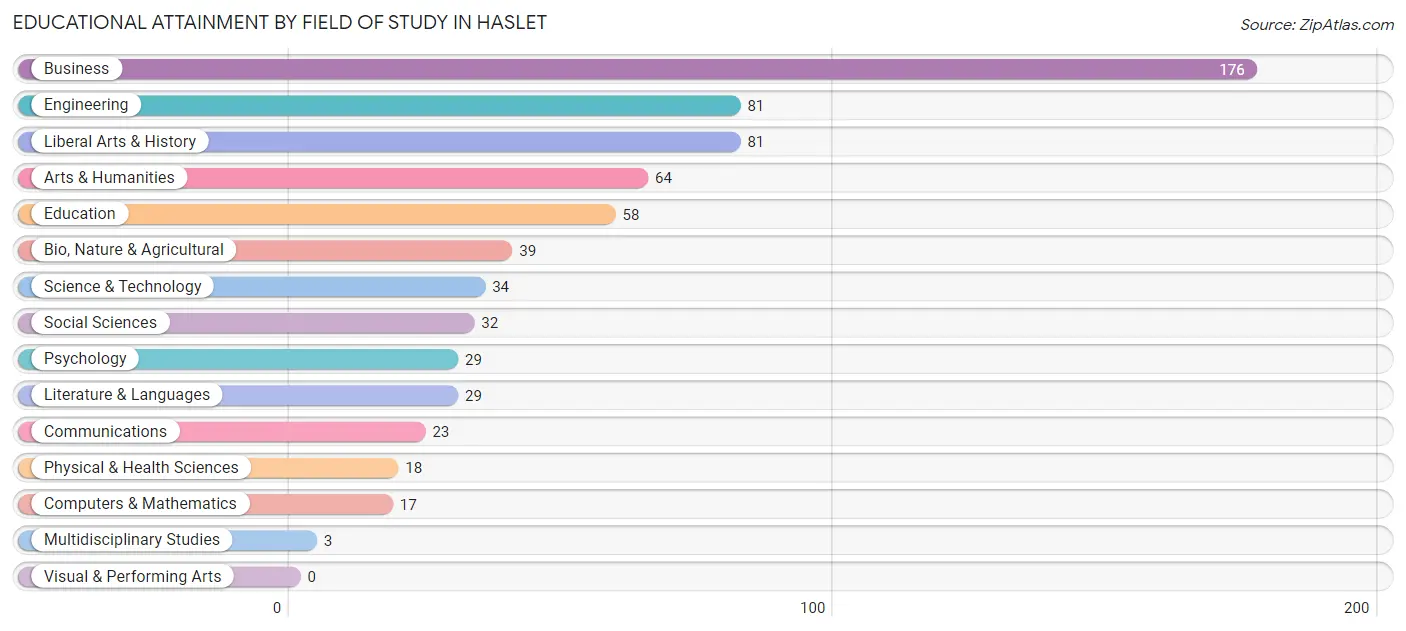
Educational Attainment by Field of Study in Haslet
Business (176 | 25.7%), engineering (81 | 11.8%), liberal arts & history (81 | 11.8%), arts & humanities (64 | 9.4%), and education (58 | 8.5%) are the most common fields of study among 684 individuals in Haslet who have obtained a bachelor's degree or higher.
| Field of Study | # Graduates | % Graduates |
| Computers & Mathematics | 17 | 2.5% |
| Bio, Nature & Agricultural | 39 | 5.7% |
| Physical & Health Sciences | 18 | 2.6% |
| Psychology | 29 | 4.2% |
| Social Sciences | 32 | 4.7% |
| Engineering | 81 | 11.8% |
| Multidisciplinary Studies | 3 | 0.4% |
| Science & Technology | 34 | 5.0% |
| Business | 176 | 25.7% |
| Education | 58 | 8.5% |
| Literature & Languages | 29 | 4.2% |
| Liberal Arts & History | 81 | 11.8% |
| Visual & Performing Arts | 0 | 0.0% |
| Communications | 23 | 3.4% |
| Arts & Humanities | 64 | 9.4% |
| Total | 684 | 100.0% |
Transportation & Commute in Haslet
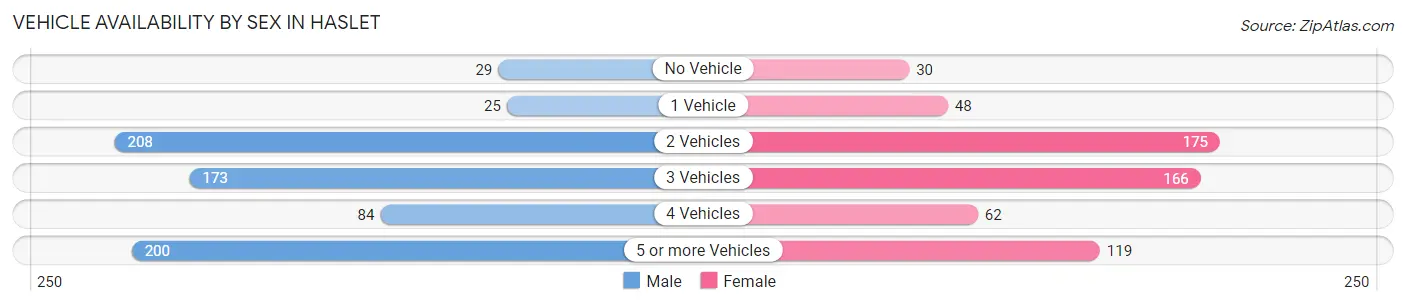
Vehicle Availability by Sex in Haslet
The most prevalent vehicle ownership categories in Haslet are males with 2 vehicles (208, accounting for 28.9%) and females with 2 vehicles (175, making up 34.7%).
| Vehicles Available | Male | Female |
| No Vehicle | 29 (4.0%) | 30 (5.0%) |
| 1 Vehicle | 25 (3.5%) | 48 (8.0%) |
| 2 Vehicles | 208 (28.9%) | 175 (29.2%) |
| 3 Vehicles | 173 (24.1%) | 166 (27.7%) |
| 4 Vehicles | 84 (11.7%) | 62 (10.3%) |
| 5 or more Vehicles | 200 (27.8%) | 119 (19.8%) |
| Total | 719 (100.0%) | 600 (100.0%) |
Commute Time in Haslet
The most frequently occuring commute durations in Haslet are 45 to 59 minutes (158 commuters, 15.8%), 30 to 34 minutes (145 commuters, 14.5%), and 40 to 44 minutes (123 commuters, 12.3%).
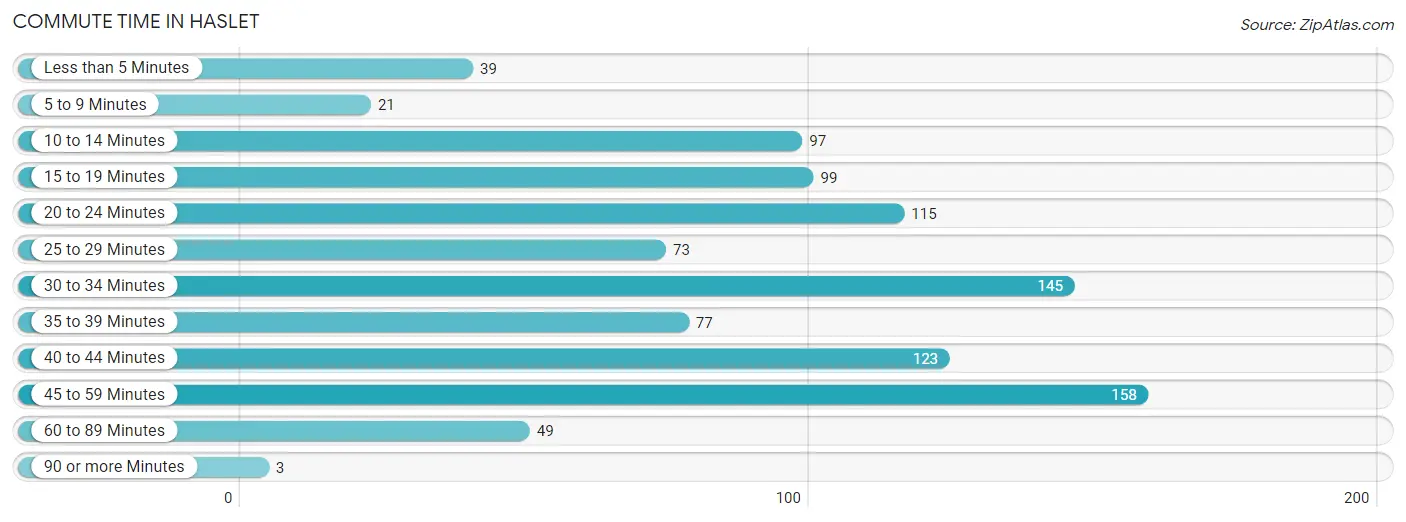
| Commute Time | # Commuters | % Commuters |
| Less than 5 Minutes | 39 | 3.9% |
| 5 to 9 Minutes | 21 | 2.1% |
| 10 to 14 Minutes | 97 | 9.7% |
| 15 to 19 Minutes | 99 | 9.9% |
| 20 to 24 Minutes | 115 | 11.5% |
| 25 to 29 Minutes | 73 | 7.3% |
| 30 to 34 Minutes | 145 | 14.5% |
| 35 to 39 Minutes | 77 | 7.7% |
| 40 to 44 Minutes | 123 | 12.3% |
| 45 to 59 Minutes | 158 | 15.8% |
| 60 to 89 Minutes | 49 | 4.9% |
| 90 or more Minutes | 3 | 0.3% |
Commute Time by Sex in Haslet
The most common commute times in Haslet are 40 to 44 minutes (89 commuters, 15.9%) for males and 45 to 59 minutes (98 commuters, 22.4%) for females.
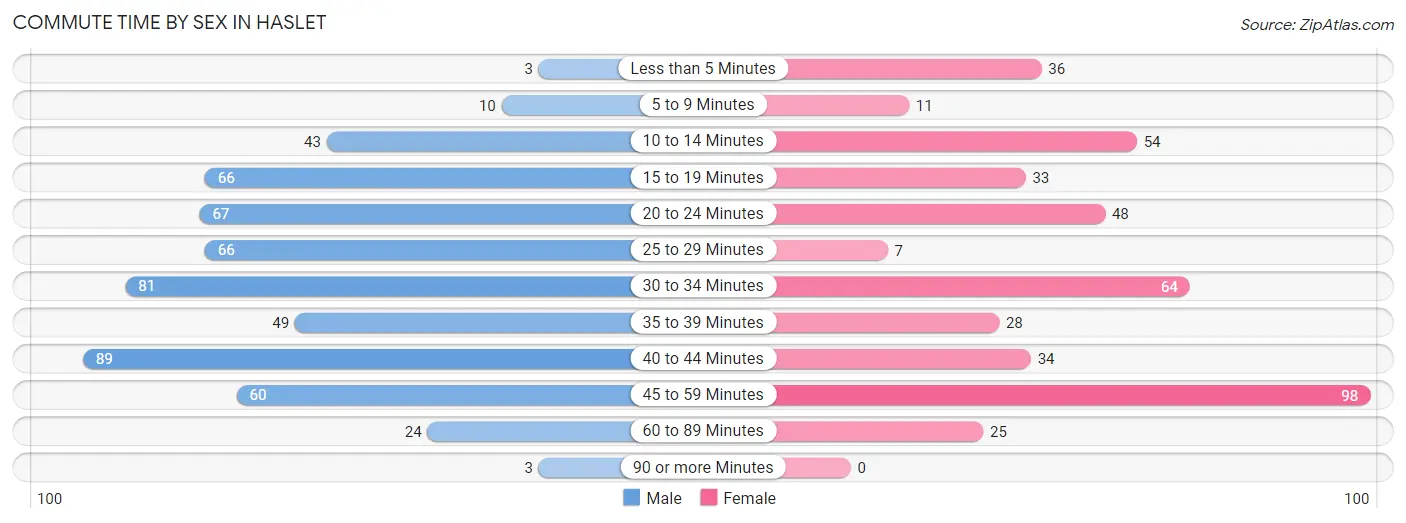
| Commute Time | Male | Female |
| Less than 5 Minutes | 3 (0.5%) | 36 (8.2%) |
| 5 to 9 Minutes | 10 (1.8%) | 11 (2.5%) |
| 10 to 14 Minutes | 43 (7.7%) | 54 (12.3%) |
| 15 to 19 Minutes | 66 (11.8%) | 33 (7.5%) |
| 20 to 24 Minutes | 67 (11.9%) | 48 (11.0%) |
| 25 to 29 Minutes | 66 (11.8%) | 7 (1.6%) |
| 30 to 34 Minutes | 81 (14.4%) | 64 (14.6%) |
| 35 to 39 Minutes | 49 (8.7%) | 28 (6.4%) |
| 40 to 44 Minutes | 89 (15.9%) | 34 (7.8%) |
| 45 to 59 Minutes | 60 (10.7%) | 98 (22.4%) |
| 60 to 89 Minutes | 24 (4.3%) | 25 (5.7%) |
| 90 or more Minutes | 3 (0.5%) | 0 (0.0%) |
Time of Departure to Work by Sex in Haslet
The most frequent times of departure to work in Haslet are 6:00 AM to 6:29 AM (97, 17.3%) for males and 7:00 AM to 7:29 AM (211, 48.2%) for females.
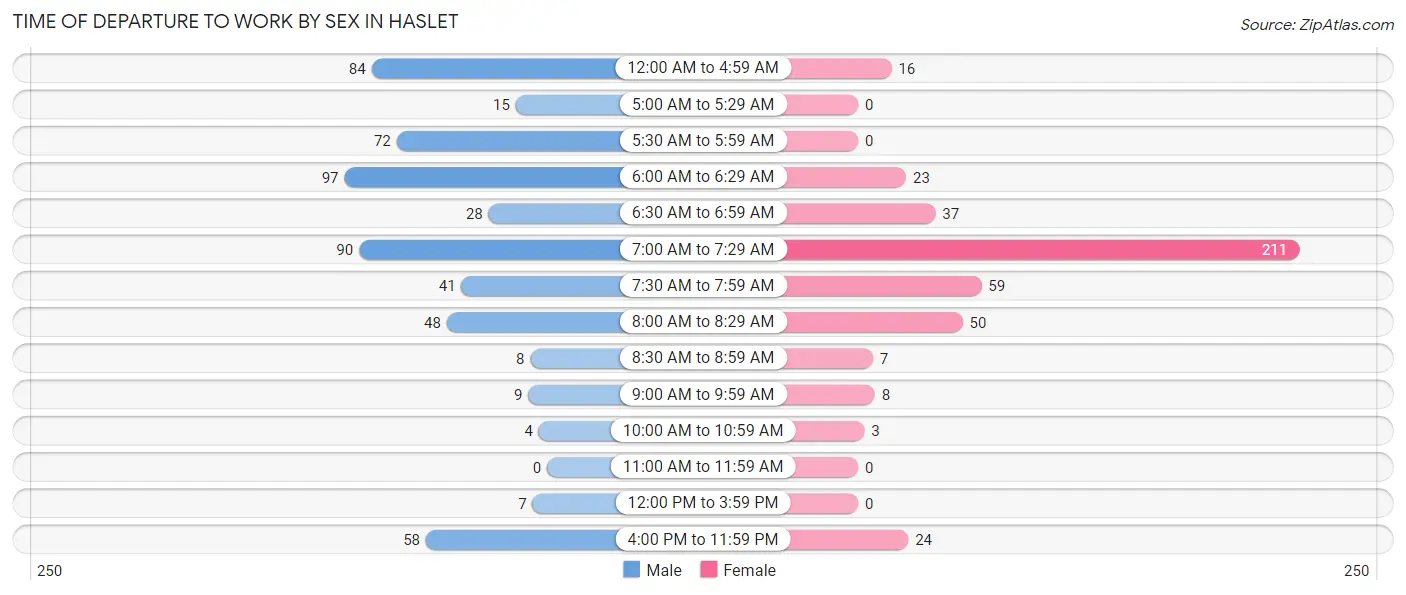
| Time of Departure | Male | Female |
| 12:00 AM to 4:59 AM | 84 (15.0%) | 16 (3.6%) |
| 5:00 AM to 5:29 AM | 15 (2.7%) | 0 (0.0%) |
| 5:30 AM to 5:59 AM | 72 (12.8%) | 0 (0.0%) |
| 6:00 AM to 6:29 AM | 97 (17.3%) | 23 (5.2%) |
| 6:30 AM to 6:59 AM | 28 (5.0%) | 37 (8.5%) |
| 7:00 AM to 7:29 AM | 90 (16.0%) | 211 (48.2%) |
| 7:30 AM to 7:59 AM | 41 (7.3%) | 59 (13.5%) |
| 8:00 AM to 8:29 AM | 48 (8.6%) | 50 (11.4%) |
| 8:30 AM to 8:59 AM | 8 (1.4%) | 7 (1.6%) |
| 9:00 AM to 9:59 AM | 9 (1.6%) | 8 (1.8%) |
| 10:00 AM to 10:59 AM | 4 (0.7%) | 3 (0.7%) |
| 11:00 AM to 11:59 AM | 0 (0.0%) | 0 (0.0%) |
| 12:00 PM to 3:59 PM | 7 (1.3%) | 0 (0.0%) |
| 4:00 PM to 11:59 PM | 58 (10.3%) | 24 (5.5%) |
| Total | 561 (100.0%) | 438 (100.0%) |
Housing Occupancy in Haslet
Occupancy by Ownership in Haslet
Of the total 829 dwellings in Haslet, owner-occupied units account for 788 (95.1%), while renter-occupied units make up 41 (5.0%).
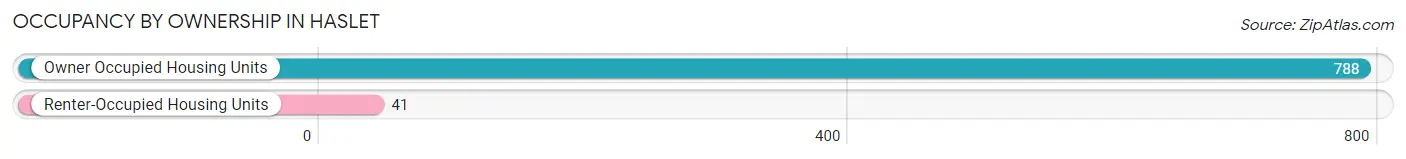
| Occupancy | # Housing Units | % Housing Units |
| Owner Occupied Housing Units | 788 | 95.1% |
| Renter-Occupied Housing Units | 41 | 5.0% |
| Total Occupied Housing Units | 829 | 100.0% |
Occupancy by Household Size in Haslet
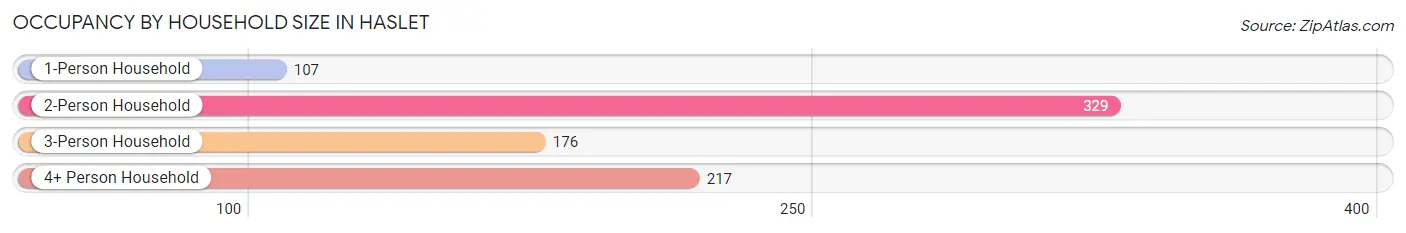
| Household Size | # Housing Units | % Housing Units |
| 1-Person Household | 107 | 12.9% |
| 2-Person Household | 329 | 39.7% |
| 3-Person Household | 176 | 21.2% |
| 4+ Person Household | 217 | 26.2% |
| Total Housing Units | 829 | 100.0% |
Occupancy by Ownership by Household Size in Haslet
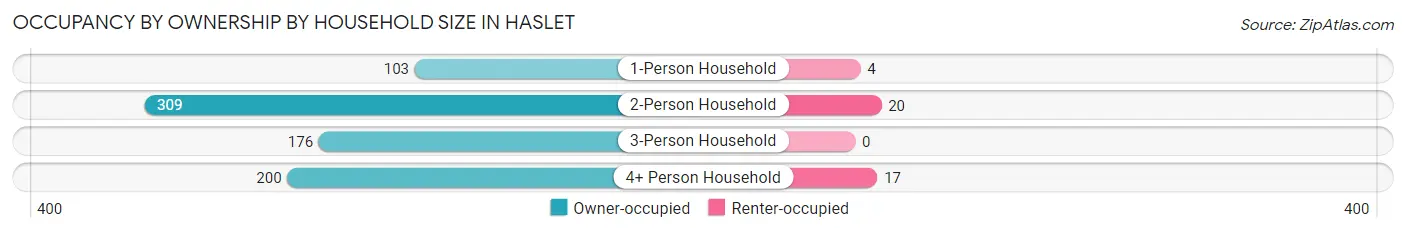
| Household Size | Owner-occupied | Renter-occupied |
| 1-Person Household | 103 (96.3%) | 4 (3.7%) |
| 2-Person Household | 309 (93.9%) | 20 (6.1%) |
| 3-Person Household | 176 (100.0%) | 0 (0.0%) |
| 4+ Person Household | 200 (92.2%) | 17 (7.8%) |
| Total Housing Units | 788 (95.1%) | 41 (5.0%) |
Occupancy by Educational Attainment in Haslet
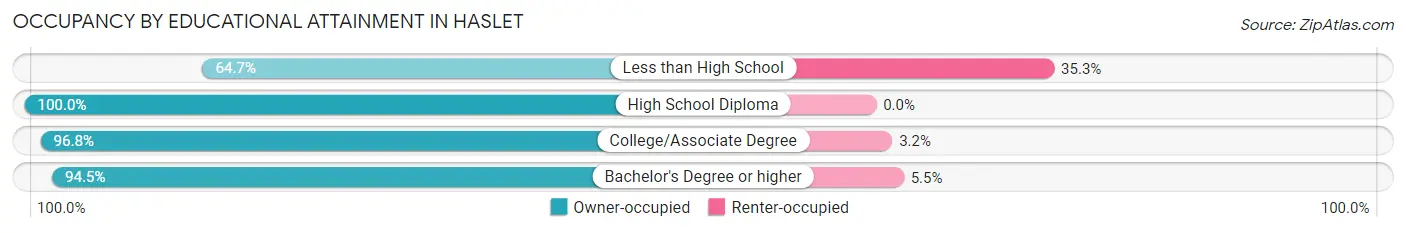
| Household Size | Owner-occupied | Renter-occupied |
| Less than High School | 22 (64.7%) | 12 (35.3%) |
| High School Diploma | 134 (100.0%) | 0 (0.0%) |
| College/Associate Degree | 303 (96.8%) | 10 (3.2%) |
| Bachelor's Degree or higher | 329 (94.5%) | 19 (5.5%) |
Occupancy by Age of Householder in Haslet
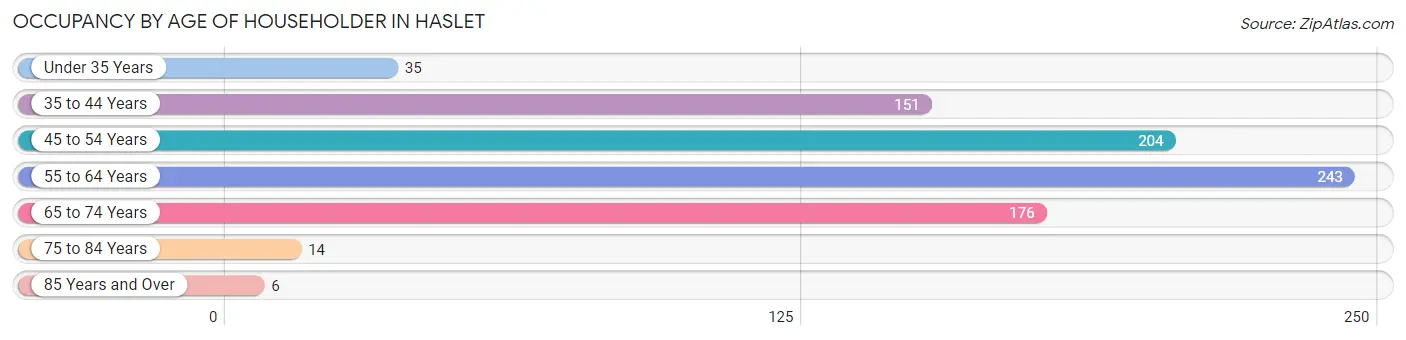
| Age Bracket | # Households | % Households |
| Under 35 Years | 35 | 4.2% |
| 35 to 44 Years | 151 | 18.2% |
| 45 to 54 Years | 204 | 24.6% |
| 55 to 64 Years | 243 | 29.3% |
| 65 to 74 Years | 176 | 21.2% |
| 75 to 84 Years | 14 | 1.7% |
| 85 Years and Over | 6 | 0.7% |
| Total | 829 | 100.0% |
Housing Finances in Haslet
Median Income by Occupancy in Haslet
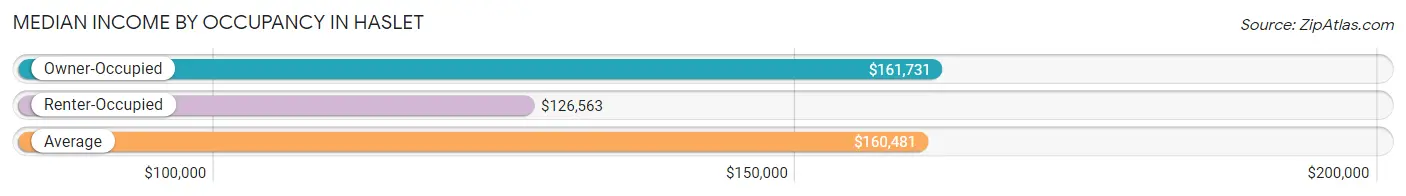
| Occupancy Type | # Households | Median Income |
| Owner-Occupied | 788 (95.1%) | $161,731 |
| Renter-Occupied | 41 (5.0%) | $126,563 |
| Average | 829 (100.0%) | $160,481 |
Occupancy by Householder Income Bracket in Haslet
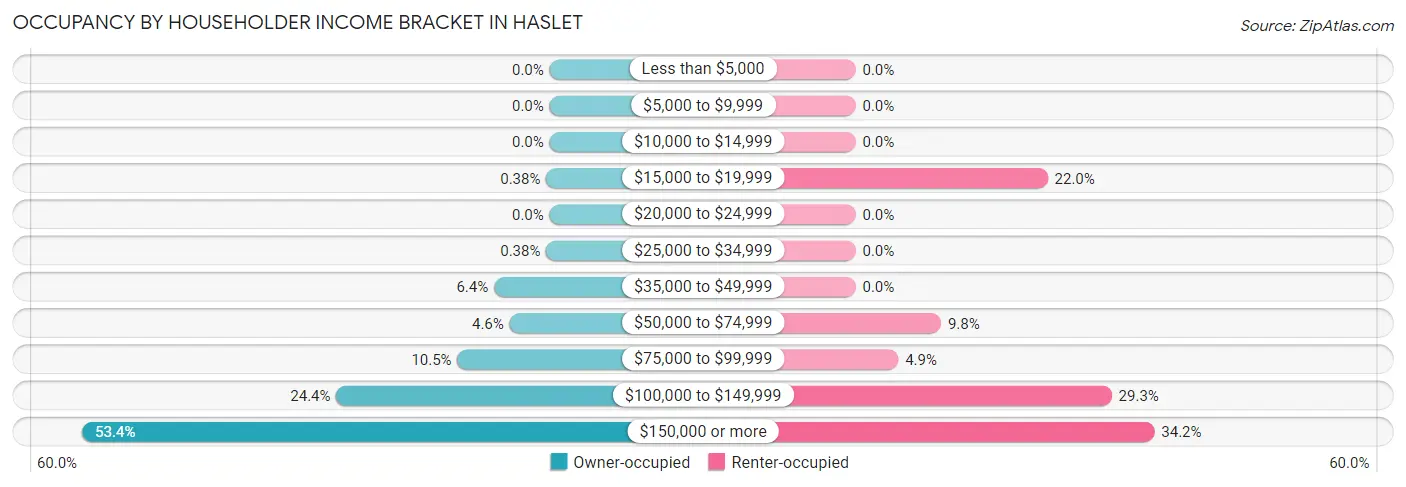
| Income Bracket | Owner-occupied | Renter-occupied |
| Less than $5,000 | 0 (0.0%) | 0 (0.0%) |
| $5,000 to $9,999 | 0 (0.0%) | 0 (0.0%) |
| $10,000 to $14,999 | 0 (0.0%) | 0 (0.0%) |
| $15,000 to $19,999 | 3 (0.4%) | 9 (22.0%) |
| $20,000 to $24,999 | 0 (0.0%) | 0 (0.0%) |
| $25,000 to $34,999 | 3 (0.4%) | 0 (0.0%) |
| $35,000 to $49,999 | 50 (6.4%) | 0 (0.0%) |
| $50,000 to $74,999 | 36 (4.6%) | 4 (9.8%) |
| $75,000 to $99,999 | 83 (10.5%) | 2 (4.9%) |
| $100,000 to $149,999 | 192 (24.4%) | 12 (29.3%) |
| $150,000 or more | 421 (53.4%) | 14 (34.2%) |
| Total | 788 (100.0%) | 41 (100.0%) |
Monthly Housing Cost Tiers in Haslet
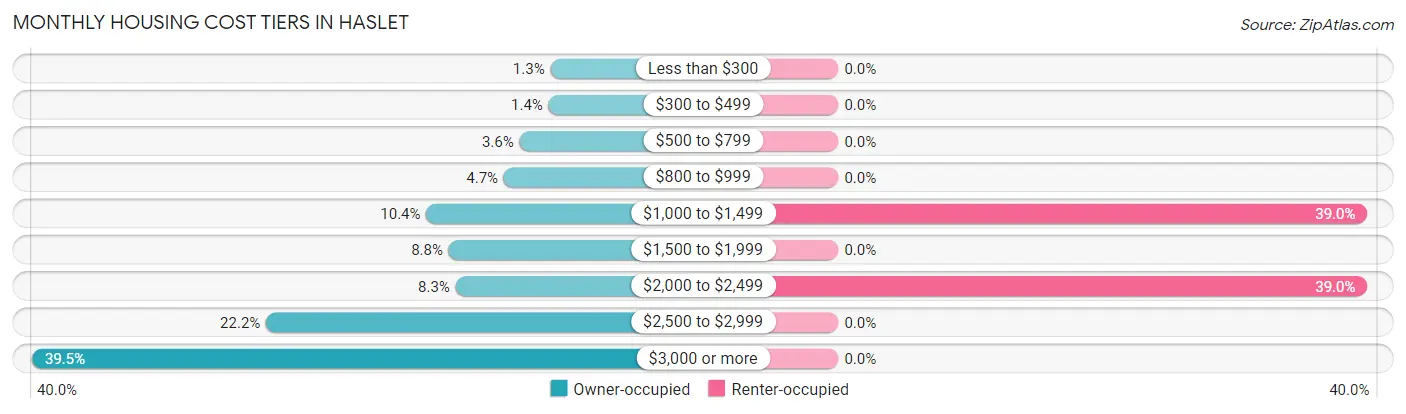
| Monthly Cost | Owner-occupied | Renter-occupied |
| Less than $300 | 10 (1.3%) | 0 (0.0%) |
| $300 to $499 | 11 (1.4%) | 0 (0.0%) |
| $500 to $799 | 28 (3.5%) | 0 (0.0%) |
| $800 to $999 | 37 (4.7%) | 0 (0.0%) |
| $1,000 to $1,499 | 82 (10.4%) | 16 (39.0%) |
| $1,500 to $1,999 | 69 (8.8%) | 0 (0.0%) |
| $2,000 to $2,499 | 65 (8.3%) | 16 (39.0%) |
| $2,500 to $2,999 | 175 (22.2%) | 0 (0.0%) |
| $3,000 or more | 311 (39.5%) | 0 (0.0%) |
| Total | 788 (100.0%) | 41 (100.0%) |
Physical Housing Characteristics in Haslet
Housing Structures in Haslet
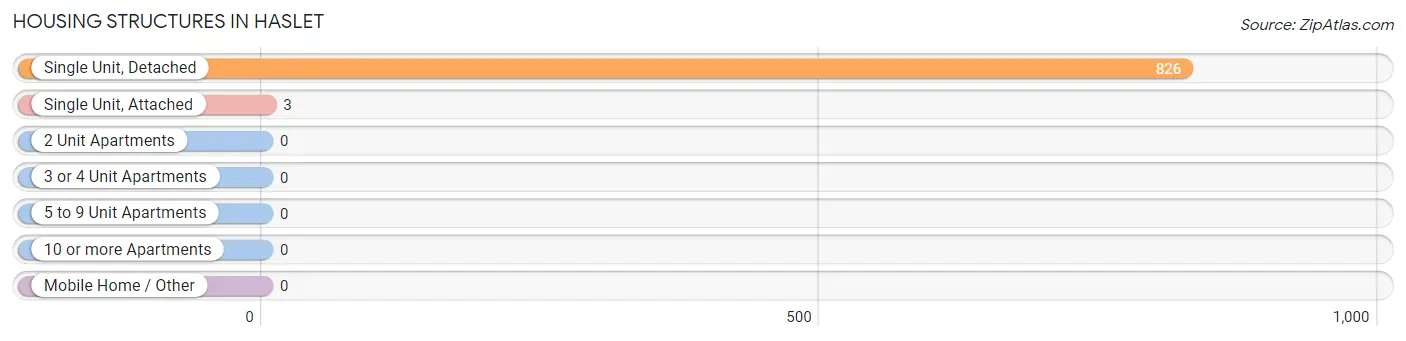
| Structure Type | # Housing Units | % Housing Units |
| Single Unit, Detached | 826 | 99.6% |
| Single Unit, Attached | 3 | 0.4% |
| 2 Unit Apartments | 0 | 0.0% |
| 3 or 4 Unit Apartments | 0 | 0.0% |
| 5 to 9 Unit Apartments | 0 | 0.0% |
| 10 or more Apartments | 0 | 0.0% |
| Mobile Home / Other | 0 | 0.0% |
| Total | 829 | 100.0% |
Housing Structures by Occupancy in Haslet
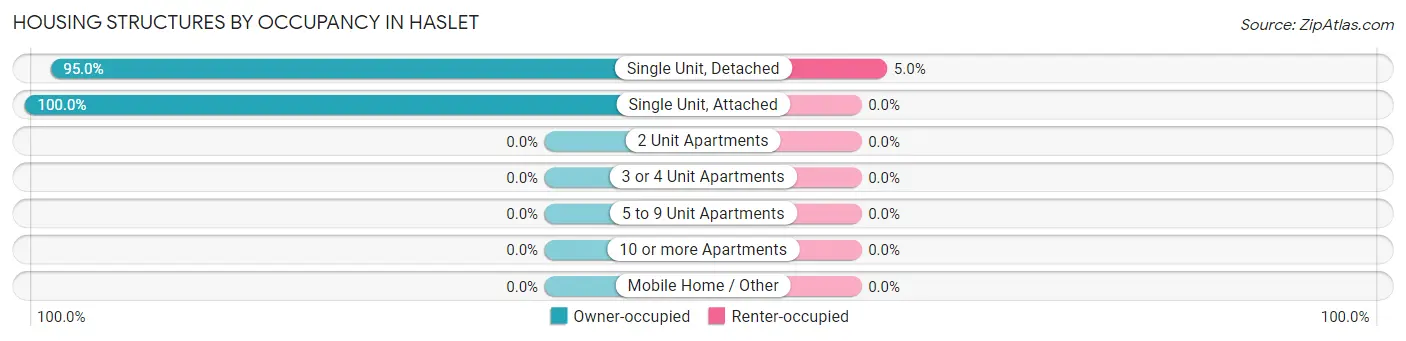
| Structure Type | Owner-occupied | Renter-occupied |
| Single Unit, Detached | 785 (95.0%) | 41 (5.0%) |
| Single Unit, Attached | 3 (100.0%) | 0 (0.0%) |
| 2 Unit Apartments | 0 (0.0%) | 0 (0.0%) |
| 3 or 4 Unit Apartments | 0 (0.0%) | 0 (0.0%) |
| 5 to 9 Unit Apartments | 0 (0.0%) | 0 (0.0%) |
| 10 or more Apartments | 0 (0.0%) | 0 (0.0%) |
| Mobile Home / Other | 0 (0.0%) | 0 (0.0%) |
| Total | 788 (95.1%) | 41 (5.0%) |
Housing Structures by Number of Rooms in Haslet
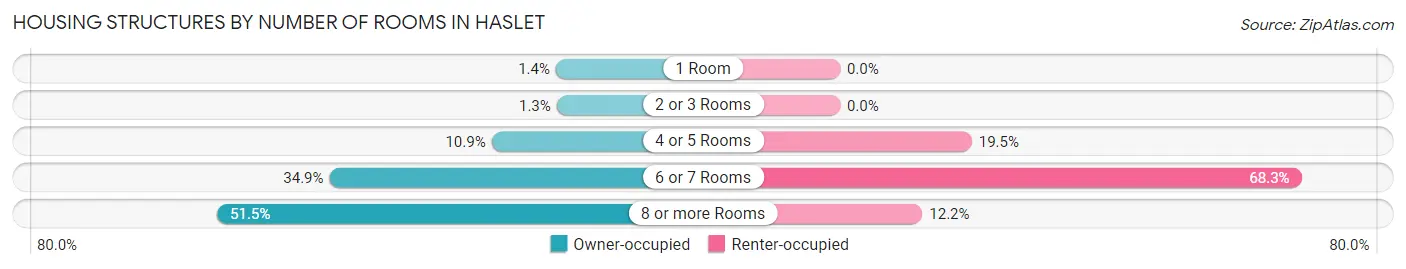
| Number of Rooms | Owner-occupied | Renter-occupied |
| 1 Room | 11 (1.4%) | 0 (0.0%) |
| 2 or 3 Rooms | 10 (1.3%) | 0 (0.0%) |
| 4 or 5 Rooms | 86 (10.9%) | 8 (19.5%) |
| 6 or 7 Rooms | 275 (34.9%) | 28 (68.3%) |
| 8 or more Rooms | 406 (51.5%) | 5 (12.2%) |
| Total | 788 (100.0%) | 41 (100.0%) |
Housing Structure by Heating Type in Haslet
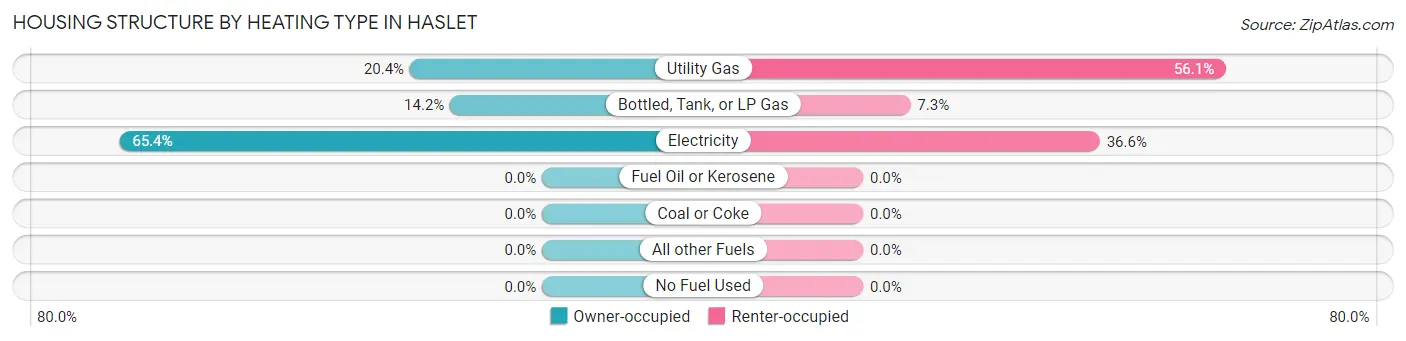
| Heating Type | Owner-occupied | Renter-occupied |
| Utility Gas | 161 (20.4%) | 23 (56.1%) |
| Bottled, Tank, or LP Gas | 112 (14.2%) | 3 (7.3%) |
| Electricity | 515 (65.4%) | 15 (36.6%) |
| Fuel Oil or Kerosene | 0 (0.0%) | 0 (0.0%) |
| Coal or Coke | 0 (0.0%) | 0 (0.0%) |
| All other Fuels | 0 (0.0%) | 0 (0.0%) |
| No Fuel Used | 0 (0.0%) | 0 (0.0%) |
| Total | 788 (100.0%) | 41 (100.0%) |
Household Vehicle Usage in Haslet
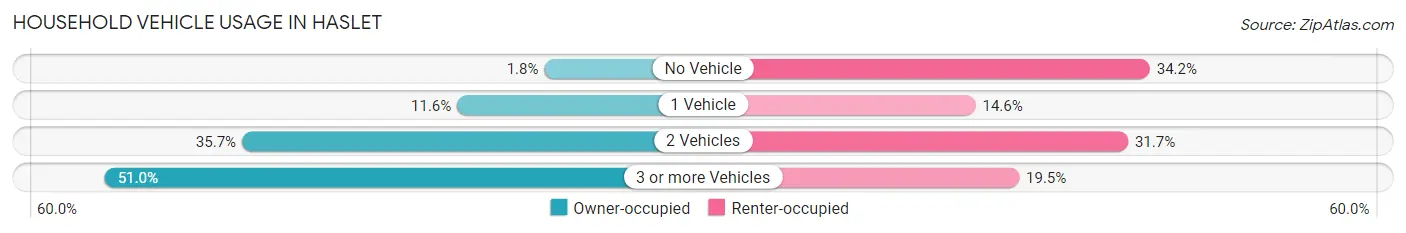
| Vehicles per Household | Owner-occupied | Renter-occupied |
| No Vehicle | 14 (1.8%) | 14 (34.2%) |
| 1 Vehicle | 91 (11.6%) | 6 (14.6%) |
| 2 Vehicles | 281 (35.7%) | 13 (31.7%) |
| 3 or more Vehicles | 402 (51.0%) | 8 (19.5%) |
| Total | 788 (100.0%) | 41 (100.0%) |
Real Estate & Mortgages in Haslet
Real Estate and Mortgage Overview in Haslet
| Characteristic | Without Mortgage | With Mortgage |
| Housing Units | 183 | 605 |
| Median Property Value | $453,900 | $534,300 |
| Median Household Income | $108,542 | $370 |
| Monthly Housing Costs | $1,018 | $311 |
| Real Estate Taxes | $6,085 | $10 |
Property Value by Mortgage Status in Haslet
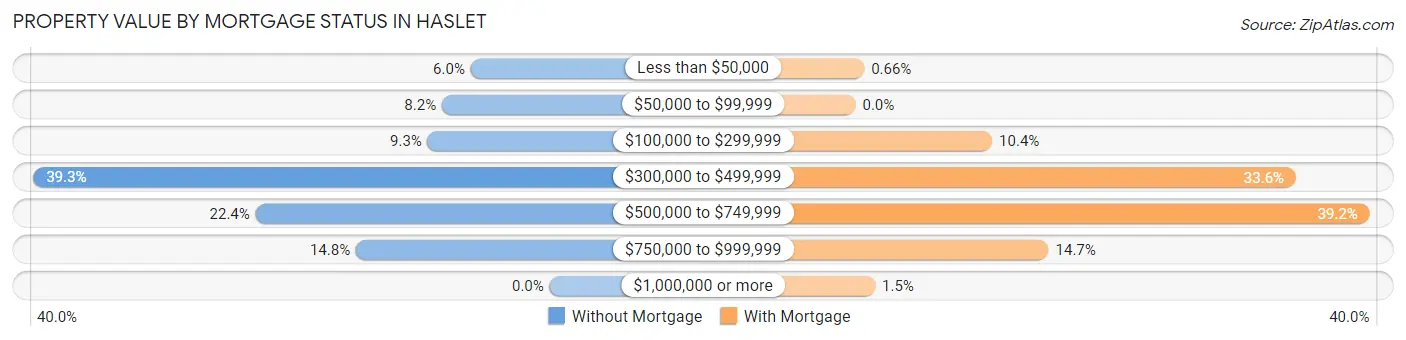
| Property Value | Without Mortgage | With Mortgage |
| Less than $50,000 | 11 (6.0%) | 4 (0.7%) |
| $50,000 to $99,999 | 15 (8.2%) | 0 (0.0%) |
| $100,000 to $299,999 | 17 (9.3%) | 63 (10.4%) |
| $300,000 to $499,999 | 72 (39.3%) | 203 (33.6%) |
| $500,000 to $749,999 | 41 (22.4%) | 237 (39.2%) |
| $750,000 to $999,999 | 27 (14.7%) | 89 (14.7%) |
| $1,000,000 or more | 0 (0.0%) | 9 (1.5%) |
| Total | 183 (100.0%) | 605 (100.0%) |
Household Income by Mortgage Status in Haslet
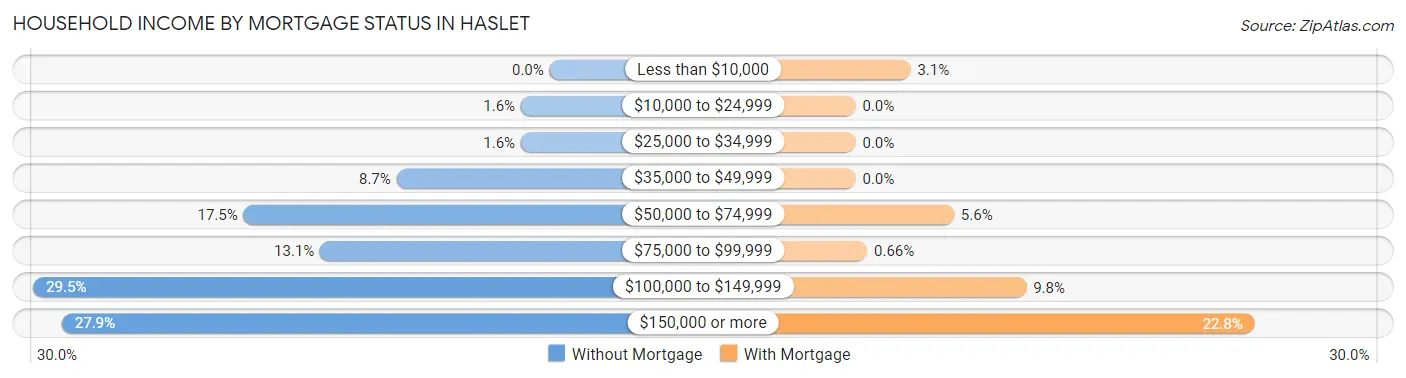
| Household Income | Without Mortgage | With Mortgage |
| Less than $10,000 | 0 (0.0%) | 19 (3.1%) |
| $10,000 to $24,999 | 3 (1.6%) | 0 (0.0%) |
| $25,000 to $34,999 | 3 (1.6%) | 0 (0.0%) |
| $35,000 to $49,999 | 16 (8.7%) | 0 (0.0%) |
| $50,000 to $74,999 | 32 (17.5%) | 34 (5.6%) |
| $75,000 to $99,999 | 24 (13.1%) | 4 (0.7%) |
| $100,000 to $149,999 | 54 (29.5%) | 59 (9.8%) |
| $150,000 or more | 51 (27.9%) | 138 (22.8%) |
| Total | 183 (100.0%) | 605 (100.0%) |
Property Value to Household Income Ratio in Haslet
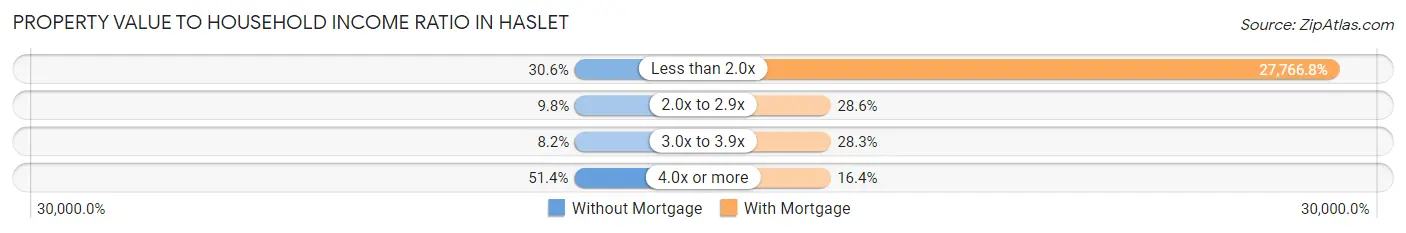
| Value-to-Income Ratio | Without Mortgage | With Mortgage |
| Less than 2.0x | 56 (30.6%) | 167,989 (27,766.8%) |
| 2.0x to 2.9x | 18 (9.8%) | 173 (28.6%) |
| 3.0x to 3.9x | 15 (8.2%) | 171 (28.3%) |
| 4.0x or more | 94 (51.4%) | 99 (16.4%) |
| Total | 183 (100.0%) | 605 (100.0%) |
Real Estate Taxes by Mortgage Status in Haslet
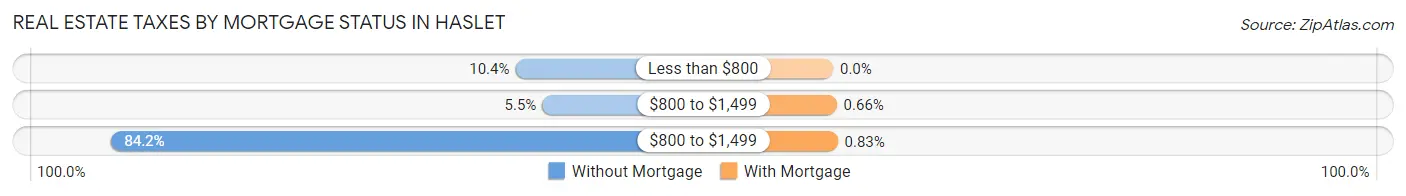
| Property Taxes | Without Mortgage | With Mortgage |
| Less than $800 | 19 (10.4%) | 0 (0.0%) |
| $800 to $1,499 | 10 (5.5%) | 4 (0.7%) |
| $800 to $1,499 | 154 (84.2%) | 5 (0.8%) |
| Total | 183 (100.0%) | 605 (100.0%) |
Health & Disability in Haslet
Health Insurance Coverage by Age in Haslet
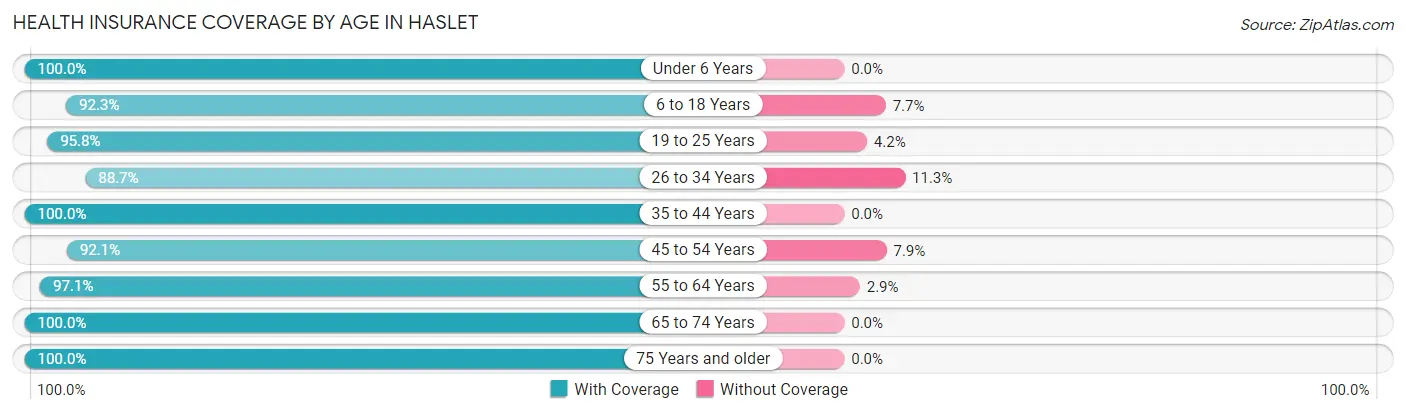
| Age Bracket | With Coverage | Without Coverage |
| Under 6 Years | 95 (100.0%) | 0 (0.0%) |
| 6 to 18 Years | 394 (92.3%) | 33 (7.7%) |
| 19 to 25 Years | 159 (95.8%) | 7 (4.2%) |
| 26 to 34 Years | 86 (88.7%) | 11 (11.3%) |
| 35 to 44 Years | 251 (100.0%) | 0 (0.0%) |
| 45 to 54 Years | 386 (92.1%) | 33 (7.9%) |
| 55 to 64 Years | 437 (97.1%) | 13 (2.9%) |
| 65 to 74 Years | 295 (100.0%) | 0 (0.0%) |
| 75 Years and older | 136 (100.0%) | 0 (0.0%) |
| Total | 2,239 (95.9%) | 97 (4.2%) |
Health Insurance Coverage by Citizenship Status in Haslet
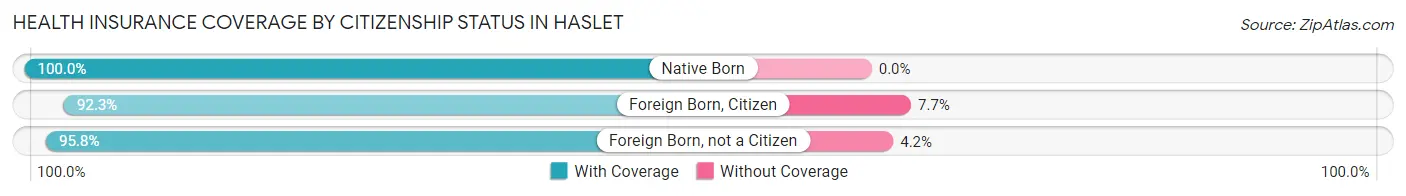
| Citizenship Status | With Coverage | Without Coverage |
| Native Born | 95 (100.0%) | 0 (0.0%) |
| Foreign Born, Citizen | 394 (92.3%) | 33 (7.7%) |
| Foreign Born, not a Citizen | 159 (95.8%) | 7 (4.2%) |
Health Insurance Coverage by Household Income in Haslet
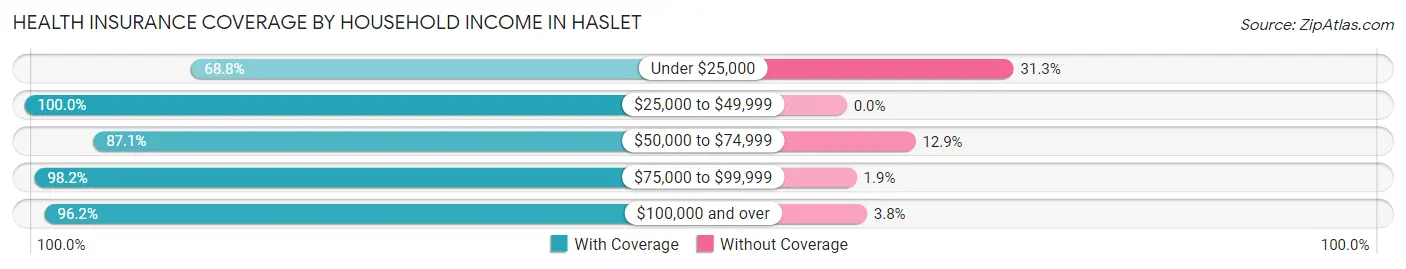
| Household Income | With Coverage | Without Coverage |
| Under $25,000 | 22 (68.8%) | 10 (31.2%) |
| $25,000 to $49,999 | 77 (100.0%) | 0 (0.0%) |
| $50,000 to $74,999 | 61 (87.1%) | 9 (12.9%) |
| $75,000 to $99,999 | 159 (98.2%) | 3 (1.8%) |
| $100,000 and over | 1,920 (96.2%) | 75 (3.8%) |
Public vs Private Health Insurance Coverage by Age in Haslet
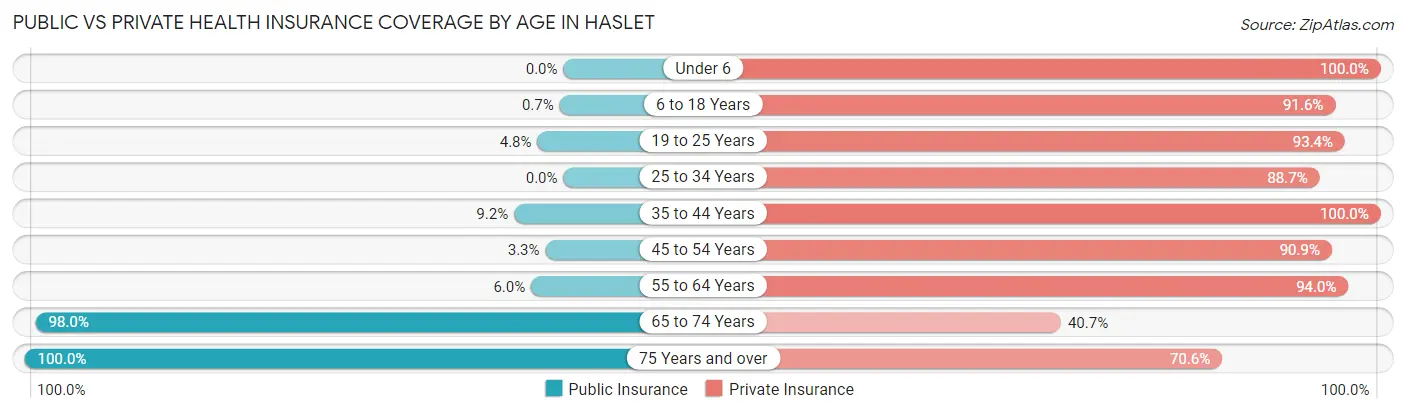
| Age Bracket | Public Insurance | Private Insurance |
| Under 6 | 0 (0.0%) | 95 (100.0%) |
| 6 to 18 Years | 3 (0.7%) | 391 (91.6%) |
| 19 to 25 Years | 8 (4.8%) | 155 (93.4%) |
| 25 to 34 Years | 0 (0.0%) | 86 (88.7%) |
| 35 to 44 Years | 23 (9.2%) | 251 (100.0%) |
| 45 to 54 Years | 14 (3.3%) | 381 (90.9%) |
| 55 to 64 Years | 27 (6.0%) | 423 (94.0%) |
| 65 to 74 Years | 289 (98.0%) | 120 (40.7%) |
| 75 Years and over | 136 (100.0%) | 96 (70.6%) |
| Total | 500 (21.4%) | 1,998 (85.5%) |
Disability Status by Sex by Age in Haslet
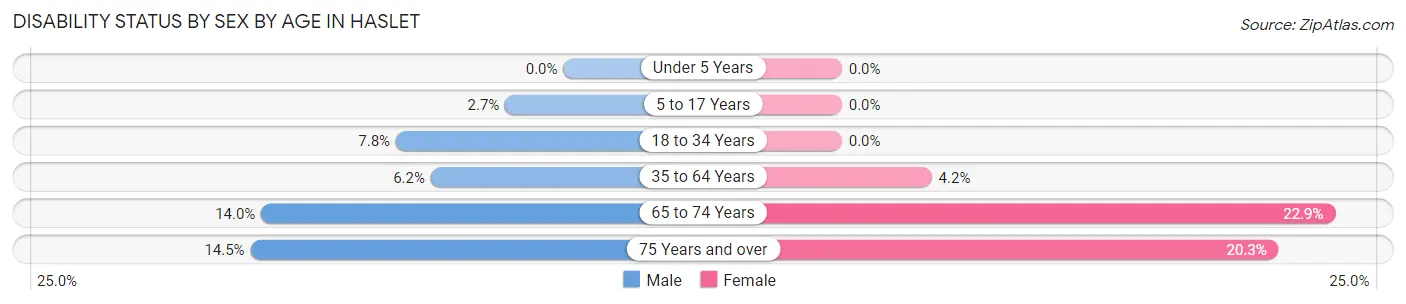
| Age Bracket | Male | Female |
| Under 5 Years | 0 (0.0%) | 0 (0.0%) |
| 5 to 17 Years | 6 (2.7%) | 0 (0.0%) |
| 18 to 34 Years | 16 (7.8%) | 0 (0.0%) |
| 35 to 64 Years | 32 (6.1%) | 25 (4.2%) |
| 65 to 74 Years | 23 (14.0%) | 30 (22.9%) |
| 75 Years and over | 9 (14.5%) | 15 (20.3%) |
Disability Class by Sex by Age in Haslet
Disability Class: Hearing Difficulty
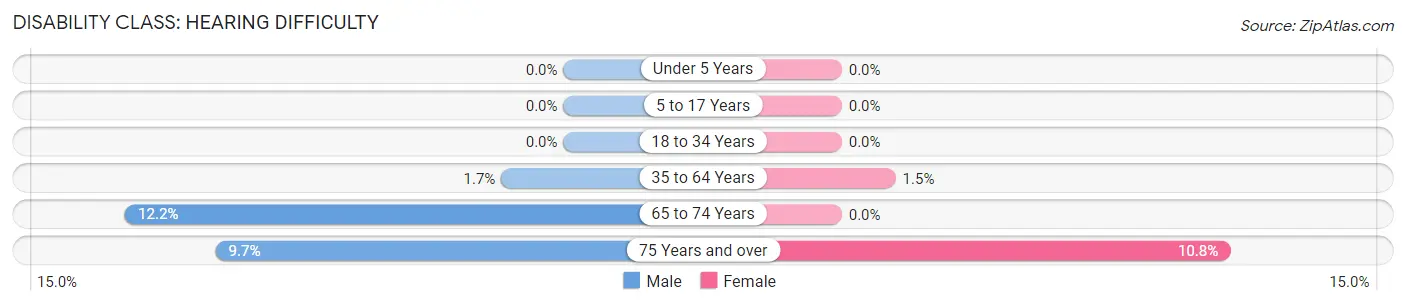
| Age Bracket | Male | Female |
| Under 5 Years | 0 (0.0%) | 0 (0.0%) |
| 5 to 17 Years | 0 (0.0%) | 0 (0.0%) |
| 18 to 34 Years | 0 (0.0%) | 0 (0.0%) |
| 35 to 64 Years | 9 (1.7%) | 9 (1.5%) |
| 65 to 74 Years | 20 (12.2%) | 0 (0.0%) |
| 75 Years and over | 6 (9.7%) | 8 (10.8%) |
Disability Class: Vision Difficulty
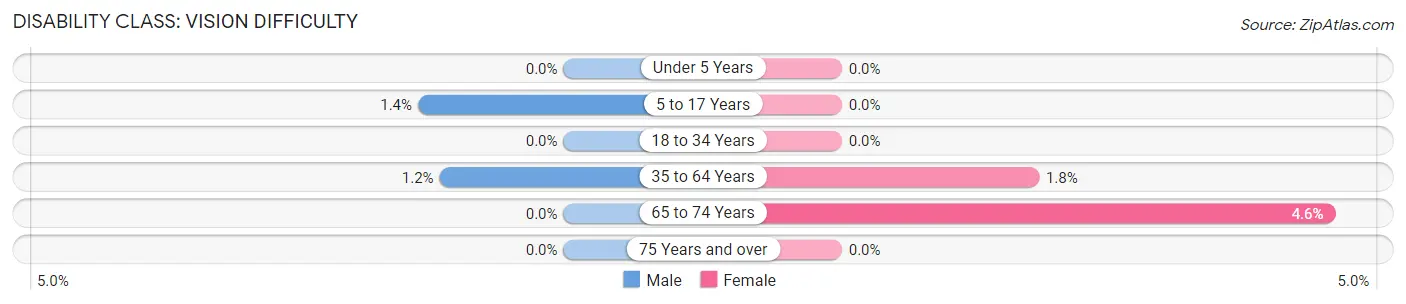
| Age Bracket | Male | Female |
| Under 5 Years | 0 (0.0%) | 0 (0.0%) |
| 5 to 17 Years | 3 (1.3%) | 0 (0.0%) |
| 18 to 34 Years | 0 (0.0%) | 0 (0.0%) |
| 35 to 64 Years | 6 (1.1%) | 11 (1.8%) |
| 65 to 74 Years | 0 (0.0%) | 6 (4.6%) |
| 75 Years and over | 0 (0.0%) | 0 (0.0%) |
Disability Class: Cognitive Difficulty
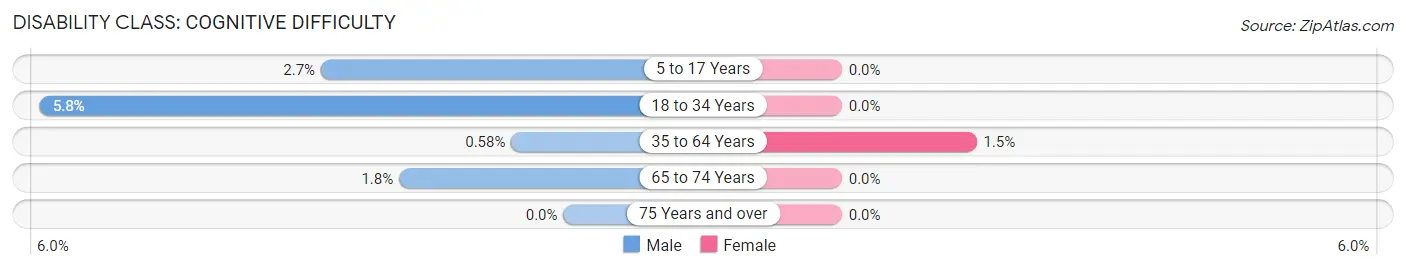
| Age Bracket | Male | Female |
| 5 to 17 Years | 6 (2.7%) | 0 (0.0%) |
| 18 to 34 Years | 12 (5.8%) | 0 (0.0%) |
| 35 to 64 Years | 3 (0.6%) | 9 (1.5%) |
| 65 to 74 Years | 3 (1.8%) | 0 (0.0%) |
| 75 Years and over | 0 (0.0%) | 0 (0.0%) |
Disability Class: Ambulatory Difficulty
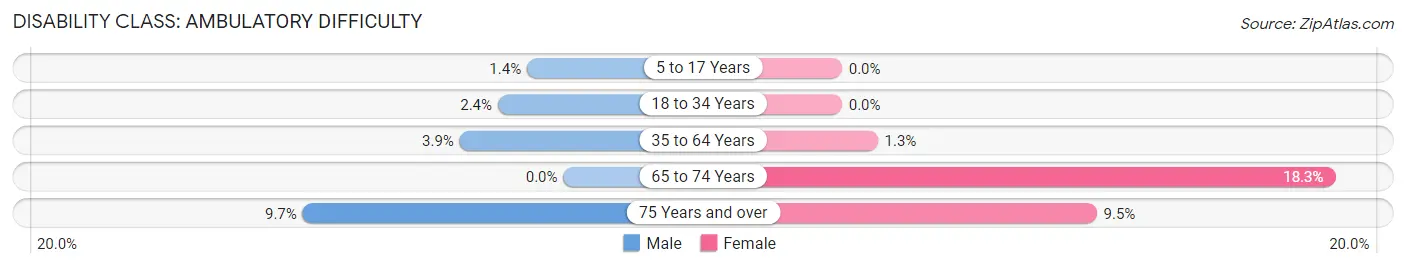
| Age Bracket | Male | Female |
| 5 to 17 Years | 3 (1.3%) | 0 (0.0%) |
| 18 to 34 Years | 5 (2.4%) | 0 (0.0%) |
| 35 to 64 Years | 20 (3.8%) | 8 (1.3%) |
| 65 to 74 Years | 0 (0.0%) | 24 (18.3%) |
| 75 Years and over | 6 (9.7%) | 7 (9.5%) |
Disability Class: Self-Care Difficulty
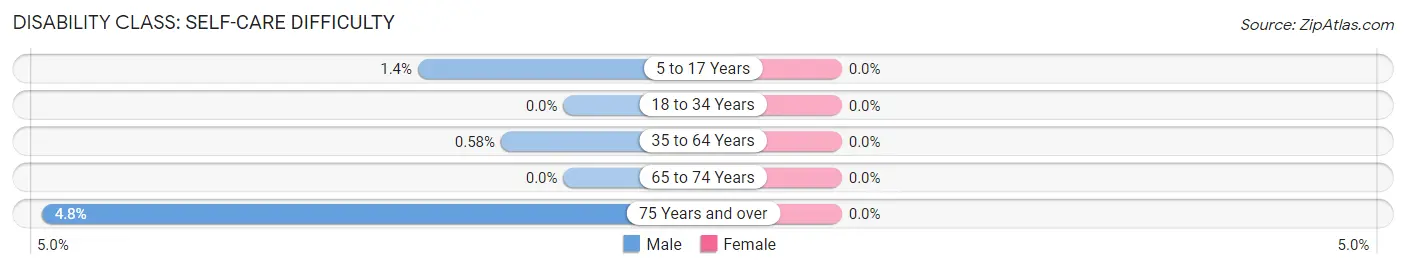
| Age Bracket | Male | Female |
| 5 to 17 Years | 3 (1.3%) | 0 (0.0%) |
| 18 to 34 Years | 0 (0.0%) | 0 (0.0%) |
| 35 to 64 Years | 3 (0.6%) | 0 (0.0%) |
| 65 to 74 Years | 0 (0.0%) | 0 (0.0%) |
| 75 Years and over | 3 (4.8%) | 0 (0.0%) |
Technology Access in Haslet
Computing Device Access in Haslet
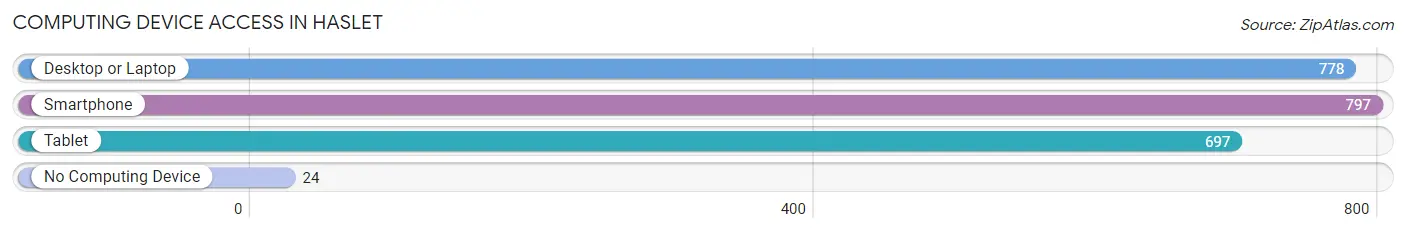
| Device Type | # Households | % Households |
| Desktop or Laptop | 778 | 93.9% |
| Smartphone | 797 | 96.1% |
| Tablet | 697 | 84.1% |
| No Computing Device | 24 | 2.9% |
| Total | 829 | 100.0% |
Internet Access in Haslet
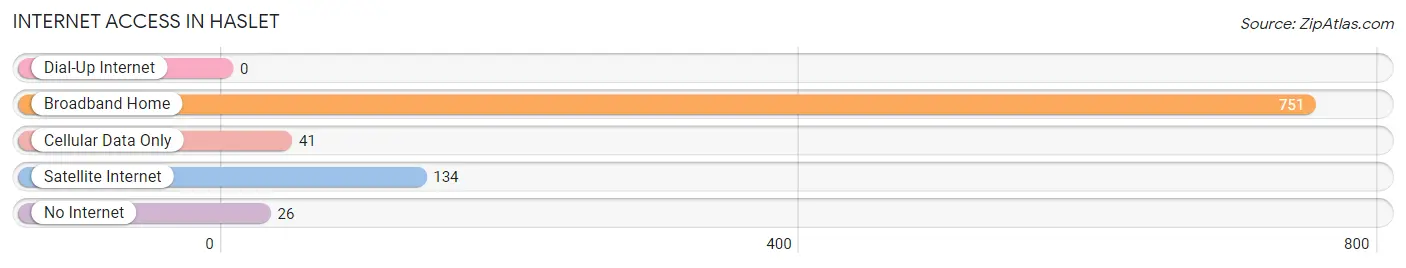
| Internet Type | # Households | % Households |
| Dial-Up Internet | 0 | 0.0% |
| Broadband Home | 751 | 90.6% |
| Cellular Data Only | 41 | 5.0% |
| Satellite Internet | 134 | 16.2% |
| No Internet | 26 | 3.1% |
| Total | 829 | 100.0% |
Haslet Summary
Haslet is a small town located in Tarrant County, Texas, United States. It is part of the Dallas-Fort Worth-Arlington metropolitan area. The population was 1,126 at the 2010 census.
History
Haslet was founded in 1881 by William Haslet, a former Confederate soldier. He named the town after himself and it was incorporated in 1925. The town was originally a farming community, but it has since grown to include a variety of businesses.
Geography
Haslet is located at 33°6'25" North, 97°20'25" West (33.106944, -97.340278). It is situated in the northwest corner of Tarrant County, approximately 20 miles north of downtown Fort Worth. The town is bordered by the cities of Roanoke, Trophy Club, and Justin.
The town has a total area of 1.2 square miles, all of which is land. The terrain is mostly flat, with some rolling hills. The climate is humid subtropical, with hot summers and mild winters.
Economy
The economy of Haslet is largely based on agriculture and light industry. The town is home to several small businesses, including a feed store, a hardware store, and a few restaurants. The town also has a few small manufacturing plants.
The median household income in Haslet is $68,944, and the median family income is $76,944. The unemployment rate is 4.2%, which is lower than the national average.
Demographics
As of the 2010 census, there were 1,126 people, 393 households, and 327 families residing in Haslet. The population density was 937.5 people per square mile. The racial makeup of the town was 94.2% White, 0.7% African American, 0.2% Native American, 0.7% Asian, 0.1% Pacific Islander, 2.3% from other races, and 1.9% from two or more races. Hispanic or Latino of any race were 6.2% of the population.
The median age in Haslet is 37.3 years. About 24.3% of residents are under the age of 18, and 8.2% are 65 years or older. The gender makeup of the town is 48.7% male and 51.3% female.
The median home value in Haslet is $220,000, and the median rent is $1,200. About 79.2% of residents own their homes, and 20.8% rent. The median household income is $68,944, and the median family income is $76,944. The per capita income is $30,944.
Common Questions
What is Per Capita Income in Haslet?
Per Capita income in Haslet is $71,200.
What is the Median Family Income in Haslet?
Median Family Income in Haslet is $166,534.
What is the Median Household income in Haslet?
Median Household Income in Haslet is $160,481.
What is Income or Wage Gap in Haslet?
Income or Wage Gap in Haslet is 26.6%.
Women in Haslet earn 73.4 cents for every dollar earned by a man.
What is Inequality or Gini Index in Haslet?
Inequality or Gini Index in Haslet is 0.38.
What is the Total Population of Haslet?
Total Population of Haslet is 2,336.
What is the Total Male Population of Haslet?
Total Male Population of Haslet is 1,199.
What is the Total Female Population of Haslet?
Total Female Population of Haslet is 1,137.
What is the Ratio of Males per 100 Females in Haslet?
There are 105.45 Males per 100 Females in Haslet.
What is the Ratio of Females per 100 Males in Haslet?
There are 94.83 Females per 100 Males in Haslet.
What is the Median Population Age in Haslet?
Median Population Age in Haslet is 48.6 Years.
What is the Average Family Size in Haslet
Average Family Size in Haslet is 3.1 People.
What is the Average Household Size in Haslet
Average Household Size in Haslet is 2.8 People.
How Large is the Labor Force in Haslet?
There are 1,340 People in the Labor Forcein in Haslet.
What is the Percentage of People in the Labor Force in Haslet?
68.0% of People are in the Labor Force in Haslet.
What is the Unemployment Rate in Haslet?
Unemployment Rate in Haslet is 0.4%.