Celina, TX Map & Demographics
Celina Map
Celina Overview
$55,125
PER CAPITA INCOME
$149,971
AVG FAMILY INCOME
$142,643
AVG HOUSEHOLD INCOME
35.6%
WAGE / INCOME GAP [ % ]
64.4¢/ $1
WAGE / INCOME GAP [ $ ]
0.42
INEQUALITY / GINI INDEX
21,501
TOTAL POPULATION
11,566
MALE POPULATION
9,935
FEMALE POPULATION
116.42
MALES / 100 FEMALES
85.90
FEMALES / 100 MALES
36.1
MEDIAN AGE
3.2
AVG FAMILY SIZE
3.0
AVG HOUSEHOLD SIZE
11,167
LABOR FORCE [ PEOPLE ]
69.1%
PERCENT IN LABOR FORCE
1.6%
UNEMPLOYMENT RATE
Celina Zip Codes
Income in Celina
Income Overview in Celina
Per Capita Income in Celina is $55,125, while median incomes of families and households are $149,971 and $142,643 respectively.
| Characteristic | Number | Measure |
| Per Capita Income | 21,501 | $55,125 |
| Median Family Income | 6,241 | $149,971 |
| Mean Family Income | 6,241 | $180,138 |
| Median Household Income | 7,008 | $142,643 |
| Mean Household Income | 7,008 | $167,916 |
| Income Deficit | 6,241 | $0 |
| Wage / Income Gap (%) | 21,501 | 35.56% |
| Wage / Income Gap ($) | 21,501 | 64.44¢ per $1 |
| Gini / Inequality Index | 21,501 | 0.42 |
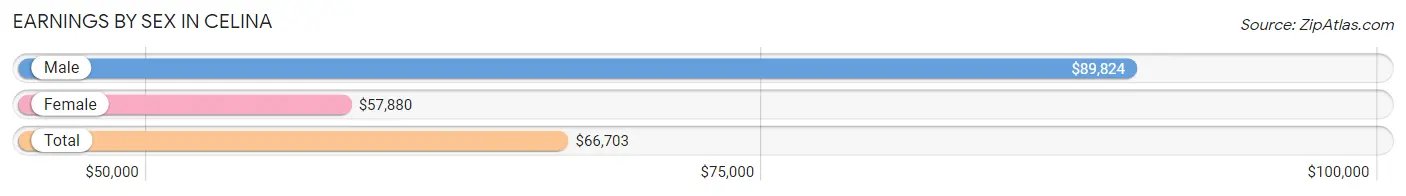
Earnings by Sex in Celina
Average Earnings in Celina are $66,703, $89,824 for men and $57,880 for women, a difference of 35.6%.
| Sex | Number | Average Earnings |
| Male | 6,511 (56.5%) | $89,824 |
| Female | 5,012 (43.5%) | $57,880 |
| Total | 11,523 (100.0%) | $66,703 |
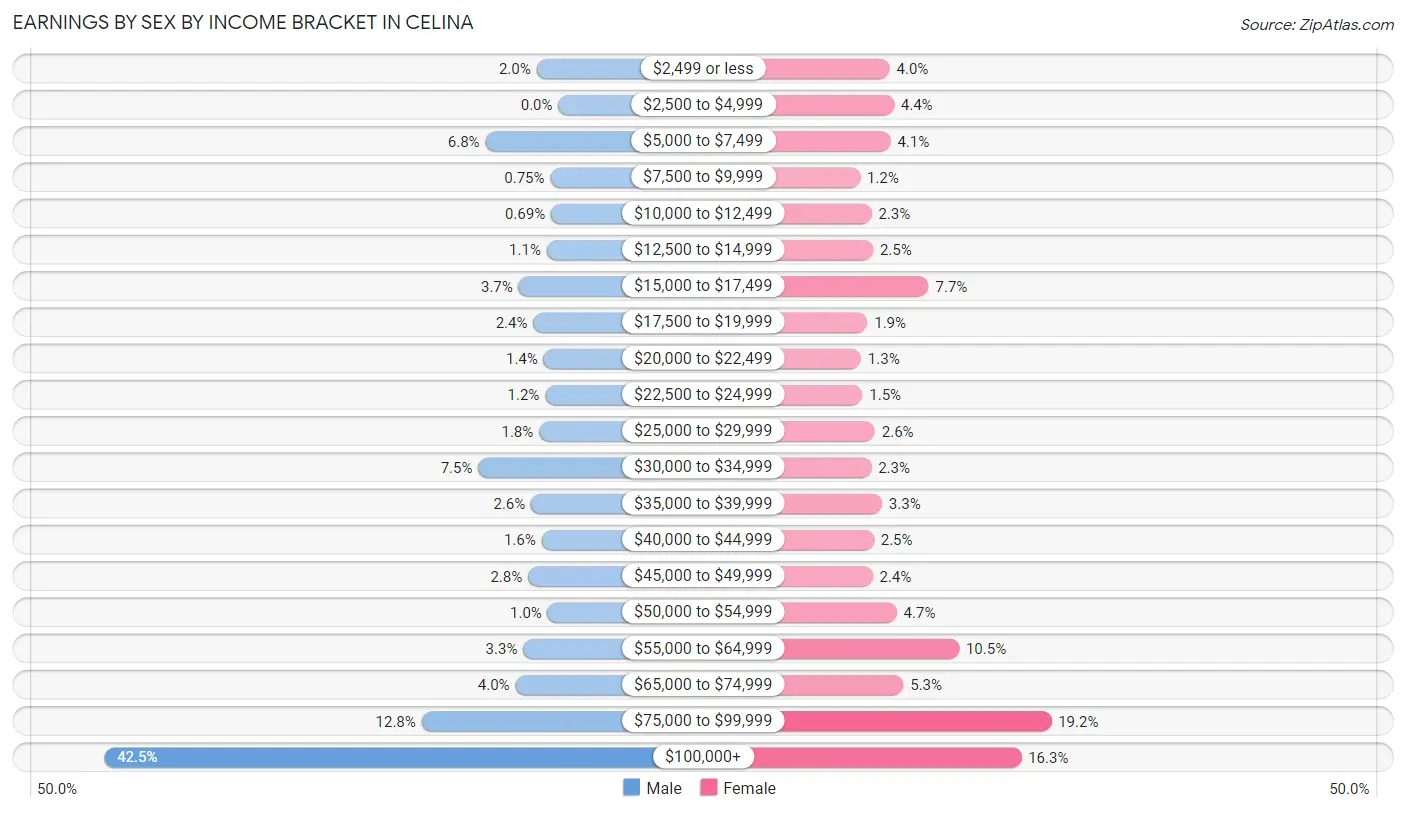
Earnings by Sex by Income Bracket in Celina
The most common earnings brackets in Celina are $100,000+ for men (2,770 | 42.5%) and $75,000 to $99,999 for women (960 | 19.2%).
| Income | Male | Female |
| $2,499 or less | 133 (2.0%) | 201 (4.0%) |
| $2,500 to $4,999 | 0 (0.0%) | 221 (4.4%) |
| $5,000 to $7,499 | 445 (6.8%) | 205 (4.1%) |
| $7,500 to $9,999 | 49 (0.7%) | 62 (1.2%) |
| $10,000 to $12,499 | 45 (0.7%) | 116 (2.3%) |
| $12,500 to $14,999 | 71 (1.1%) | 123 (2.5%) |
| $15,000 to $17,499 | 242 (3.7%) | 384 (7.7%) |
| $17,500 to $19,999 | 153 (2.4%) | 96 (1.9%) |
| $20,000 to $22,499 | 90 (1.4%) | 66 (1.3%) |
| $22,500 to $24,999 | 80 (1.2%) | 73 (1.5%) |
| $25,000 to $29,999 | 117 (1.8%) | 132 (2.6%) |
| $30,000 to $34,999 | 488 (7.5%) | 115 (2.3%) |
| $35,000 to $39,999 | 166 (2.5%) | 165 (3.3%) |
| $40,000 to $44,999 | 102 (1.6%) | 127 (2.5%) |
| $45,000 to $49,999 | 185 (2.8%) | 121 (2.4%) |
| $50,000 to $54,999 | 65 (1.0%) | 234 (4.7%) |
| $55,000 to $64,999 | 214 (3.3%) | 527 (10.5%) |
| $65,000 to $74,999 | 262 (4.0%) | 265 (5.3%) |
| $75,000 to $99,999 | 834 (12.8%) | 960 (19.2%) |
| $100,000+ | 2,770 (42.5%) | 819 (16.3%) |
| Total | 6,511 (100.0%) | 5,012 (100.0%) |
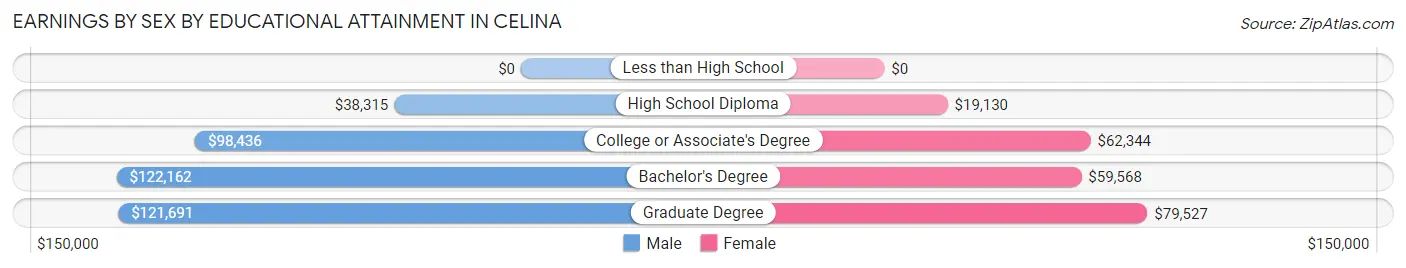
Earnings by Sex by Educational Attainment in Celina
Average earnings in Celina are $98,337 for men and $60,293 for women, a difference of 38.7%. Men with an educational attainment of bachelor's degree enjoy the highest average annual earnings of $122,162, while those with high school diploma education earn the least with $38,315. Women with an educational attainment of graduate degree earn the most with the average annual earnings of $79,527, while those with high school diploma education have the smallest earnings of $19,130.
| Educational Attainment | Male Income | Female Income |
| Less than High School | - | - |
| High School Diploma | $38,315 | $19,130 |
| College or Associate's Degree | $98,436 | $62,344 |
| Bachelor's Degree | $122,162 | $59,568 |
| Graduate Degree | $121,691 | $79,527 |
| Total | $98,337 | $60,293 |
Family Income in Celina
Family Income Brackets in Celina
According to the Celina family income data, there are 1,941 families falling into the $200,000+ income range, which is the most common income bracket and makes up 31.1% of all families.
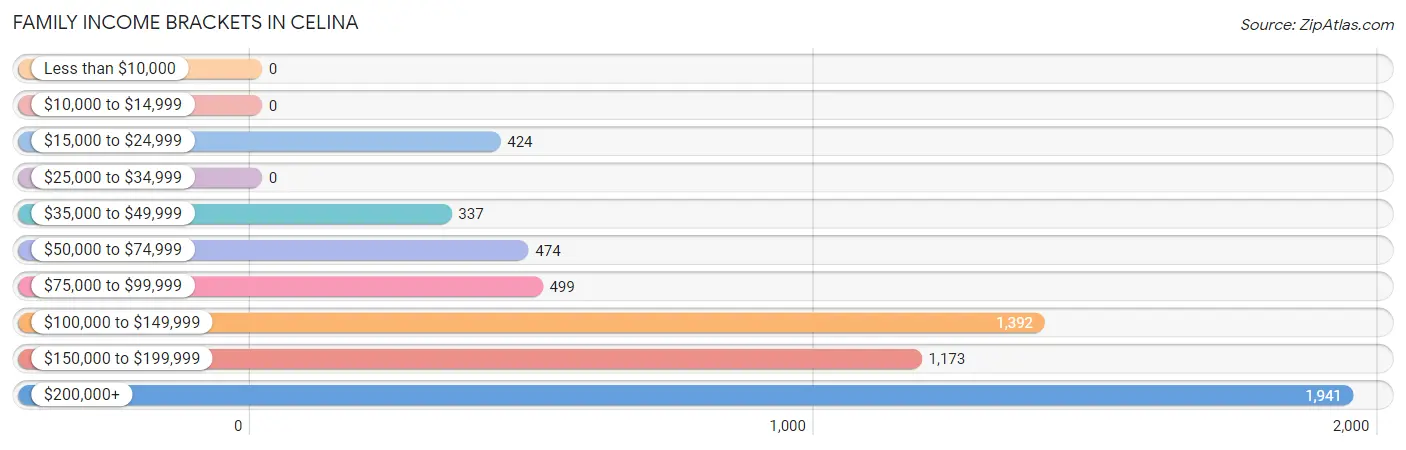
| Income Bracket | # Families | % Families |
| Less than $10,000 | 0 | 0.0% |
| $10,000 to $14,999 | 0 | 0.0% |
| $15,000 to $24,999 | 424 | 6.8% |
| $25,000 to $34,999 | 0 | 0.0% |
| $35,000 to $49,999 | 337 | 5.4% |
| $50,000 to $74,999 | 474 | 7.6% |
| $75,000 to $99,999 | 499 | 8.0% |
| $100,000 to $149,999 | 1,392 | 22.3% |
| $150,000 to $199,999 | 1,173 | 18.8% |
| $200,000+ | 1,941 | 31.1% |
Family Income by Famaliy Size in Celina
5-person families (990 | 15.9%) account for the highest median family income in Celina with $164,435 per family, while 2-person families (2,049 | 32.8%) have the highest median income of $74,317 per family member.
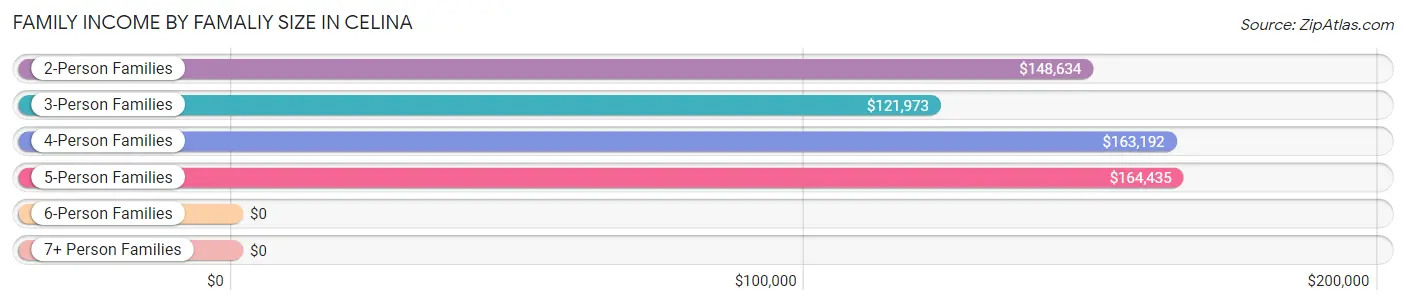
| Income Bracket | # Families | Median Income |
| 2-Person Families | 2,049 (32.8%) | $148,634 |
| 3-Person Families | 1,513 (24.2%) | $121,973 |
| 4-Person Families | 1,628 (26.1%) | $163,192 |
| 5-Person Families | 990 (15.9%) | $164,435 |
| 6-Person Families | 38 (0.6%) | $0 |
| 7+ Person Families | 23 (0.4%) | $0 |
| Total | 6,241 (100.0%) | $149,971 |
Family Income by Number of Earners in Celina
The median family income in Celina is $149,971, with families comprising 2 earners (2,827) having the highest median family income of $164,110, while families with no earners (200) have the lowest median family income of $69,315, accounting for 45.3% and 3.2% of families, respectively.
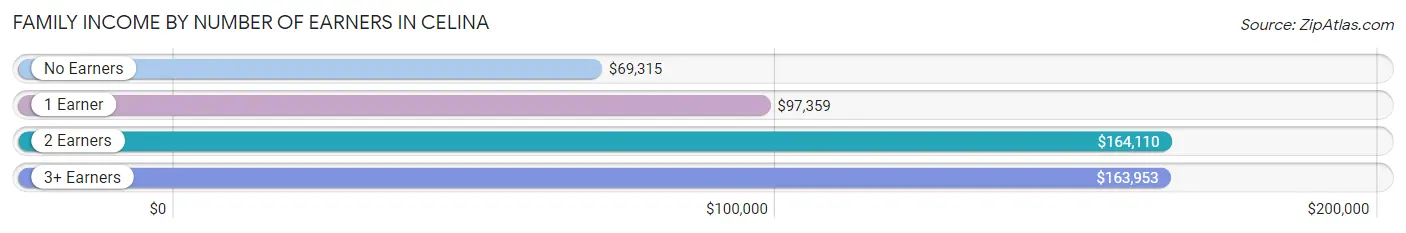
| Number of Earners | # Families | Median Income |
| No Earners | 200 (3.2%) | $69,315 |
| 1 Earner | 2,250 (36.0%) | $97,359 |
| 2 Earners | 2,827 (45.3%) | $164,110 |
| 3+ Earners | 964 (15.4%) | $163,953 |
| Total | 6,241 (100.0%) | $149,971 |
Household Income in Celina
Household Income Brackets in Celina
With 1,997 households falling in the category, the $200,000+ income range is the most frequent in Celina, accounting for 28.5% of all households.
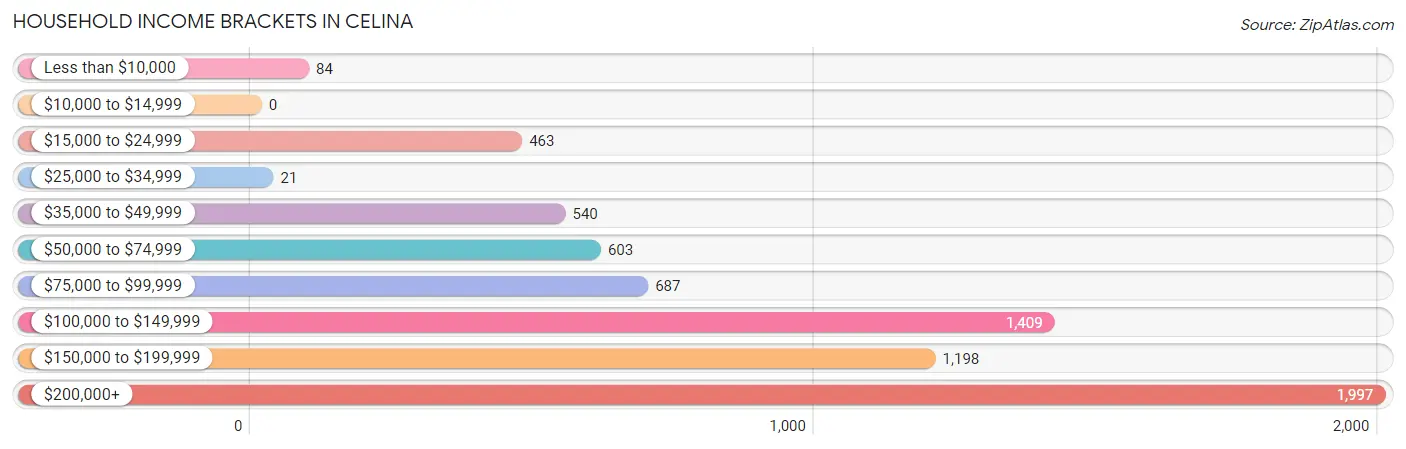
| Income Bracket | # Households | % Households |
| Less than $10,000 | 84 | 1.2% |
| $10,000 to $14,999 | 0 | 0.0% |
| $15,000 to $24,999 | 463 | 6.6% |
| $25,000 to $34,999 | 21 | 0.3% |
| $35,000 to $49,999 | 540 | 7.7% |
| $50,000 to $74,999 | 603 | 8.6% |
| $75,000 to $99,999 | 687 | 9.8% |
| $100,000 to $149,999 | 1,409 | 20.1% |
| $150,000 to $199,999 | 1,198 | 17.1% |
| $200,000+ | 1,997 | 28.5% |
Household Income by Householder Age in Celina
The median household income in Celina is $142,643, with the highest median household income of $153,032 found in the 25 to 44 years age bracket for the primary householder. A total of 3,246 households (46.3%) fall into this category. Meanwhile, the 15 to 24 years age bracket for the primary householder has the lowest median household income of $0, with 92 households (1.3%) in this group.
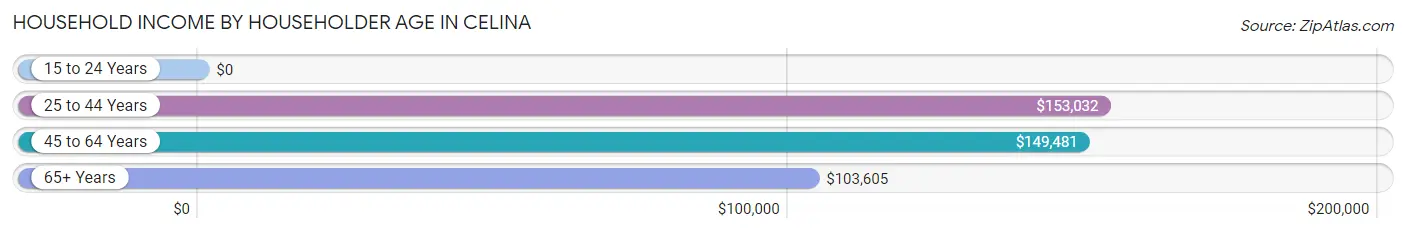
| Income Bracket | # Households | Median Income |
| 15 to 24 Years | 92 (1.3%) | $0 |
| 25 to 44 Years | 3,246 (46.3%) | $153,032 |
| 45 to 64 Years | 2,476 (35.3%) | $149,481 |
| 65+ Years | 1,194 (17.0%) | $103,605 |
| Total | 7,008 (100.0%) | $142,643 |
Poverty in Celina
Income Below Poverty by Sex and Age in Celina
With 7.4% poverty level for males and 4.4% for females among the residents of Celina, 55 to 64 year old males and 35 to 44 year old females are the most vulnerable to poverty, with 389 males (35.7%) and 366 females (15.3%) in their respective age groups living below the poverty level.
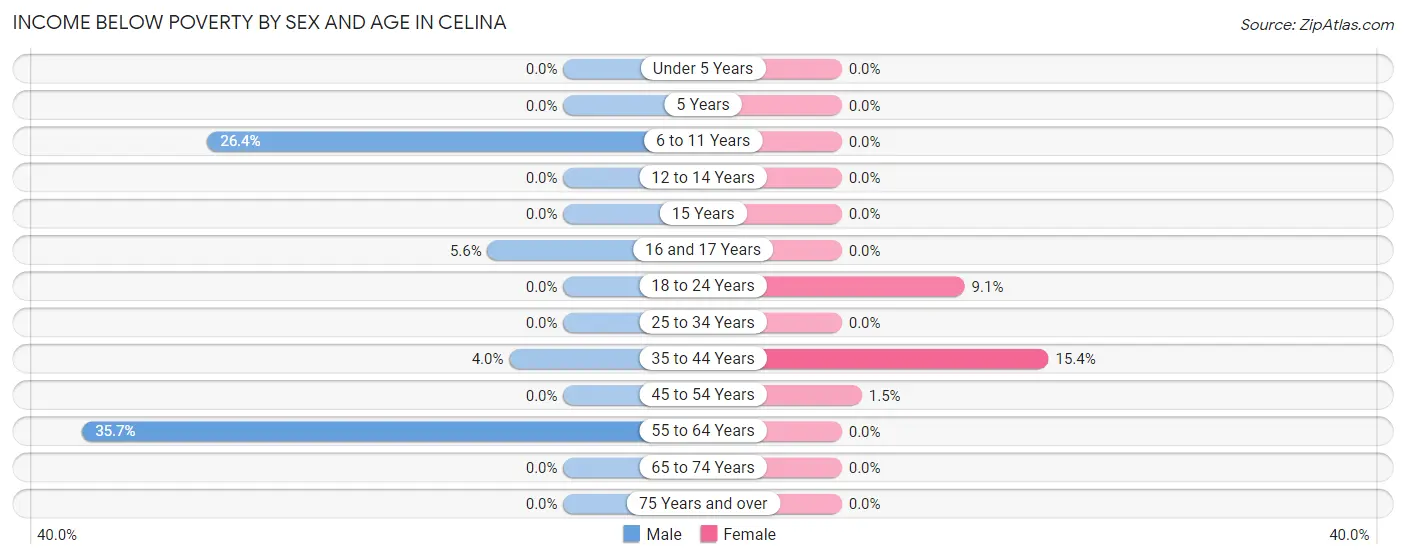
| Age Bracket | Male | Female |
| Under 5 Years | 0 (0.0%) | 0 (0.0%) |
| 5 Years | 0 (0.0%) | 0 (0.0%) |
| 6 to 11 Years | 341 (26.4%) | 0 (0.0%) |
| 12 to 14 Years | 0 (0.0%) | 0 (0.0%) |
| 15 Years | 0 (0.0%) | 0 (0.0%) |
| 16 and 17 Years | 34 (5.6%) | 0 (0.0%) |
| 18 to 24 Years | 0 (0.0%) | 50 (9.1%) |
| 25 to 34 Years | 0 (0.0%) | 0 (0.0%) |
| 35 to 44 Years | 87 (4.0%) | 366 (15.3%) |
| 45 to 54 Years | 0 (0.0%) | 20 (1.5%) |
| 55 to 64 Years | 389 (35.7%) | 0 (0.0%) |
| 65 to 74 Years | 0 (0.0%) | 0 (0.0%) |
| 75 Years and over | 0 (0.0%) | 0 (0.0%) |
| Total | 851 (7.4%) | 436 (4.4%) |
Income Above Poverty by Sex and Age in Celina
According to the poverty statistics in Celina, males aged under 5 years and females aged under 5 years are the age groups that are most secure financially, with 100.0% of males and 100.0% of females in these age groups living above the poverty line.
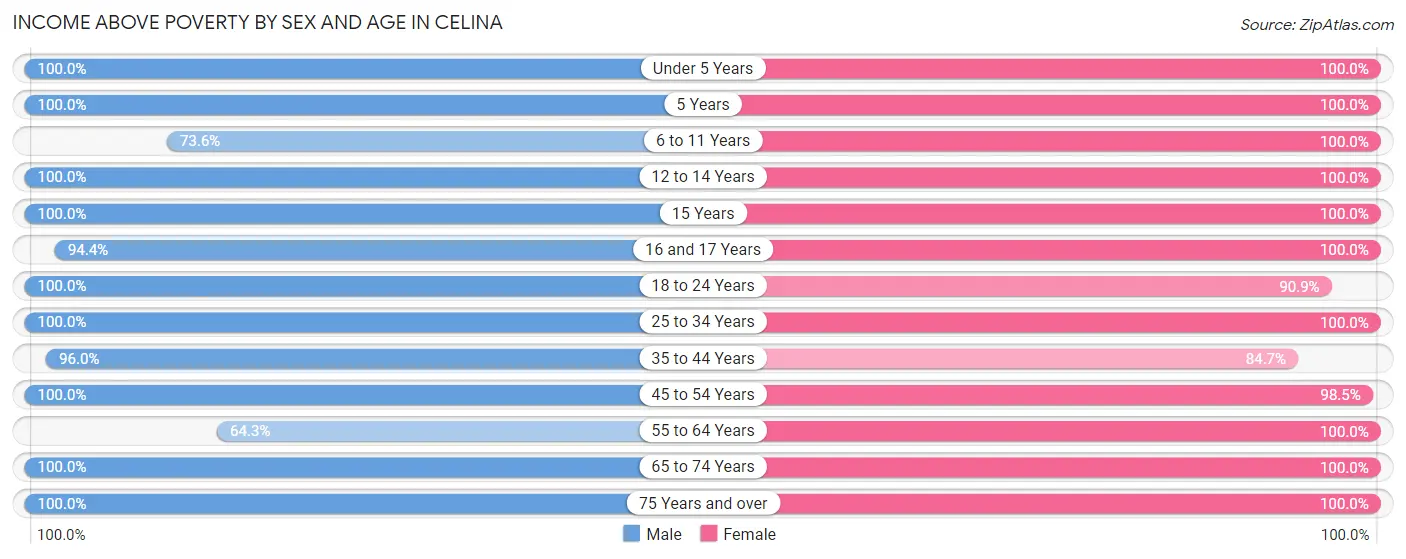
| Age Bracket | Male | Female |
| Under 5 Years | 759 (100.0%) | 411 (100.0%) |
| 5 Years | 535 (100.0%) | 155 (100.0%) |
| 6 to 11 Years | 949 (73.6%) | 850 (100.0%) |
| 12 to 14 Years | 361 (100.0%) | 628 (100.0%) |
| 15 Years | 213 (100.0%) | 139 (100.0%) |
| 16 and 17 Years | 570 (94.4%) | 366 (100.0%) |
| 18 to 24 Years | 748 (100.0%) | 498 (90.9%) |
| 25 to 34 Years | 1,523 (100.0%) | 1,250 (100.0%) |
| 35 to 44 Years | 2,083 (96.0%) | 2,019 (84.7%) |
| 45 to 54 Years | 1,079 (100.0%) | 1,322 (98.5%) |
| 55 to 64 Years | 700 (64.3%) | 517 (100.0%) |
| 65 to 74 Years | 934 (100.0%) | 1,021 (100.0%) |
| 75 Years and over | 219 (100.0%) | 252 (100.0%) |
| Total | 10,673 (92.6%) | 9,428 (95.6%) |
Income Below Poverty Among Married-Couple Families in Celina
The poverty statistics for married-couple families in Celina show that 6.9% or 389 of the total 5,629 families live below the poverty line. Families with 1 or 2 children have the highest poverty rate of 14.1%, comprising of 389 families. On the other hand, families with no children have the lowest poverty rate of 0.0%, which includes 0 families.
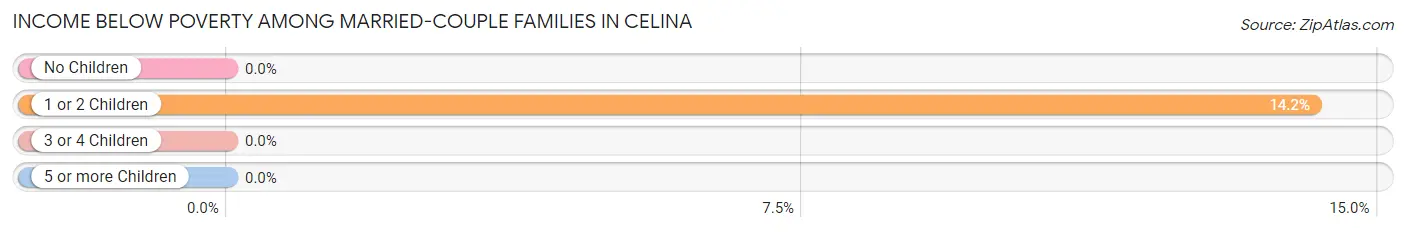
| Children | Above Poverty | Below Poverty |
| No Children | 2,317 (100.0%) | 0 (0.0%) |
| 1 or 2 Children | 2,360 (85.9%) | 389 (14.1%) |
| 3 or 4 Children | 542 (100.0%) | 0 (0.0%) |
| 5 or more Children | 21 (100.0%) | 0 (0.0%) |
| Total | 5,240 (93.1%) | 389 (6.9%) |
Income Below Poverty Among Single-Parent Households in Celina
| Children | Single Father | Single Mother |
| No Children | 0 (0.0%) | 0 (0.0%) |
| 1 or 2 Children | 0 (0.0%) | 0 (0.0%) |
| 3 or 4 Children | 0 (0.0%) | 0 (0.0%) |
| 5 or more Children | 0 (0.0%) | 0 (0.0%) |
| Total | 0 (0.0%) | 0 (0.0%) |
Income Below Poverty Among Married-Couple vs Single-Parent Households in Celina
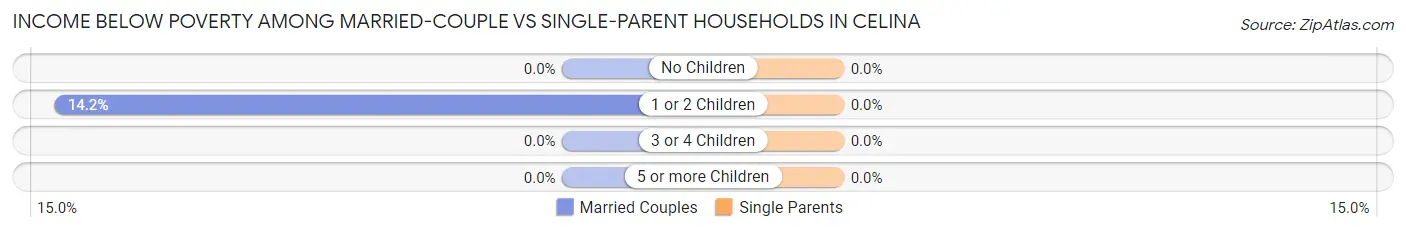
| Children | Married-Couple Families | Single-Parent Households |
| No Children | 0 (0.0%) | 0 (0.0%) |
| 1 or 2 Children | 389 (14.1%) | 0 (0.0%) |
| 3 or 4 Children | 0 (0.0%) | 0 (0.0%) |
| 5 or more Children | 0 (0.0%) | 0 (0.0%) |
| Total | 389 (6.9%) | 0 (0.0%) |
Race in Celina
The most populous races in Celina are White / Caucasian (14,664 | 68.2%), Hispanic or Latino (3,572 | 16.6%), and Two or more Races (3,108 | 14.5%).
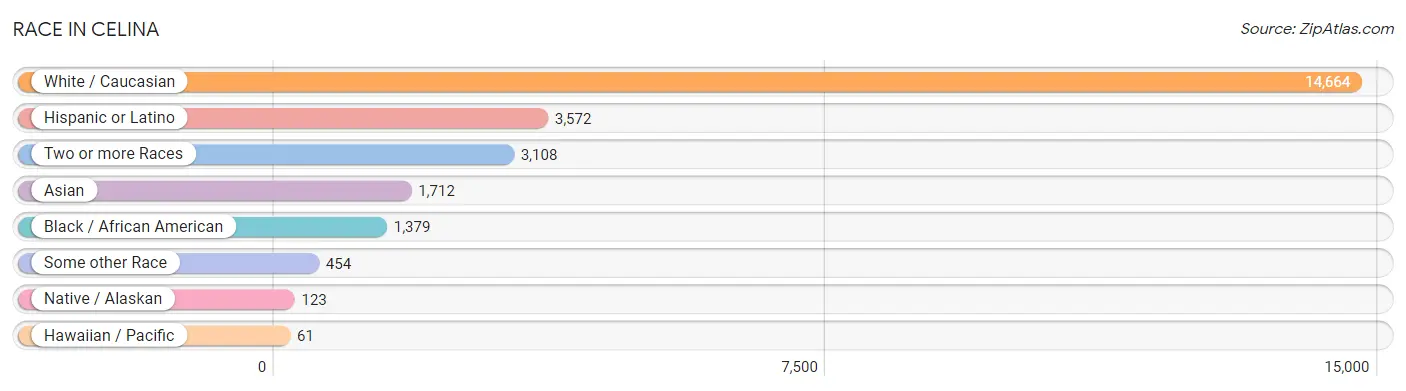
| Race | # Population | % Population |
| Asian | 1,712 | 8.0% |
| Black / African American | 1,379 | 6.4% |
| Hawaiian / Pacific | 61 | 0.3% |
| Hispanic or Latino | 3,572 | 16.6% |
| Native / Alaskan | 123 | 0.6% |
| White / Caucasian | 14,664 | 68.2% |
| Two or more Races | 3,108 | 14.5% |
| Some other Race | 454 | 2.1% |
| Total | 21,501 | 100.0% |
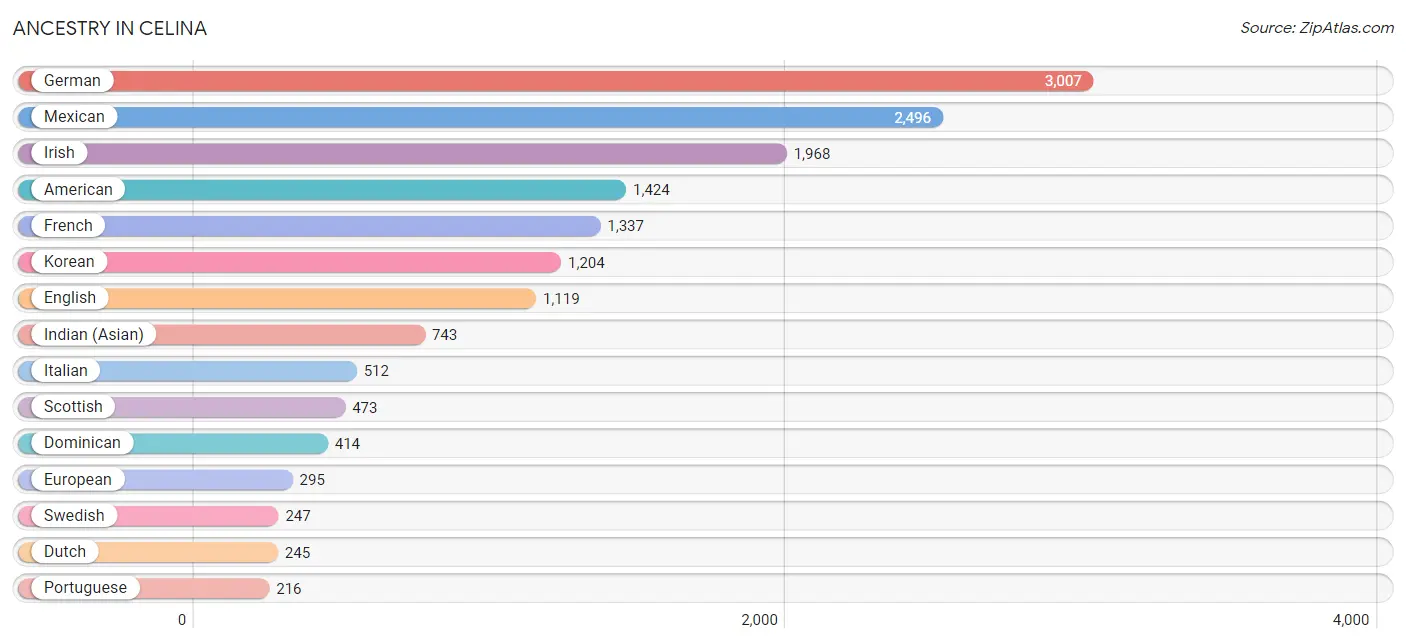
Ancestry in Celina
The most populous ancestries reported in Celina are German (3,007 | 14.0%), Mexican (2,496 | 11.6%), Irish (1,968 | 9.1%), American (1,424 | 6.6%), and French (1,337 | 6.2%), together accounting for 47.6% of all Celina residents.
| Ancestry | # Population | % Population |
| African | 101 | 0.5% |
| American | 1,424 | 6.6% |
| Argentinean | 40 | 0.2% |
| Austrian | 162 | 0.7% |
| Brazilian | 27 | 0.1% |
| British | 129 | 0.6% |
| Burmese | 18 | 0.1% |
| Cajun | 54 | 0.3% |
| Central American | 53 | 0.3% |
| Cherokee | 141 | 0.7% |
| Choctaw | 16 | 0.1% |
| Colombian | 162 | 0.7% |
| Cuban | 56 | 0.3% |
| Czech | 106 | 0.5% |
| Danish | 11 | 0.1% |
| Dominican | 414 | 1.9% |
| Dutch | 245 | 1.1% |
| English | 1,119 | 5.2% |
| European | 295 | 1.4% |
| French | 1,337 | 6.2% |
| French Canadian | 27 | 0.1% |
| German | 3,007 | 14.0% |
| Honduran | 53 | 0.3% |
| Hungarian | 117 | 0.5% |
| Indian (Asian) | 743 | 3.5% |
| Irish | 1,968 | 9.1% |
| Italian | 512 | 2.4% |
| Jamaican | 28 | 0.1% |
| Kenyan | 76 | 0.4% |
| Korean | 1,204 | 5.6% |
| Mexican | 2,496 | 11.6% |
| Mexican American Indian | 16 | 0.1% |
| New Zealander | 106 | 0.5% |
| Norwegian | 121 | 0.6% |
| Polish | 78 | 0.4% |
| Portuguese | 216 | 1.0% |
| Puerto Rican | 216 | 1.0% |
| Romanian | 59 | 0.3% |
| Russian | 139 | 0.6% |
| Scandinavian | 30 | 0.1% |
| Scotch-Irish | 195 | 0.9% |
| Scottish | 473 | 2.2% |
| South American | 202 | 0.9% |
| Spaniard | 80 | 0.4% |
| Sri Lankan | 79 | 0.4% |
| Subsaharan African | 177 | 0.8% |
| Swedish | 247 | 1.1% |
| Thai | 189 | 0.9% |
| Tongan | 168 | 0.8% |
| Trinidadian and Tobagonian | 28 | 0.1% |
| Ukrainian | 78 | 0.4% |
| Welsh | 47 | 0.2% | View All 52 Rows |
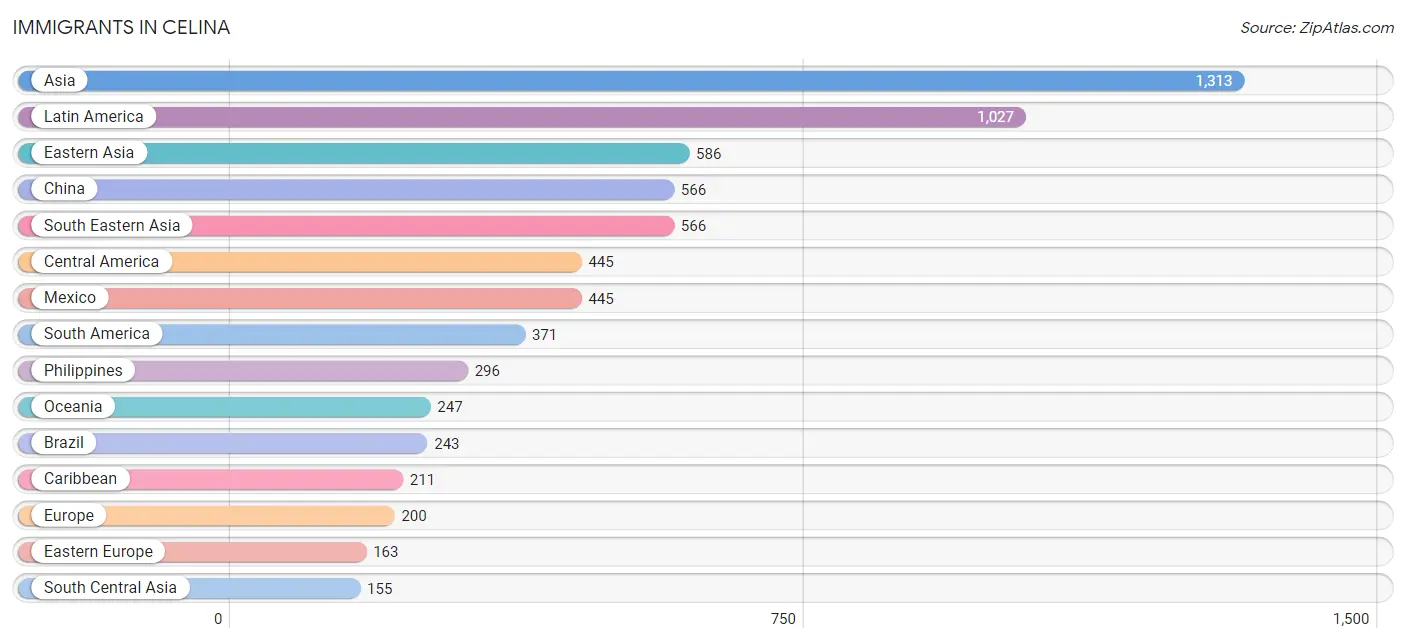
Immigrants in Celina
The most numerous immigrant groups reported in Celina came from Asia (1,313 | 6.1%), Latin America (1,027 | 4.8%), Eastern Asia (586 | 2.7%), China (566 | 2.6%), and South Eastern Asia (566 | 2.6%), together accounting for 18.9% of all Celina residents.
| Immigration Origin | # Population | % Population |
| Africa | 58 | 0.3% |
| Argentina | 40 | 0.2% |
| Asia | 1,313 | 6.1% |
| Brazil | 243 | 1.1% |
| Caribbean | 211 | 1.0% |
| Central America | 445 | 2.1% |
| China | 566 | 2.6% |
| Colombia | 88 | 0.4% |
| Cuba | 56 | 0.3% |
| Dominican Republic | 99 | 0.5% |
| Eastern Africa | 40 | 0.2% |
| Eastern Asia | 586 | 2.7% |
| Eastern Europe | 163 | 0.8% |
| Europe | 200 | 0.9% |
| France | 19 | 0.1% |
| India | 150 | 0.7% |
| Indonesia | 18 | 0.1% |
| Jamaica | 28 | 0.1% |
| Kenya | 40 | 0.2% |
| Korea | 20 | 0.1% |
| Latin America | 1,027 | 4.8% |
| Mexico | 445 | 2.1% |
| Moldova | 59 | 0.3% |
| Northern Europe | 18 | 0.1% |
| Oceania | 247 | 1.1% |
| Pakistan | 5 | 0.0% |
| Philippines | 296 | 1.4% |
| Poland | 46 | 0.2% |
| Russia | 58 | 0.3% |
| Saudi Arabia | 6 | 0.0% |
| South Africa | 18 | 0.1% |
| South America | 371 | 1.7% |
| South Central Asia | 155 | 0.7% |
| South Eastern Asia | 566 | 2.6% |
| Taiwan | 53 | 0.3% |
| Thailand | 100 | 0.5% |
| Trinidad and Tobago | 28 | 0.1% |
| Vietnam | 152 | 0.7% |
| Western Asia | 6 | 0.0% |
| Western Europe | 19 | 0.1% | View All 40 Rows |
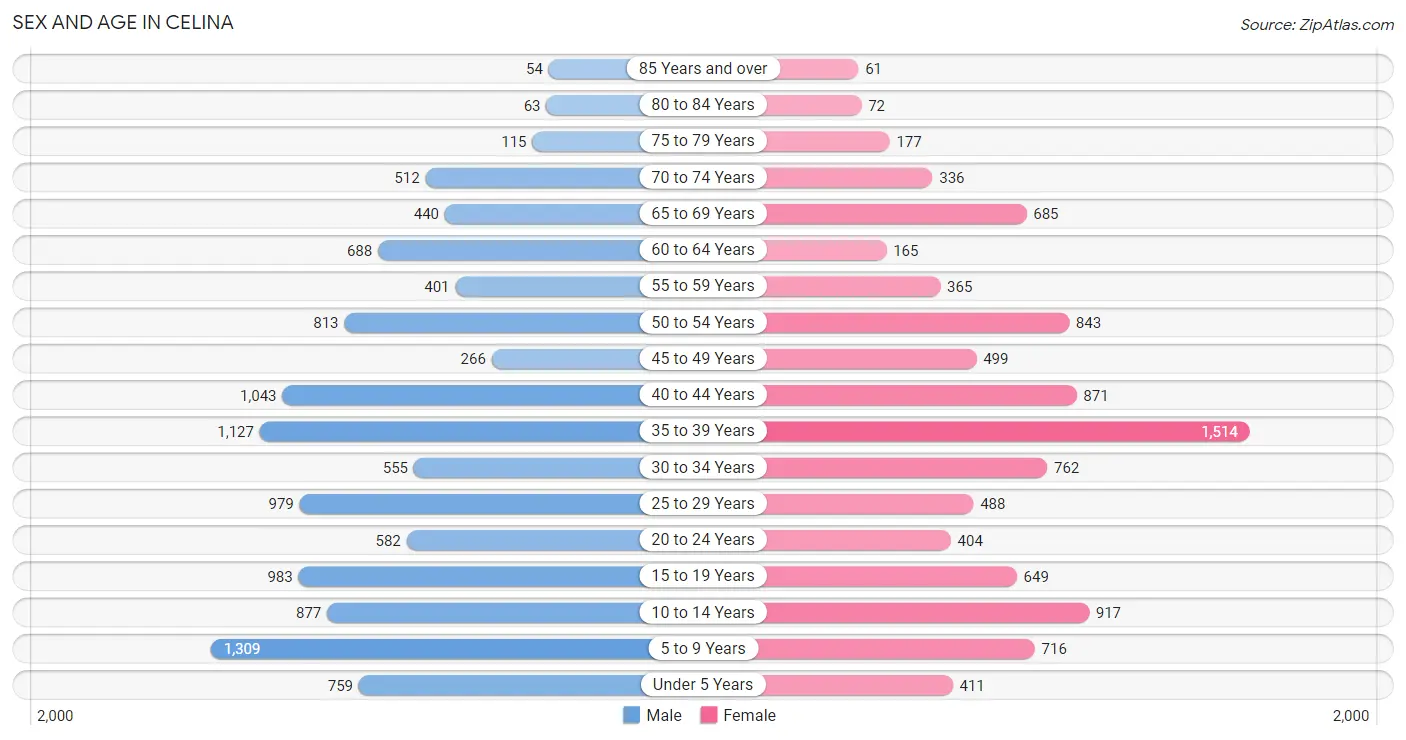
Sex and Age in Celina
Sex and Age in Celina
The most populous age groups in Celina are 5 to 9 Years (1,309 | 11.3%) for men and 35 to 39 Years (1,514 | 15.2%) for women.
| Age Bracket | Male | Female |
| Under 5 Years | 759 (6.6%) | 411 (4.1%) |
| 5 to 9 Years | 1,309 (11.3%) | 716 (7.2%) |
| 10 to 14 Years | 877 (7.6%) | 917 (9.2%) |
| 15 to 19 Years | 983 (8.5%) | 649 (6.5%) |
| 20 to 24 Years | 582 (5.0%) | 404 (4.1%) |
| 25 to 29 Years | 979 (8.5%) | 488 (4.9%) |
| 30 to 34 Years | 555 (4.8%) | 762 (7.7%) |
| 35 to 39 Years | 1,127 (9.7%) | 1,514 (15.2%) |
| 40 to 44 Years | 1,043 (9.0%) | 871 (8.8%) |
| 45 to 49 Years | 266 (2.3%) | 499 (5.0%) |
| 50 to 54 Years | 813 (7.0%) | 843 (8.5%) |
| 55 to 59 Years | 401 (3.5%) | 365 (3.7%) |
| 60 to 64 Years | 688 (5.9%) | 165 (1.7%) |
| 65 to 69 Years | 440 (3.8%) | 685 (6.9%) |
| 70 to 74 Years | 512 (4.4%) | 336 (3.4%) |
| 75 to 79 Years | 115 (1.0%) | 177 (1.8%) |
| 80 to 84 Years | 63 (0.5%) | 72 (0.7%) |
| 85 Years and over | 54 (0.5%) | 61 (0.6%) |
| Total | 11,566 (100.0%) | 9,935 (100.0%) |
Families and Households in Celina
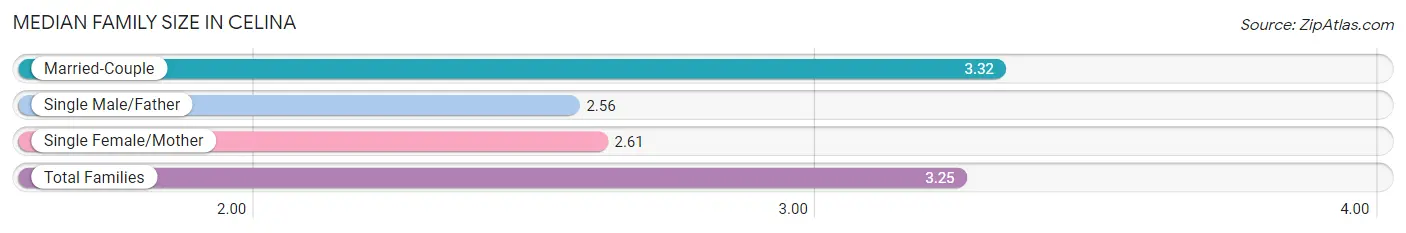
Median Family Size in Celina
The median family size in Celina is 3.25 persons per family, with married-couple families (5,629 | 90.2%) accounting for the largest median family size of 3.32 persons per family. On the other hand, single male/father families (70 | 1.1%) represent the smallest median family size with 2.56 persons per family.
| Family Type | # Families | Family Size |
| Married-Couple | 5,629 (90.2%) | 3.32 |
| Single Male/Father | 70 (1.1%) | 2.56 |
| Single Female/Mother | 542 (8.7%) | 2.61 |
| Total Families | 6,241 (100.0%) | 3.25 |
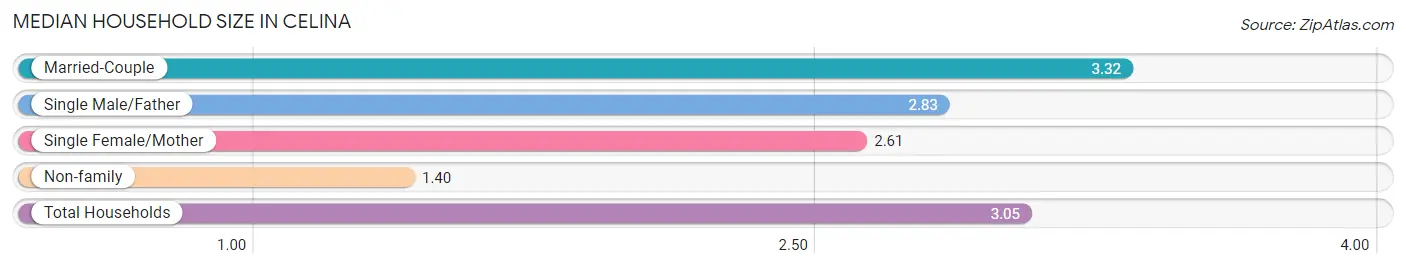
Median Household Size in Celina
The median household size in Celina is 3.05 persons per household, with married-couple households (5,629 | 80.3%) accounting for the largest median household size of 3.32 persons per household. non-family households (767 | 10.9%) represent the smallest median household size with 1.40 persons per household.
| Household Type | # Households | Household Size |
| Married-Couple | 5,629 (80.3%) | 3.32 |
| Single Male/Father | 70 (1.0%) | 2.83 |
| Single Female/Mother | 542 (7.7%) | 2.61 |
| Non-family | 767 (10.9%) | 1.40 |
| Total Households | 7,008 (100.0%) | 3.05 |
Household Size by Marriage Status in Celina
Out of a total of 7,008 households in Celina, 6,241 (89.1%) are family households, while 767 (10.9%) are nonfamily households. The most numerous type of family households are 2-person households, comprising 2,049, and the most common type of nonfamily households are 1-person households, comprising 513.
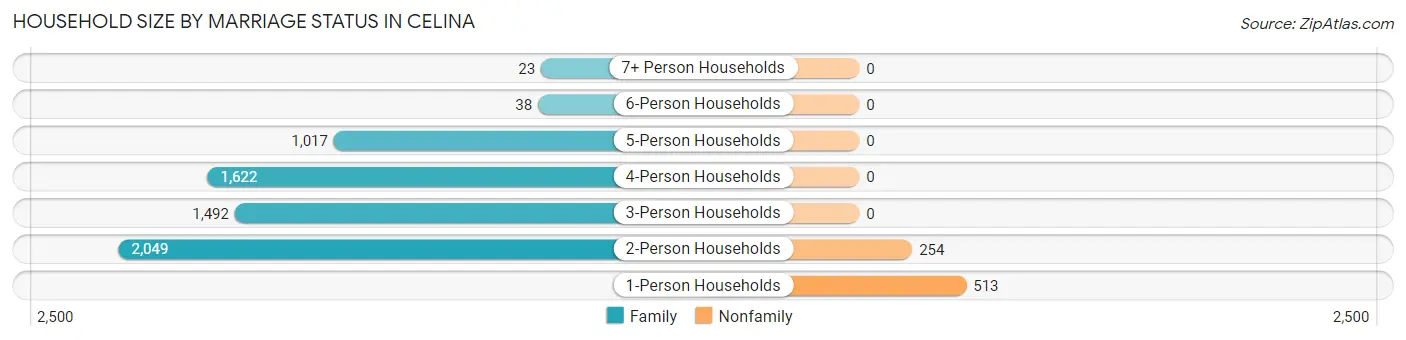
| Household Size | Family Households | Nonfamily Households |
| 1-Person Households | - | 513 (7.3%) |
| 2-Person Households | 2,049 (29.2%) | 254 (3.6%) |
| 3-Person Households | 1,492 (21.3%) | 0 (0.0%) |
| 4-Person Households | 1,622 (23.1%) | 0 (0.0%) |
| 5-Person Households | 1,017 (14.5%) | 0 (0.0%) |
| 6-Person Households | 38 (0.5%) | 0 (0.0%) |
| 7+ Person Households | 23 (0.3%) | 0 (0.0%) |
| Total | 6,241 (89.1%) | 767 (10.9%) |
Female Fertility in Celina
Fertility by Age in Celina
Average fertility rate in Celina is 32.0 births per 1,000 women. Women in the age bracket of 20 to 34 years have the highest fertility rate with 106.0 births per 1,000 women. Women in the age bracket of 20 to 34 years acount for 100.0% of all women with births.
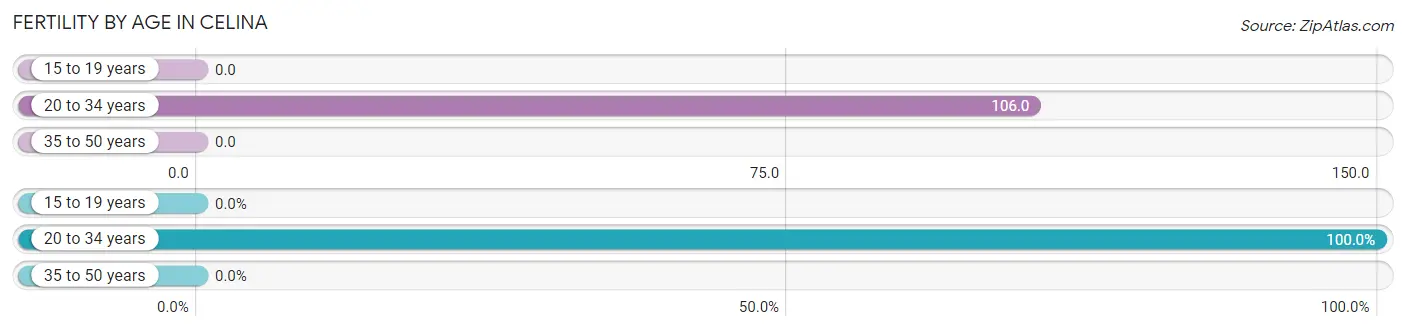
| Age Bracket | Women with Births | Births / 1,000 Women |
| 15 to 19 years | 0 (0.0%) | 0.0 |
| 20 to 34 years | 176 (100.0%) | 106.0 |
| 35 to 50 years | 0 (0.0%) | 0.0 |
| Total | 176 (100.0%) | 32.0 |
Fertility by Age by Marriage Status in Celina
81.2% of women with births (176) in Celina are married. The highest percentage of unmarried women with births falls into 20 to 34 years age bracket with 18.8% of them unmarried at the time of birth, while the lowest percentage of unmarried women with births belong to 20 to 34 years age bracket with 18.8% of them unmarried.
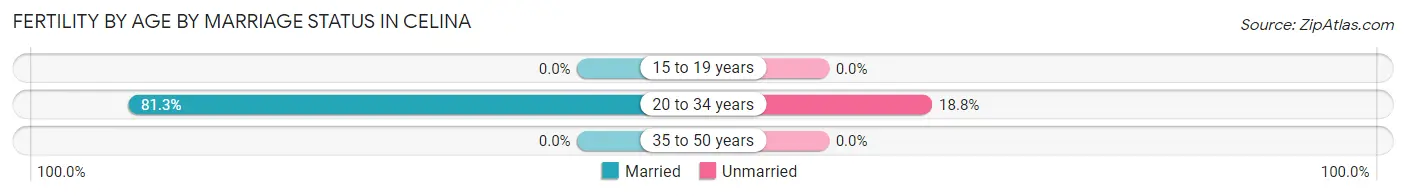
| Age Bracket | Married | Unmarried |
| 15 to 19 years | 0 (0.0%) | 0 (0.0%) |
| 20 to 34 years | 143 (81.2%) | 33 (18.8%) |
| 35 to 50 years | 0 (0.0%) | 0 (0.0%) |
| Total | 143 (81.2%) | 33 (18.8%) |
Fertility by Education in Celina
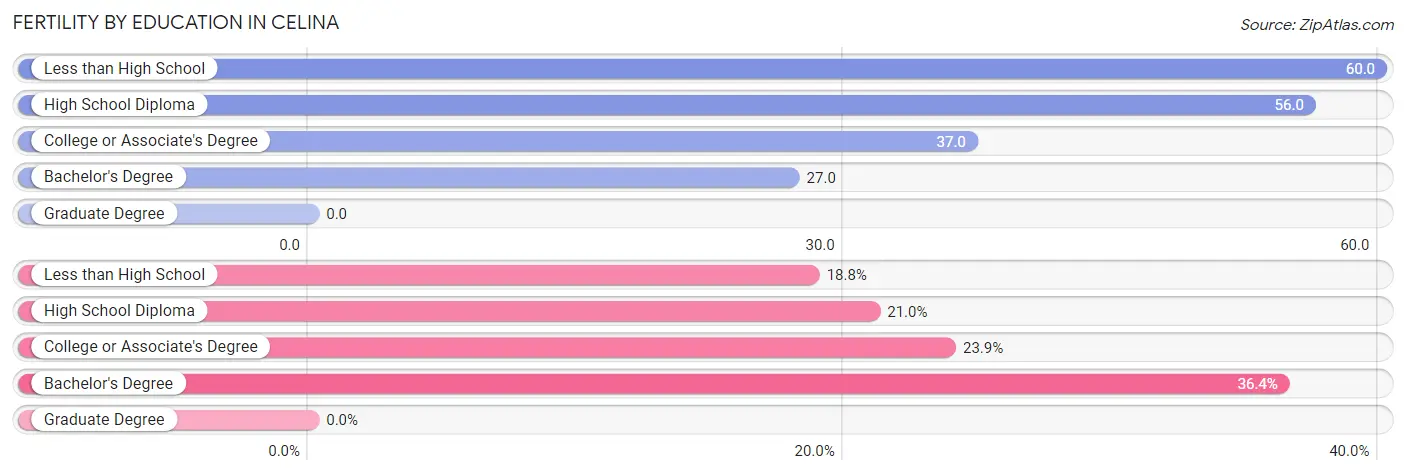
| Educational Attainment | Women with Births | Births / 1,000 Women |
| Less than High School | 33 (18.8%) | 60.0 |
| High School Diploma | 37 (21.0%) | 56.0 |
| College or Associate's Degree | 42 (23.9%) | 37.0 |
| Bachelor's Degree | 64 (36.4%) | 27.0 |
| Graduate Degree | 0 (0.0%) | 0.0 |
| Total | 176 (100.0%) | 32.0 |
Fertility by Education by Marriage Status in Celina
18.8% of women with births in Celina are unmarried. Women with the educational attainment of high school diploma are most likely to be married with 100.0% of them married at childbirth, while women with the educational attainment of less than high school are least likely to be married with 100.0% of them unmarried at childbirth.
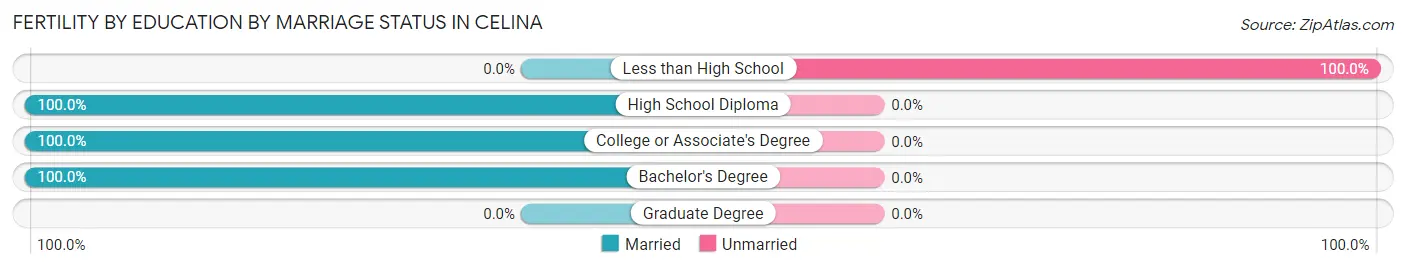
| Educational Attainment | Married | Unmarried |
| Less than High School | 0 (0.0%) | 33 (100.0%) |
| High School Diploma | 37 (100.0%) | 0 (0.0%) |
| College or Associate's Degree | 42 (100.0%) | 0 (0.0%) |
| Bachelor's Degree | 64 (100.0%) | 0 (0.0%) |
| Graduate Degree | 0 (0.0%) | 0 (0.0%) |
| Total | 143 (81.2%) | 33 (18.8%) |
Employment Characteristics in Celina
Employment by Class of Employer in Celina
Among the 10,902 employed individuals in Celina, private company employees (7,989 | 73.3%), local government employees (1,244 | 11.4%), and self-employed (not incorporated) (701 | 6.4%) make up the most common classes of employment.
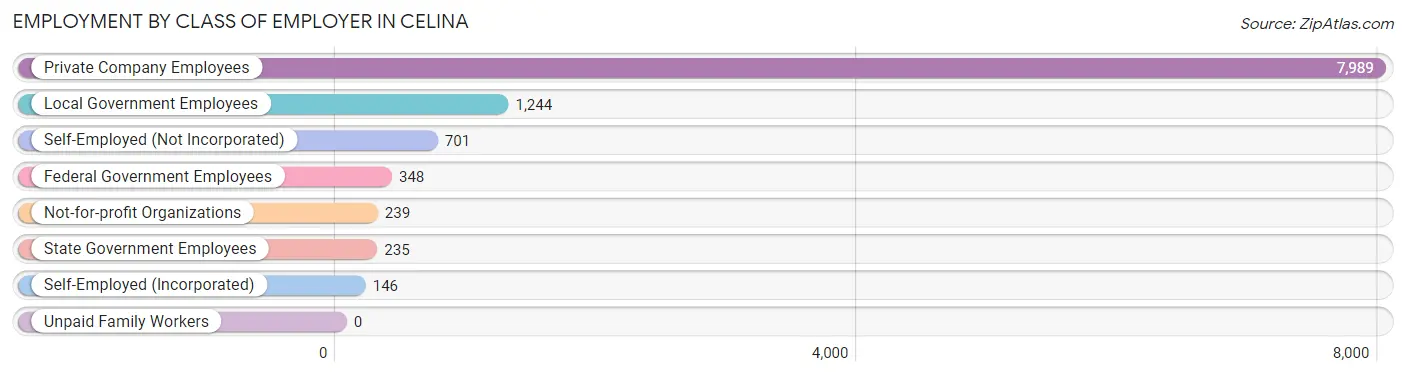
| Employer Class | # Employees | % Employees |
| Private Company Employees | 7,989 | 73.3% |
| Self-Employed (Incorporated) | 146 | 1.3% |
| Self-Employed (Not Incorporated) | 701 | 6.4% |
| Not-for-profit Organizations | 239 | 2.2% |
| Local Government Employees | 1,244 | 11.4% |
| State Government Employees | 235 | 2.2% |
| Federal Government Employees | 348 | 3.2% |
| Unpaid Family Workers | 0 | 0.0% |
| Total | 10,902 | 100.0% |
Employment Status by Age in Celina
According to the labor force statistics for Celina, out of the total population over 16 years of age (16,160), 69.1% or 11,167 individuals are in the labor force, with 1.6% or 179 of them unemployed. The age group with the highest labor force participation rate is 25 to 29 years, with 94.1% or 1,380 individuals in the labor force. Within the labor force, the 75 years and over age range has the highest percentage of unemployed individuals, with 40.3% or 62 of them being unemployed.
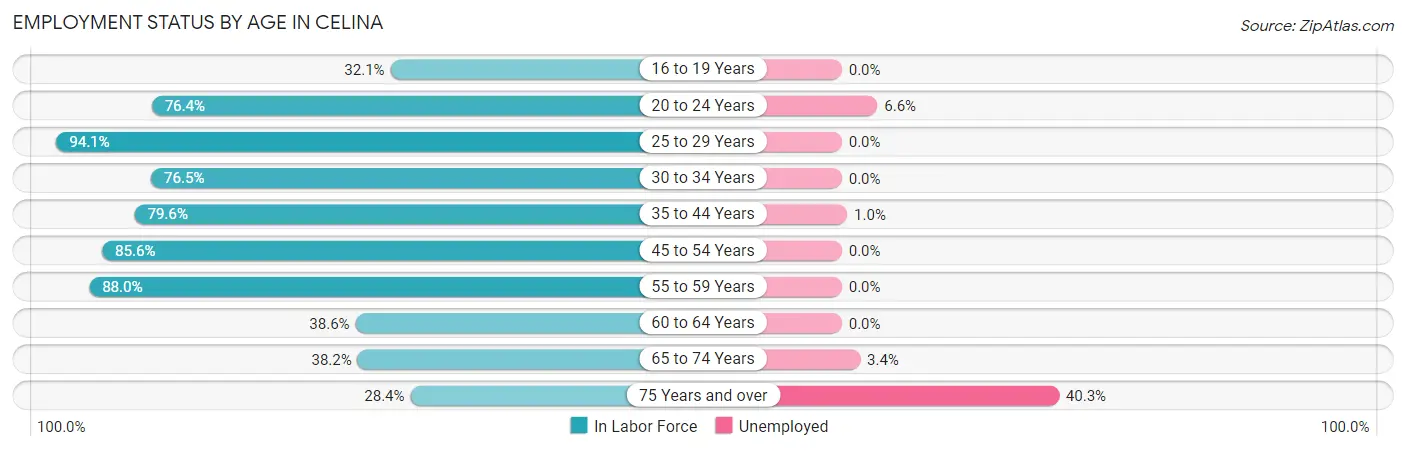
| Age Bracket | In Labor Force | Unemployed |
| 16 to 19 Years | 411 (32.1%) | 0 (0.0%) |
| 20 to 24 Years | 753 (76.4%) | 50 (6.6%) |
| 25 to 29 Years | 1,380 (94.1%) | 0 (0.0%) |
| 30 to 34 Years | 1,008 (76.5%) | 0 (0.0%) |
| 35 to 44 Years | 3,626 (79.6%) | 36 (1.0%) |
| 45 to 54 Years | 2,072 (85.6%) | 0 (0.0%) |
| 55 to 59 Years | 674 (88.0%) | 0 (0.0%) |
| 60 to 64 Years | 329 (38.6%) | 0 (0.0%) |
| 65 to 74 Years | 754 (38.2%) | 26 (3.4%) |
| 75 Years and over | 154 (28.4%) | 62 (40.3%) |
| Total | 11,167 (69.1%) | 179 (1.6%) |
Employment Status by Educational Attainment in Celina
According to labor force statistics for Celina, 79.9% of individuals (9,092) out of the total population between 25 and 64 years of age (11,379) are in the labor force, with 0.4% or 36 of them being unemployed. The group with the highest labor force participation rate are those with the educational attainment of less than high school, with 100.0% or 349 individuals in the labor force. Within the labor force, individuals with bachelor's degree or higher education have the highest percentage of unemployment, with 0.7% or 39 of them being unemployed.
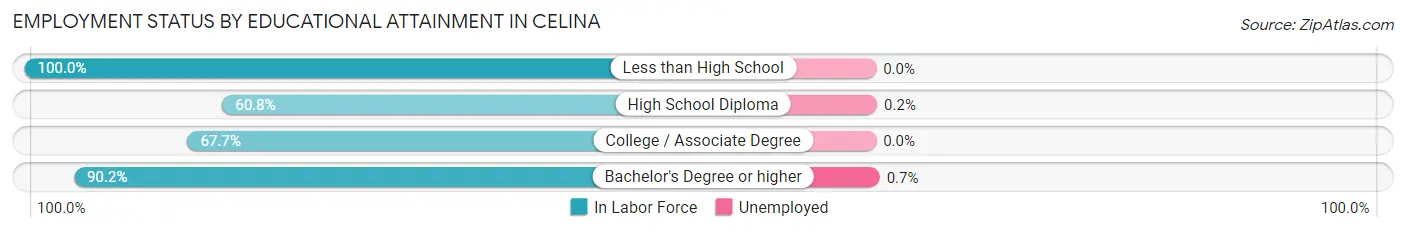
| Educational Attainment | In Labor Force | Unemployed |
| Less than High School | 349 (100.0%) | 0 (0.0%) |
| High School Diploma | 919 (60.8%) | 3 (0.2%) |
| College / Associate Degree | 2,299 (67.7%) | 0 (0.0%) |
| Bachelor's Degree or higher | 5,522 (90.2%) | 43 (0.7%) |
| Total | 9,092 (79.9%) | 46 (0.4%) |
Employment Occupations by Sex in Celina
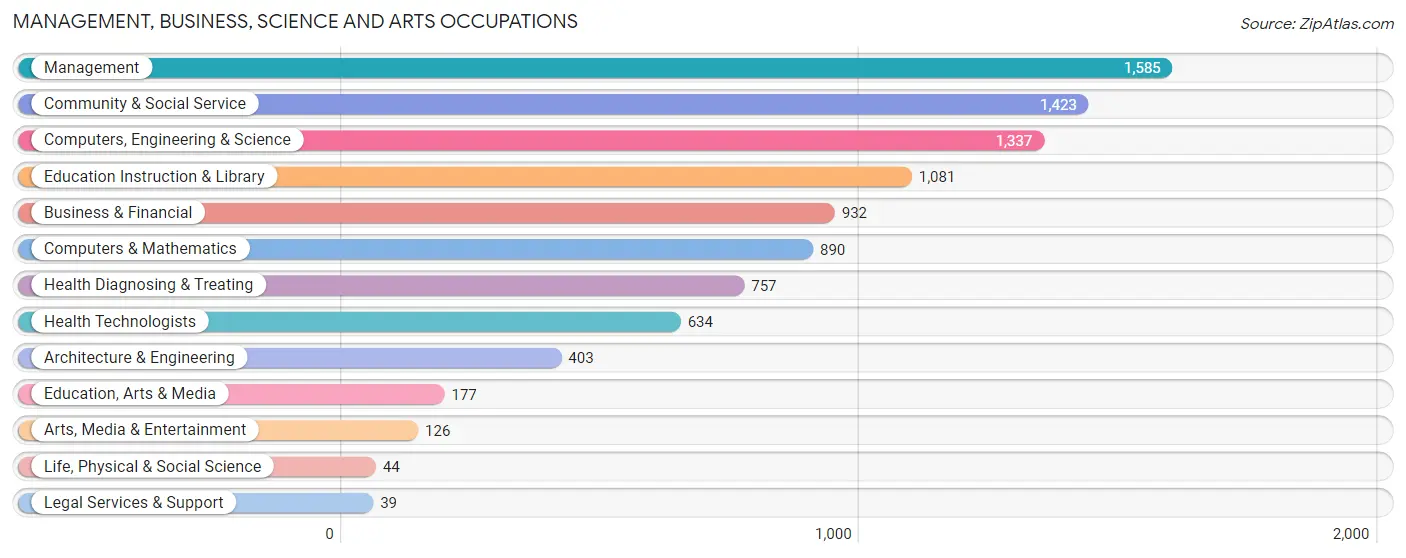
Management, Business, Science and Arts Occupations
The most common Management, Business, Science and Arts occupations in Celina are Management (1,585 | 14.5%), Community & Social Service (1,423 | 13.0%), Computers, Engineering & Science (1,337 | 12.2%), Education Instruction & Library (1,081 | 9.9%), and Business & Financial (932 | 8.5%).
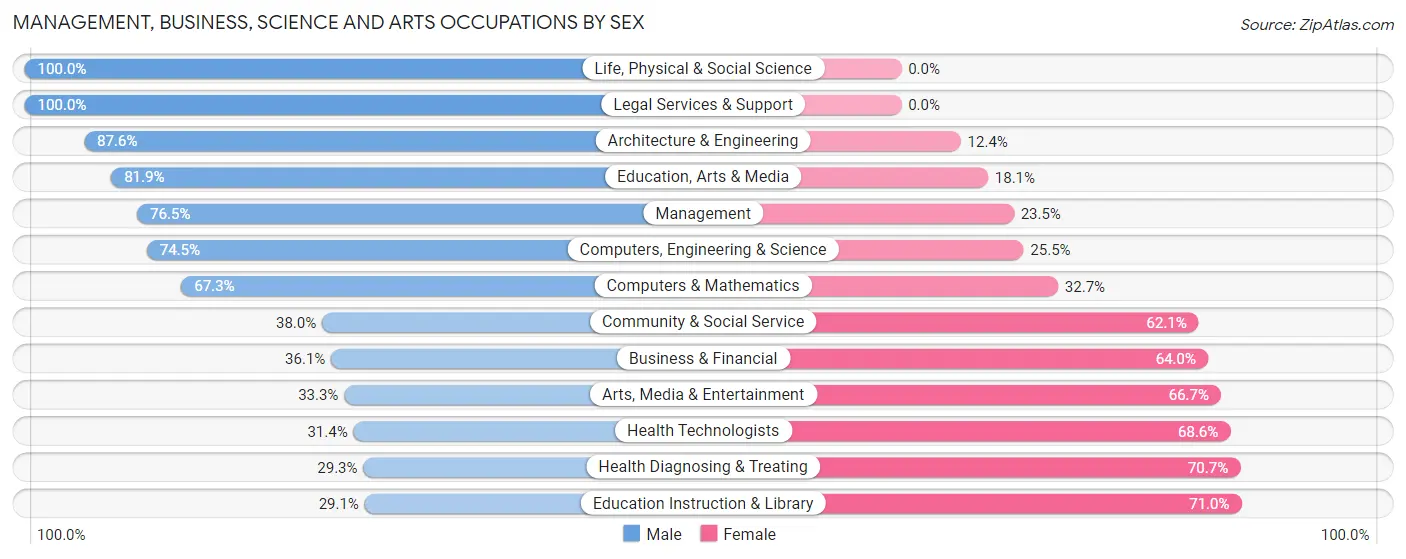
Management, Business, Science and Arts Occupations by Sex
Within the Management, Business, Science and Arts occupations in Celina, the most male-oriented occupations are Life, Physical & Social Science (100.0%), Legal Services & Support (100.0%), and Architecture & Engineering (87.6%), while the most female-oriented occupations are Education Instruction & Library (71.0%), Health Diagnosing & Treating (70.7%), and Health Technologists (68.6%).
| Occupation | Male | Female |
| Management | 1,213 (76.5%) | 372 (23.5%) |
| Business & Financial | 336 (36.0%) | 596 (63.9%) |
| Computers, Engineering & Science | 996 (74.5%) | 341 (25.5%) |
| Computers & Mathematics | 599 (67.3%) | 291 (32.7%) |
| Architecture & Engineering | 353 (87.6%) | 50 (12.4%) |
| Life, Physical & Social Science | 44 (100.0%) | 0 (0.0%) |
| Community & Social Service | 540 (38.0%) | 883 (62.1%) |
| Education, Arts & Media | 145 (81.9%) | 32 (18.1%) |
| Legal Services & Support | 39 (100.0%) | 0 (0.0%) |
| Education Instruction & Library | 314 (29.0%) | 767 (71.0%) |
| Arts, Media & Entertainment | 42 (33.3%) | 84 (66.7%) |
| Health Diagnosing & Treating | 222 (29.3%) | 535 (70.7%) |
| Health Technologists | 199 (31.4%) | 435 (68.6%) |
| Total (Category) | 3,307 (54.8%) | 2,727 (45.2%) |
| Total (Overall) | 6,209 (56.7%) | 4,747 (43.3%) |
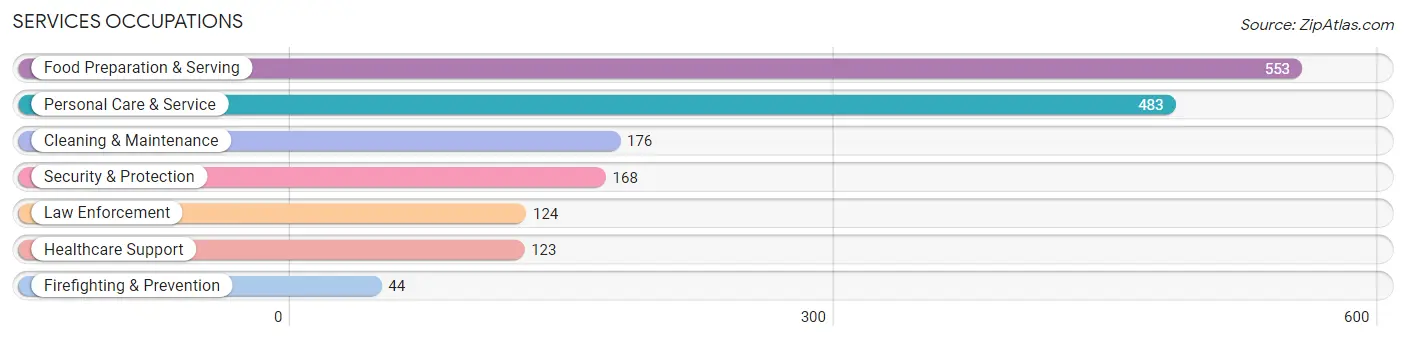
Services Occupations
The most common Services occupations in Celina are Food Preparation & Serving (553 | 5.1%), Personal Care & Service (483 | 4.4%), Cleaning & Maintenance (176 | 1.6%), Security & Protection (168 | 1.5%), and Law Enforcement (124 | 1.1%).
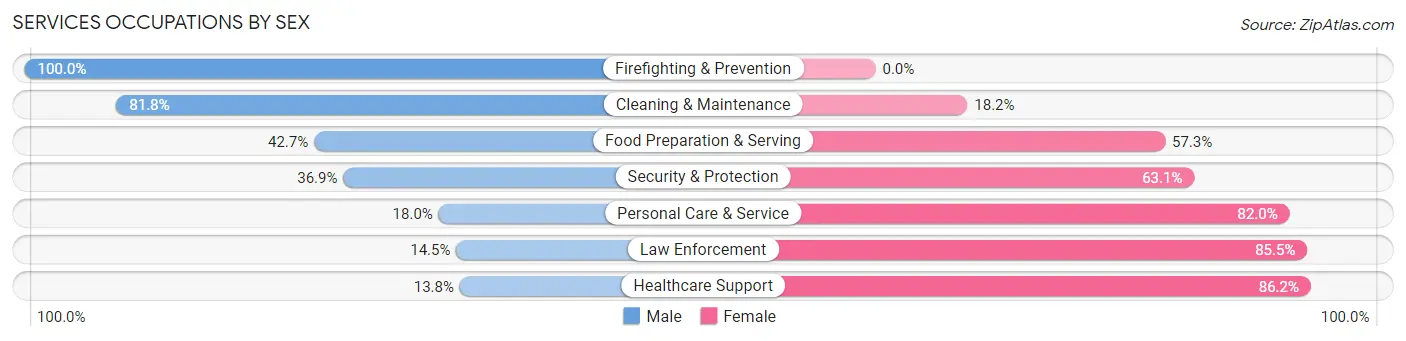
Services Occupations by Sex
Within the Services occupations in Celina, the most male-oriented occupations are Firefighting & Prevention (100.0%), Cleaning & Maintenance (81.8%), and Food Preparation & Serving (42.7%), while the most female-oriented occupations are Healthcare Support (86.2%), Law Enforcement (85.5%), and Personal Care & Service (82.0%).
| Occupation | Male | Female |
| Healthcare Support | 17 (13.8%) | 106 (86.2%) |
| Security & Protection | 62 (36.9%) | 106 (63.1%) |
| Firefighting & Prevention | 44 (100.0%) | 0 (0.0%) |
| Law Enforcement | 18 (14.5%) | 106 (85.5%) |
| Food Preparation & Serving | 236 (42.7%) | 317 (57.3%) |
| Cleaning & Maintenance | 144 (81.8%) | 32 (18.2%) |
| Personal Care & Service | 87 (18.0%) | 396 (82.0%) |
| Total (Category) | 546 (36.3%) | 957 (63.7%) |
| Total (Overall) | 6,209 (56.7%) | 4,747 (43.3%) |
Sales and Office Occupations
The most common Sales and Office occupations in Celina are Sales & Related (1,101 | 10.1%), and Office & Administration (961 | 8.8%).

Sales and Office Occupations by Sex

| Occupation | Male | Female |
| Sales & Related | 883 (80.2%) | 218 (19.8%) |
| Office & Administration | 305 (31.7%) | 656 (68.3%) |
| Total (Category) | 1,188 (57.6%) | 874 (42.4%) |
| Total (Overall) | 6,209 (56.7%) | 4,747 (43.3%) |
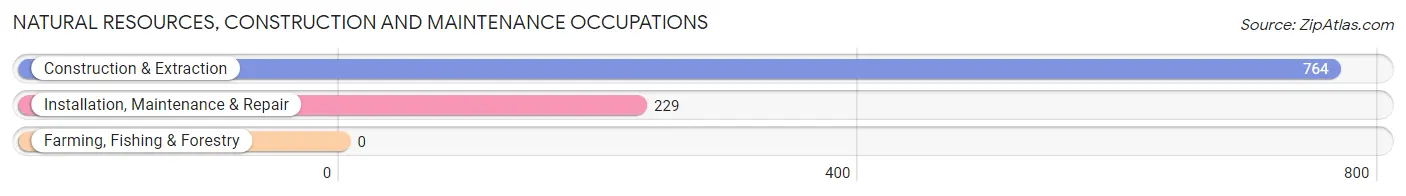
Natural Resources, Construction and Maintenance Occupations
The most common Natural Resources, Construction and Maintenance occupations in Celina are Construction & Extraction (764 | 7.0%), and Installation, Maintenance & Repair (229 | 2.1%).
Natural Resources, Construction and Maintenance Occupations by Sex
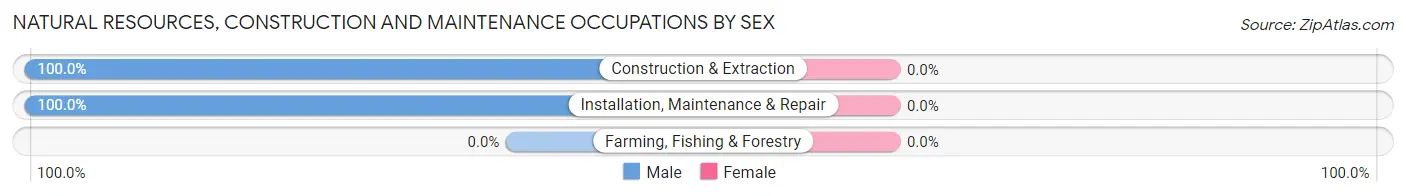
| Occupation | Male | Female |
| Farming, Fishing & Forestry | 0 (0.0%) | 0 (0.0%) |
| Construction & Extraction | 764 (100.0%) | 0 (0.0%) |
| Installation, Maintenance & Repair | 229 (100.0%) | 0 (0.0%) |
| Total (Category) | 993 (100.0%) | 0 (0.0%) |
| Total (Overall) | 6,209 (56.7%) | 4,747 (43.3%) |
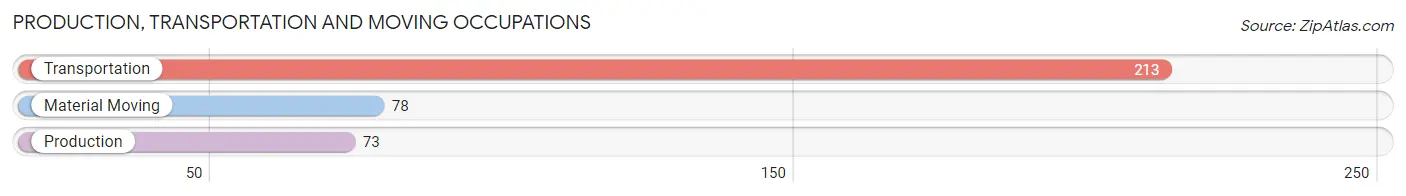
Production, Transportation and Moving Occupations
The most common Production, Transportation and Moving occupations in Celina are Transportation (213 | 1.9%), Material Moving (78 | 0.7%), and Production (73 | 0.7%).
Production, Transportation and Moving Occupations by Sex
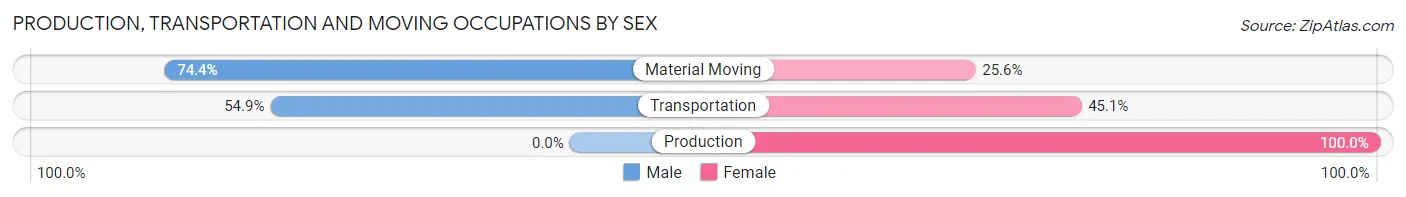
| Occupation | Male | Female |
| Production | 0 (0.0%) | 73 (100.0%) |
| Transportation | 117 (54.9%) | 96 (45.1%) |
| Material Moving | 58 (74.4%) | 20 (25.6%) |
| Total (Category) | 175 (48.1%) | 189 (51.9%) |
| Total (Overall) | 6,209 (56.7%) | 4,747 (43.3%) |
Employment Industries by Sex in Celina
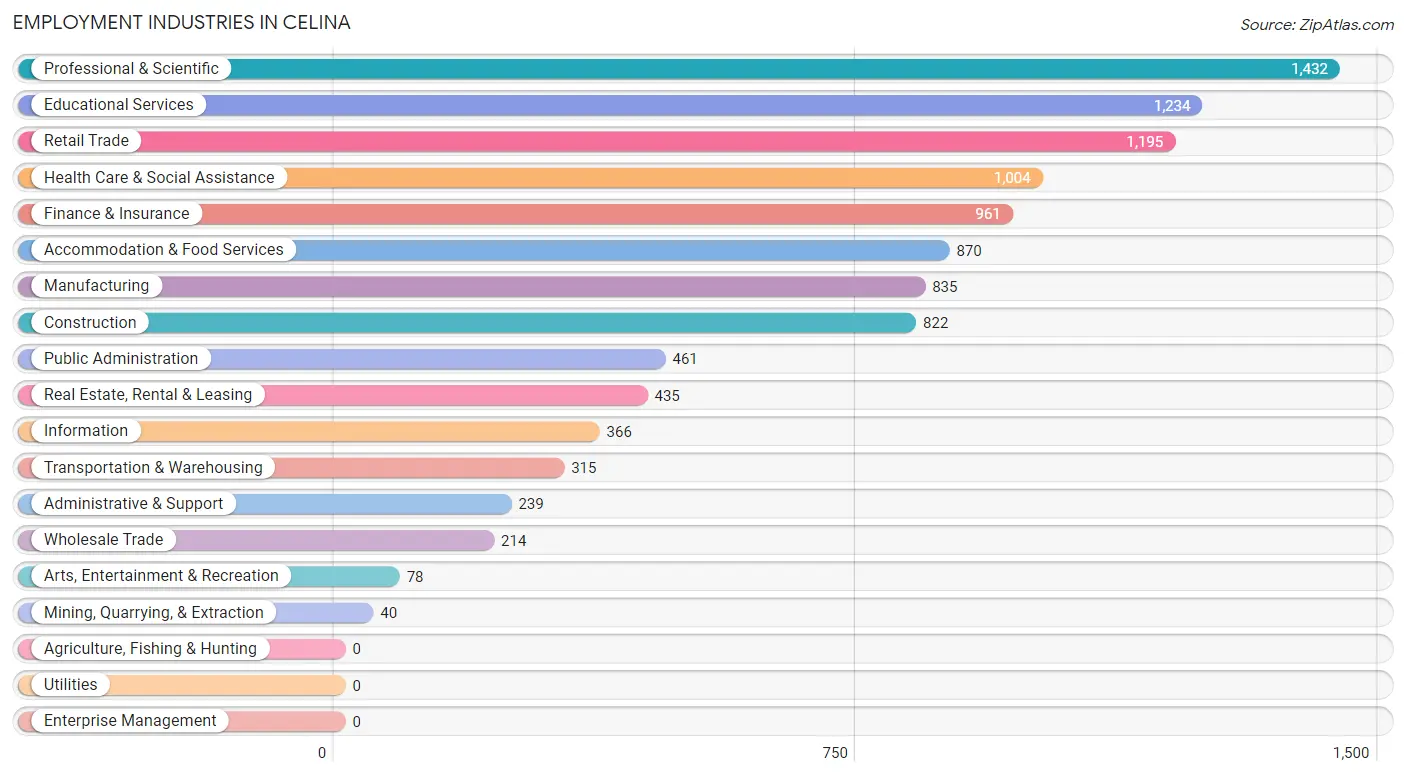
Employment Industries in Celina
The major employment industries in Celina include Professional & Scientific (1,432 | 13.1%), Educational Services (1,234 | 11.3%), Retail Trade (1,195 | 10.9%), Health Care & Social Assistance (1,004 | 9.2%), and Finance & Insurance (961 | 8.8%).
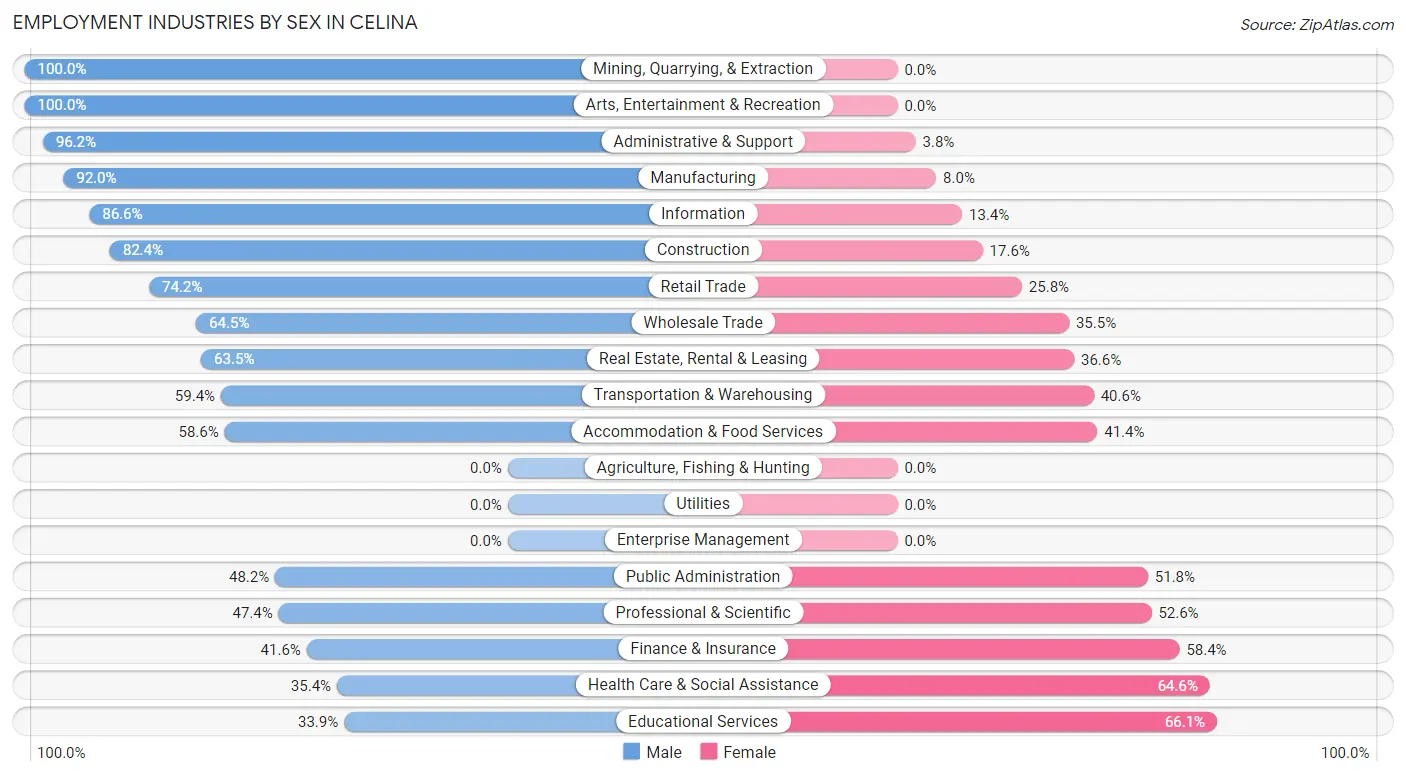
Employment Industries by Sex in Celina
The Celina industries that see more men than women are Mining, Quarrying, & Extraction (100.0%), Arts, Entertainment & Recreation (100.0%), and Administrative & Support (96.2%), whereas the industries that tend to have a higher number of women are Educational Services (66.1%), Health Care & Social Assistance (64.6%), and Finance & Insurance (58.4%).
| Industry | Male | Female |
| Agriculture, Fishing & Hunting | 0 (0.0%) | 0 (0.0%) |
| Mining, Quarrying, & Extraction | 40 (100.0%) | 0 (0.0%) |
| Construction | 677 (82.4%) | 145 (17.6%) |
| Manufacturing | 768 (92.0%) | 67 (8.0%) |
| Wholesale Trade | 138 (64.5%) | 76 (35.5%) |
| Retail Trade | 887 (74.2%) | 308 (25.8%) |
| Transportation & Warehousing | 187 (59.4%) | 128 (40.6%) |
| Utilities | 0 (0.0%) | 0 (0.0%) |
| Information | 317 (86.6%) | 49 (13.4%) |
| Finance & Insurance | 400 (41.6%) | 561 (58.4%) |
| Real Estate, Rental & Leasing | 276 (63.4%) | 159 (36.5%) |
| Professional & Scientific | 679 (47.4%) | 753 (52.6%) |
| Enterprise Management | 0 (0.0%) | 0 (0.0%) |
| Administrative & Support | 230 (96.2%) | 9 (3.8%) |
| Educational Services | 418 (33.9%) | 816 (66.1%) |
| Health Care & Social Assistance | 355 (35.4%) | 649 (64.6%) |
| Arts, Entertainment & Recreation | 78 (100.0%) | 0 (0.0%) |
| Accommodation & Food Services | 510 (58.6%) | 360 (41.4%) |
| Public Administration | 222 (48.2%) | 239 (51.8%) |
| Total | 6,209 (56.7%) | 4,747 (43.3%) |
Education in Celina
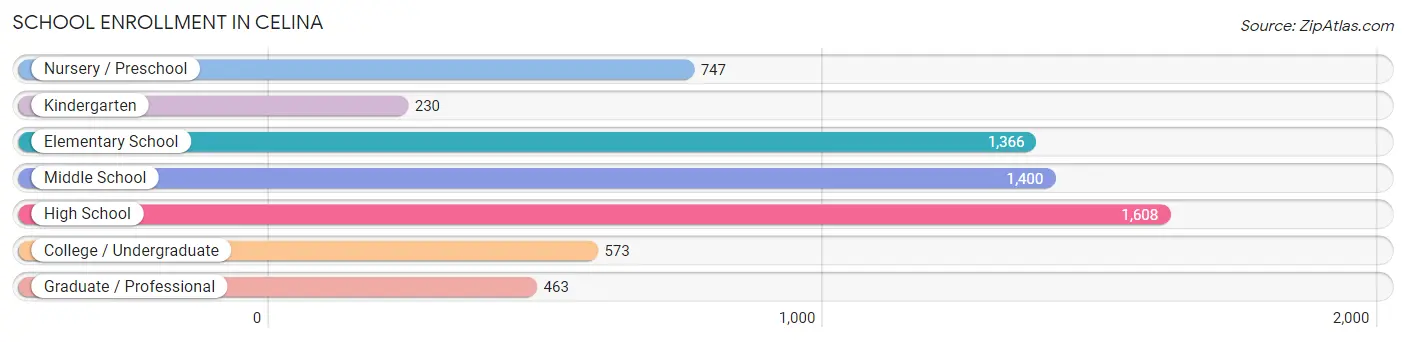
School Enrollment in Celina
The most common levels of schooling among the 6,387 students in Celina are high school (1,608 | 25.2%), middle school (1,400 | 21.9%), and elementary school (1,366 | 21.4%).
| School Level | # Students | % Students |
| Nursery / Preschool | 747 | 11.7% |
| Kindergarten | 230 | 3.6% |
| Elementary School | 1,366 | 21.4% |
| Middle School | 1,400 | 21.9% |
| High School | 1,608 | 25.2% |
| College / Undergraduate | 573 | 9.0% |
| Graduate / Professional | 463 | 7.2% |
| Total | 6,387 | 100.0% |
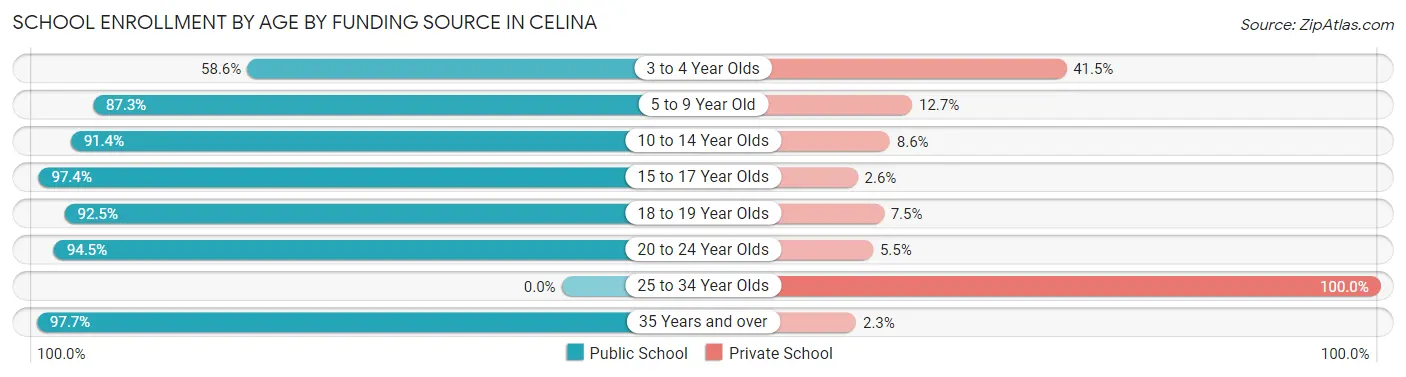
School Enrollment by Age by Funding Source in Celina
Out of a total of 6,387 students who are enrolled in schools in Celina, 703 (11.0%) attend a private institution, while the remaining 5,684 (89.0%) are enrolled in public schools. The age group of 25 to 34 year olds has the highest likelihood of being enrolled in private schools, with 102 (100.0% in the age bracket) enrolled. Conversely, the age group of 35 years and over has the lowest likelihood of being enrolled in a private school, with 551 (97.7% in the age bracket) attending a public institution.
| Age Bracket | Public School | Private School |
| 3 to 4 Year Olds | 178 (58.6%) | 126 (41.4%) |
| 5 to 9 Year Old | 1,680 (87.3%) | 245 (12.7%) |
| 10 to 14 Year Olds | 1,594 (91.4%) | 150 (8.6%) |
| 15 to 17 Year Olds | 1,237 (97.4%) | 33 (2.6%) |
| 18 to 19 Year Olds | 273 (92.5%) | 22 (7.5%) |
| 20 to 24 Year Olds | 173 (94.5%) | 10 (5.5%) |
| 25 to 34 Year Olds | 0 (0.0%) | 102 (100.0%) |
| 35 Years and over | 551 (97.7%) | 13 (2.3%) |
| Total | 5,684 (89.0%) | 703 (11.0%) |
Educational Attainment by Field of Study in Celina
Business (2,049 | 26.8%), computers & mathematics (856 | 11.2%), engineering (771 | 10.1%), education (734 | 9.6%), and communications (718 | 9.4%) are the most common fields of study among 7,635 individuals in Celina who have obtained a bachelor's degree or higher.
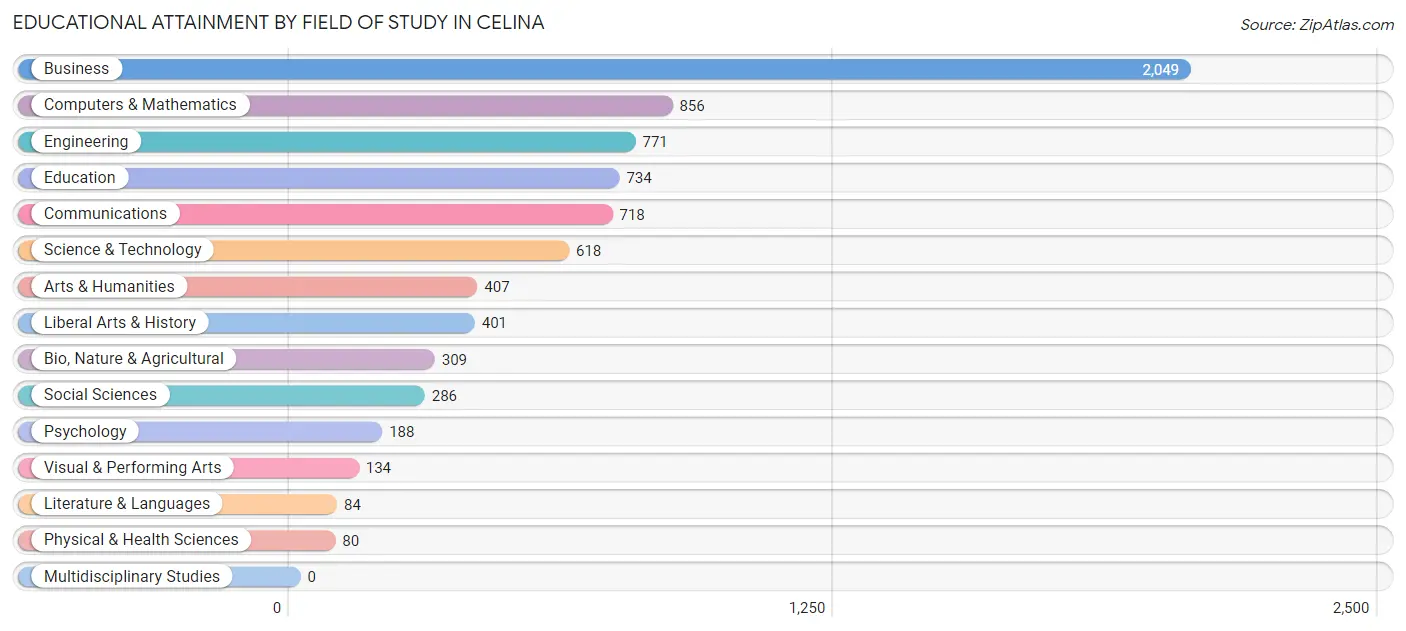
| Field of Study | # Graduates | % Graduates |
| Computers & Mathematics | 856 | 11.2% |
| Bio, Nature & Agricultural | 309 | 4.1% |
| Physical & Health Sciences | 80 | 1.1% |
| Psychology | 188 | 2.5% |
| Social Sciences | 286 | 3.7% |
| Engineering | 771 | 10.1% |
| Multidisciplinary Studies | 0 | 0.0% |
| Science & Technology | 618 | 8.1% |
| Business | 2,049 | 26.8% |
| Education | 734 | 9.6% |
| Literature & Languages | 84 | 1.1% |
| Liberal Arts & History | 401 | 5.2% |
| Visual & Performing Arts | 134 | 1.8% |
| Communications | 718 | 9.4% |
| Arts & Humanities | 407 | 5.3% |
| Total | 7,635 | 100.0% |
Transportation & Commute in Celina
Vehicle Availability by Sex in Celina
The most prevalent vehicle ownership categories in Celina are males with 2 vehicles (2,742, accounting for 44.6%) and females with 2 vehicles (1,782, making up 57.8%).
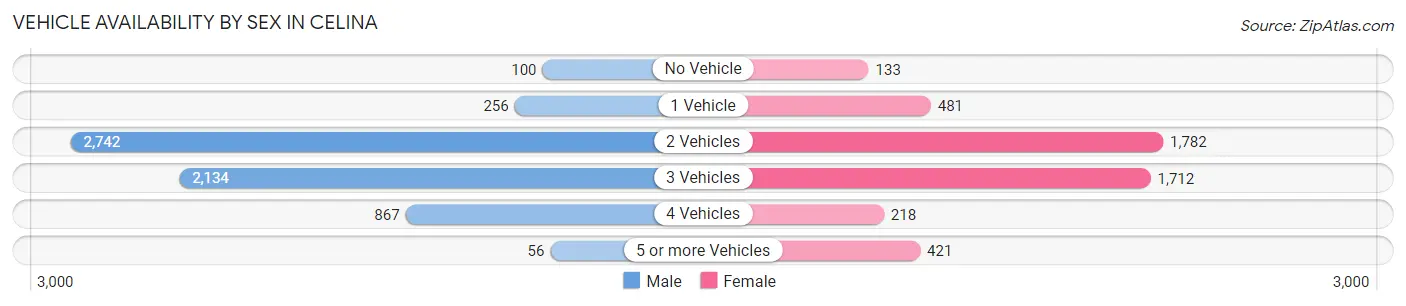
| Vehicles Available | Male | Female |
| No Vehicle | 100 (1.6%) | 133 (2.8%) |
| 1 Vehicle | 256 (4.2%) | 481 (10.1%) |
| 2 Vehicles | 2,742 (44.6%) | 1,782 (37.5%) |
| 3 Vehicles | 2,134 (34.7%) | 1,712 (36.1%) |
| 4 Vehicles | 867 (14.1%) | 218 (4.6%) |
| 5 or more Vehicles | 56 (0.9%) | 421 (8.9%) |
| Total | 6,155 (100.0%) | 4,747 (100.0%) |
Commute Time in Celina
The most frequently occuring commute durations in Celina are 30 to 34 minutes (1,261 commuters, 15.8%), 60 to 89 minutes (1,241 commuters, 15.6%), and 45 to 59 minutes (1,118 commuters, 14.0%).
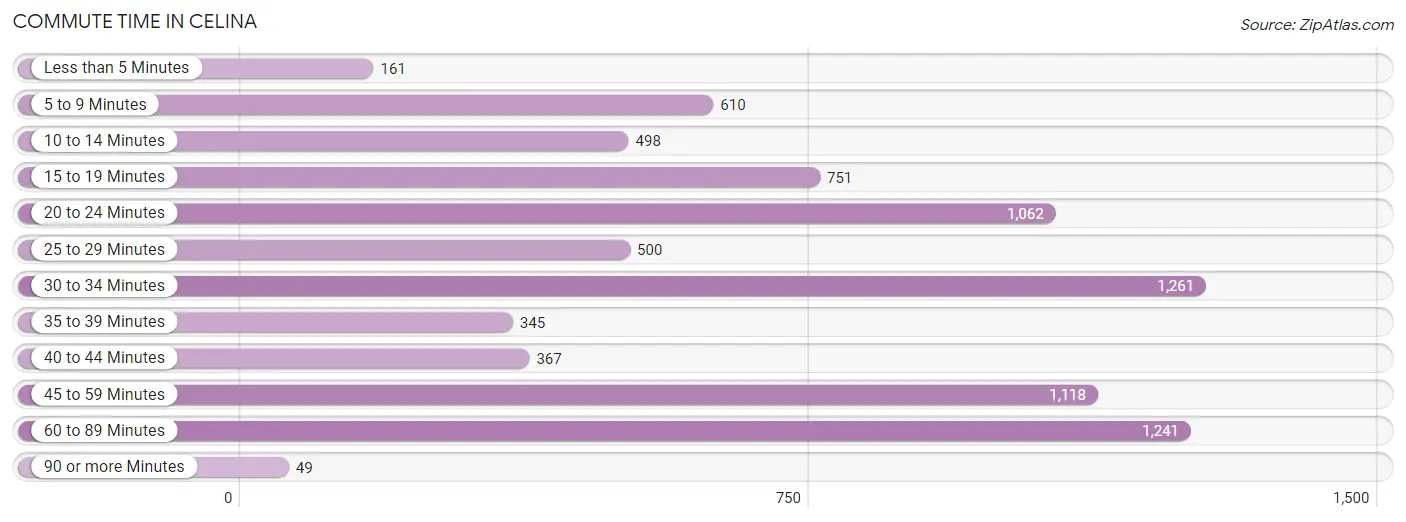
| Commute Time | # Commuters | % Commuters |
| Less than 5 Minutes | 161 | 2.0% |
| 5 to 9 Minutes | 610 | 7.7% |
| 10 to 14 Minutes | 498 | 6.2% |
| 15 to 19 Minutes | 751 | 9.4% |
| 20 to 24 Minutes | 1,062 | 13.3% |
| 25 to 29 Minutes | 500 | 6.3% |
| 30 to 34 Minutes | 1,261 | 15.8% |
| 35 to 39 Minutes | 345 | 4.3% |
| 40 to 44 Minutes | 367 | 4.6% |
| 45 to 59 Minutes | 1,118 | 14.0% |
| 60 to 89 Minutes | 1,241 | 15.6% |
| 90 or more Minutes | 49 | 0.6% |
Commute Time by Sex in Celina
The most common commute times in Celina are 20 to 24 minutes (844 commuters, 16.9%) for males and 60 to 89 minutes (490 commuters, 16.5%) for females.
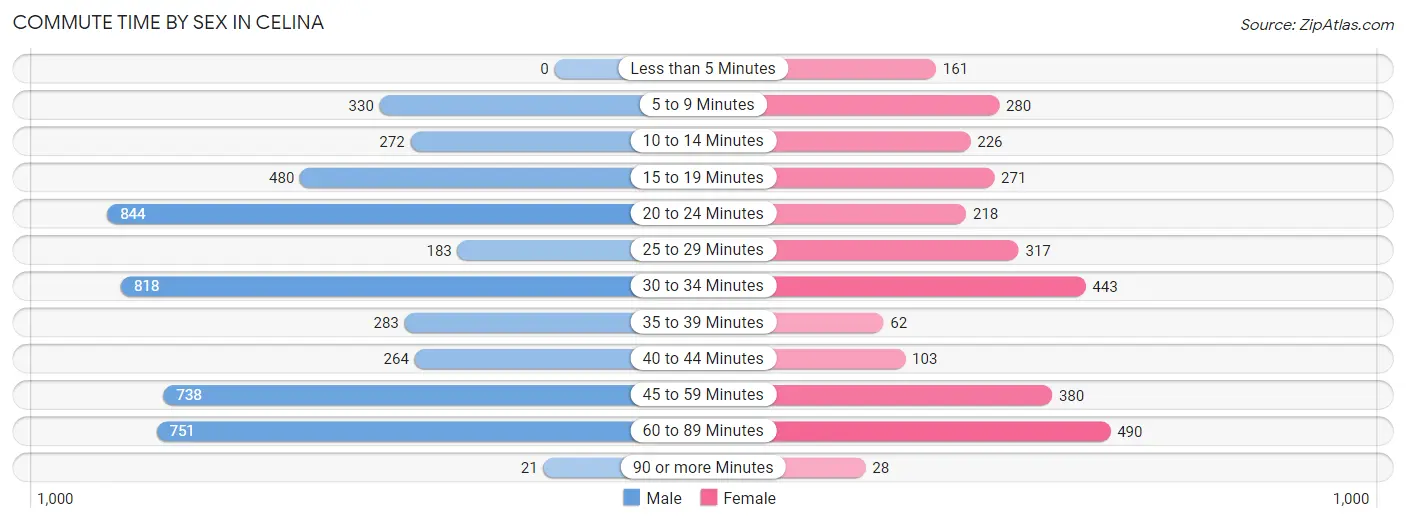
| Commute Time | Male | Female |
| Less than 5 Minutes | 0 (0.0%) | 161 (5.4%) |
| 5 to 9 Minutes | 330 (6.6%) | 280 (9.4%) |
| 10 to 14 Minutes | 272 (5.5%) | 226 (7.6%) |
| 15 to 19 Minutes | 480 (9.6%) | 271 (9.1%) |
| 20 to 24 Minutes | 844 (16.9%) | 218 (7.3%) |
| 25 to 29 Minutes | 183 (3.7%) | 317 (10.6%) |
| 30 to 34 Minutes | 818 (16.4%) | 443 (14.9%) |
| 35 to 39 Minutes | 283 (5.7%) | 62 (2.1%) |
| 40 to 44 Minutes | 264 (5.3%) | 103 (3.5%) |
| 45 to 59 Minutes | 738 (14.8%) | 380 (12.8%) |
| 60 to 89 Minutes | 751 (15.1%) | 490 (16.5%) |
| 90 or more Minutes | 21 (0.4%) | 28 (0.9%) |
Time of Departure to Work by Sex in Celina
The most frequent times of departure to work in Celina are 7:30 AM to 7:59 AM (1,114, 22.4%) for males and 7:30 AM to 7:59 AM (703, 23.6%) for females.
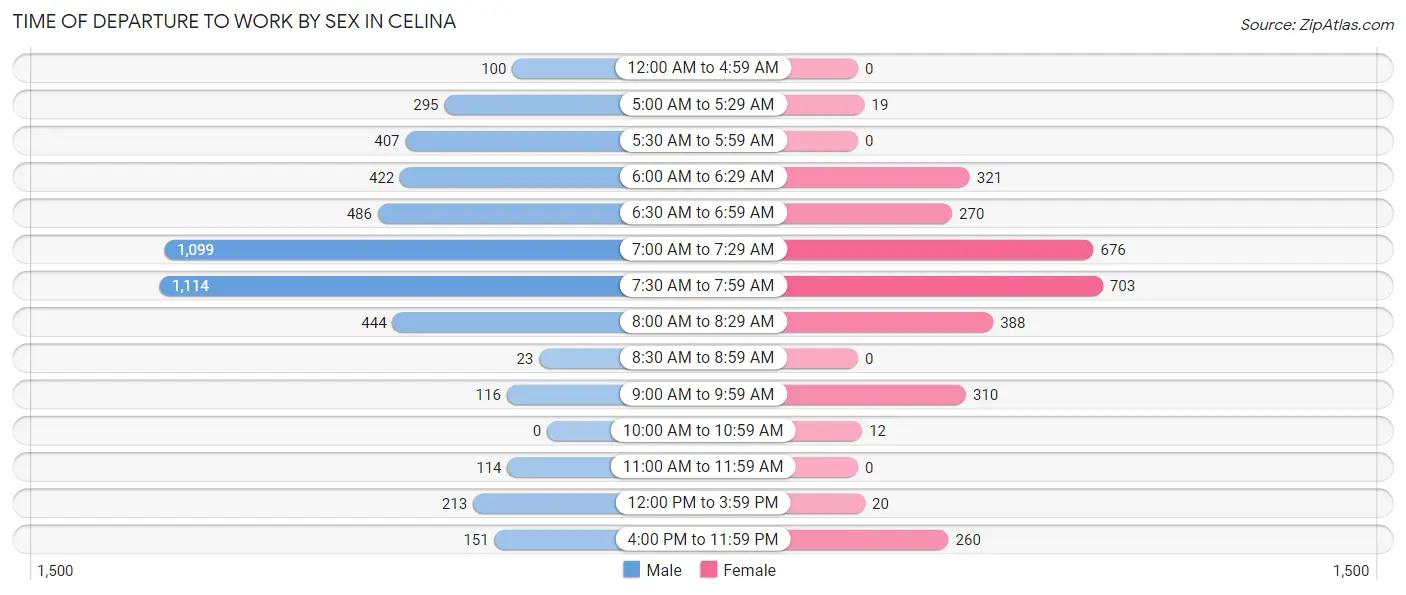
| Time of Departure | Male | Female |
| 12:00 AM to 4:59 AM | 100 (2.0%) | 0 (0.0%) |
| 5:00 AM to 5:29 AM | 295 (5.9%) | 19 (0.6%) |
| 5:30 AM to 5:59 AM | 407 (8.2%) | 0 (0.0%) |
| 6:00 AM to 6:29 AM | 422 (8.5%) | 321 (10.8%) |
| 6:30 AM to 6:59 AM | 486 (9.8%) | 270 (9.1%) |
| 7:00 AM to 7:29 AM | 1,099 (22.1%) | 676 (22.7%) |
| 7:30 AM to 7:59 AM | 1,114 (22.4%) | 703 (23.6%) |
| 8:00 AM to 8:29 AM | 444 (8.9%) | 388 (13.0%) |
| 8:30 AM to 8:59 AM | 23 (0.5%) | 0 (0.0%) |
| 9:00 AM to 9:59 AM | 116 (2.3%) | 310 (10.4%) |
| 10:00 AM to 10:59 AM | 0 (0.0%) | 12 (0.4%) |
| 11:00 AM to 11:59 AM | 114 (2.3%) | 0 (0.0%) |
| 12:00 PM to 3:59 PM | 213 (4.3%) | 20 (0.7%) |
| 4:00 PM to 11:59 PM | 151 (3.0%) | 260 (8.7%) |
| Total | 4,984 (100.0%) | 2,979 (100.0%) |
Housing Occupancy in Celina
Occupancy by Ownership in Celina
Of the total 7,008 dwellings in Celina, owner-occupied units account for 6,342 (90.5%), while renter-occupied units make up 666 (9.5%).
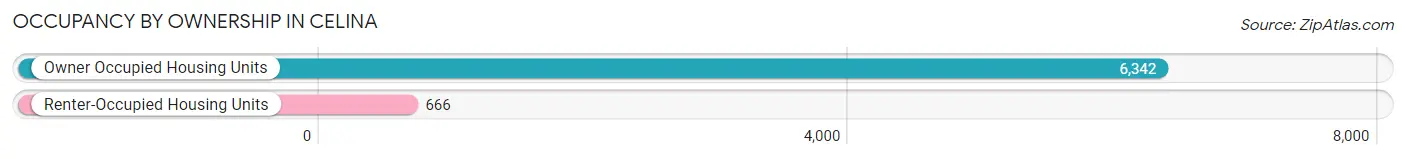
| Occupancy | # Housing Units | % Housing Units |
| Owner Occupied Housing Units | 6,342 | 90.5% |
| Renter-Occupied Housing Units | 666 | 9.5% |
| Total Occupied Housing Units | 7,008 | 100.0% |
Occupancy by Household Size in Celina
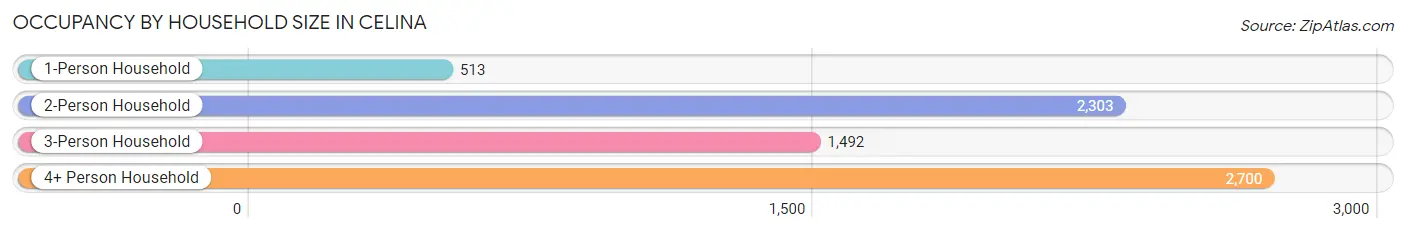
| Household Size | # Housing Units | % Housing Units |
| 1-Person Household | 513 | 7.3% |
| 2-Person Household | 2,303 | 32.9% |
| 3-Person Household | 1,492 | 21.3% |
| 4+ Person Household | 2,700 | 38.5% |
| Total Housing Units | 7,008 | 100.0% |
Occupancy by Ownership by Household Size in Celina
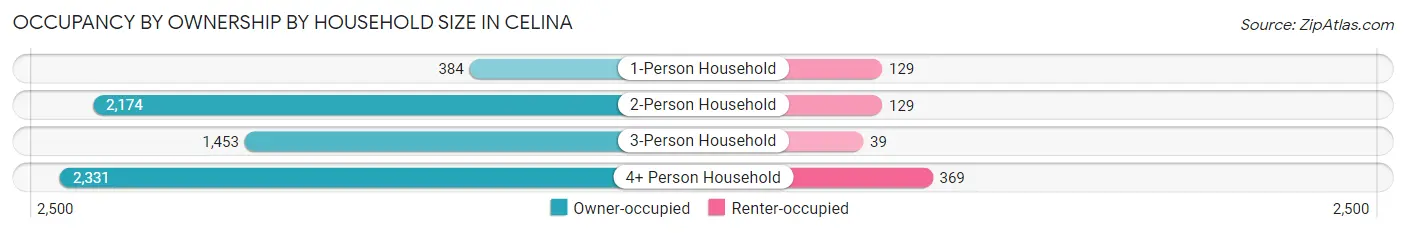
| Household Size | Owner-occupied | Renter-occupied |
| 1-Person Household | 384 (74.9%) | 129 (25.2%) |
| 2-Person Household | 2,174 (94.4%) | 129 (5.6%) |
| 3-Person Household | 1,453 (97.4%) | 39 (2.6%) |
| 4+ Person Household | 2,331 (86.3%) | 369 (13.7%) |
| Total Housing Units | 6,342 (90.5%) | 666 (9.5%) |
Occupancy by Educational Attainment in Celina
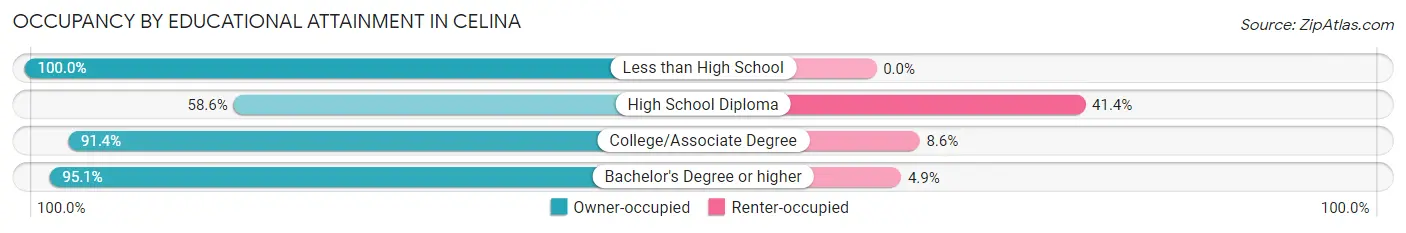
| Household Size | Owner-occupied | Renter-occupied |
| Less than High School | 172 (100.0%) | 0 (0.0%) |
| High School Diploma | 386 (58.6%) | 273 (41.4%) |
| College/Associate Degree | 2,228 (91.4%) | 209 (8.6%) |
| Bachelor's Degree or higher | 3,556 (95.1%) | 184 (4.9%) |
Occupancy by Age of Householder in Celina
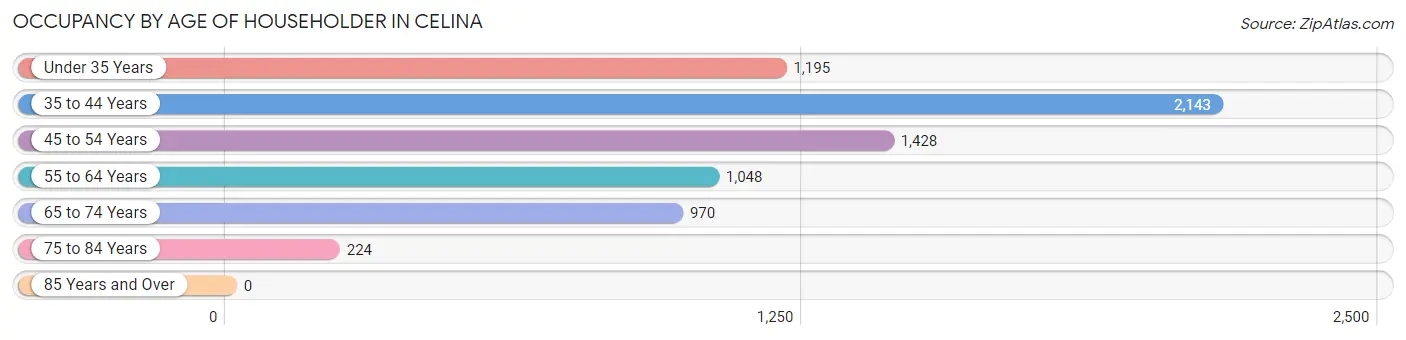
| Age Bracket | # Households | % Households |
| Under 35 Years | 1,195 | 17.1% |
| 35 to 44 Years | 2,143 | 30.6% |
| 45 to 54 Years | 1,428 | 20.4% |
| 55 to 64 Years | 1,048 | 14.9% |
| 65 to 74 Years | 970 | 13.8% |
| 75 to 84 Years | 224 | 3.2% |
| 85 Years and Over | 0 | 0.0% |
| Total | 7,008 | 100.0% |
Housing Finances in Celina
Median Income by Occupancy in Celina
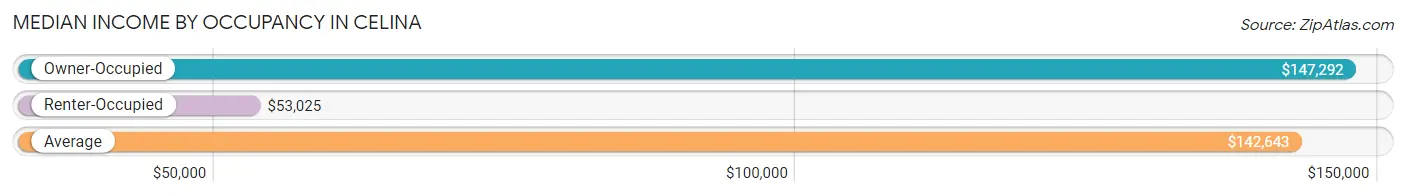
| Occupancy Type | # Households | Median Income |
| Owner-Occupied | 6,342 (90.5%) | $147,292 |
| Renter-Occupied | 666 (9.5%) | $53,025 |
| Average | 7,008 (100.0%) | $142,643 |
Occupancy by Householder Income Bracket in Celina
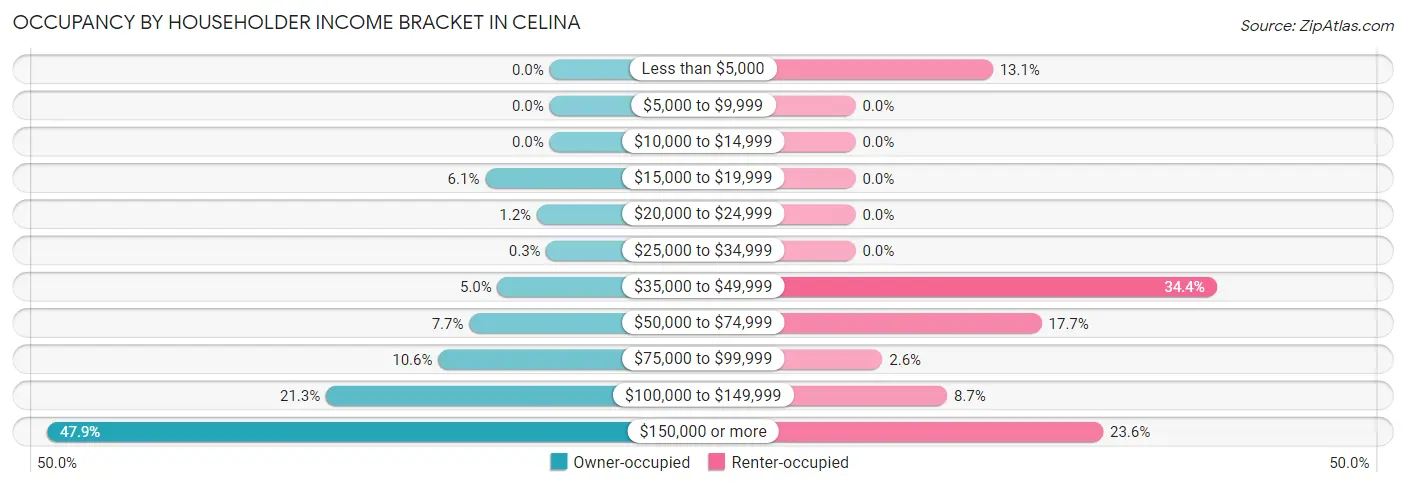
| Income Bracket | Owner-occupied | Renter-occupied |
| Less than $5,000 | 0 (0.0%) | 87 (13.1%) |
| $5,000 to $9,999 | 0 (0.0%) | 0 (0.0%) |
| $10,000 to $14,999 | 0 (0.0%) | 0 (0.0%) |
| $15,000 to $19,999 | 389 (6.1%) | 0 (0.0%) |
| $20,000 to $24,999 | 77 (1.2%) | 0 (0.0%) |
| $25,000 to $34,999 | 19 (0.3%) | 0 (0.0%) |
| $35,000 to $49,999 | 314 (5.0%) | 229 (34.4%) |
| $50,000 to $74,999 | 485 (7.6%) | 118 (17.7%) |
| $75,000 to $99,999 | 672 (10.6%) | 17 (2.5%) |
| $100,000 to $149,999 | 1,350 (21.3%) | 58 (8.7%) |
| $150,000 or more | 3,036 (47.9%) | 157 (23.6%) |
| Total | 6,342 (100.0%) | 666 (100.0%) |
Monthly Housing Cost Tiers in Celina
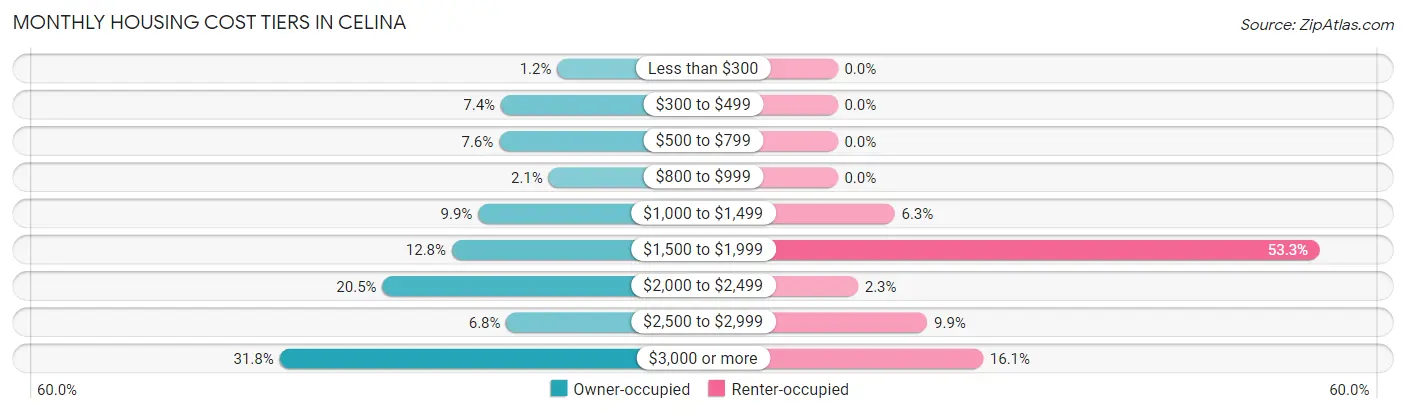
| Monthly Cost | Owner-occupied | Renter-occupied |
| Less than $300 | 73 (1.1%) | 0 (0.0%) |
| $300 to $499 | 468 (7.4%) | 0 (0.0%) |
| $500 to $799 | 481 (7.6%) | 0 (0.0%) |
| $800 to $999 | 134 (2.1%) | 0 (0.0%) |
| $1,000 to $1,499 | 627 (9.9%) | 42 (6.3%) |
| $1,500 to $1,999 | 812 (12.8%) | 355 (53.3%) |
| $2,000 to $2,499 | 1,298 (20.5%) | 15 (2.2%) |
| $2,500 to $2,999 | 430 (6.8%) | 66 (9.9%) |
| $3,000 or more | 2,019 (31.8%) | 107 (16.1%) |
| Total | 6,342 (100.0%) | 666 (100.0%) |
Physical Housing Characteristics in Celina
Housing Structures in Celina
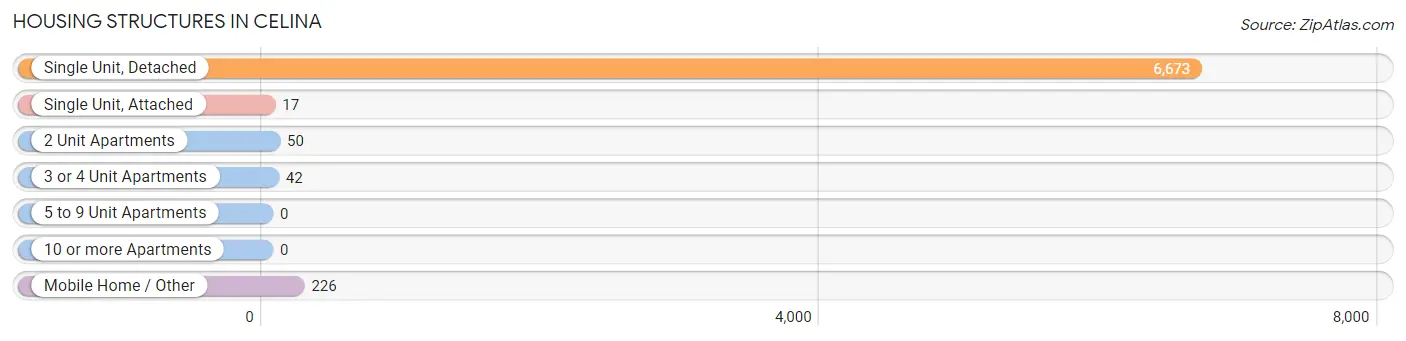
| Structure Type | # Housing Units | % Housing Units |
| Single Unit, Detached | 6,673 | 95.2% |
| Single Unit, Attached | 17 | 0.2% |
| 2 Unit Apartments | 50 | 0.7% |
| 3 or 4 Unit Apartments | 42 | 0.6% |
| 5 to 9 Unit Apartments | 0 | 0.0% |
| 10 or more Apartments | 0 | 0.0% |
| Mobile Home / Other | 226 | 3.2% |
| Total | 7,008 | 100.0% |
Housing Structures by Occupancy in Celina
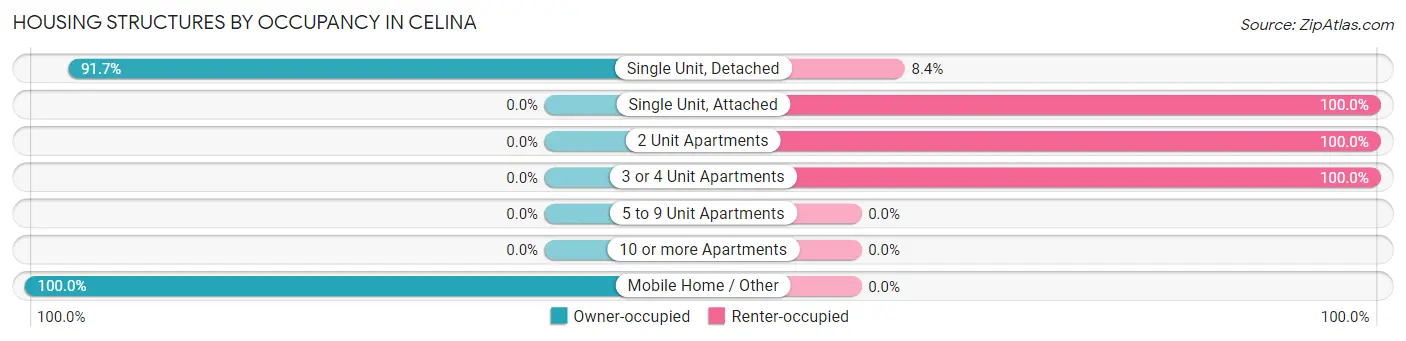
| Structure Type | Owner-occupied | Renter-occupied |
| Single Unit, Detached | 6,116 (91.6%) | 557 (8.4%) |
| Single Unit, Attached | 0 (0.0%) | 17 (100.0%) |
| 2 Unit Apartments | 0 (0.0%) | 50 (100.0%) |
| 3 or 4 Unit Apartments | 0 (0.0%) | 42 (100.0%) |
| 5 to 9 Unit Apartments | 0 (0.0%) | 0 (0.0%) |
| 10 or more Apartments | 0 (0.0%) | 0 (0.0%) |
| Mobile Home / Other | 226 (100.0%) | 0 (0.0%) |
| Total | 6,342 (90.5%) | 666 (9.5%) |
Housing Structures by Number of Rooms in Celina
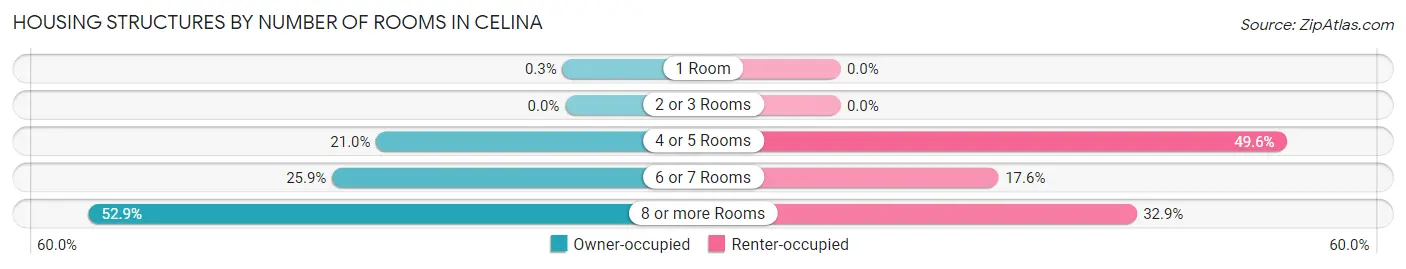
| Number of Rooms | Owner-occupied | Renter-occupied |
| 1 Room | 19 (0.3%) | 0 (0.0%) |
| 2 or 3 Rooms | 0 (0.0%) | 0 (0.0%) |
| 4 or 5 Rooms | 1,329 (21.0%) | 330 (49.5%) |
| 6 or 7 Rooms | 1,640 (25.9%) | 117 (17.6%) |
| 8 or more Rooms | 3,354 (52.9%) | 219 (32.9%) |
| Total | 6,342 (100.0%) | 666 (100.0%) |
Housing Structure by Heating Type in Celina
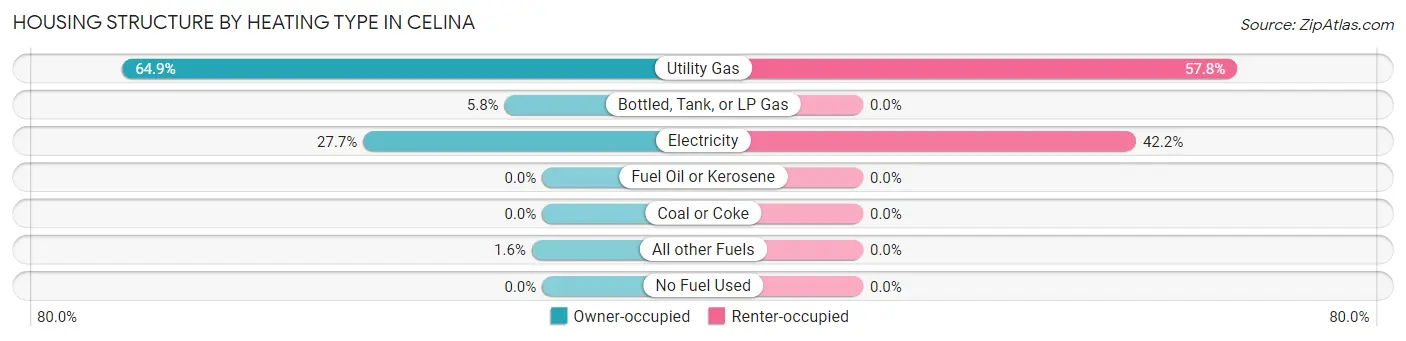
| Heating Type | Owner-occupied | Renter-occupied |
| Utility Gas | 4,116 (64.9%) | 385 (57.8%) |
| Bottled, Tank, or LP Gas | 369 (5.8%) | 0 (0.0%) |
| Electricity | 1,755 (27.7%) | 281 (42.2%) |
| Fuel Oil or Kerosene | 0 (0.0%) | 0 (0.0%) |
| Coal or Coke | 0 (0.0%) | 0 (0.0%) |
| All other Fuels | 102 (1.6%) | 0 (0.0%) |
| No Fuel Used | 0 (0.0%) | 0 (0.0%) |
| Total | 6,342 (100.0%) | 666 (100.0%) |
Household Vehicle Usage in Celina
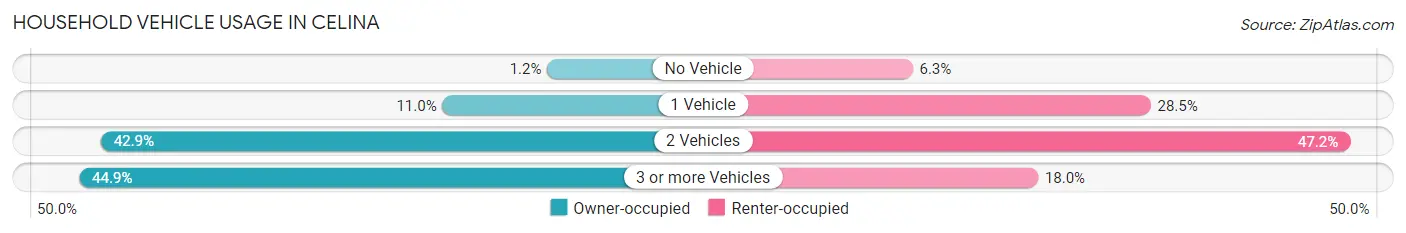
| Vehicles per Household | Owner-occupied | Renter-occupied |
| No Vehicle | 77 (1.2%) | 42 (6.3%) |
| 1 Vehicle | 697 (11.0%) | 190 (28.5%) |
| 2 Vehicles | 2,720 (42.9%) | 314 (47.1%) |
| 3 or more Vehicles | 2,848 (44.9%) | 120 (18.0%) |
| Total | 6,342 (100.0%) | 666 (100.0%) |
Real Estate & Mortgages in Celina
Real Estate and Mortgage Overview in Celina
| Characteristic | Without Mortgage | With Mortgage |
| Housing Units | 1,459 | 4,883 |
| Median Property Value | $262,300 | $440,900 |
| Median Household Income | - | - |
| Monthly Housing Costs | $748 | $1,981 |
| Real Estate Taxes | $3,483 | $177 |
Property Value by Mortgage Status in Celina
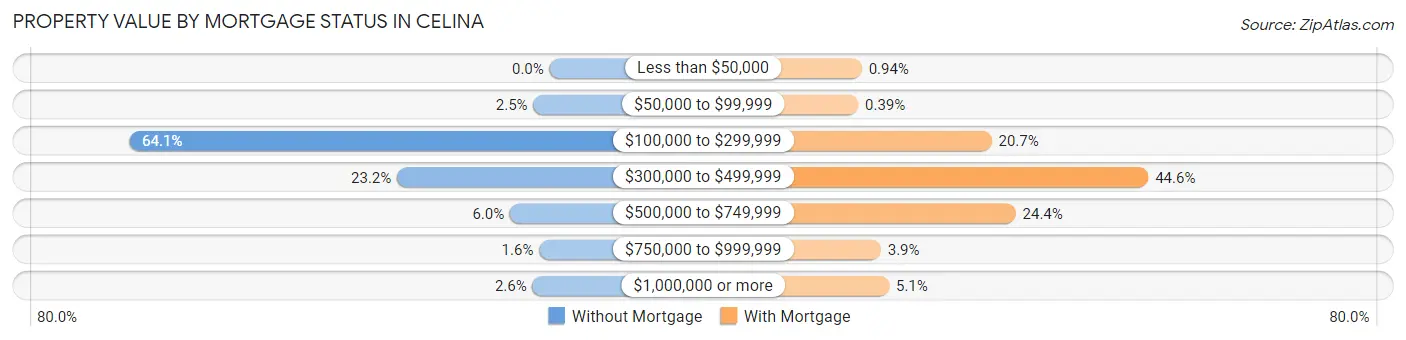
| Property Value | Without Mortgage | With Mortgage |
| Less than $50,000 | 0 (0.0%) | 46 (0.9%) |
| $50,000 to $99,999 | 36 (2.5%) | 19 (0.4%) |
| $100,000 to $299,999 | 935 (64.1%) | 1,012 (20.7%) |
| $300,000 to $499,999 | 339 (23.2%) | 2,178 (44.6%) |
| $500,000 to $749,999 | 88 (6.0%) | 1,191 (24.4%) |
| $750,000 to $999,999 | 23 (1.6%) | 188 (3.8%) |
| $1,000,000 or more | 38 (2.6%) | 249 (5.1%) |
| Total | 1,459 (100.0%) | 4,883 (100.0%) |
Household Income by Mortgage Status in Celina
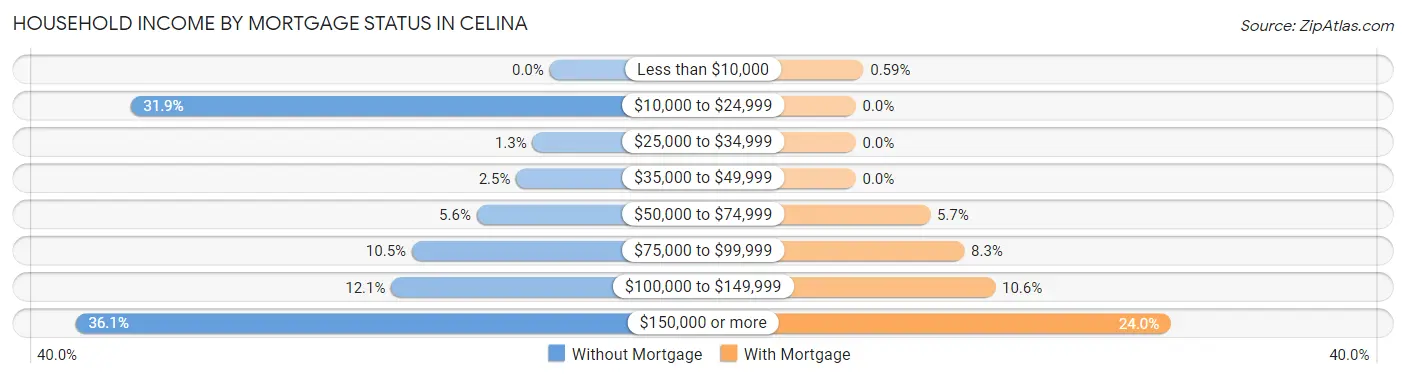
| Household Income | Without Mortgage | With Mortgage |
| Less than $10,000 | 0 (0.0%) | 29 (0.6%) |
| $10,000 to $24,999 | 466 (31.9%) | 0 (0.0%) |
| $25,000 to $34,999 | 19 (1.3%) | 0 (0.0%) |
| $35,000 to $49,999 | 37 (2.5%) | 0 (0.0%) |
| $50,000 to $74,999 | 81 (5.6%) | 277 (5.7%) |
| $75,000 to $99,999 | 153 (10.5%) | 404 (8.3%) |
| $100,000 to $149,999 | 176 (12.1%) | 519 (10.6%) |
| $150,000 or more | 527 (36.1%) | 1,174 (24.0%) |
| Total | 1,459 (100.0%) | 4,883 (100.0%) |
Property Value to Household Income Ratio in Celina
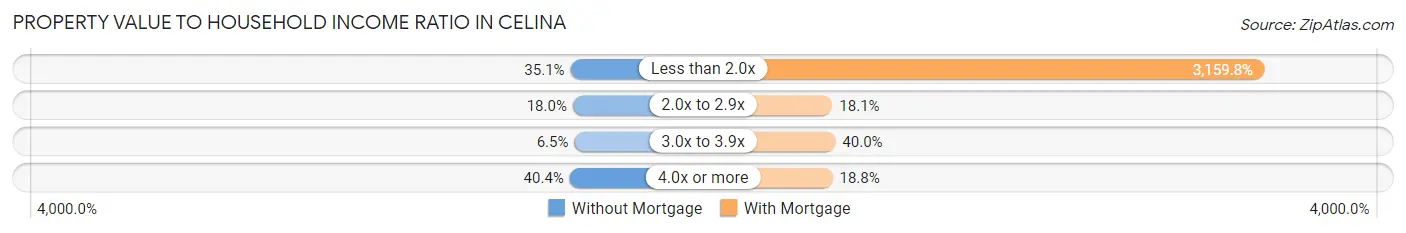
| Value-to-Income Ratio | Without Mortgage | With Mortgage |
| Less than 2.0x | 512 (35.1%) | 154,295 (3,159.8%) |
| 2.0x to 2.9x | 262 (18.0%) | 886 (18.1%) |
| 3.0x to 3.9x | 95 (6.5%) | 1,952 (40.0%) |
| 4.0x or more | 590 (40.4%) | 920 (18.8%) |
| Total | 1,459 (100.0%) | 4,883 (100.0%) |
Real Estate Taxes by Mortgage Status in Celina
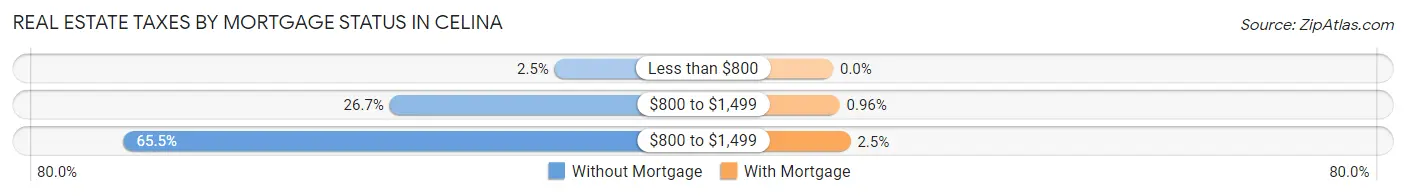
| Property Taxes | Without Mortgage | With Mortgage |
| Less than $800 | 37 (2.5%) | 0 (0.0%) |
| $800 to $1,499 | 389 (26.7%) | 47 (1.0%) |
| $800 to $1,499 | 956 (65.5%) | 124 (2.5%) |
| Total | 1,459 (100.0%) | 4,883 (100.0%) |
Health & Disability in Celina
Health Insurance Coverage by Age in Celina
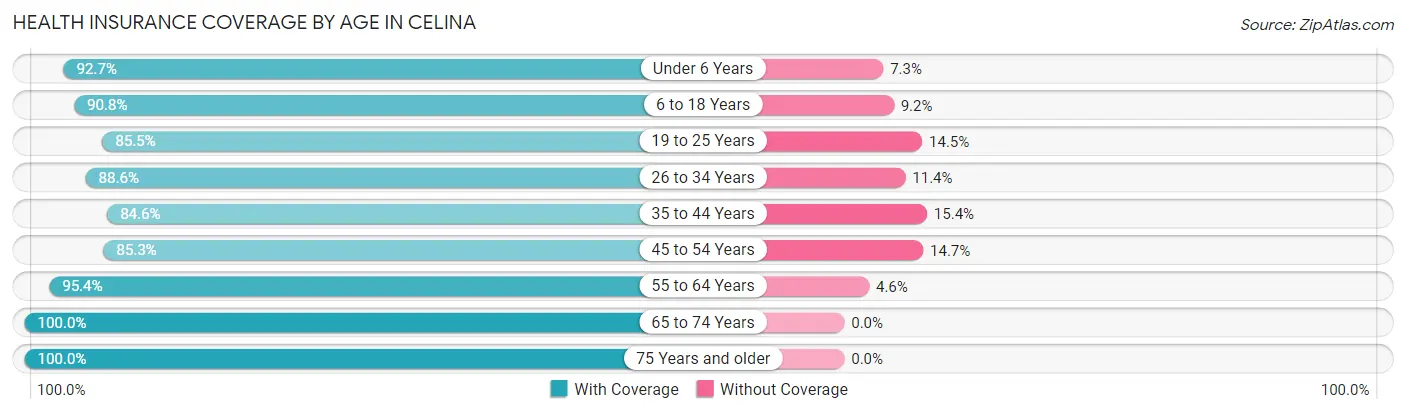
| Age Bracket | With Coverage | Without Coverage |
| Under 6 Years | 1,725 (92.7%) | 135 (7.3%) |
| 6 to 18 Years | 4,261 (90.8%) | 433 (9.2%) |
| 19 to 25 Years | 1,314 (85.5%) | 223 (14.5%) |
| 26 to 34 Years | 2,000 (88.6%) | 257 (11.4%) |
| 35 to 44 Years | 3,853 (84.6%) | 702 (15.4%) |
| 45 to 54 Years | 2,065 (85.3%) | 356 (14.7%) |
| 55 to 64 Years | 1,532 (95.4%) | 74 (4.6%) |
| 65 to 74 Years | 1,955 (100.0%) | 0 (0.0%) |
| 75 Years and older | 471 (100.0%) | 0 (0.0%) |
| Total | 19,176 (89.8%) | 2,180 (10.2%) |
Health Insurance Coverage by Citizenship Status in Celina
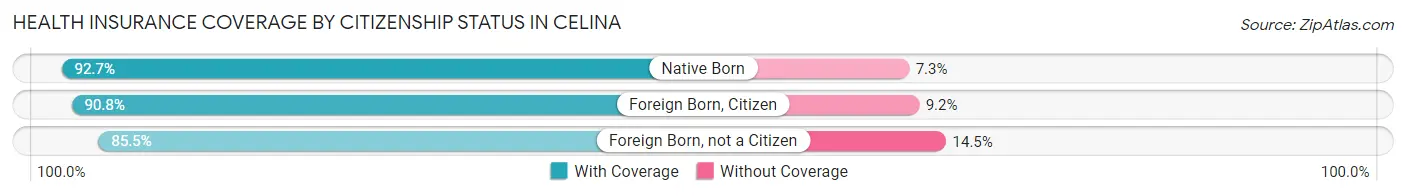
| Citizenship Status | With Coverage | Without Coverage |
| Native Born | 1,725 (92.7%) | 135 (7.3%) |
| Foreign Born, Citizen | 4,261 (90.8%) | 433 (9.2%) |
| Foreign Born, not a Citizen | 1,314 (85.5%) | 223 (14.5%) |
Health Insurance Coverage by Household Income in Celina
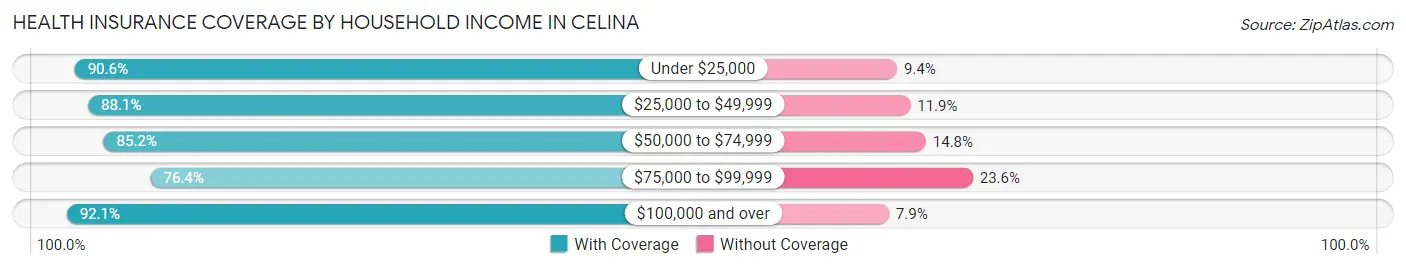
| Household Income | With Coverage | Without Coverage |
| Under $25,000 | 1,186 (90.6%) | 123 (9.4%) |
| $25,000 to $49,999 | 1,155 (88.1%) | 156 (11.9%) |
| $50,000 to $74,999 | 1,265 (85.2%) | 220 (14.8%) |
| $75,000 to $99,999 | 1,557 (76.4%) | 481 (23.6%) |
| $100,000 and over | 14,013 (92.1%) | 1,200 (7.9%) |
Public vs Private Health Insurance Coverage by Age in Celina
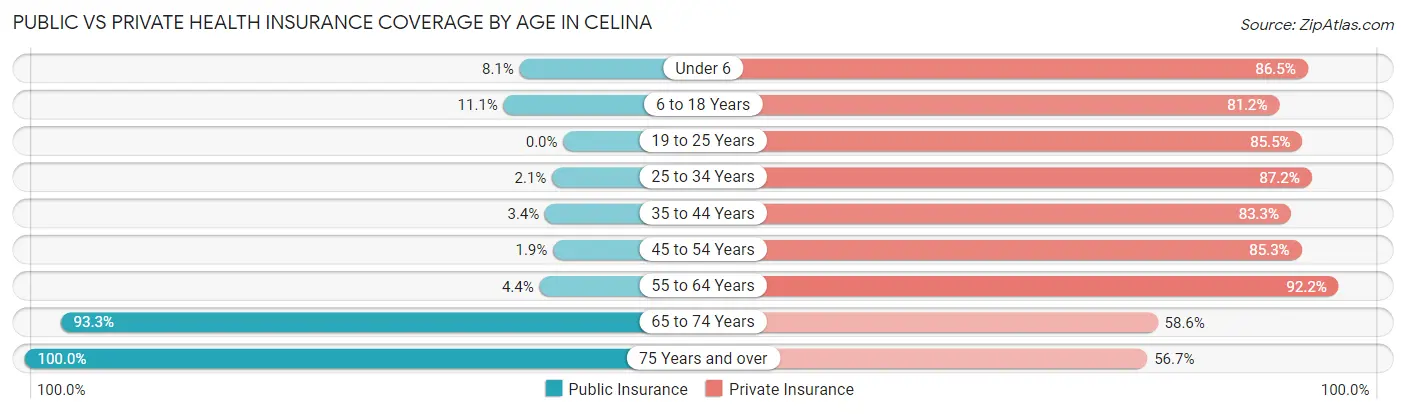
| Age Bracket | Public Insurance | Private Insurance |
| Under 6 | 151 (8.1%) | 1,608 (86.5%) |
| 6 to 18 Years | 520 (11.1%) | 3,812 (81.2%) |
| 19 to 25 Years | 0 (0.0%) | 1,314 (85.5%) |
| 25 to 34 Years | 47 (2.1%) | 1,968 (87.2%) |
| 35 to 44 Years | 154 (3.4%) | 3,796 (83.3%) |
| 45 to 54 Years | 46 (1.9%) | 2,065 (85.3%) |
| 55 to 64 Years | 71 (4.4%) | 1,481 (92.2%) |
| 65 to 74 Years | 1,824 (93.3%) | 1,146 (58.6%) |
| 75 Years and over | 471 (100.0%) | 267 (56.7%) |
| Total | 3,284 (15.4%) | 17,457 (81.7%) |
Disability Status by Sex by Age in Celina
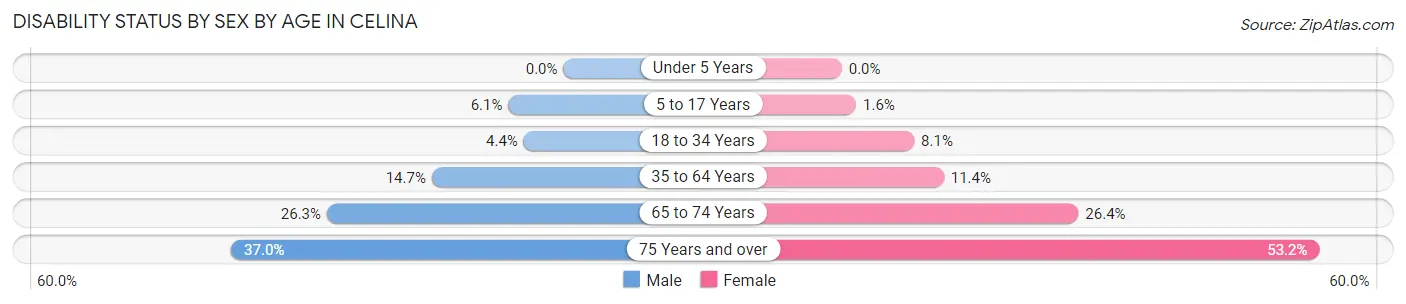
| Age Bracket | Male | Female |
| Under 5 Years | 0 (0.0%) | 0 (0.0%) |
| 5 to 17 Years | 184 (6.1%) | 34 (1.6%) |
| 18 to 34 Years | 99 (4.4%) | 145 (8.1%) |
| 35 to 64 Years | 636 (14.7%) | 482 (11.4%) |
| 65 to 74 Years | 246 (26.3%) | 269 (26.4%) |
| 75 Years and over | 81 (37.0%) | 134 (53.2%) |
Disability Class by Sex by Age in Celina
Disability Class: Hearing Difficulty
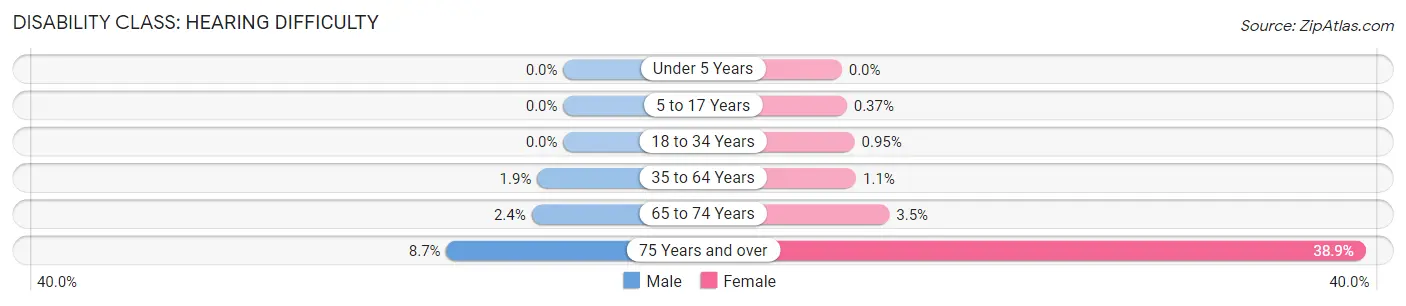
| Age Bracket | Male | Female |
| Under 5 Years | 0 (0.0%) | 0 (0.0%) |
| 5 to 17 Years | 0 (0.0%) | 8 (0.4%) |
| 18 to 34 Years | 0 (0.0%) | 17 (0.9%) |
| 35 to 64 Years | 84 (1.9%) | 45 (1.1%) |
| 65 to 74 Years | 22 (2.4%) | 36 (3.5%) |
| 75 Years and over | 19 (8.7%) | 98 (38.9%) |
Disability Class: Vision Difficulty
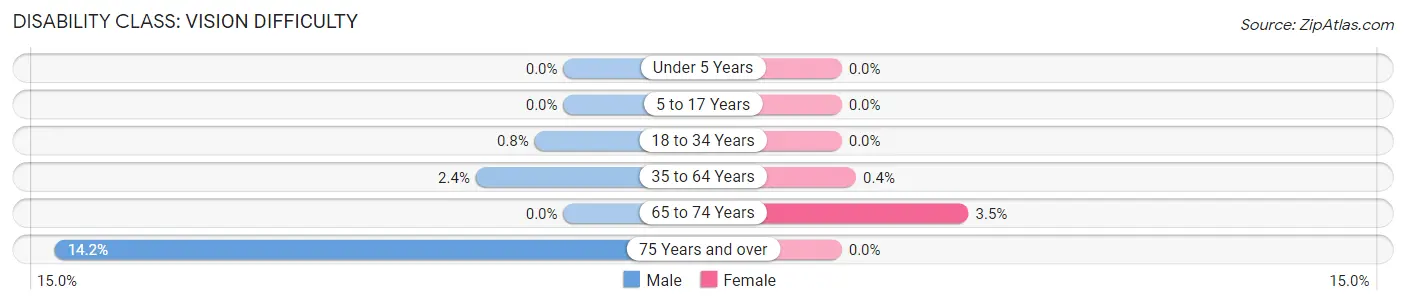
| Age Bracket | Male | Female |
| Under 5 Years | 0 (0.0%) | 0 (0.0%) |
| 5 to 17 Years | 0 (0.0%) | 0 (0.0%) |
| 18 to 34 Years | 18 (0.8%) | 0 (0.0%) |
| 35 to 64 Years | 106 (2.4%) | 17 (0.4%) |
| 65 to 74 Years | 0 (0.0%) | 36 (3.5%) |
| 75 Years and over | 31 (14.2%) | 0 (0.0%) |
Disability Class: Cognitive Difficulty
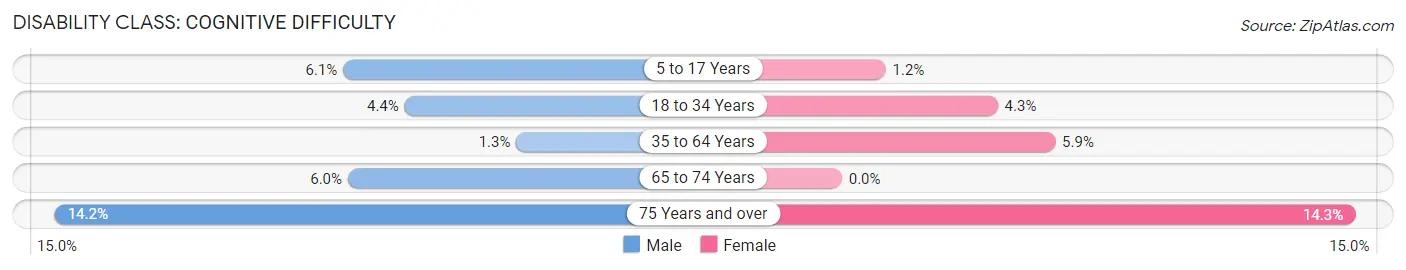
| Age Bracket | Male | Female |
| 5 to 17 Years | 184 (6.1%) | 26 (1.2%) |
| 18 to 34 Years | 99 (4.4%) | 78 (4.3%) |
| 35 to 64 Years | 57 (1.3%) | 252 (5.9%) |
| 65 to 74 Years | 56 (6.0%) | 0 (0.0%) |
| 75 Years and over | 31 (14.2%) | 36 (14.3%) |
Disability Class: Ambulatory Difficulty
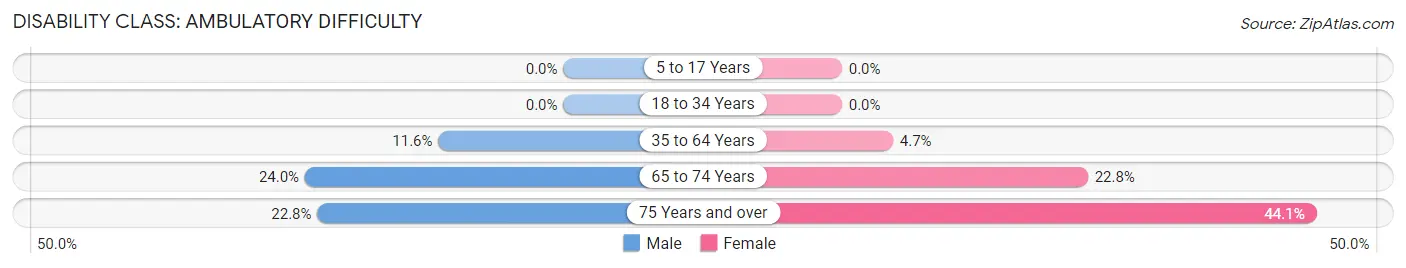
| Age Bracket | Male | Female |
| 5 to 17 Years | 0 (0.0%) | 0 (0.0%) |
| 18 to 34 Years | 0 (0.0%) | 0 (0.0%) |
| 35 to 64 Years | 503 (11.6%) | 201 (4.7%) |
| 65 to 74 Years | 224 (24.0%) | 233 (22.8%) |
| 75 Years and over | 50 (22.8%) | 111 (44.1%) |
Disability Class: Self-Care Difficulty
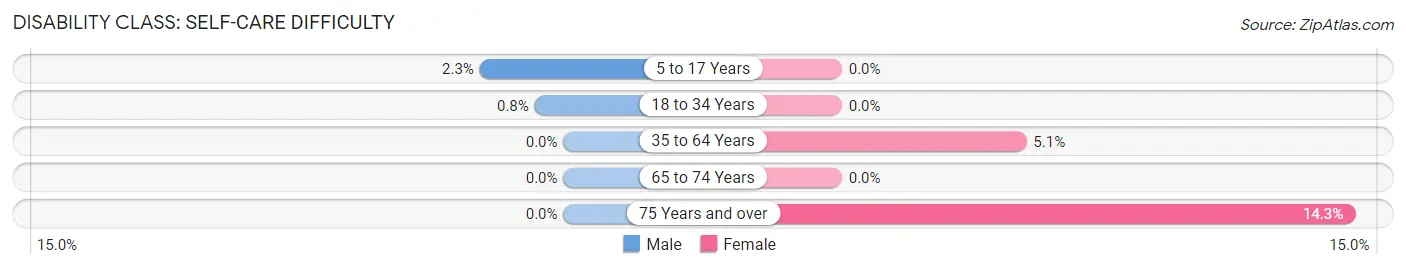
| Age Bracket | Male | Female |
| 5 to 17 Years | 70 (2.3%) | 0 (0.0%) |
| 18 to 34 Years | 18 (0.8%) | 0 (0.0%) |
| 35 to 64 Years | 0 (0.0%) | 218 (5.1%) |
| 65 to 74 Years | 0 (0.0%) | 0 (0.0%) |
| 75 Years and over | 0 (0.0%) | 36 (14.3%) |
Technology Access in Celina
Computing Device Access in Celina
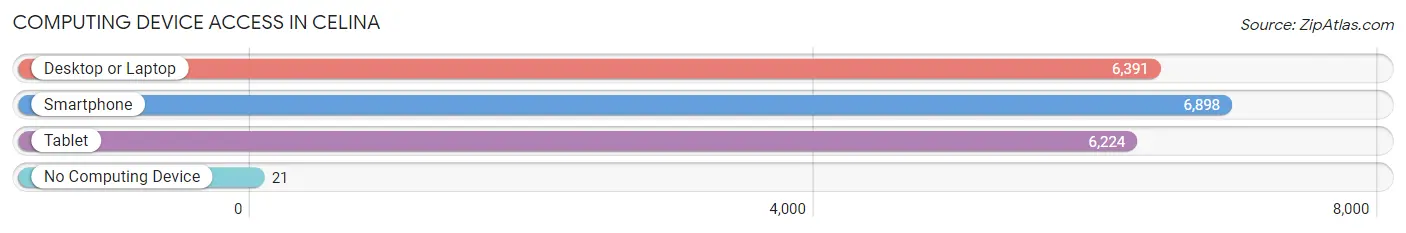
| Device Type | # Households | % Households |
| Desktop or Laptop | 6,391 | 91.2% |
| Smartphone | 6,898 | 98.4% |
| Tablet | 6,224 | 88.8% |
| No Computing Device | 21 | 0.3% |
| Total | 7,008 | 100.0% |
Internet Access in Celina
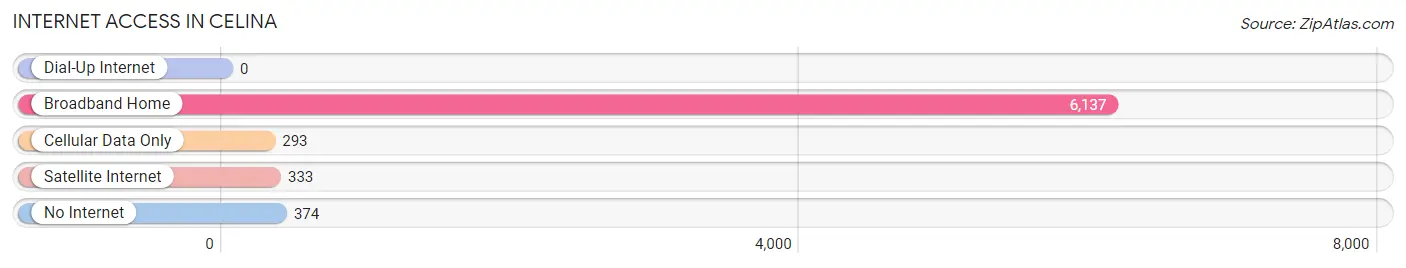
| Internet Type | # Households | % Households |
| Dial-Up Internet | 0 | 0.0% |
| Broadband Home | 6,137 | 87.6% |
| Cellular Data Only | 293 | 4.2% |
| Satellite Internet | 333 | 4.8% |
| No Internet | 374 | 5.3% |
| Total | 7,008 | 100.0% |
Celina Summary
Celina, Texas is a small town located in Collin County, Texas, about 40 miles north of Dallas. It is part of the Dallas-Fort Worth-Arlington metropolitan area. The town was founded in 1873 and has a population of about 6,000 people.
History
Celina was founded in 1873 by a group of settlers from Kentucky and Tennessee. The town was named after Celina, Tennessee, the hometown of one of the settlers. The town was originally a farming community, but it soon became a trading center for the surrounding area. In 1876, the first post office was established in Celina.
In the early 1900s, Celina began to grow and develop. The town was incorporated in 1909 and the first school was built in 1910. The town also had a bank, a newspaper, and a telephone exchange.
In the 1920s, Celina began to experience a population boom. The town was home to several businesses, including a cotton gin, a flour mill, and a brick factory. The population of Celina grew to over 1,000 people by 1930.
In the 1950s, Celina began to experience a decline in population. The town was bypassed by the new interstate highway system and many businesses moved away. The population of Celina dropped to just over 500 people by 1960.
In the 1970s, Celina began to experience a resurgence. The town was revitalized by the construction of a new highway and the opening of a new shopping center. The population of Celina grew to over 1,000 people by 1980.
Geography
Celina is located in Collin County, Texas, about 40 miles north of Dallas. The town is situated on the banks of the Trinity River and is surrounded by rolling hills and farmland. The climate in Celina is hot and humid in the summer and mild in the winter.
Economy
Celina’s economy is largely based on agriculture and manufacturing. The town is home to several large farms, which produce corn, wheat, and hay. The town also has several manufacturing plants, which produce a variety of products, including furniture, clothing, and electronics.
Celina is also home to several small businesses, including restaurants, shops, and services. The town is also home to several large employers, including a hospital, a school district, and a state university.
Demographics
As of the 2010 census, the population of Celina was 6,028. The racial makeup of the town was 87.3% White, 5.2% African American, 0.7% Native American, 0.7% Asian, and 4.9% from other races. The median household income in Celina was $50,945, and the median age was 37.
Celina is a small town with a rich history and a bright future. The town is home to a diverse population and a thriving economy. With its close proximity to Dallas, Celina is an ideal place to live, work, and play.
Common Questions
What is Per Capita Income in Celina?
Per Capita income in Celina is $55,125.
What is the Median Family Income in Celina?
Median Family Income in Celina is $149,971.
What is the Median Household income in Celina?
Median Household Income in Celina is $142,643.
What is Income or Wage Gap in Celina?
Income or Wage Gap in Celina is 35.6%.
Women in Celina earn 64.4 cents for every dollar earned by a man.
What is Inequality or Gini Index in Celina?
Inequality or Gini Index in Celina is 0.42.
What is the Total Population of Celina?
Total Population of Celina is 21,501.
What is the Total Male Population of Celina?
Total Male Population of Celina is 11,566.
What is the Total Female Population of Celina?
Total Female Population of Celina is 9,935.
What is the Ratio of Males per 100 Females in Celina?
There are 116.42 Males per 100 Females in Celina.
What is the Ratio of Females per 100 Males in Celina?
There are 85.90 Females per 100 Males in Celina.
What is the Median Population Age in Celina?
Median Population Age in Celina is 36.1 Years.
What is the Average Family Size in Celina
Average Family Size in Celina is 3.2 People.
What is the Average Household Size in Celina
Average Household Size in Celina is 3.0 People.
How Large is the Labor Force in Celina?
There are 11,167 People in the Labor Forcein in Celina.
What is the Percentage of People in the Labor Force in Celina?
69.1% of People are in the Labor Force in Celina.
What is the Unemployment Rate in Celina?
Unemployment Rate in Celina is 1.6%.