Port Arthur, TX Map & Demographics
Port Arthur Map
Port Arthur Overview
$24,065
PER CAPITA INCOME
$54,032
AVG FAMILY INCOME
$45,357
AVG HOUSEHOLD INCOME
37.2%
WAGE / INCOME GAP [ % ]
62.8¢/ $1
WAGE / INCOME GAP [ $ ]
$12,086
FAMILY INCOME DEFICIT
0.51
INEQUALITY / GINI INDEX
55,897
TOTAL POPULATION
27,127
MALE POPULATION
28,770
FEMALE POPULATION
94.29
MALES / 100 FEMALES
106.06
FEMALES / 100 MALES
33.7
MEDIAN AGE
3.5
AVG FAMILY SIZE
2.7
AVG HOUSEHOLD SIZE
22,031
LABOR FORCE [ PEOPLE ]
52.6%
PERCENT IN LABOR FORCE
8.0%
UNEMPLOYMENT RATE
Port Arthur Area Codes
Income in Port Arthur
Income Overview in Port Arthur
Per Capita Income in Port Arthur is $24,065, while median incomes of families and households are $54,032 and $45,357 respectively.
| Characteristic | Number | Measure |
| Per Capita Income | 55,897 | $24,065 |
| Median Family Income | 13,186 | $54,032 |
| Mean Family Income | 13,186 | $74,833 |
| Median Household Income | 20,364 | $45,357 |
| Mean Household Income | 20,364 | $63,100 |
| Income Deficit | 13,186 | $12,086 |
| Wage / Income Gap (%) | 55,897 | 37.18% |
| Wage / Income Gap ($) | 55,897 | 62.82¢ per $1 |
| Gini / Inequality Index | 55,897 | 0.51 |
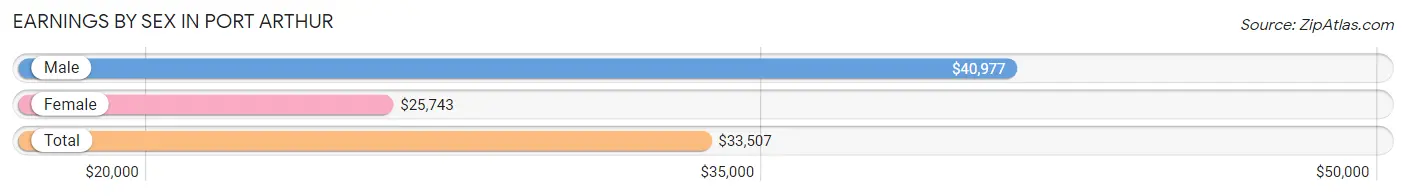
Earnings by Sex in Port Arthur
Average Earnings in Port Arthur are $33,507, $40,977 for men and $25,743 for women, a difference of 37.2%.
| Sex | Number | Average Earnings |
| Male | 13,294 (55.3%) | $40,977 |
| Female | 10,759 (44.7%) | $25,743 |
| Total | 24,053 (100.0%) | $33,507 |
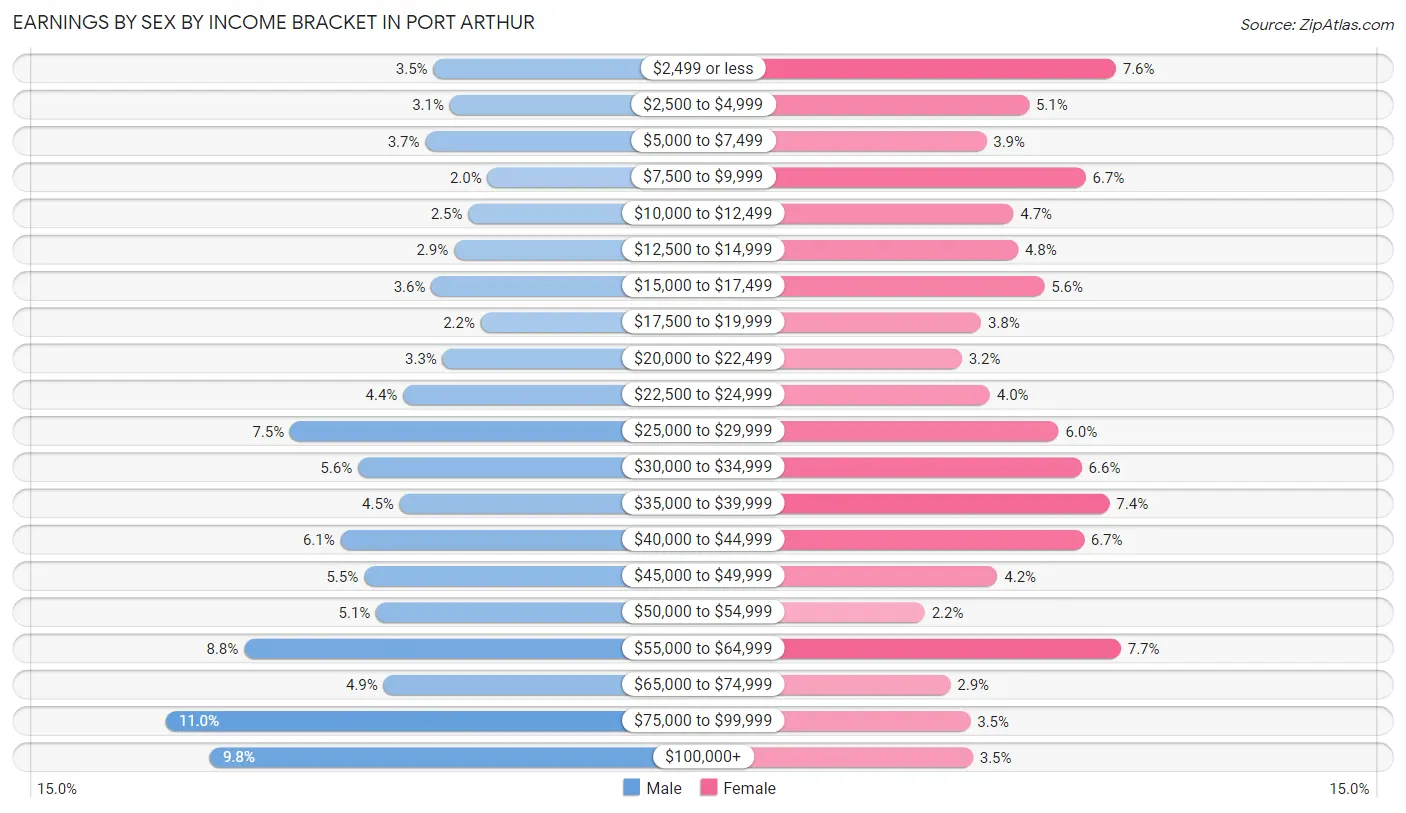
Earnings by Sex by Income Bracket in Port Arthur
The most common earnings brackets in Port Arthur are $75,000 to $99,999 for men (1,466 | 11.0%) and $55,000 to $64,999 for women (828 | 7.7%).
| Income | Male | Female |
| $2,499 or less | 466 (3.5%) | 813 (7.6%) |
| $2,500 to $4,999 | 405 (3.0%) | 551 (5.1%) |
| $5,000 to $7,499 | 497 (3.7%) | 422 (3.9%) |
| $7,500 to $9,999 | 265 (2.0%) | 722 (6.7%) |
| $10,000 to $12,499 | 336 (2.5%) | 503 (4.7%) |
| $12,500 to $14,999 | 390 (2.9%) | 518 (4.8%) |
| $15,000 to $17,499 | 474 (3.6%) | 597 (5.6%) |
| $17,500 to $19,999 | 290 (2.2%) | 406 (3.8%) |
| $20,000 to $22,499 | 432 (3.3%) | 347 (3.2%) |
| $22,500 to $24,999 | 580 (4.4%) | 433 (4.0%) |
| $25,000 to $29,999 | 1,003 (7.5%) | 640 (5.9%) |
| $30,000 to $34,999 | 748 (5.6%) | 710 (6.6%) |
| $35,000 to $39,999 | 593 (4.5%) | 794 (7.4%) |
| $40,000 to $44,999 | 814 (6.1%) | 717 (6.7%) |
| $45,000 to $49,999 | 726 (5.5%) | 455 (4.2%) |
| $50,000 to $54,999 | 680 (5.1%) | 236 (2.2%) |
| $55,000 to $64,999 | 1,174 (8.8%) | 828 (7.7%) |
| $65,000 to $74,999 | 653 (4.9%) | 313 (2.9%) |
| $75,000 to $99,999 | 1,466 (11.0%) | 373 (3.5%) |
| $100,000+ | 1,302 (9.8%) | 381 (3.5%) |
| Total | 13,294 (100.0%) | 10,759 (100.0%) |
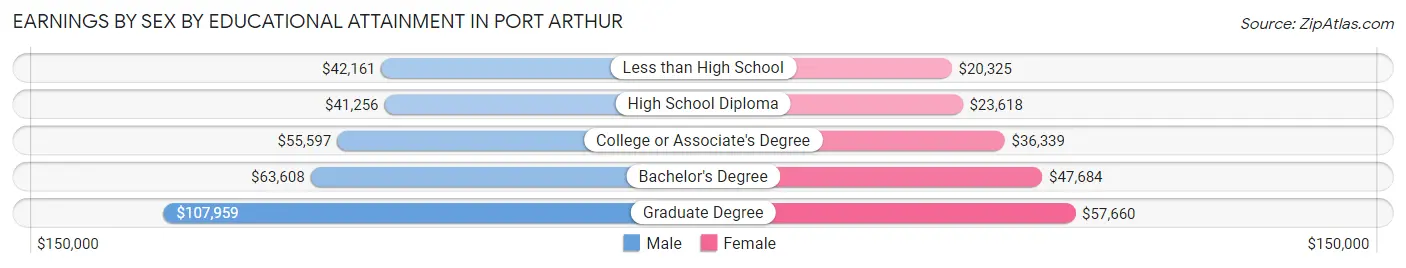
Earnings by Sex by Educational Attainment in Port Arthur
Average earnings in Port Arthur are $46,008 for men and $31,778 for women, a difference of 30.9%. Men with an educational attainment of graduate degree enjoy the highest average annual earnings of $107,959, while those with high school diploma education earn the least with $41,256. Women with an educational attainment of graduate degree earn the most with the average annual earnings of $57,660, while those with less than high school education have the smallest earnings of $20,325.
| Educational Attainment | Male Income | Female Income |
| Less than High School | $42,161 | $20,325 |
| High School Diploma | $41,256 | $23,618 |
| College or Associate's Degree | $55,597 | $36,339 |
| Bachelor's Degree | $63,608 | $47,684 |
| Graduate Degree | $107,959 | $57,660 |
| Total | $46,008 | $31,778 |
Family Income in Port Arthur
Family Income Brackets in Port Arthur
According to the Port Arthur family income data, there are 2,690 families falling into the $50,000 to $74,999 income range, which is the most common income bracket and makes up 20.4% of all families. Conversely, the $10,000 to $14,999 income bracket is the least frequent group with only 580 families (4.4%) belonging to this category.
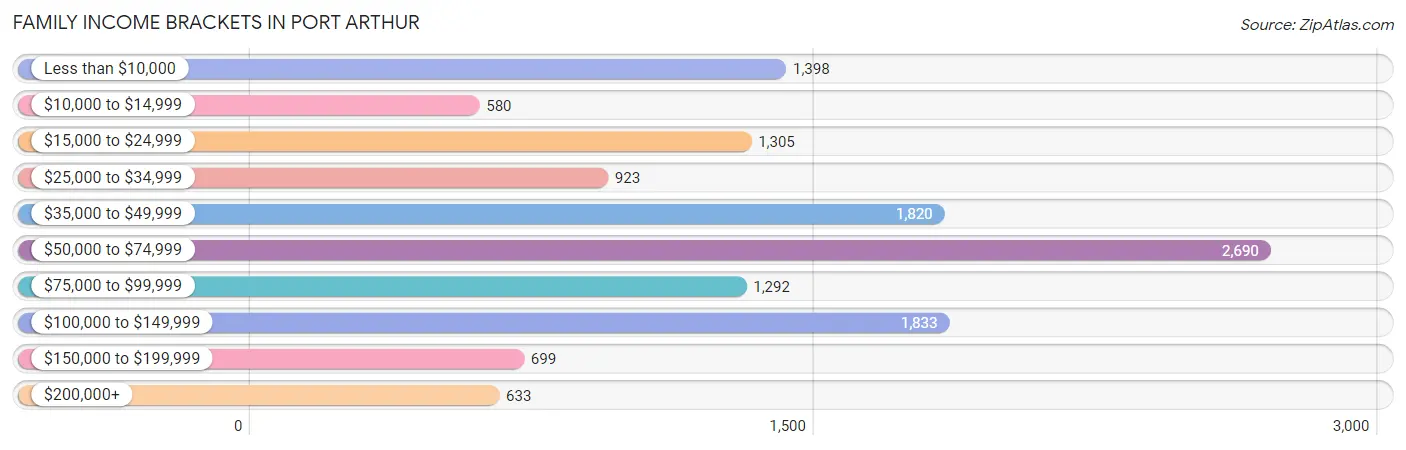
| Income Bracket | # Families | % Families |
| Less than $10,000 | 1,398 | 10.6% |
| $10,000 to $14,999 | 580 | 4.4% |
| $15,000 to $24,999 | 1,305 | 9.9% |
| $25,000 to $34,999 | 923 | 7.0% |
| $35,000 to $49,999 | 1,820 | 13.8% |
| $50,000 to $74,999 | 2,690 | 20.4% |
| $75,000 to $99,999 | 1,292 | 9.8% |
| $100,000 to $149,999 | 1,833 | 13.9% |
| $150,000 to $199,999 | 699 | 5.3% |
| $200,000+ | 633 | 4.8% |
Family Income by Famaliy Size in Port Arthur
7+ person families (338 | 2.6%) account for the highest median family income in Port Arthur with $82,095 per family, while 2-person families (5,781 | 43.8%) have the highest median income of $26,880 per family member.
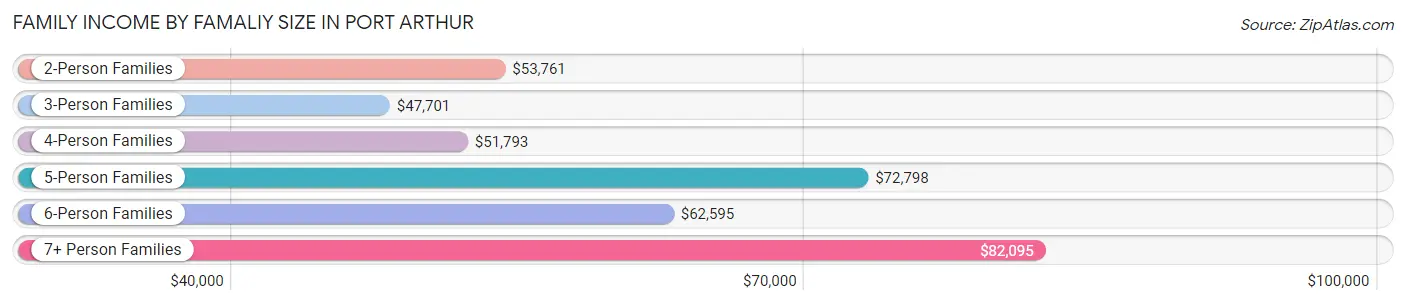
| Income Bracket | # Families | Median Income |
| 2-Person Families | 5,781 (43.8%) | $53,761 |
| 3-Person Families | 3,035 (23.0%) | $47,701 |
| 4-Person Families | 2,322 (17.6%) | $51,793 |
| 5-Person Families | 1,109 (8.4%) | $72,798 |
| 6-Person Families | 601 (4.6%) | $62,595 |
| 7+ Person Families | 338 (2.6%) | $82,095 |
| Total | 13,186 (100.0%) | $54,032 |
Family Income by Number of Earners in Port Arthur
The median family income in Port Arthur is $54,032, with families comprising 3+ earners (1,303) having the highest median family income of $107,254, while families with no earners (2,425) have the lowest median family income of $16,825, accounting for 9.9% and 18.4% of families, respectively.
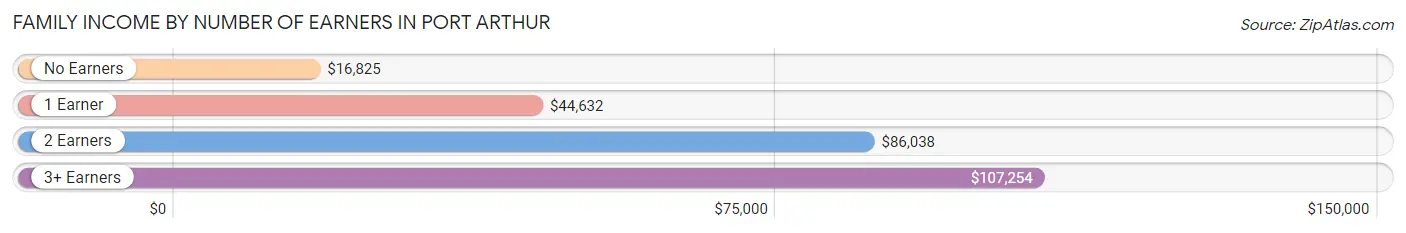
| Number of Earners | # Families | Median Income |
| No Earners | 2,425 (18.4%) | $16,825 |
| 1 Earner | 5,973 (45.3%) | $44,632 |
| 2 Earners | 3,485 (26.4%) | $86,038 |
| 3+ Earners | 1,303 (9.9%) | $107,254 |
| Total | 13,186 (100.0%) | $54,032 |
Household Income in Port Arthur
Household Income Brackets in Port Arthur
With 3,706 households falling in the category, the $50,000 to $74,999 income range is the most frequent in Port Arthur, accounting for 18.2% of all households. In contrast, only 692 households (3.4%) fall into the $200,000+ income bracket, making it the least populous group.
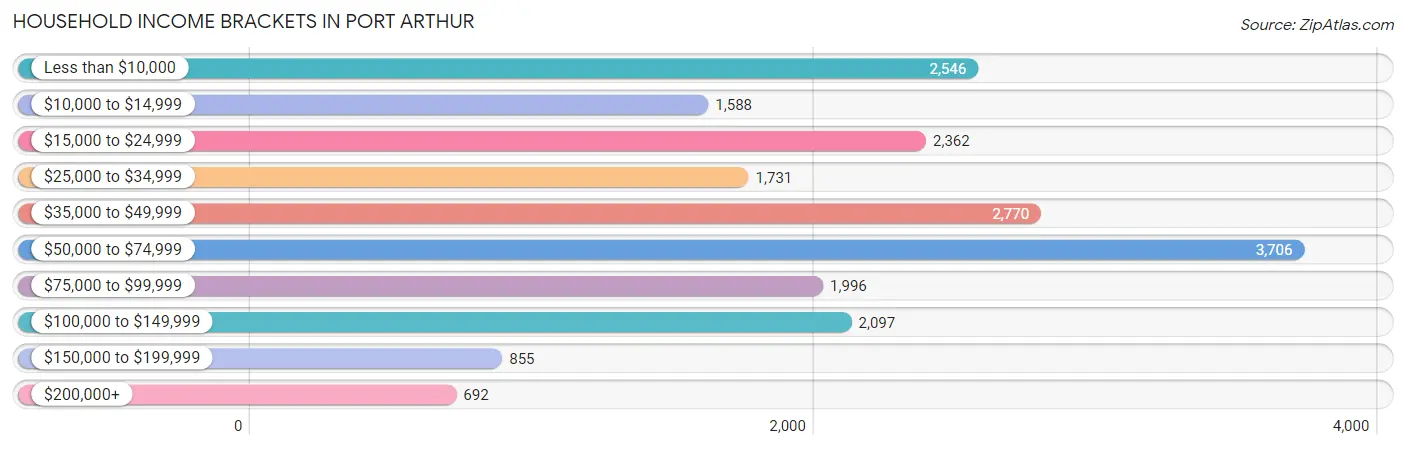
| Income Bracket | # Households | % Households |
| Less than $10,000 | 2,546 | 12.5% |
| $10,000 to $14,999 | 1,588 | 7.8% |
| $15,000 to $24,999 | 2,362 | 11.6% |
| $25,000 to $34,999 | 1,731 | 8.5% |
| $35,000 to $49,999 | 2,770 | 13.6% |
| $50,000 to $74,999 | 3,706 | 18.2% |
| $75,000 to $99,999 | 1,996 | 9.8% |
| $100,000 to $149,999 | 2,097 | 10.3% |
| $150,000 to $199,999 | 855 | 4.2% |
| $200,000+ | 692 | 3.4% |
Household Income by Householder Age in Port Arthur
The median household income in Port Arthur is $45,357, with the highest median household income of $54,782 found in the 45 to 64 years age bracket for the primary householder. A total of 7,960 households (39.1%) fall into this category. Meanwhile, the 15 to 24 years age bracket for the primary householder has the lowest median household income of $16,368, with 1,075 households (5.3%) in this group.
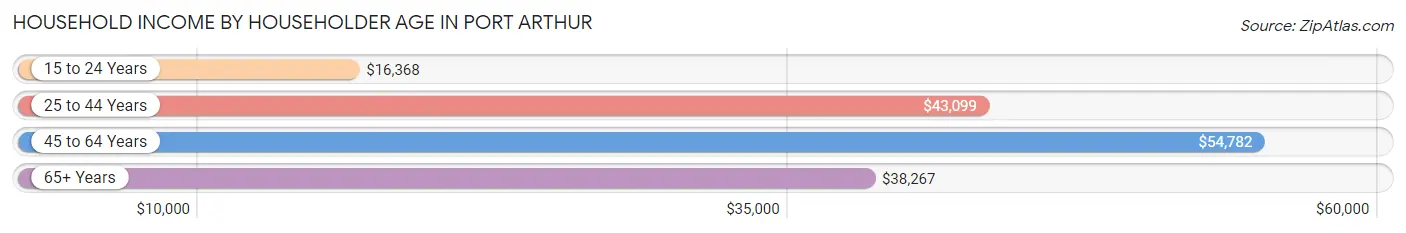
| Income Bracket | # Households | Median Income |
| 15 to 24 Years | 1,075 (5.3%) | $16,368 |
| 25 to 44 Years | 6,756 (33.2%) | $43,099 |
| 45 to 64 Years | 7,960 (39.1%) | $54,782 |
| 65+ Years | 4,573 (22.5%) | $38,267 |
| Total | 20,364 (100.0%) | $45,357 |
Poverty in Port Arthur
Income Below Poverty by Sex and Age in Port Arthur
With 23.8% poverty level for males and 29.4% for females among the residents of Port Arthur, 12 to 14 year old males and under 5 year old females are the most vulnerable to poverty, with 560 males (44.5%) and 877 females (41.7%) in their respective age groups living below the poverty level.
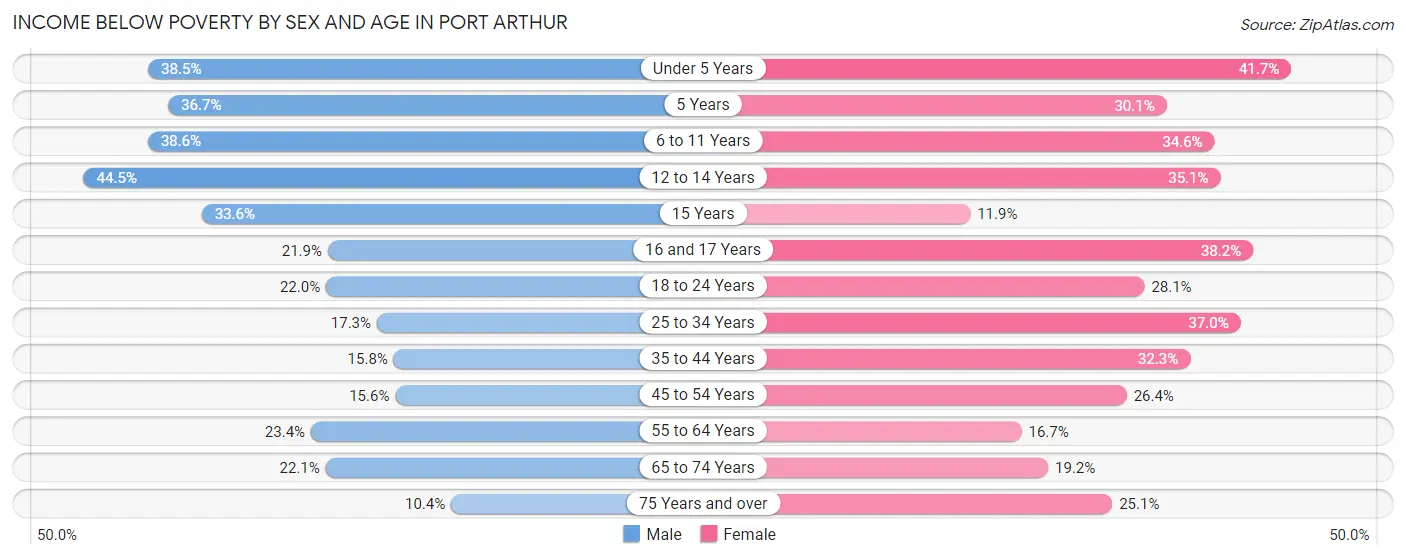
| Age Bracket | Male | Female |
| Under 5 Years | 832 (38.5%) | 877 (41.7%) |
| 5 Years | 95 (36.7%) | 138 (30.1%) |
| 6 to 11 Years | 973 (38.6%) | 891 (34.6%) |
| 12 to 14 Years | 560 (44.5%) | 451 (35.1%) |
| 15 Years | 198 (33.6%) | 49 (11.9%) |
| 16 and 17 Years | 160 (21.9%) | 361 (38.2%) |
| 18 to 24 Years | 639 (22.0%) | 744 (28.1%) |
| 25 to 34 Years | 616 (17.3%) | 1,385 (37.0%) |
| 35 to 44 Years | 505 (15.8%) | 1,064 (32.3%) |
| 45 to 54 Years | 521 (15.6%) | 947 (26.4%) |
| 55 to 64 Years | 695 (23.4%) | 575 (16.7%) |
| 65 to 74 Years | 448 (22.1%) | 379 (19.2%) |
| 75 Years and over | 125 (10.4%) | 437 (25.1%) |
| Total | 6,367 (23.8%) | 8,298 (29.4%) |
Income Above Poverty by Sex and Age in Port Arthur
According to the poverty statistics in Port Arthur, males aged 75 years and over and females aged 15 years are the age groups that are most secure financially, with 89.6% of males and 88.1% of females in these age groups living above the poverty line.
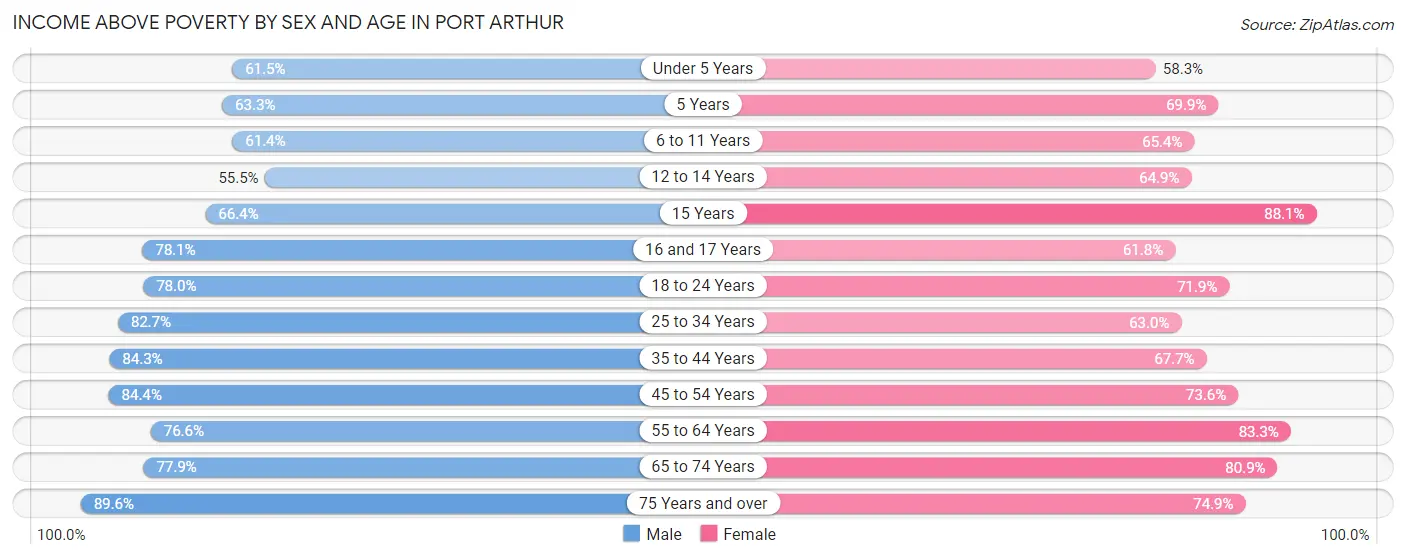
| Age Bracket | Male | Female |
| Under 5 Years | 1,327 (61.5%) | 1,226 (58.3%) |
| 5 Years | 164 (63.3%) | 320 (69.9%) |
| 6 to 11 Years | 1,550 (61.4%) | 1,686 (65.4%) |
| 12 to 14 Years | 698 (55.5%) | 833 (64.9%) |
| 15 Years | 392 (66.4%) | 362 (88.1%) |
| 16 and 17 Years | 572 (78.1%) | 585 (61.8%) |
| 18 to 24 Years | 2,262 (78.0%) | 1,905 (71.9%) |
| 25 to 34 Years | 2,943 (82.7%) | 2,358 (63.0%) |
| 35 to 44 Years | 2,701 (84.3%) | 2,228 (67.7%) |
| 45 to 54 Years | 2,818 (84.4%) | 2,635 (73.6%) |
| 55 to 64 Years | 2,271 (76.6%) | 2,872 (83.3%) |
| 65 to 74 Years | 1,582 (77.9%) | 1,600 (80.8%) |
| 75 Years and over | 1,075 (89.6%) | 1,304 (74.9%) |
| Total | 20,355 (76.2%) | 19,914 (70.6%) |
Income Below Poverty Among Married-Couple Families in Port Arthur
The poverty statistics for married-couple families in Port Arthur show that 11.0% or 809 of the total 7,379 families live below the poverty line. Families with 1 or 2 children have the highest poverty rate of 19.6%, comprising of 495 families. On the other hand, families with 5 or more children have the lowest poverty rate of 0.0%, which includes 0 families.
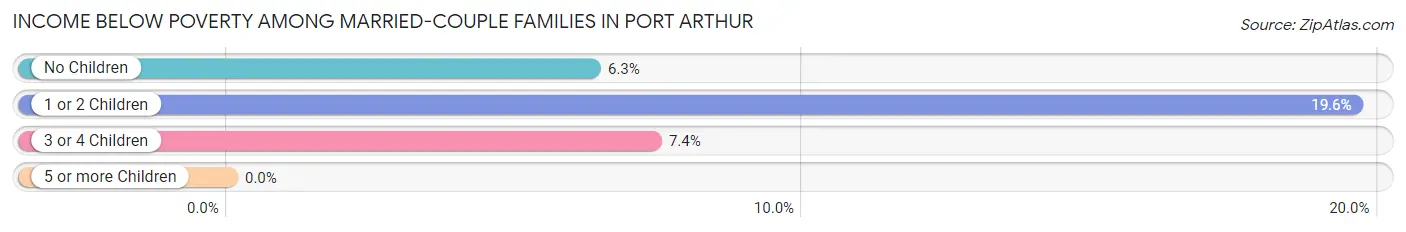
| Children | Above Poverty | Below Poverty |
| No Children | 3,690 (93.7%) | 249 (6.3%) |
| 1 or 2 Children | 2,032 (80.4%) | 495 (19.6%) |
| 3 or 4 Children | 816 (92.6%) | 65 (7.4%) |
| 5 or more Children | 32 (100.0%) | 0 (0.0%) |
| Total | 6,570 (89.0%) | 809 (11.0%) |
Income Below Poverty Among Single-Parent Households in Port Arthur
According to the poverty data in Port Arthur, 24.1% or 275 single-father households and 46.0% or 2,146 single-mother households are living below the poverty line. Among single-father households, those with 3 or 4 children have the highest poverty rate, with 33 households (40.2%) experiencing poverty. Likewise, among single-mother households, those with 5 or more children have the highest poverty rate, with 82 households (90.1%) falling below the poverty line.
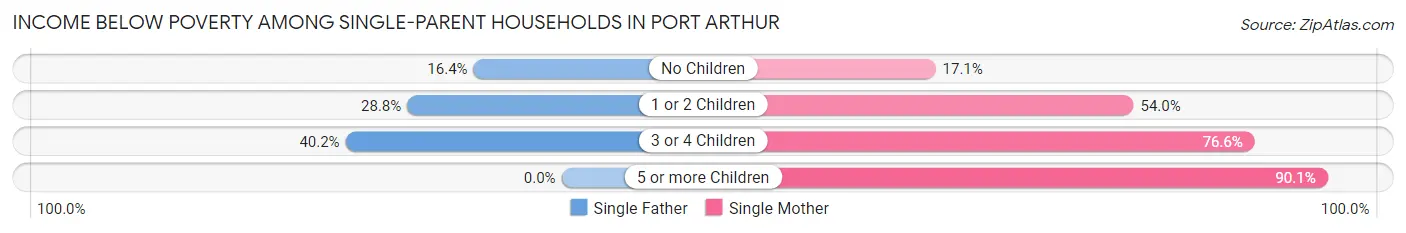
| Children | Single Father | Single Mother |
| No Children | 83 (16.4%) | 263 (17.1%) |
| 1 or 2 Children | 159 (28.7%) | 1,259 (54.0%) |
| 3 or 4 Children | 33 (40.2%) | 542 (76.5%) |
| 5 or more Children | 0 (0.0%) | 82 (90.1%) |
| Total | 275 (24.1%) | 2,146 (46.0%) |
Income Below Poverty Among Married-Couple vs Single-Parent Households in Port Arthur
The poverty data for Port Arthur shows that 809 of the married-couple family households (11.0%) and 2,421 of the single-parent households (41.7%) are living below the poverty level. Within the married-couple family households, those with 1 or 2 children have the highest poverty rate, with 495 households (19.6%) falling below the poverty line. Among the single-parent households, those with 5 or more children have the highest poverty rate, with 82 household (90.1%) living below poverty.
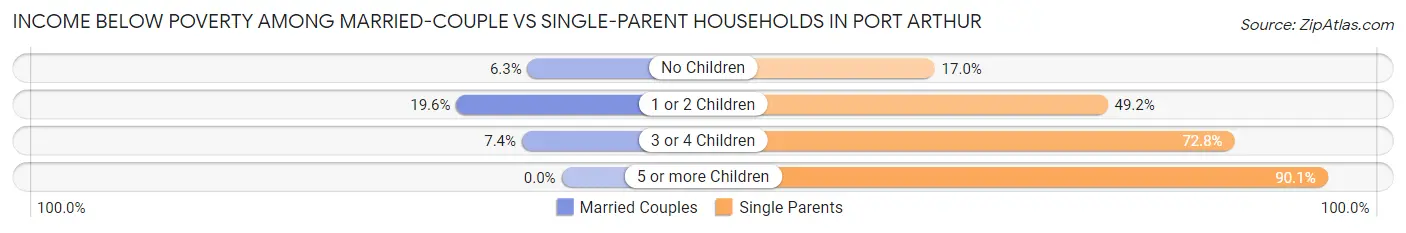
| Children | Married-Couple Families | Single-Parent Households |
| No Children | 249 (6.3%) | 346 (17.0%) |
| 1 or 2 Children | 495 (19.6%) | 1,418 (49.1%) |
| 3 or 4 Children | 65 (7.4%) | 575 (72.8%) |
| 5 or more Children | 0 (0.0%) | 82 (90.1%) |
| Total | 809 (11.0%) | 2,421 (41.7%) |
Race in Port Arthur
The most populous races in Port Arthur are Black / African American (23,637 | 42.3%), Hispanic or Latino (18,988 | 34.0%), and White / Caucasian (17,239 | 30.8%).
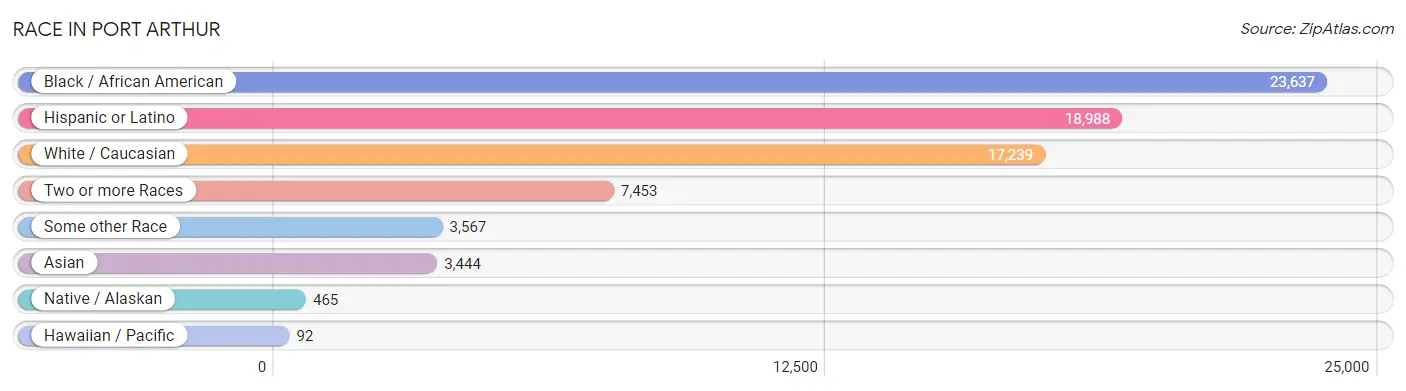
| Race | # Population | % Population |
| Asian | 3,444 | 6.2% |
| Black / African American | 23,637 | 42.3% |
| Hawaiian / Pacific | 92 | 0.2% |
| Hispanic or Latino | 18,988 | 34.0% |
| Native / Alaskan | 465 | 0.8% |
| White / Caucasian | 17,239 | 30.8% |
| Two or more Races | 7,453 | 13.3% |
| Some other Race | 3,567 | 6.4% |
| Total | 55,897 | 100.0% |
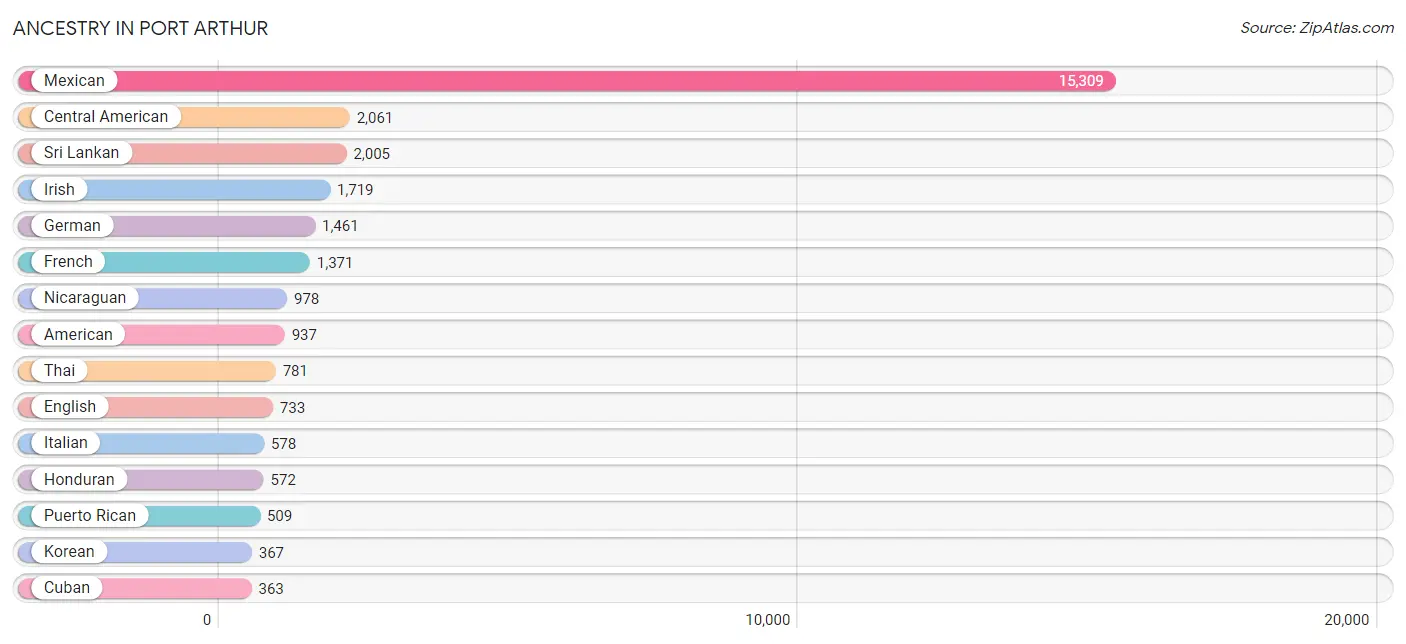
Ancestry in Port Arthur
The most populous ancestries reported in Port Arthur are Mexican (15,309 | 27.4%), Central American (2,061 | 3.7%), Sri Lankan (2,005 | 3.6%), Irish (1,719 | 3.1%), and German (1,461 | 2.6%), together accounting for 40.4% of all Port Arthur residents.
| Ancestry | # Population | % Population |
| African | 246 | 0.4% |
| Alsatian | 7 | 0.0% |
| American | 937 | 1.7% |
| Arab | 117 | 0.2% |
| Argentinean | 19 | 0.0% |
| Bhutanese | 8 | 0.0% |
| Brazilian | 16 | 0.0% |
| British | 18 | 0.0% |
| Burmese | 89 | 0.2% |
| Cajun | 53 | 0.1% |
| Canadian | 30 | 0.1% |
| Central American | 2,061 | 3.7% |
| Central American Indian | 345 | 0.6% |
| Cherokee | 34 | 0.1% |
| Chickasaw | 7 | 0.0% |
| Colombian | 82 | 0.2% |
| Cuban | 363 | 0.6% |
| Czech | 48 | 0.1% |
| Czechoslovakian | 2 | 0.0% |
| Danish | 6 | 0.0% |
| Dominican | 255 | 0.5% |
| Dutch | 63 | 0.1% |
| Dutch West Indian | 137 | 0.3% |
| Eastern European | 17 | 0.0% |
| Ecuadorian | 64 | 0.1% |
| English | 733 | 1.3% |
| Estonian | 6 | 0.0% |
| European | 219 | 0.4% |
| French | 1,371 | 2.5% |
| French Canadian | 286 | 0.5% |
| German | 1,461 | 2.6% |
| Greek | 70 | 0.1% |
| Guatemalan | 64 | 0.1% |
| Honduran | 572 | 1.0% |
| Indian (Asian) | 69 | 0.1% |
| Iranian | 6 | 0.0% |
| Irish | 1,719 | 3.1% |
| Italian | 578 | 1.0% |
| Jamaican | 23 | 0.0% |
| Japanese | 100 | 0.2% |
| Korean | 367 | 0.7% |
| Lebanese | 79 | 0.1% |
| Mexican | 15,309 | 27.4% |
| Mexican American Indian | 103 | 0.2% |
| Nicaraguan | 978 | 1.8% |
| Nigerian | 15 | 0.0% |
| Northern European | 10 | 0.0% |
| Norwegian | 55 | 0.1% |
| Paiute | 2 | 0.0% |
| Pakistani | 10 | 0.0% |
| Palestinian | 19 | 0.0% |
| Panamanian | 7 | 0.0% |
| Polish | 126 | 0.2% |
| Portuguese | 19 | 0.0% |
| Puerto Rican | 509 | 0.9% |
| Salvadoran | 322 | 0.6% |
| Scotch-Irish | 137 | 0.3% |
| Scottish | 104 | 0.2% |
| Sierra Leonean | 12 | 0.0% |
| Sioux | 2 | 0.0% |
| Slovene | 12 | 0.0% |
| South American | 195 | 0.4% |
| Spaniard | 69 | 0.1% |
| Spanish | 25 | 0.0% |
| Sri Lankan | 2,005 | 3.6% |
| Subsaharan African | 273 | 0.5% |
| Swedish | 48 | 0.1% |
| Syrian | 19 | 0.0% |
| Thai | 781 | 1.4% |
| Venezuelan | 30 | 0.1% |
| Welsh | 26 | 0.1% | View All 71 Rows |
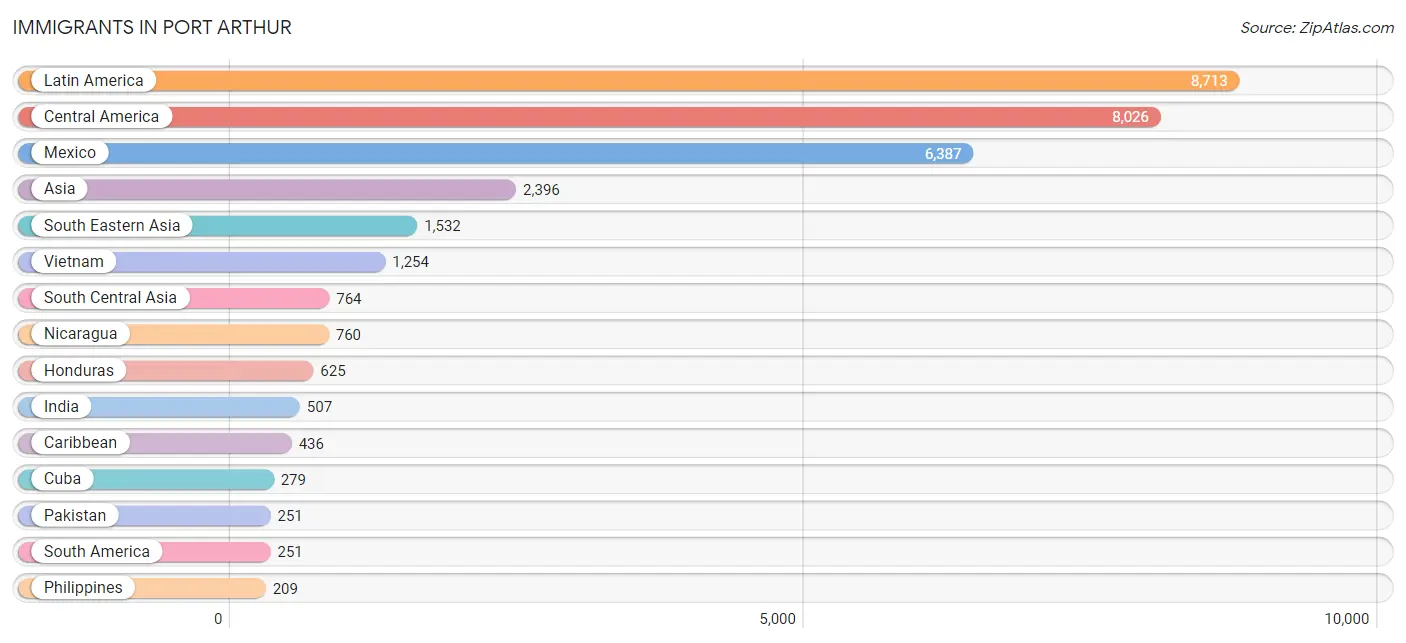
Immigrants in Port Arthur
The most numerous immigrant groups reported in Port Arthur came from Latin America (8,713 | 15.6%), Central America (8,026 | 14.4%), Mexico (6,387 | 11.4%), Asia (2,396 | 4.3%), and South Eastern Asia (1,532 | 2.7%), together accounting for 48.4% of all Port Arthur residents.
| Immigration Origin | # Population | % Population |
| Africa | 54 | 0.1% |
| Argentina | 19 | 0.0% |
| Asia | 2,396 | 4.3% |
| Brazil | 13 | 0.0% |
| Cambodia | 59 | 0.1% |
| Canada | 40 | 0.1% |
| Caribbean | 436 | 0.8% |
| Central America | 8,026 | 14.4% |
| China | 12 | 0.0% |
| Colombia | 88 | 0.2% |
| Cuba | 279 | 0.5% |
| Dominican Republic | 90 | 0.2% |
| Eastern Africa | 42 | 0.1% |
| Eastern Asia | 100 | 0.2% |
| Ecuador | 64 | 0.1% |
| El Salvador | 198 | 0.4% |
| Europe | 168 | 0.3% |
| Germany | 62 | 0.1% |
| Guatemala | 32 | 0.1% |
| Guyana | 37 | 0.1% |
| Honduras | 625 | 1.1% |
| India | 507 | 0.9% |
| Iran | 6 | 0.0% |
| Ireland | 28 | 0.1% |
| Japan | 13 | 0.0% |
| Kenya | 19 | 0.0% |
| Korea | 75 | 0.1% |
| Latin America | 8,713 | 15.6% |
| Mexico | 6,387 | 11.4% |
| Micronesia | 92 | 0.2% |
| Netherlands | 18 | 0.0% |
| Nicaragua | 760 | 1.4% |
| Northern Europe | 48 | 0.1% |
| Oceania | 92 | 0.2% |
| Pakistan | 251 | 0.4% |
| Panama | 24 | 0.0% |
| Philippines | 209 | 0.4% |
| Sierra Leone | 12 | 0.0% |
| South America | 251 | 0.4% |
| South Central Asia | 764 | 1.4% |
| South Eastern Asia | 1,532 | 2.7% |
| Southern Europe | 21 | 0.0% |
| Spain | 21 | 0.0% |
| Thailand | 10 | 0.0% |
| Trinidad and Tobago | 67 | 0.1% |
| Venezuela | 30 | 0.1% |
| Vietnam | 1,254 | 2.2% |
| Western Africa | 12 | 0.0% |
| Western Europe | 80 | 0.1% | View All 49 Rows |
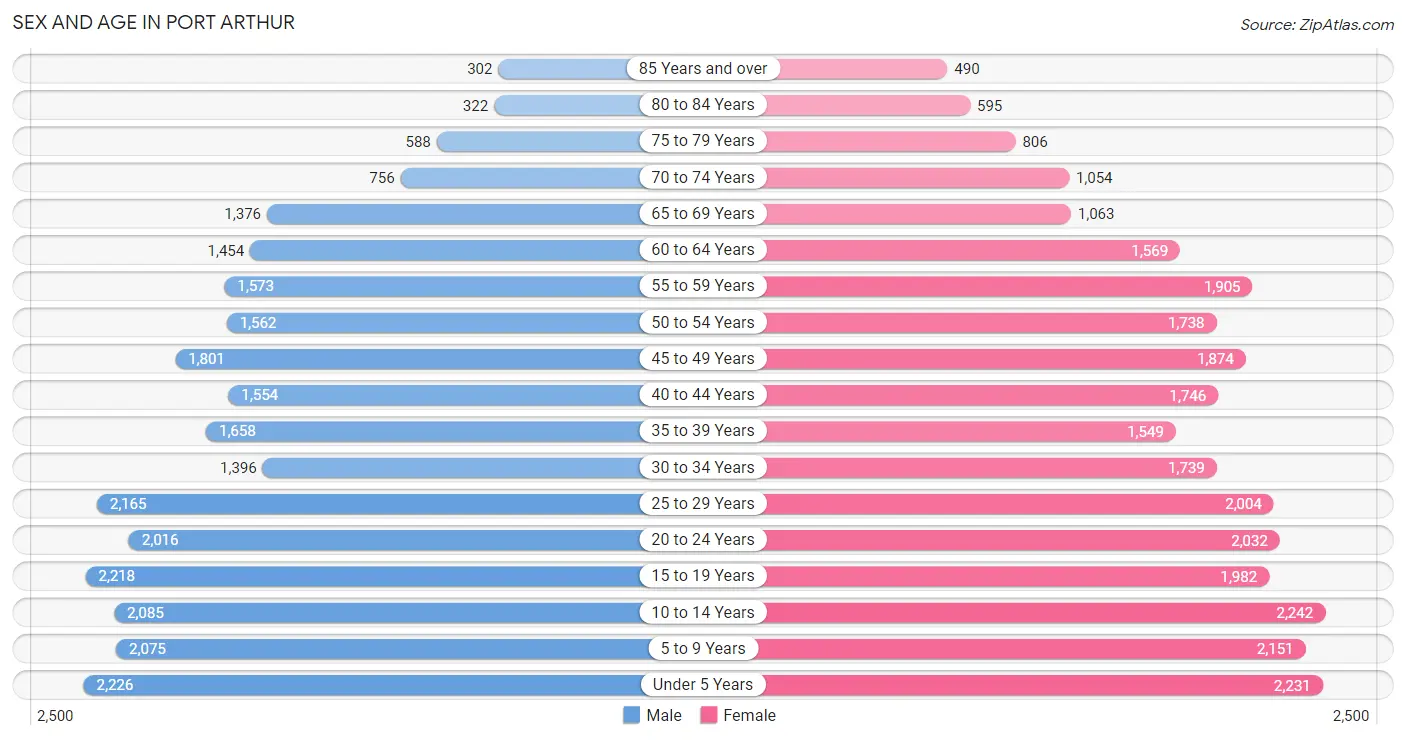
Sex and Age in Port Arthur
Sex and Age in Port Arthur
The most populous age groups in Port Arthur are Under 5 Years (2,226 | 8.2%) for men and 10 to 14 Years (2,242 | 7.8%) for women.
| Age Bracket | Male | Female |
| Under 5 Years | 2,226 (8.2%) | 2,231 (7.7%) |
| 5 to 9 Years | 2,075 (7.6%) | 2,151 (7.5%) |
| 10 to 14 Years | 2,085 (7.7%) | 2,242 (7.8%) |
| 15 to 19 Years | 2,218 (8.2%) | 1,982 (6.9%) |
| 20 to 24 Years | 2,016 (7.4%) | 2,032 (7.1%) |
| 25 to 29 Years | 2,165 (8.0%) | 2,004 (7.0%) |
| 30 to 34 Years | 1,396 (5.1%) | 1,739 (6.0%) |
| 35 to 39 Years | 1,658 (6.1%) | 1,549 (5.4%) |
| 40 to 44 Years | 1,554 (5.7%) | 1,746 (6.1%) |
| 45 to 49 Years | 1,801 (6.6%) | 1,874 (6.5%) |
| 50 to 54 Years | 1,562 (5.8%) | 1,738 (6.0%) |
| 55 to 59 Years | 1,573 (5.8%) | 1,905 (6.6%) |
| 60 to 64 Years | 1,454 (5.4%) | 1,569 (5.4%) |
| 65 to 69 Years | 1,376 (5.1%) | 1,063 (3.7%) |
| 70 to 74 Years | 756 (2.8%) | 1,054 (3.7%) |
| 75 to 79 Years | 588 (2.2%) | 806 (2.8%) |
| 80 to 84 Years | 322 (1.2%) | 595 (2.1%) |
| 85 Years and over | 302 (1.1%) | 490 (1.7%) |
| Total | 27,127 (100.0%) | 28,770 (100.0%) |
Families and Households in Port Arthur
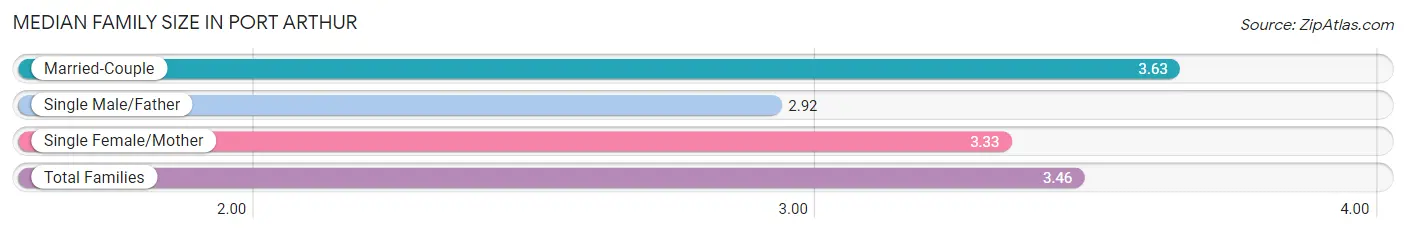
Median Family Size in Port Arthur
The median family size in Port Arthur is 3.46 persons per family, with married-couple families (7,379 | 56.0%) accounting for the largest median family size of 3.63 persons per family. On the other hand, single male/father families (1,141 | 8.6%) represent the smallest median family size with 2.92 persons per family.
| Family Type | # Families | Family Size |
| Married-Couple | 7,379 (56.0%) | 3.63 |
| Single Male/Father | 1,141 (8.6%) | 2.92 |
| Single Female/Mother | 4,666 (35.4%) | 3.33 |
| Total Families | 13,186 (100.0%) | 3.46 |
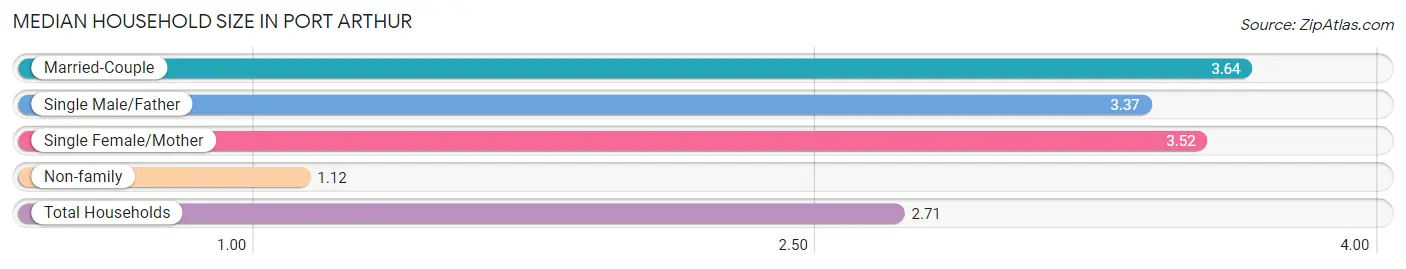
Median Household Size in Port Arthur
The median household size in Port Arthur is 2.71 persons per household, with married-couple households (7,379 | 36.2%) accounting for the largest median household size of 3.64 persons per household. non-family households (7,178 | 35.2%) represent the smallest median household size with 1.12 persons per household.
| Household Type | # Households | Household Size |
| Married-Couple | 7,379 (36.2%) | 3.64 |
| Single Male/Father | 1,141 (5.6%) | 3.37 |
| Single Female/Mother | 4,666 (22.9%) | 3.52 |
| Non-family | 7,178 (35.2%) | 1.12 |
| Total Households | 20,364 (100.0%) | 2.71 |
Household Size by Marriage Status in Port Arthur
Out of a total of 20,364 households in Port Arthur, 13,186 (64.7%) are family households, while 7,178 (35.2%) are nonfamily households. The most numerous type of family households are 2-person households, comprising 5,356, and the most common type of nonfamily households are 1-person households, comprising 6,467.
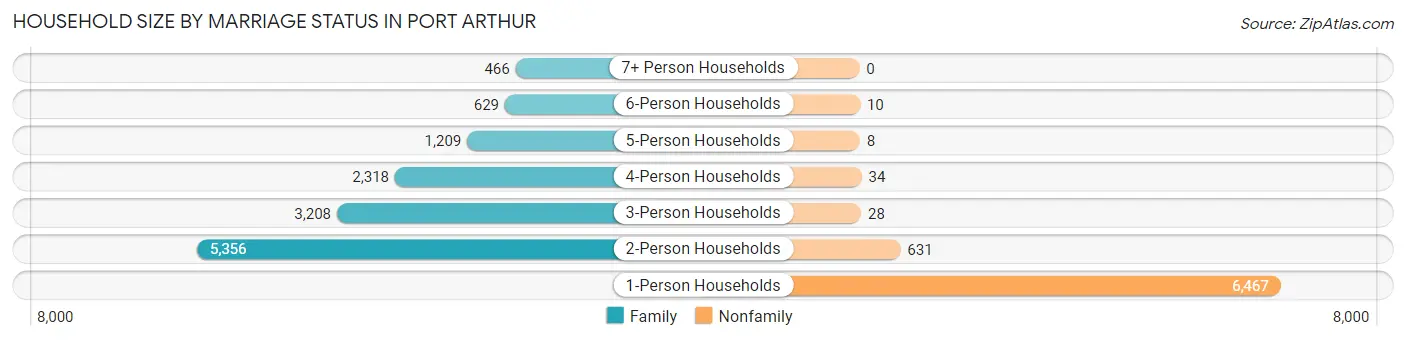
| Household Size | Family Households | Nonfamily Households |
| 1-Person Households | - | 6,467 (31.8%) |
| 2-Person Households | 5,356 (26.3%) | 631 (3.1%) |
| 3-Person Households | 3,208 (15.8%) | 28 (0.1%) |
| 4-Person Households | 2,318 (11.4%) | 34 (0.2%) |
| 5-Person Households | 1,209 (5.9%) | 8 (0.0%) |
| 6-Person Households | 629 (3.1%) | 10 (0.1%) |
| 7+ Person Households | 466 (2.3%) | 0 (0.0%) |
| Total | 13,186 (64.7%) | 7,178 (35.2%) |
Female Fertility in Port Arthur
Fertility by Age in Port Arthur
Average fertility rate in Port Arthur is 41.0 births per 1,000 women. Women in the age bracket of 20 to 34 years have the highest fertility rate with 75.0 births per 1,000 women. Women in the age bracket of 20 to 34 years acount for 81.0% of all women with births.
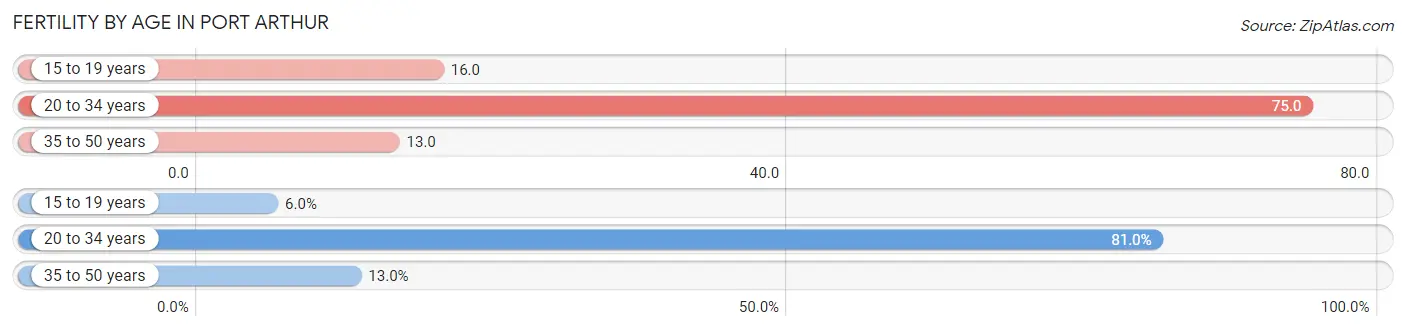
| Age Bracket | Women with Births | Births / 1,000 Women |
| 15 to 19 years | 32 (5.9%) | 16.0 |
| 20 to 34 years | 436 (81.0%) | 75.0 |
| 35 to 50 years | 70 (13.0%) | 13.0 |
| Total | 538 (100.0%) | 41.0 |
Fertility by Age by Marriage Status in Port Arthur
55.4% of women with births (538) in Port Arthur are married. The highest percentage of unmarried women with births falls into 15 to 19 years age bracket with 100.0% of them unmarried at the time of birth, while the lowest percentage of unmarried women with births belong to 35 to 50 years age bracket with 0.0% of them unmarried.
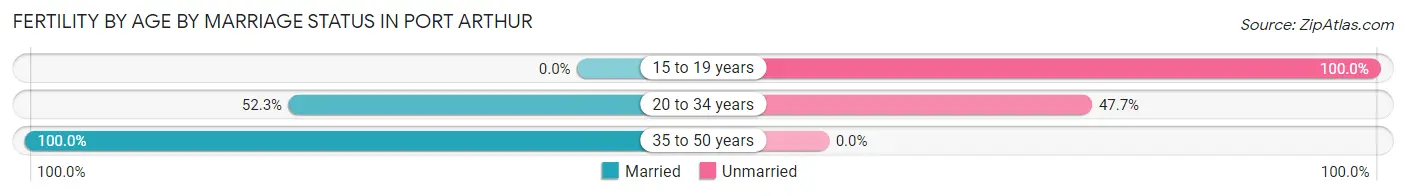
| Age Bracket | Married | Unmarried |
| 15 to 19 years | 0 (0.0%) | 32 (100.0%) |
| 20 to 34 years | 228 (52.3%) | 208 (47.7%) |
| 35 to 50 years | 70 (100.0%) | 0 (0.0%) |
| Total | 298 (55.4%) | 240 (44.6%) |
Fertility by Education in Port Arthur
Average fertility rate in Port Arthur is 41.0 births per 1,000 women. Women with the education attainment of graduate degree have the highest fertility rate of 60.0 births per 1,000 women, while women with the education attainment of college or associate's degree have the lowest fertility at 24.0 births per 1,000 women. Women with the education attainment of high school diploma represent 43.3% of all women with births.
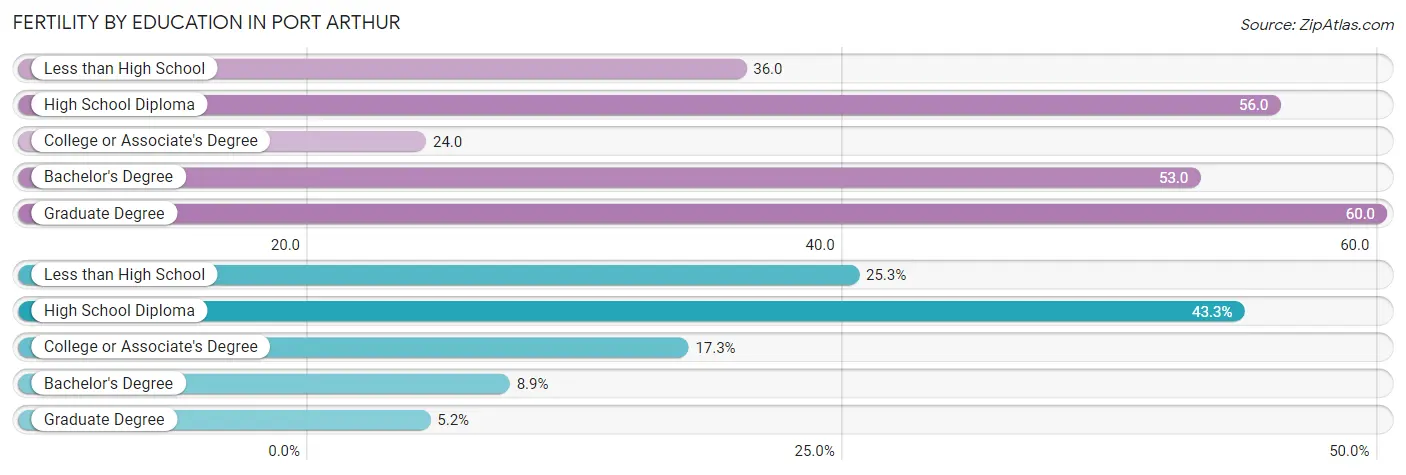
| Educational Attainment | Women with Births | Births / 1,000 Women |
| Less than High School | 136 (25.3%) | 36.0 |
| High School Diploma | 233 (43.3%) | 56.0 |
| College or Associate's Degree | 93 (17.3%) | 24.0 |
| Bachelor's Degree | 48 (8.9%) | 53.0 |
| Graduate Degree | 28 (5.2%) | 60.0 |
| Total | 538 (100.0%) | 41.0 |
Fertility by Education by Marriage Status in Port Arthur
44.6% of women with births in Port Arthur are unmarried. Women with the educational attainment of bachelor's degree are most likely to be married with 100.0% of them married at childbirth, while women with the educational attainment of high school diploma are least likely to be married with 55.8% of them unmarried at childbirth.
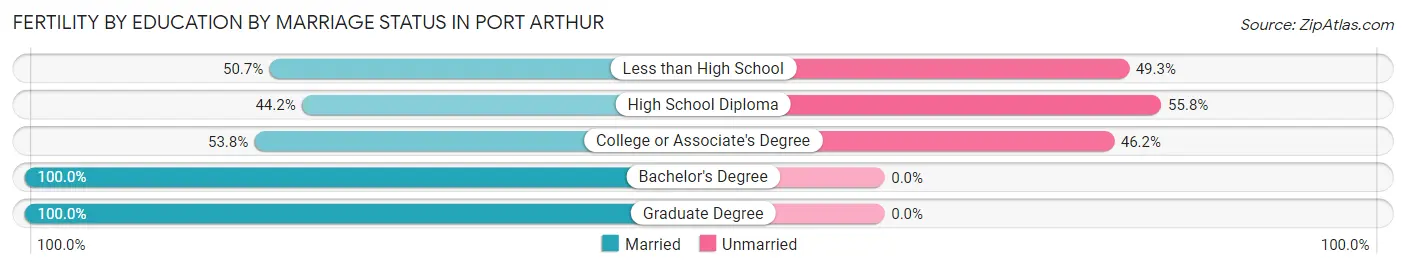
| Educational Attainment | Married | Unmarried |
| Less than High School | 69 (50.7%) | 67 (49.3%) |
| High School Diploma | 103 (44.2%) | 130 (55.8%) |
| College or Associate's Degree | 50 (53.8%) | 43 (46.2%) |
| Bachelor's Degree | 48 (100.0%) | 0 (0.0%) |
| Graduate Degree | 28 (100.0%) | 0 (0.0%) |
| Total | 298 (55.4%) | 240 (44.6%) |
Employment Characteristics in Port Arthur
Employment by Class of Employer in Port Arthur
Among the 19,815 employed individuals in Port Arthur, private company employees (15,061 | 76.0%), local government employees (1,256 | 6.3%), and state government employees (1,143 | 5.8%) make up the most common classes of employment.
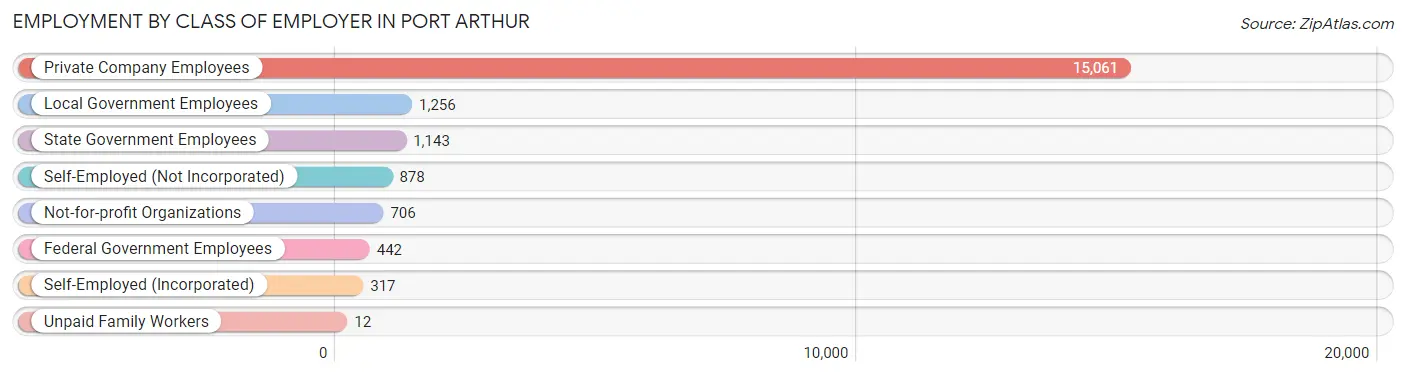
| Employer Class | # Employees | % Employees |
| Private Company Employees | 15,061 | 76.0% |
| Self-Employed (Incorporated) | 317 | 1.6% |
| Self-Employed (Not Incorporated) | 878 | 4.4% |
| Not-for-profit Organizations | 706 | 3.6% |
| Local Government Employees | 1,256 | 6.3% |
| State Government Employees | 1,143 | 5.8% |
| Federal Government Employees | 442 | 2.2% |
| Unpaid Family Workers | 12 | 0.1% |
| Total | 19,815 | 100.0% |
Employment Status by Age in Port Arthur
According to the labor force statistics for Port Arthur, out of the total population over 16 years of age (41,884), 52.6% or 22,031 individuals are in the labor force, with 8.0% or 1,762 of them unemployed. The age group with the highest labor force participation rate is 55 to 59 years, with 70.8% or 2,462 individuals in the labor force. Within the labor force, the 25 to 29 years age range has the highest percentage of unemployed individuals, with 16.0% or 464 of them being unemployed.
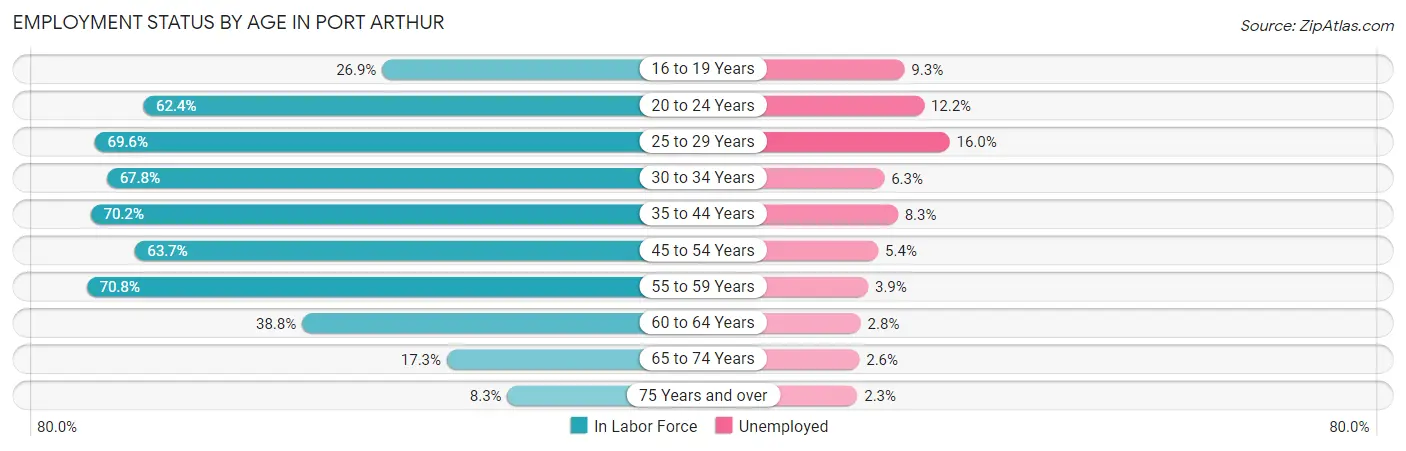
| Age Bracket | In Labor Force | Unemployed |
| 16 to 19 Years | 860 (26.9%) | 80 (9.3%) |
| 20 to 24 Years | 2,526 (62.4%) | 308 (12.2%) |
| 25 to 29 Years | 2,902 (69.6%) | 464 (16.0%) |
| 30 to 34 Years | 2,126 (67.8%) | 134 (6.3%) |
| 35 to 44 Years | 4,568 (70.2%) | 379 (8.3%) |
| 45 to 54 Years | 4,443 (63.7%) | 240 (5.4%) |
| 55 to 59 Years | 2,462 (70.8%) | 96 (3.9%) |
| 60 to 64 Years | 1,173 (38.8%) | 33 (2.8%) |
| 65 to 74 Years | 735 (17.3%) | 19 (2.6%) |
| 75 Years and over | 258 (8.3%) | 6 (2.3%) |
| Total | 22,031 (52.6%) | 1,762 (8.0%) |
Employment Status by Educational Attainment in Port Arthur
According to labor force statistics for Port Arthur, 64.8% of individuals (17,682) out of the total population between 25 and 64 years of age (27,287) are in the labor force, with 7.6% or 1,344 of them being unemployed. The group with the highest labor force participation rate are those with the educational attainment of bachelor's degree or higher, with 87.2% or 2,558 individuals in the labor force. Within the labor force, individuals with high school diploma education have the highest percentage of unemployment, with 10.4% or 663 of them being unemployed.
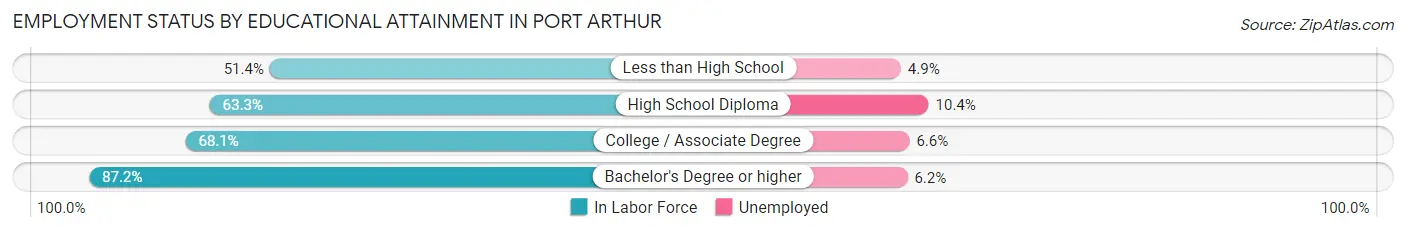
| Educational Attainment | In Labor Force | Unemployed |
| Less than High School | 3,034 (51.4%) | 289 (4.9%) |
| High School Diploma | 6,372 (63.3%) | 1,047 (10.4%) |
| College / Associate Degree | 5,711 (68.1%) | 553 (6.6%) |
| Bachelor's Degree or higher | 2,558 (87.2%) | 182 (6.2%) |
| Total | 17,682 (64.8%) | 2,074 (7.6%) |
Employment Occupations by Sex in Port Arthur
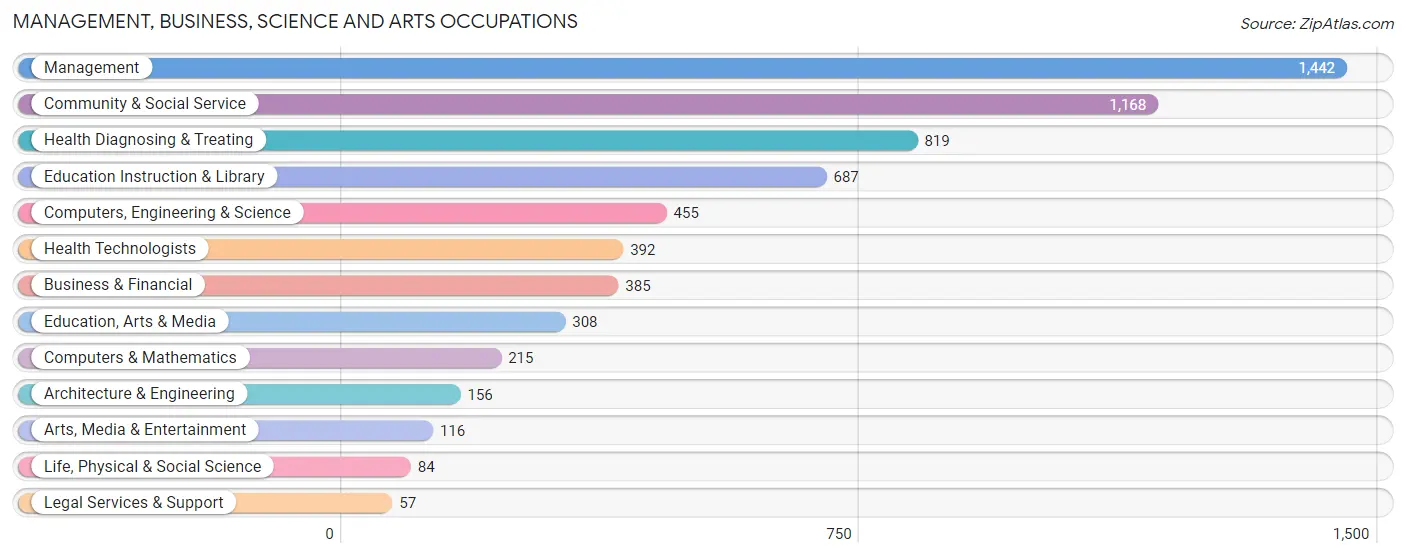
Management, Business, Science and Arts Occupations
The most common Management, Business, Science and Arts occupations in Port Arthur are Management (1,442 | 7.1%), Community & Social Service (1,168 | 5.8%), Health Diagnosing & Treating (819 | 4.0%), Education Instruction & Library (687 | 3.4%), and Computers, Engineering & Science (455 | 2.2%).
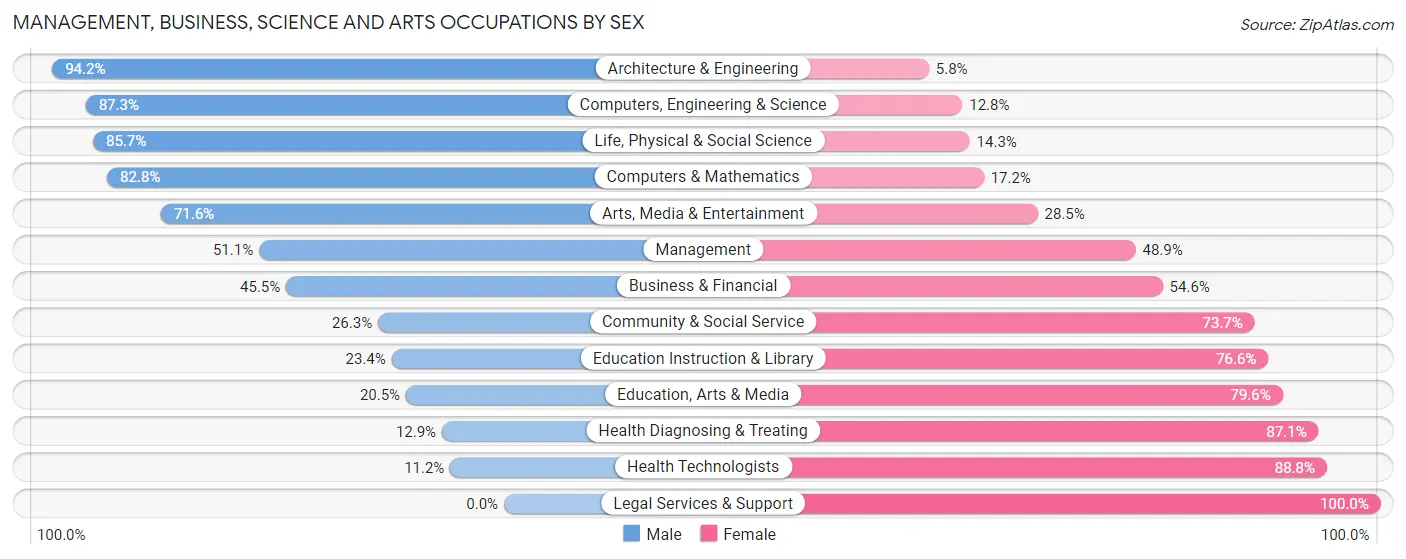
Management, Business, Science and Arts Occupations by Sex
Within the Management, Business, Science and Arts occupations in Port Arthur, the most male-oriented occupations are Architecture & Engineering (94.2%), Computers, Engineering & Science (87.3%), and Life, Physical & Social Science (85.7%), while the most female-oriented occupations are Legal Services & Support (100.0%), Health Technologists (88.8%), and Health Diagnosing & Treating (87.1%).
| Occupation | Male | Female |
| Management | 737 (51.1%) | 705 (48.9%) |
| Business & Financial | 175 (45.5%) | 210 (54.5%) |
| Computers, Engineering & Science | 397 (87.3%) | 58 (12.8%) |
| Computers & Mathematics | 178 (82.8%) | 37 (17.2%) |
| Architecture & Engineering | 147 (94.2%) | 9 (5.8%) |
| Life, Physical & Social Science | 72 (85.7%) | 12 (14.3%) |
| Community & Social Service | 307 (26.3%) | 861 (73.7%) |
| Education, Arts & Media | 63 (20.4%) | 245 (79.5%) |
| Legal Services & Support | 0 (0.0%) | 57 (100.0%) |
| Education Instruction & Library | 161 (23.4%) | 526 (76.6%) |
| Arts, Media & Entertainment | 83 (71.6%) | 33 (28.4%) |
| Health Diagnosing & Treating | 106 (12.9%) | 713 (87.1%) |
| Health Technologists | 44 (11.2%) | 348 (88.8%) |
| Total (Category) | 1,722 (40.3%) | 2,547 (59.7%) |
| Total (Overall) | 10,957 (54.1%) | 9,292 (45.9%) |
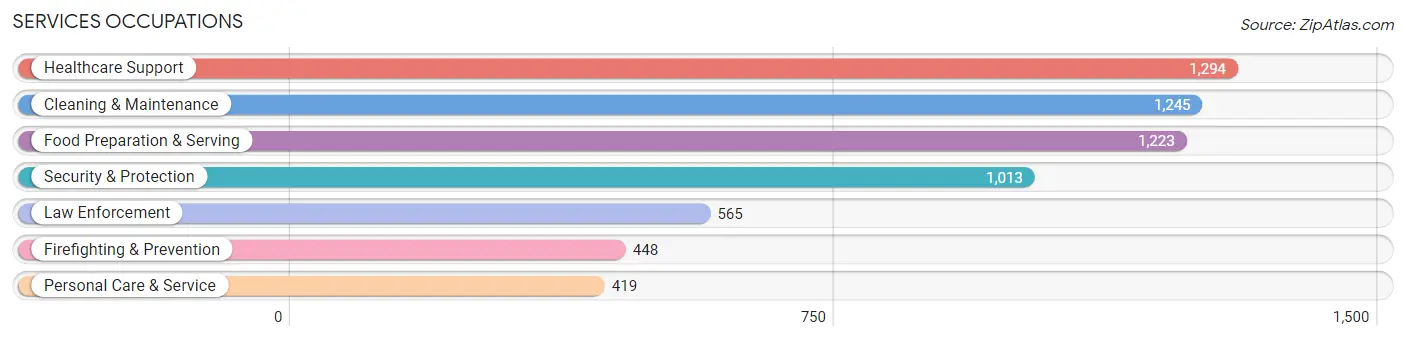
Services Occupations
The most common Services occupations in Port Arthur are Healthcare Support (1,294 | 6.4%), Cleaning & Maintenance (1,245 | 6.1%), Food Preparation & Serving (1,223 | 6.0%), Security & Protection (1,013 | 5.0%), and Law Enforcement (565 | 2.8%).
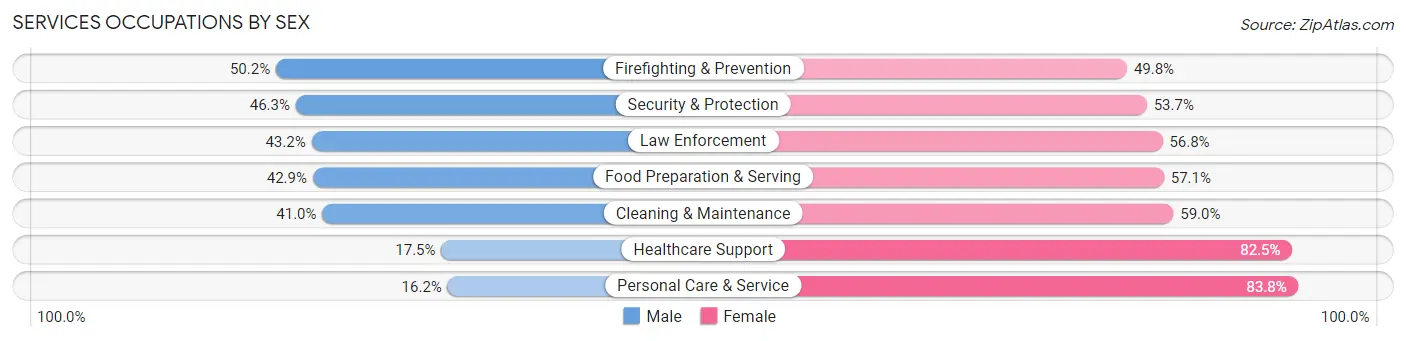
Services Occupations by Sex
Within the Services occupations in Port Arthur, the most male-oriented occupations are Firefighting & Prevention (50.2%), Security & Protection (46.3%), and Law Enforcement (43.2%), while the most female-oriented occupations are Personal Care & Service (83.8%), Healthcare Support (82.5%), and Cleaning & Maintenance (59.0%).
| Occupation | Male | Female |
| Healthcare Support | 226 (17.5%) | 1,068 (82.5%) |
| Security & Protection | 469 (46.3%) | 544 (53.7%) |
| Firefighting & Prevention | 225 (50.2%) | 223 (49.8%) |
| Law Enforcement | 244 (43.2%) | 321 (56.8%) |
| Food Preparation & Serving | 525 (42.9%) | 698 (57.1%) |
| Cleaning & Maintenance | 511 (41.0%) | 734 (59.0%) |
| Personal Care & Service | 68 (16.2%) | 351 (83.8%) |
| Total (Category) | 1,799 (34.6%) | 3,395 (65.4%) |
| Total (Overall) | 10,957 (54.1%) | 9,292 (45.9%) |
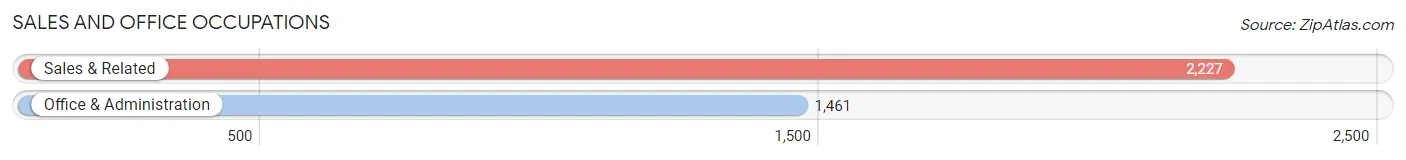
Sales and Office Occupations
The most common Sales and Office occupations in Port Arthur are Sales & Related (2,227 | 11.0%), and Office & Administration (1,461 | 7.2%).
Sales and Office Occupations by Sex
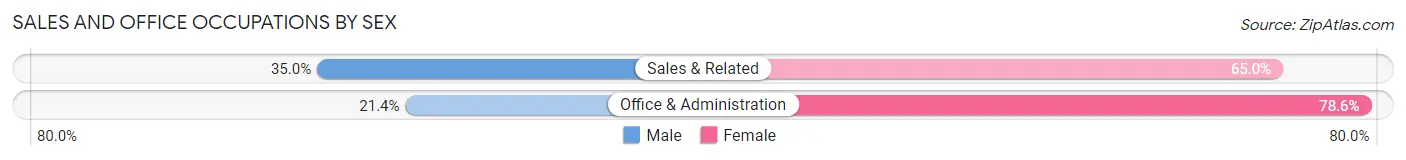
| Occupation | Male | Female |
| Sales & Related | 780 (35.0%) | 1,447 (65.0%) |
| Office & Administration | 313 (21.4%) | 1,148 (78.6%) |
| Total (Category) | 1,093 (29.6%) | 2,595 (70.4%) |
| Total (Overall) | 10,957 (54.1%) | 9,292 (45.9%) |
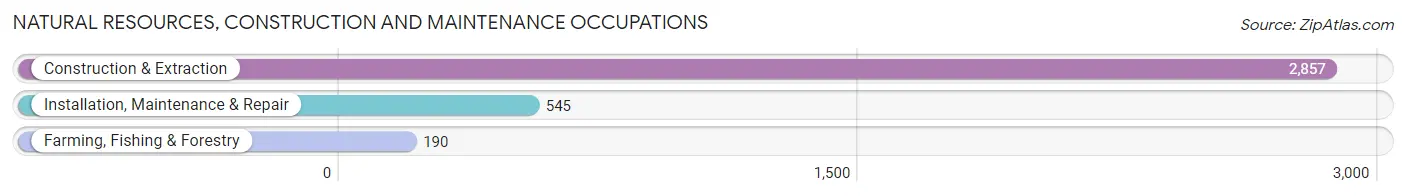
Natural Resources, Construction and Maintenance Occupations
The most common Natural Resources, Construction and Maintenance occupations in Port Arthur are Construction & Extraction (2,857 | 14.1%), Installation, Maintenance & Repair (545 | 2.7%), and Farming, Fishing & Forestry (190 | 0.9%).
Natural Resources, Construction and Maintenance Occupations by Sex
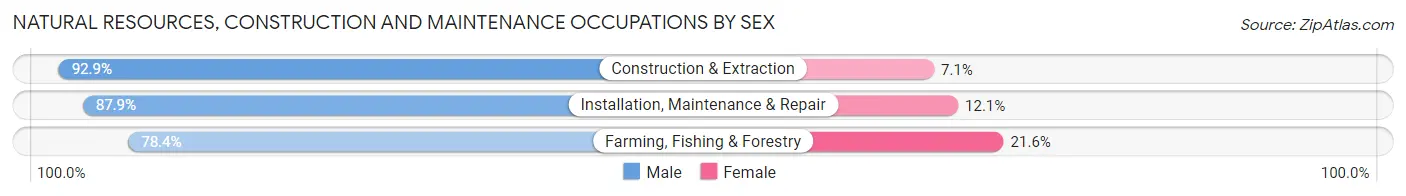
| Occupation | Male | Female |
| Farming, Fishing & Forestry | 149 (78.4%) | 41 (21.6%) |
| Construction & Extraction | 2,654 (92.9%) | 203 (7.1%) |
| Installation, Maintenance & Repair | 479 (87.9%) | 66 (12.1%) |
| Total (Category) | 3,282 (91.4%) | 310 (8.6%) |
| Total (Overall) | 10,957 (54.1%) | 9,292 (45.9%) |
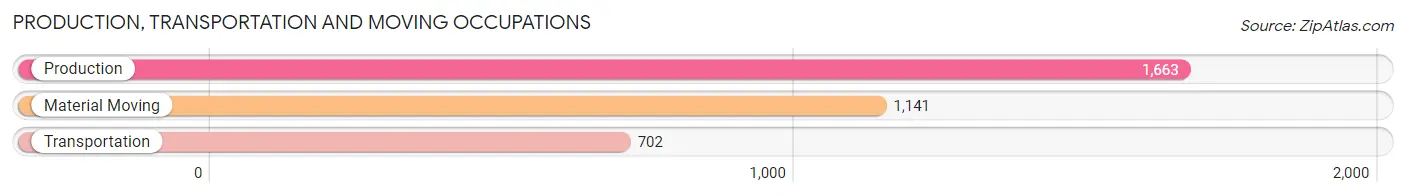
Production, Transportation and Moving Occupations
The most common Production, Transportation and Moving occupations in Port Arthur are Production (1,663 | 8.2%), Material Moving (1,141 | 5.6%), and Transportation (702 | 3.5%).
Production, Transportation and Moving Occupations by Sex
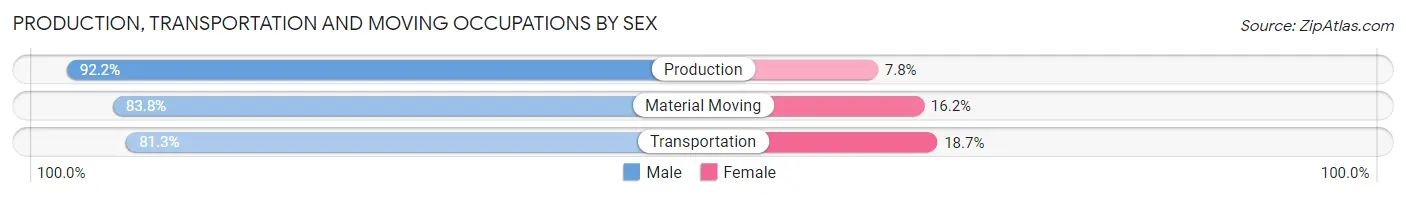
| Occupation | Male | Female |
| Production | 1,534 (92.2%) | 129 (7.8%) |
| Transportation | 571 (81.3%) | 131 (18.7%) |
| Material Moving | 956 (83.8%) | 185 (16.2%) |
| Total (Category) | 3,061 (87.3%) | 445 (12.7%) |
| Total (Overall) | 10,957 (54.1%) | 9,292 (45.9%) |
Employment Industries by Sex in Port Arthur
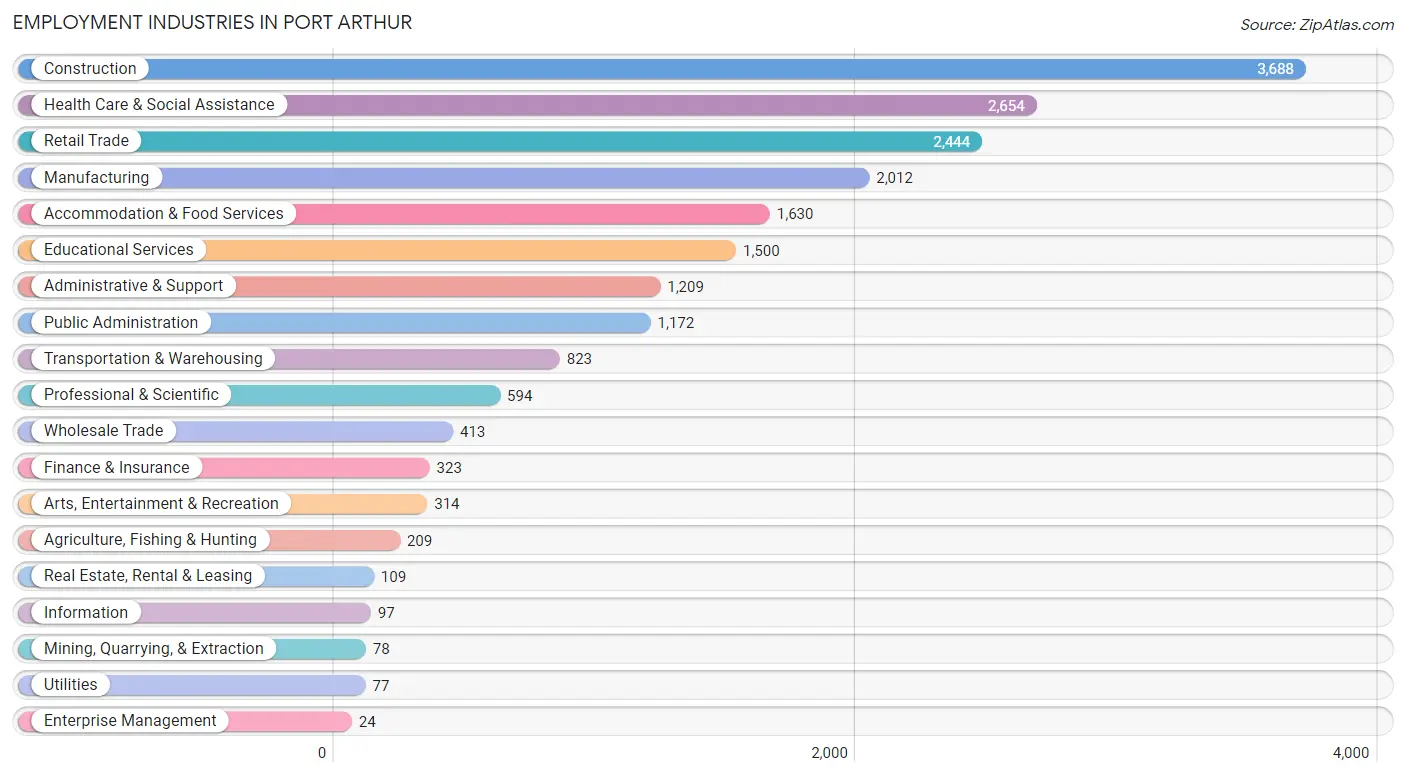
Employment Industries in Port Arthur
The major employment industries in Port Arthur include Construction (3,688 | 18.2%), Health Care & Social Assistance (2,654 | 13.1%), Retail Trade (2,444 | 12.1%), Manufacturing (2,012 | 9.9%), and Accommodation & Food Services (1,630 | 8.1%).
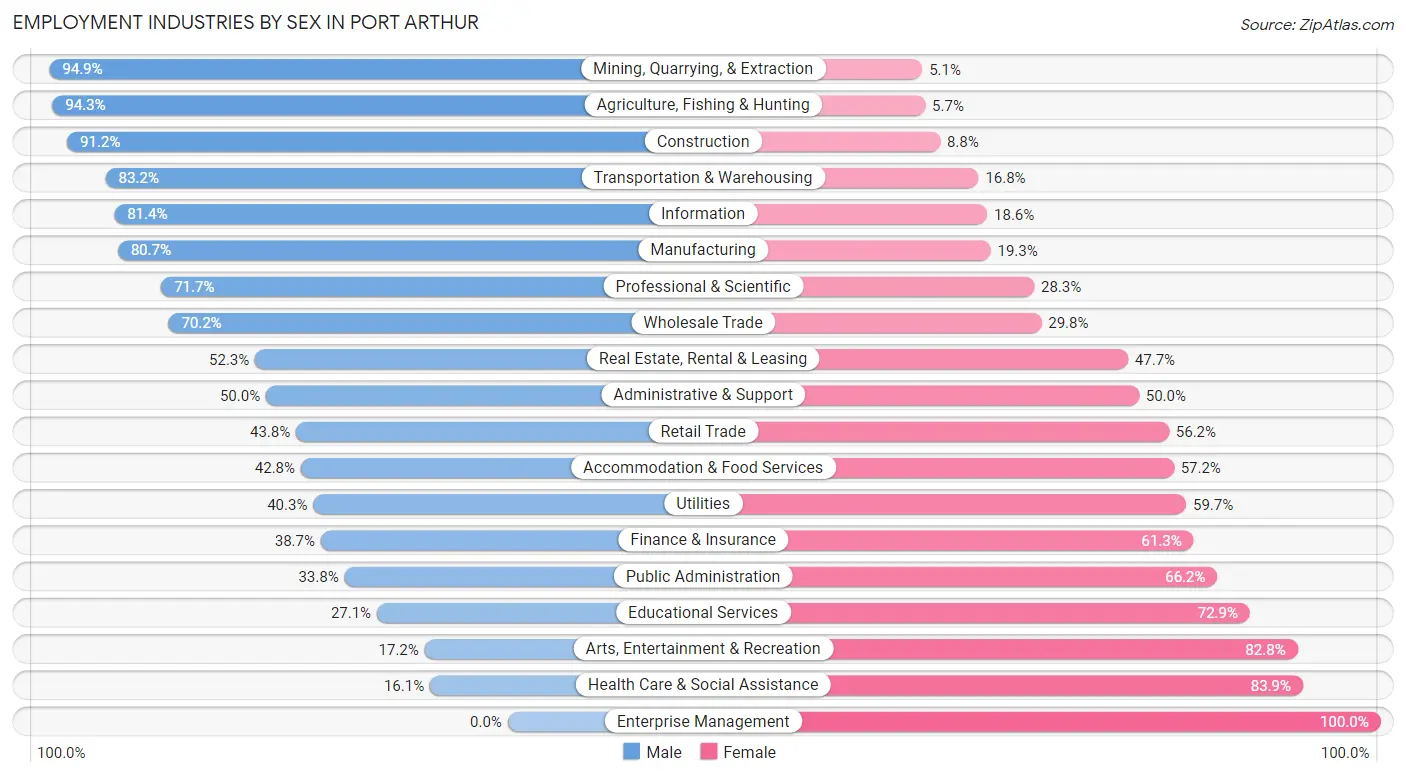
Employment Industries by Sex in Port Arthur
The Port Arthur industries that see more men than women are Mining, Quarrying, & Extraction (94.9%), Agriculture, Fishing & Hunting (94.3%), and Construction (91.2%), whereas the industries that tend to have a higher number of women are Enterprise Management (100.0%), Health Care & Social Assistance (83.9%), and Arts, Entertainment & Recreation (82.8%).
| Industry | Male | Female |
| Agriculture, Fishing & Hunting | 197 (94.3%) | 12 (5.7%) |
| Mining, Quarrying, & Extraction | 74 (94.9%) | 4 (5.1%) |
| Construction | 3,363 (91.2%) | 325 (8.8%) |
| Manufacturing | 1,624 (80.7%) | 388 (19.3%) |
| Wholesale Trade | 290 (70.2%) | 123 (29.8%) |
| Retail Trade | 1,071 (43.8%) | 1,373 (56.2%) |
| Transportation & Warehousing | 685 (83.2%) | 138 (16.8%) |
| Utilities | 31 (40.3%) | 46 (59.7%) |
| Information | 79 (81.4%) | 18 (18.6%) |
| Finance & Insurance | 125 (38.7%) | 198 (61.3%) |
| Real Estate, Rental & Leasing | 57 (52.3%) | 52 (47.7%) |
| Professional & Scientific | 426 (71.7%) | 168 (28.3%) |
| Enterprise Management | 0 (0.0%) | 24 (100.0%) |
| Administrative & Support | 605 (50.0%) | 604 (50.0%) |
| Educational Services | 406 (27.1%) | 1,094 (72.9%) |
| Health Care & Social Assistance | 427 (16.1%) | 2,227 (83.9%) |
| Arts, Entertainment & Recreation | 54 (17.2%) | 260 (82.8%) |
| Accommodation & Food Services | 698 (42.8%) | 932 (57.2%) |
| Public Administration | 396 (33.8%) | 776 (66.2%) |
| Total | 10,957 (54.1%) | 9,292 (45.9%) |
Education in Port Arthur
School Enrollment in Port Arthur
The most common levels of schooling among the 13,750 students in Port Arthur are middle school (3,620 | 26.3%), elementary school (3,472 | 25.3%), and high school (3,319 | 24.1%).
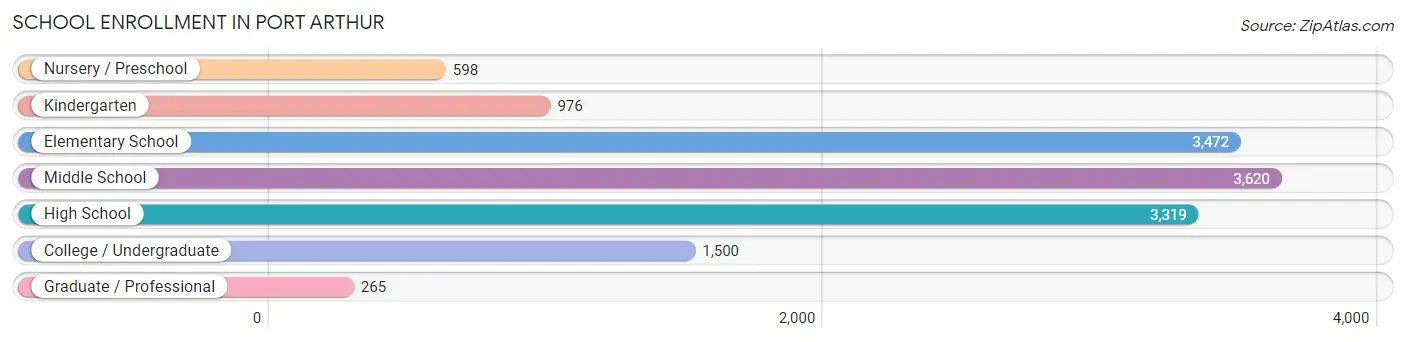
| School Level | # Students | % Students |
| Nursery / Preschool | 598 | 4.3% |
| Kindergarten | 976 | 7.1% |
| Elementary School | 3,472 | 25.3% |
| Middle School | 3,620 | 26.3% |
| High School | 3,319 | 24.1% |
| College / Undergraduate | 1,500 | 10.9% |
| Graduate / Professional | 265 | 1.9% |
| Total | 13,750 | 100.0% |
School Enrollment by Age by Funding Source in Port Arthur
Out of a total of 13,750 students who are enrolled in schools in Port Arthur, 976 (7.1%) attend a private institution, while the remaining 12,774 (92.9%) are enrolled in public schools. The age group of 35 years and over has the highest likelihood of being enrolled in private schools, with 94 (23.6% in the age bracket) enrolled. Conversely, the age group of 5 to 9 year old has the lowest likelihood of being enrolled in a private school, with 3,943 (96.6% in the age bracket) attending a public institution.
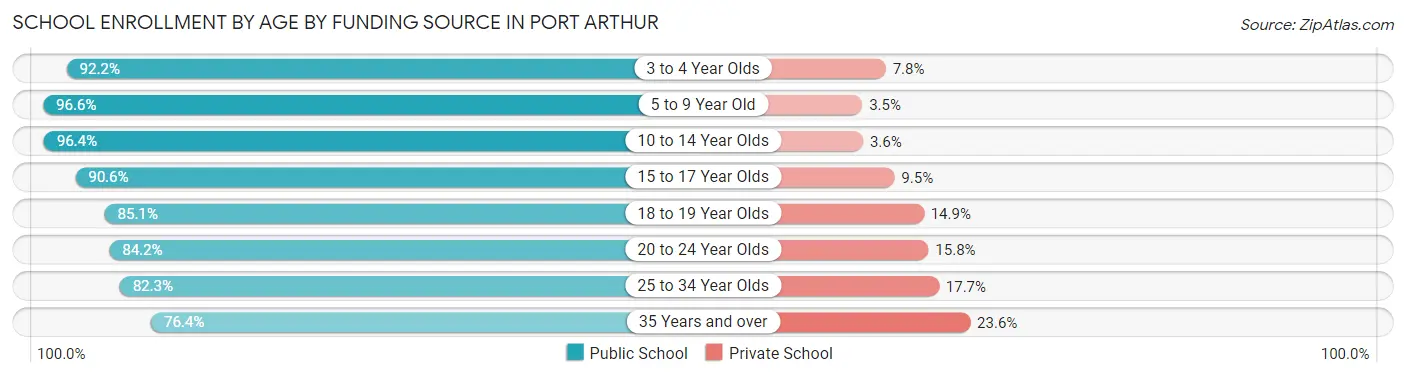
| Age Bracket | Public School | Private School |
| 3 to 4 Year Olds | 659 (92.2%) | 56 (7.8%) |
| 5 to 9 Year Old | 3,943 (96.6%) | 141 (3.5%) |
| 10 to 14 Year Olds | 3,950 (96.4%) | 147 (3.6%) |
| 15 to 17 Year Olds | 2,271 (90.5%) | 237 (9.5%) |
| 18 to 19 Year Olds | 759 (85.1%) | 133 (14.9%) |
| 20 to 24 Year Olds | 651 (84.2%) | 122 (15.8%) |
| 25 to 34 Year Olds | 232 (82.3%) | 50 (17.7%) |
| 35 Years and over | 305 (76.4%) | 94 (23.6%) |
| Total | 12,774 (92.9%) | 976 (7.1%) |
Educational Attainment by Field of Study in Port Arthur
Business (784 | 19.0%), education (728 | 17.7%), science & technology (413 | 10.0%), engineering (369 | 9.0%), and liberal arts & history (360 | 8.7%) are the most common fields of study among 4,120 individuals in Port Arthur who have obtained a bachelor's degree or higher.
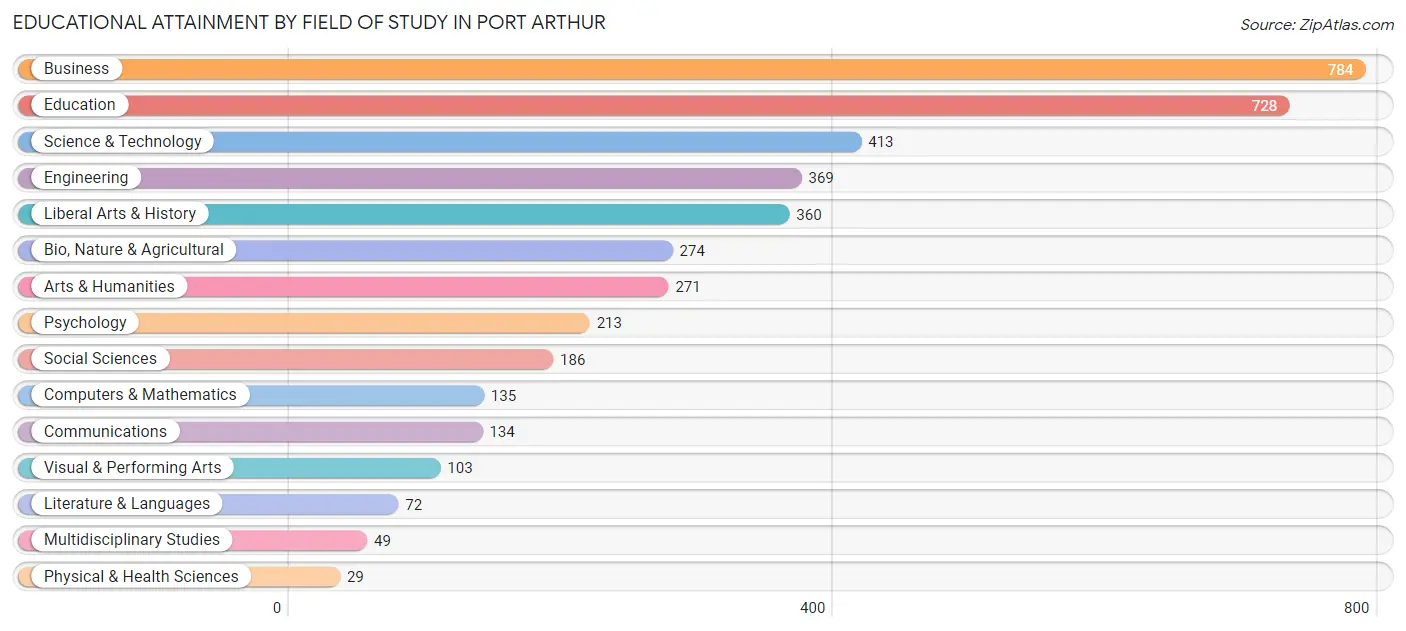
| Field of Study | # Graduates | % Graduates |
| Computers & Mathematics | 135 | 3.3% |
| Bio, Nature & Agricultural | 274 | 6.7% |
| Physical & Health Sciences | 29 | 0.7% |
| Psychology | 213 | 5.2% |
| Social Sciences | 186 | 4.5% |
| Engineering | 369 | 9.0% |
| Multidisciplinary Studies | 49 | 1.2% |
| Science & Technology | 413 | 10.0% |
| Business | 784 | 19.0% |
| Education | 728 | 17.7% |
| Literature & Languages | 72 | 1.8% |
| Liberal Arts & History | 360 | 8.7% |
| Visual & Performing Arts | 103 | 2.5% |
| Communications | 134 | 3.3% |
| Arts & Humanities | 271 | 6.6% |
| Total | 4,120 | 100.0% |
Transportation & Commute in Port Arthur
Vehicle Availability by Sex in Port Arthur
The most prevalent vehicle ownership categories in Port Arthur are males with 2 vehicles (4,690, accounting for 43.8%) and females with 2 vehicles (3,094, making up 51.7%).
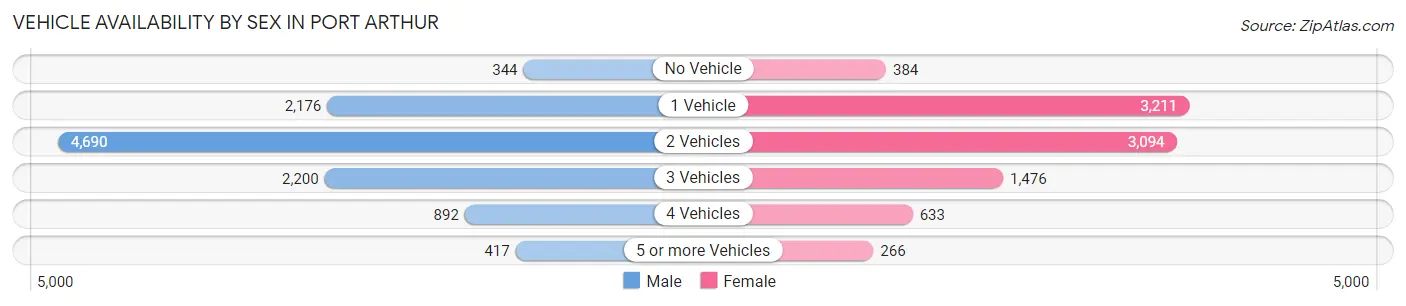
| Vehicles Available | Male | Female |
| No Vehicle | 344 (3.2%) | 384 (4.2%) |
| 1 Vehicle | 2,176 (20.3%) | 3,211 (35.4%) |
| 2 Vehicles | 4,690 (43.8%) | 3,094 (34.1%) |
| 3 Vehicles | 2,200 (20.5%) | 1,476 (16.3%) |
| 4 Vehicles | 892 (8.3%) | 633 (7.0%) |
| 5 or more Vehicles | 417 (3.9%) | 266 (2.9%) |
| Total | 10,719 (100.0%) | 9,064 (100.0%) |
Commute Time in Port Arthur
The most frequently occuring commute durations in Port Arthur are 20 to 24 minutes (4,837 commuters, 24.6%), 15 to 19 minutes (4,213 commuters, 21.4%), and 30 to 34 minutes (2,757 commuters, 14.0%).
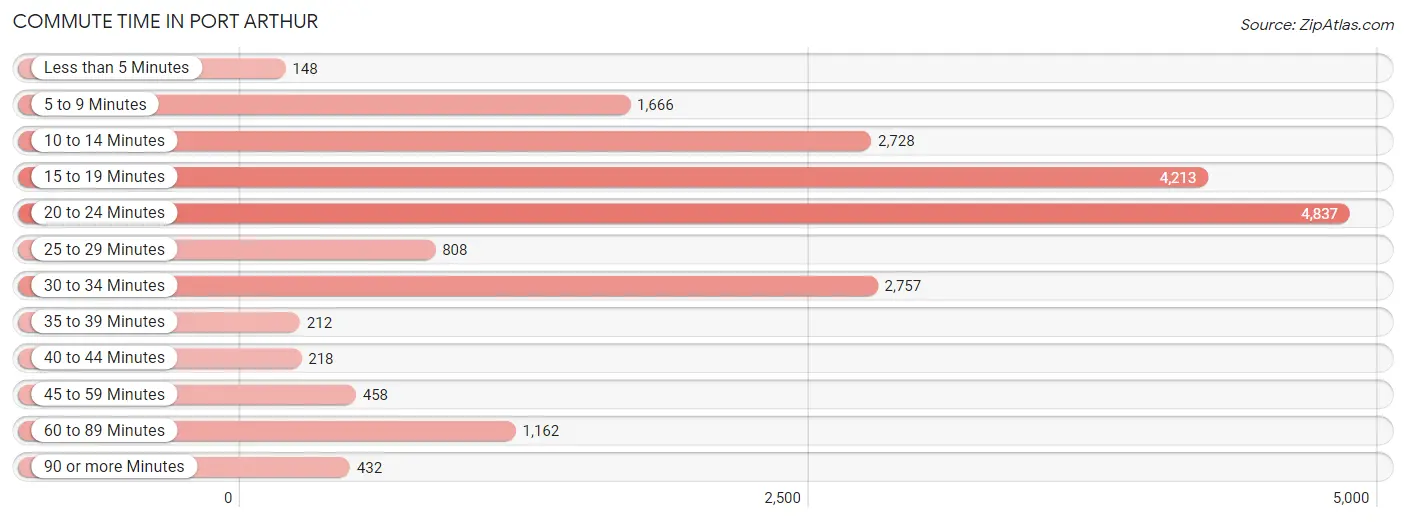
| Commute Time | # Commuters | % Commuters |
| Less than 5 Minutes | 148 | 0.7% |
| 5 to 9 Minutes | 1,666 | 8.5% |
| 10 to 14 Minutes | 2,728 | 13.9% |
| 15 to 19 Minutes | 4,213 | 21.4% |
| 20 to 24 Minutes | 4,837 | 24.6% |
| 25 to 29 Minutes | 808 | 4.1% |
| 30 to 34 Minutes | 2,757 | 14.0% |
| 35 to 39 Minutes | 212 | 1.1% |
| 40 to 44 Minutes | 218 | 1.1% |
| 45 to 59 Minutes | 458 | 2.3% |
| 60 to 89 Minutes | 1,162 | 5.9% |
| 90 or more Minutes | 432 | 2.2% |
Commute Time by Sex in Port Arthur
The most common commute times in Port Arthur are 20 to 24 minutes (2,446 commuters, 22.9%) for males and 20 to 24 minutes (2,391 commuters, 26.6%) for females.
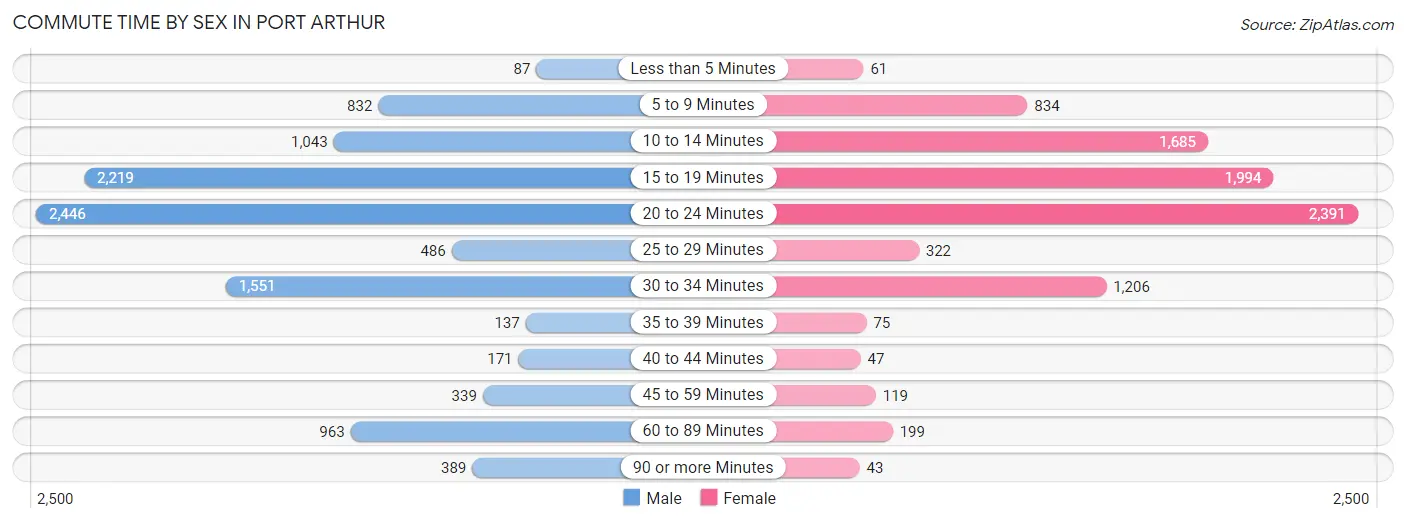
| Commute Time | Male | Female |
| Less than 5 Minutes | 87 (0.8%) | 61 (0.7%) |
| 5 to 9 Minutes | 832 (7.8%) | 834 (9.3%) |
| 10 to 14 Minutes | 1,043 (9.8%) | 1,685 (18.8%) |
| 15 to 19 Minutes | 2,219 (20.8%) | 1,994 (22.2%) |
| 20 to 24 Minutes | 2,446 (22.9%) | 2,391 (26.6%) |
| 25 to 29 Minutes | 486 (4.6%) | 322 (3.6%) |
| 30 to 34 Minutes | 1,551 (14.5%) | 1,206 (13.4%) |
| 35 to 39 Minutes | 137 (1.3%) | 75 (0.8%) |
| 40 to 44 Minutes | 171 (1.6%) | 47 (0.5%) |
| 45 to 59 Minutes | 339 (3.2%) | 119 (1.3%) |
| 60 to 89 Minutes | 963 (9.0%) | 199 (2.2%) |
| 90 or more Minutes | 389 (3.6%) | 43 (0.5%) |
Time of Departure to Work by Sex in Port Arthur
The most frequent times of departure to work in Port Arthur are 6:00 AM to 6:29 AM (1,791, 16.8%) for males and 7:00 AM to 7:29 AM (1,217, 13.6%) for females.
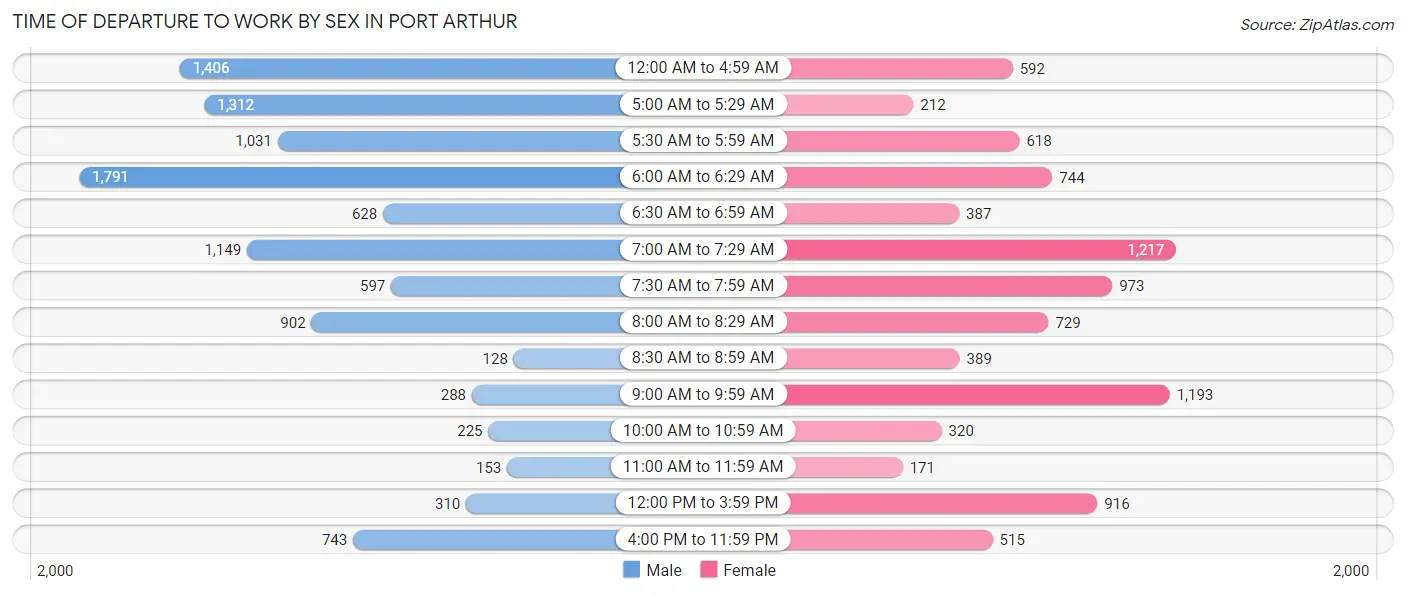
| Time of Departure | Male | Female |
| 12:00 AM to 4:59 AM | 1,406 (13.2%) | 592 (6.6%) |
| 5:00 AM to 5:29 AM | 1,312 (12.3%) | 212 (2.4%) |
| 5:30 AM to 5:59 AM | 1,031 (9.7%) | 618 (6.9%) |
| 6:00 AM to 6:29 AM | 1,791 (16.8%) | 744 (8.3%) |
| 6:30 AM to 6:59 AM | 628 (5.9%) | 387 (4.3%) |
| 7:00 AM to 7:29 AM | 1,149 (10.8%) | 1,217 (13.6%) |
| 7:30 AM to 7:59 AM | 597 (5.6%) | 973 (10.8%) |
| 8:00 AM to 8:29 AM | 902 (8.5%) | 729 (8.1%) |
| 8:30 AM to 8:59 AM | 128 (1.2%) | 389 (4.3%) |
| 9:00 AM to 9:59 AM | 288 (2.7%) | 1,193 (13.3%) |
| 10:00 AM to 10:59 AM | 225 (2.1%) | 320 (3.6%) |
| 11:00 AM to 11:59 AM | 153 (1.4%) | 171 (1.9%) |
| 12:00 PM to 3:59 PM | 310 (2.9%) | 916 (10.2%) |
| 4:00 PM to 11:59 PM | 743 (7.0%) | 515 (5.7%) |
| Total | 10,663 (100.0%) | 8,976 (100.0%) |
Housing Occupancy in Port Arthur
Occupancy by Ownership in Port Arthur
Of the total 20,364 dwellings in Port Arthur, owner-occupied units account for 11,648 (57.2%), while renter-occupied units make up 8,716 (42.8%).
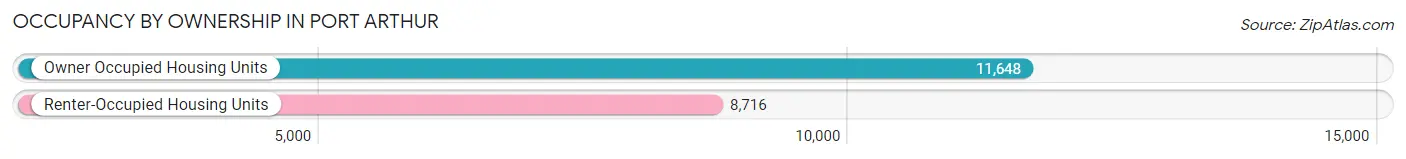
| Occupancy | # Housing Units | % Housing Units |
| Owner Occupied Housing Units | 11,648 | 57.2% |
| Renter-Occupied Housing Units | 8,716 | 42.8% |
| Total Occupied Housing Units | 20,364 | 100.0% |
Occupancy by Household Size in Port Arthur
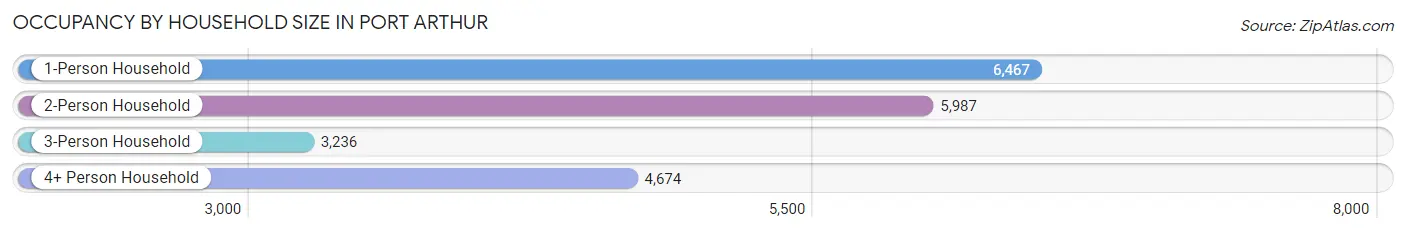
| Household Size | # Housing Units | % Housing Units |
| 1-Person Household | 6,467 | 31.8% |
| 2-Person Household | 5,987 | 29.4% |
| 3-Person Household | 3,236 | 15.9% |
| 4+ Person Household | 4,674 | 23.0% |
| Total Housing Units | 20,364 | 100.0% |
Occupancy by Ownership by Household Size in Port Arthur
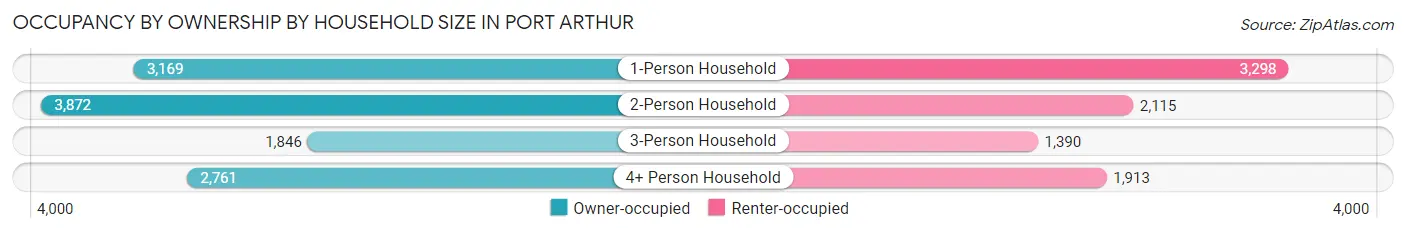
| Household Size | Owner-occupied | Renter-occupied |
| 1-Person Household | 3,169 (49.0%) | 3,298 (51.0%) |
| 2-Person Household | 3,872 (64.7%) | 2,115 (35.3%) |
| 3-Person Household | 1,846 (57.1%) | 1,390 (42.9%) |
| 4+ Person Household | 2,761 (59.1%) | 1,913 (40.9%) |
| Total Housing Units | 11,648 (57.2%) | 8,716 (42.8%) |
Occupancy by Educational Attainment in Port Arthur
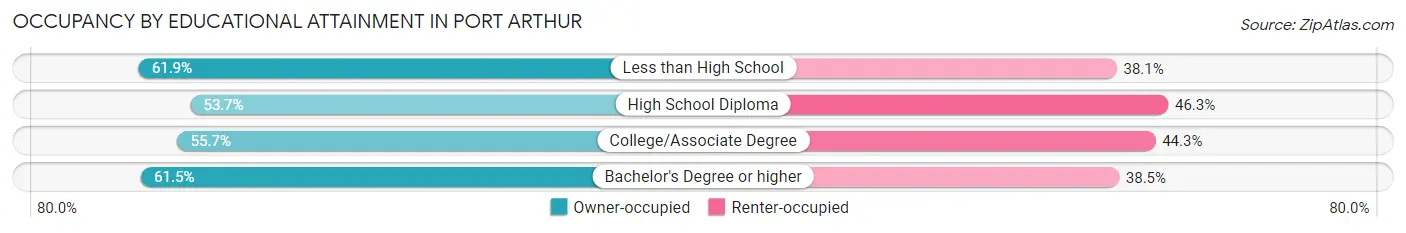
| Household Size | Owner-occupied | Renter-occupied |
| Less than High School | 2,783 (61.9%) | 1,715 (38.1%) |
| High School Diploma | 3,460 (53.7%) | 2,982 (46.3%) |
| College/Associate Degree | 3,786 (55.7%) | 3,006 (44.3%) |
| Bachelor's Degree or higher | 1,619 (61.5%) | 1,013 (38.5%) |
Occupancy by Age of Householder in Port Arthur
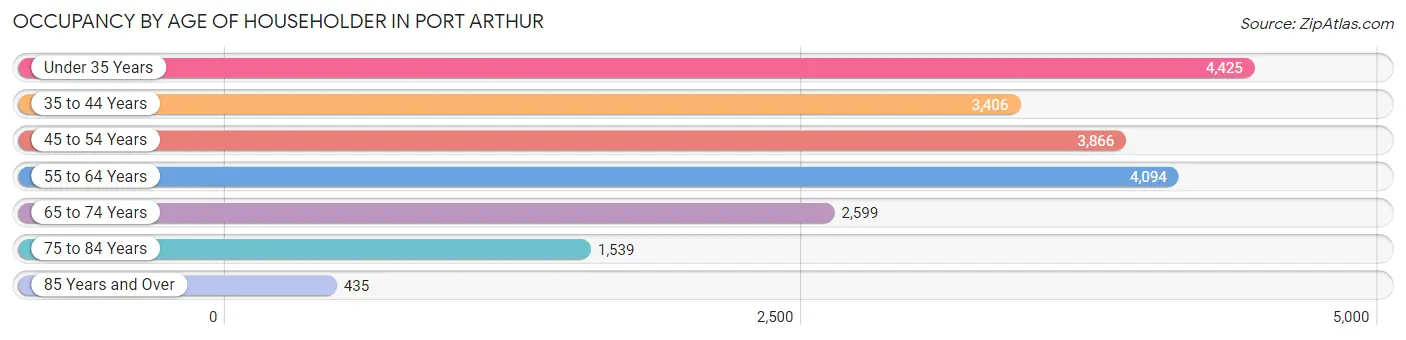
| Age Bracket | # Households | % Households |
| Under 35 Years | 4,425 | 21.7% |
| 35 to 44 Years | 3,406 | 16.7% |
| 45 to 54 Years | 3,866 | 19.0% |
| 55 to 64 Years | 4,094 | 20.1% |
| 65 to 74 Years | 2,599 | 12.8% |
| 75 to 84 Years | 1,539 | 7.6% |
| 85 Years and Over | 435 | 2.1% |
| Total | 20,364 | 100.0% |
Housing Finances in Port Arthur
Median Income by Occupancy in Port Arthur
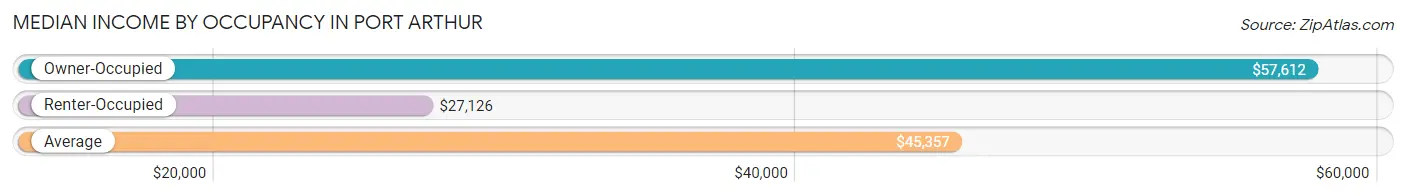
| Occupancy Type | # Households | Median Income |
| Owner-Occupied | 11,648 (57.2%) | $57,612 |
| Renter-Occupied | 8,716 (42.8%) | $27,126 |
| Average | 20,364 (100.0%) | $45,357 |
Occupancy by Householder Income Bracket in Port Arthur
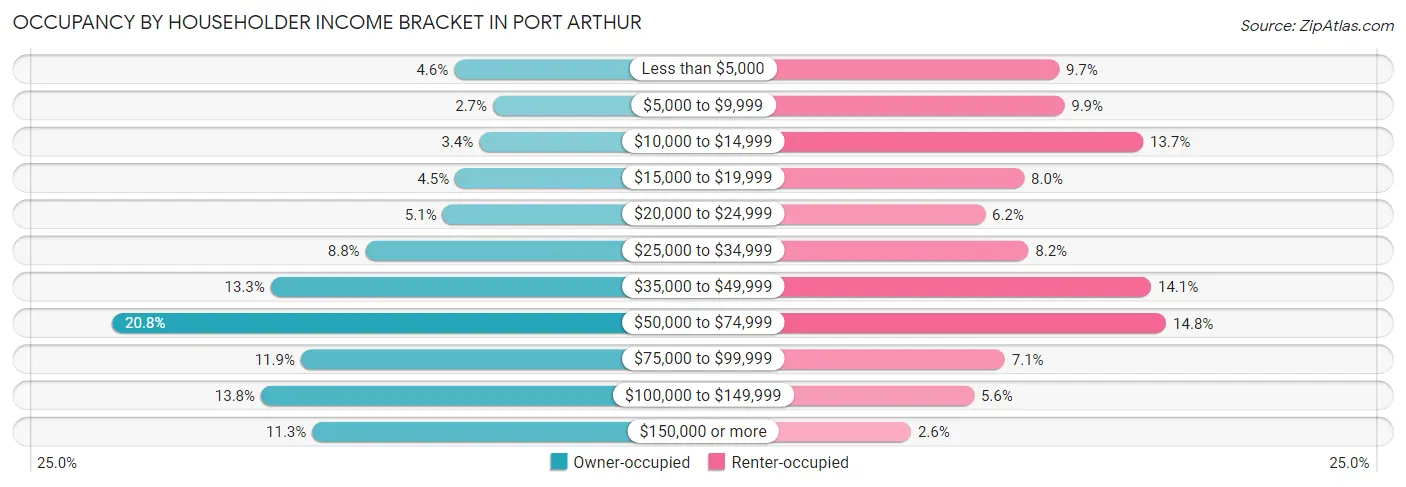
| Income Bracket | Owner-occupied | Renter-occupied |
| Less than $5,000 | 530 (4.5%) | 845 (9.7%) |
| $5,000 to $9,999 | 314 (2.7%) | 866 (9.9%) |
| $10,000 to $14,999 | 391 (3.4%) | 1,193 (13.7%) |
| $15,000 to $19,999 | 524 (4.5%) | 700 (8.0%) |
| $20,000 to $24,999 | 594 (5.1%) | 538 (6.2%) |
| $25,000 to $34,999 | 1,022 (8.8%) | 717 (8.2%) |
| $35,000 to $49,999 | 1,548 (13.3%) | 1,226 (14.1%) |
| $50,000 to $74,999 | 2,426 (20.8%) | 1,289 (14.8%) |
| $75,000 to $99,999 | 1,380 (11.8%) | 620 (7.1%) |
| $100,000 to $149,999 | 1,602 (13.8%) | 492 (5.6%) |
| $150,000 or more | 1,317 (11.3%) | 230 (2.6%) |
| Total | 11,648 (100.0%) | 8,716 (100.0%) |
Monthly Housing Cost Tiers in Port Arthur
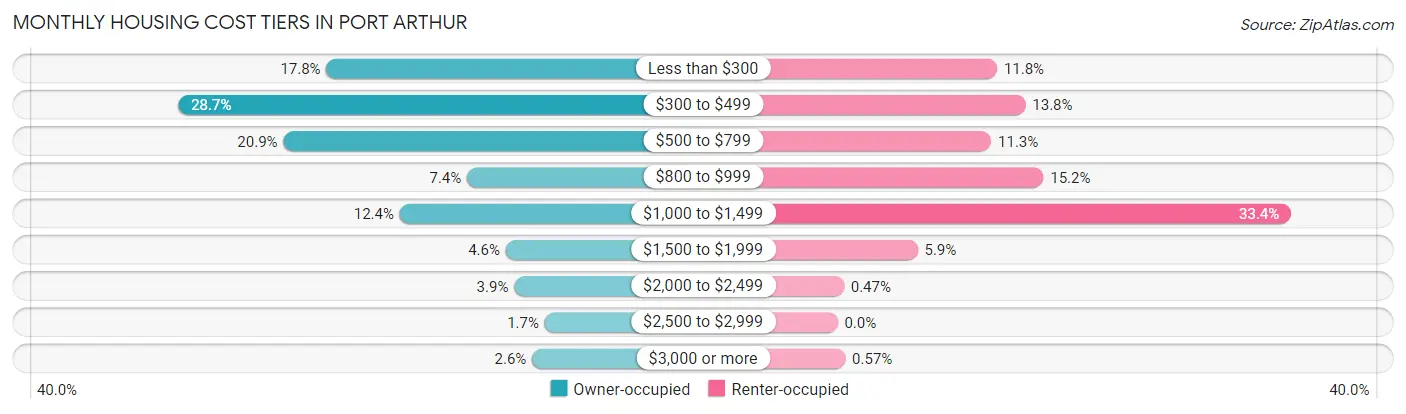
| Monthly Cost | Owner-occupied | Renter-occupied |
| Less than $300 | 2,070 (17.8%) | 1,024 (11.7%) |
| $300 to $499 | 3,343 (28.7%) | 1,206 (13.8%) |
| $500 to $799 | 2,439 (20.9%) | 987 (11.3%) |
| $800 to $999 | 863 (7.4%) | 1,321 (15.2%) |
| $1,000 to $1,499 | 1,441 (12.4%) | 2,912 (33.4%) |
| $1,500 to $1,999 | 531 (4.6%) | 514 (5.9%) |
| $2,000 to $2,499 | 459 (3.9%) | 41 (0.5%) |
| $2,500 to $2,999 | 197 (1.7%) | 0 (0.0%) |
| $3,000 or more | 305 (2.6%) | 50 (0.6%) |
| Total | 11,648 (100.0%) | 8,716 (100.0%) |
Physical Housing Characteristics in Port Arthur
Housing Structures in Port Arthur
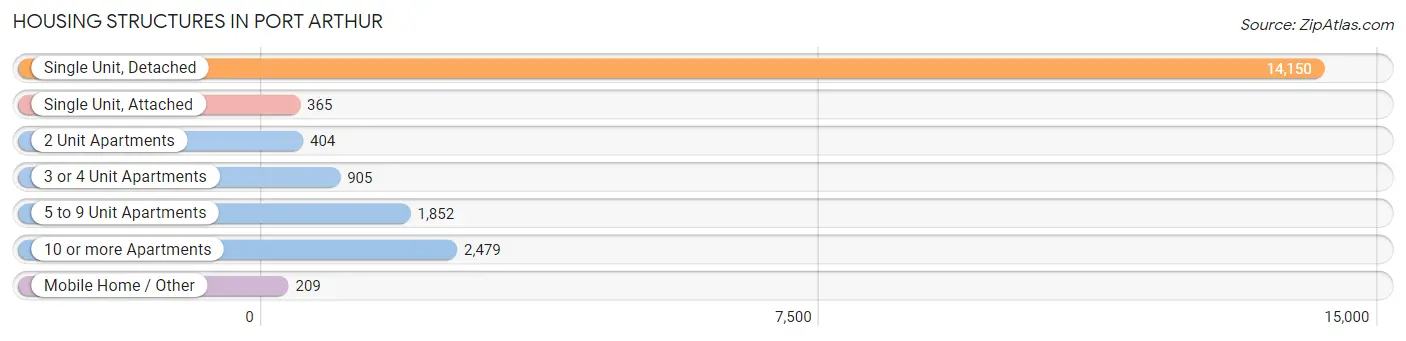
| Structure Type | # Housing Units | % Housing Units |
| Single Unit, Detached | 14,150 | 69.5% |
| Single Unit, Attached | 365 | 1.8% |
| 2 Unit Apartments | 404 | 2.0% |
| 3 or 4 Unit Apartments | 905 | 4.4% |
| 5 to 9 Unit Apartments | 1,852 | 9.1% |
| 10 or more Apartments | 2,479 | 12.2% |
| Mobile Home / Other | 209 | 1.0% |
| Total | 20,364 | 100.0% |
Housing Structures by Occupancy in Port Arthur
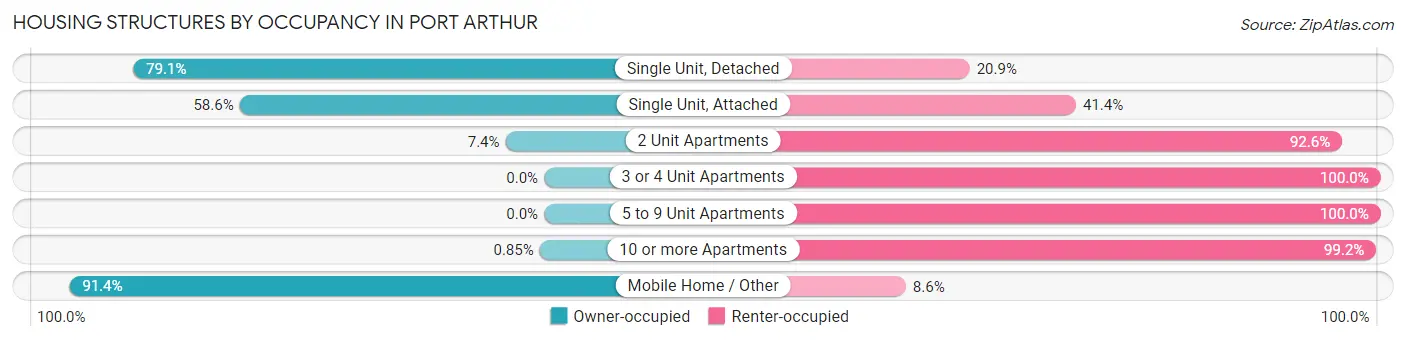
| Structure Type | Owner-occupied | Renter-occupied |
| Single Unit, Detached | 11,192 (79.1%) | 2,958 (20.9%) |
| Single Unit, Attached | 214 (58.6%) | 151 (41.4%) |
| 2 Unit Apartments | 30 (7.4%) | 374 (92.6%) |
| 3 or 4 Unit Apartments | 0 (0.0%) | 905 (100.0%) |
| 5 to 9 Unit Apartments | 0 (0.0%) | 1,852 (100.0%) |
| 10 or more Apartments | 21 (0.9%) | 2,458 (99.2%) |
| Mobile Home / Other | 191 (91.4%) | 18 (8.6%) |
| Total | 11,648 (57.2%) | 8,716 (42.8%) |
Housing Structures by Number of Rooms in Port Arthur
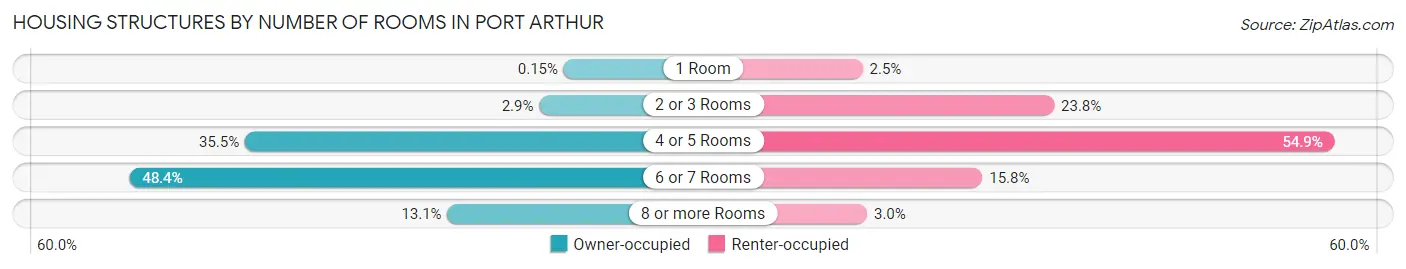
| Number of Rooms | Owner-occupied | Renter-occupied |
| 1 Room | 18 (0.2%) | 220 (2.5%) |
| 2 or 3 Rooms | 335 (2.9%) | 2,072 (23.8%) |
| 4 or 5 Rooms | 4,138 (35.5%) | 4,785 (54.9%) |
| 6 or 7 Rooms | 5,635 (48.4%) | 1,377 (15.8%) |
| 8 or more Rooms | 1,522 (13.1%) | 262 (3.0%) |
| Total | 11,648 (100.0%) | 8,716 (100.0%) |
Housing Structure by Heating Type in Port Arthur
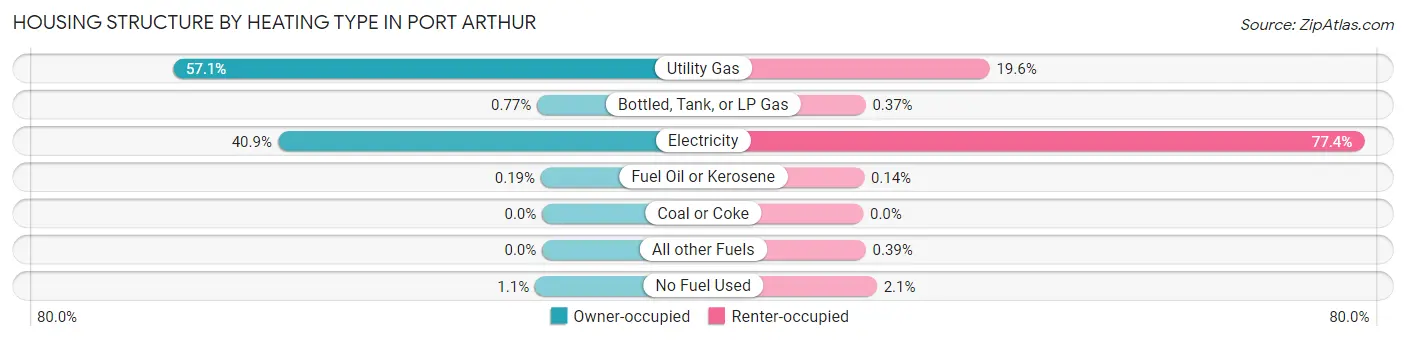
| Heating Type | Owner-occupied | Renter-occupied |
| Utility Gas | 6,647 (57.1%) | 1,704 (19.6%) |
| Bottled, Tank, or LP Gas | 90 (0.8%) | 32 (0.4%) |
| Electricity | 4,761 (40.9%) | 6,750 (77.4%) |
| Fuel Oil or Kerosene | 22 (0.2%) | 12 (0.1%) |
| Coal or Coke | 0 (0.0%) | 0 (0.0%) |
| All other Fuels | 0 (0.0%) | 34 (0.4%) |
| No Fuel Used | 128 (1.1%) | 184 (2.1%) |
| Total | 11,648 (100.0%) | 8,716 (100.0%) |
Household Vehicle Usage in Port Arthur
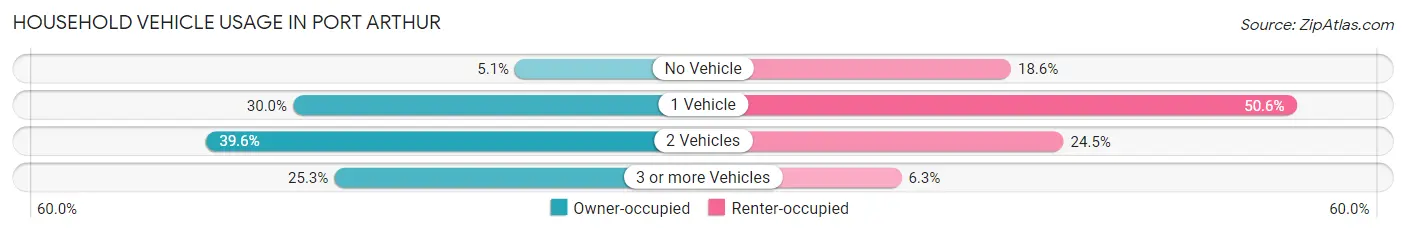
| Vehicles per Household | Owner-occupied | Renter-occupied |
| No Vehicle | 591 (5.1%) | 1,622 (18.6%) |
| 1 Vehicle | 3,489 (29.9%) | 4,407 (50.6%) |
| 2 Vehicles | 4,617 (39.6%) | 2,135 (24.5%) |
| 3 or more Vehicles | 2,951 (25.3%) | 552 (6.3%) |
| Total | 11,648 (100.0%) | 8,716 (100.0%) |
Real Estate & Mortgages in Port Arthur
Real Estate and Mortgage Overview in Port Arthur
| Characteristic | Without Mortgage | With Mortgage |
| Housing Units | 8,175 | 3,473 |
| Median Property Value | $77,100 | $134,900 |
| Median Household Income | $54,084 | $712 |
| Monthly Housing Costs | $416 | $276 |
| Real Estate Taxes | $999 | $331 |
Property Value by Mortgage Status in Port Arthur
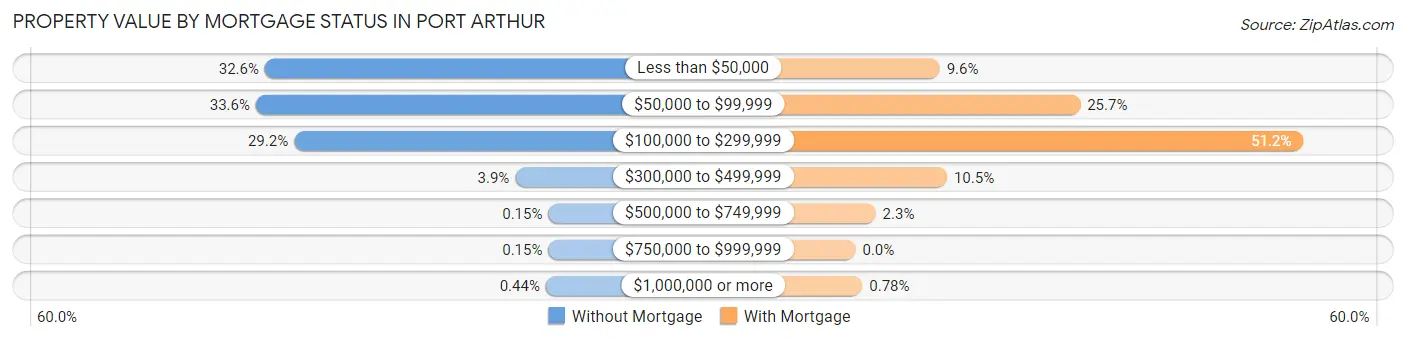
| Property Value | Without Mortgage | With Mortgage |
| Less than $50,000 | 2,661 (32.6%) | 334 (9.6%) |
| $50,000 to $99,999 | 2,745 (33.6%) | 892 (25.7%) |
| $100,000 to $299,999 | 2,388 (29.2%) | 1,777 (51.2%) |
| $300,000 to $499,999 | 321 (3.9%) | 363 (10.4%) |
| $500,000 to $749,999 | 12 (0.2%) | 80 (2.3%) |
| $750,000 to $999,999 | 12 (0.2%) | 0 (0.0%) |
| $1,000,000 or more | 36 (0.4%) | 27 (0.8%) |
| Total | 8,175 (100.0%) | 3,473 (100.0%) |
Household Income by Mortgage Status in Port Arthur
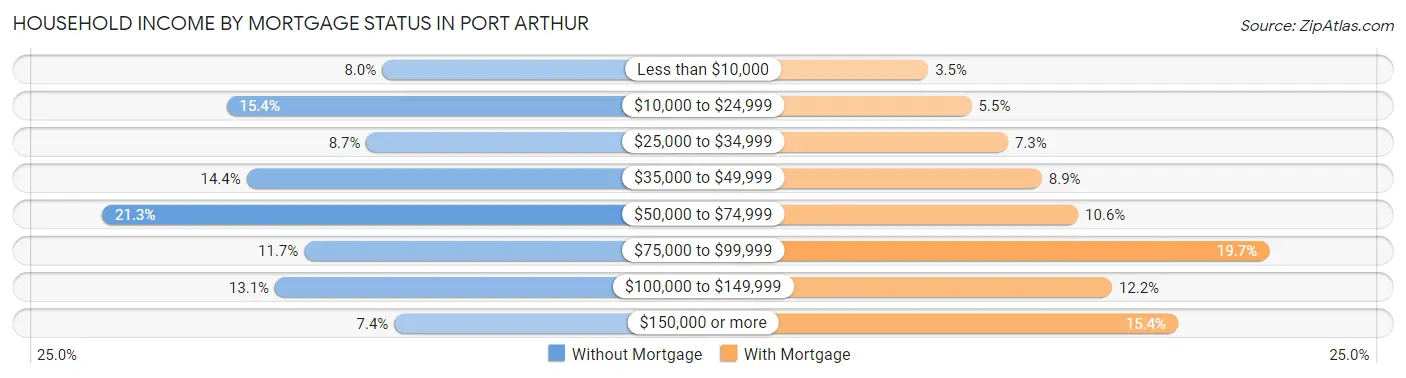
| Household Income | Without Mortgage | With Mortgage |
| Less than $10,000 | 652 (8.0%) | 120 (3.5%) |
| $10,000 to $24,999 | 1,257 (15.4%) | 192 (5.5%) |
| $25,000 to $34,999 | 714 (8.7%) | 252 (7.3%) |
| $35,000 to $49,999 | 1,180 (14.4%) | 308 (8.9%) |
| $50,000 to $74,999 | 1,742 (21.3%) | 368 (10.6%) |
| $75,000 to $99,999 | 956 (11.7%) | 684 (19.7%) |
| $100,000 to $149,999 | 1,069 (13.1%) | 424 (12.2%) |
| $150,000 or more | 605 (7.4%) | 533 (15.3%) |
| Total | 8,175 (100.0%) | 3,473 (100.0%) |
Property Value to Household Income Ratio in Port Arthur
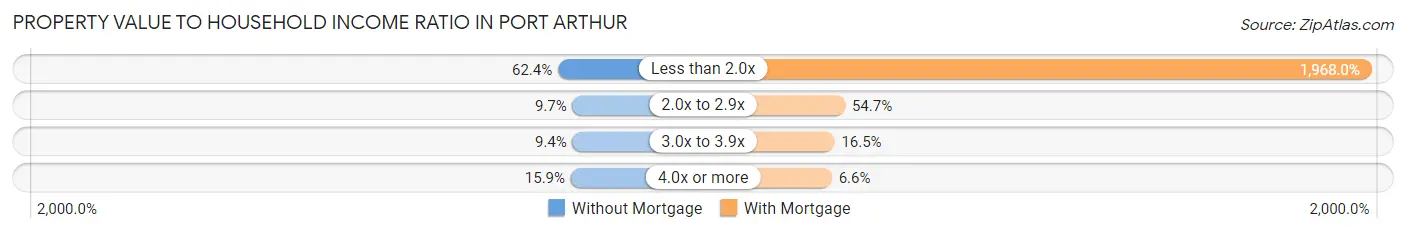
| Value-to-Income Ratio | Without Mortgage | With Mortgage |
| Less than 2.0x | 5,103 (62.4%) | 68,350 (1,968.0%) |
| 2.0x to 2.9x | 790 (9.7%) | 1,900 (54.7%) |
| 3.0x to 3.9x | 767 (9.4%) | 572 (16.5%) |
| 4.0x or more | 1,302 (15.9%) | 230 (6.6%) |
| Total | 8,175 (100.0%) | 3,473 (100.0%) |
Real Estate Taxes by Mortgage Status in Port Arthur
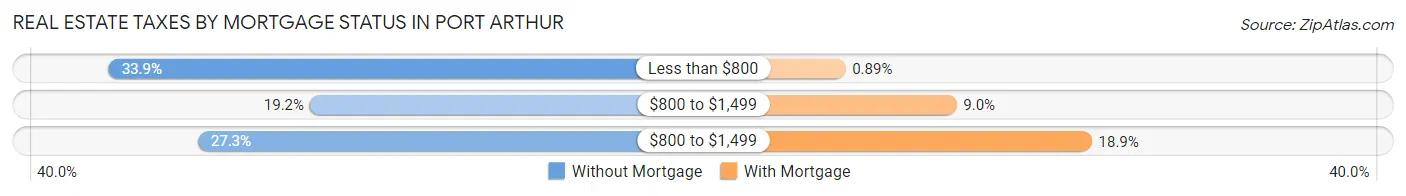
| Property Taxes | Without Mortgage | With Mortgage |
| Less than $800 | 2,767 (33.9%) | 31 (0.9%) |
| $800 to $1,499 | 1,566 (19.2%) | 313 (9.0%) |
| $800 to $1,499 | 2,235 (27.3%) | 656 (18.9%) |
| Total | 8,175 (100.0%) | 3,473 (100.0%) |
Health & Disability in Port Arthur
Health Insurance Coverage by Age in Port Arthur
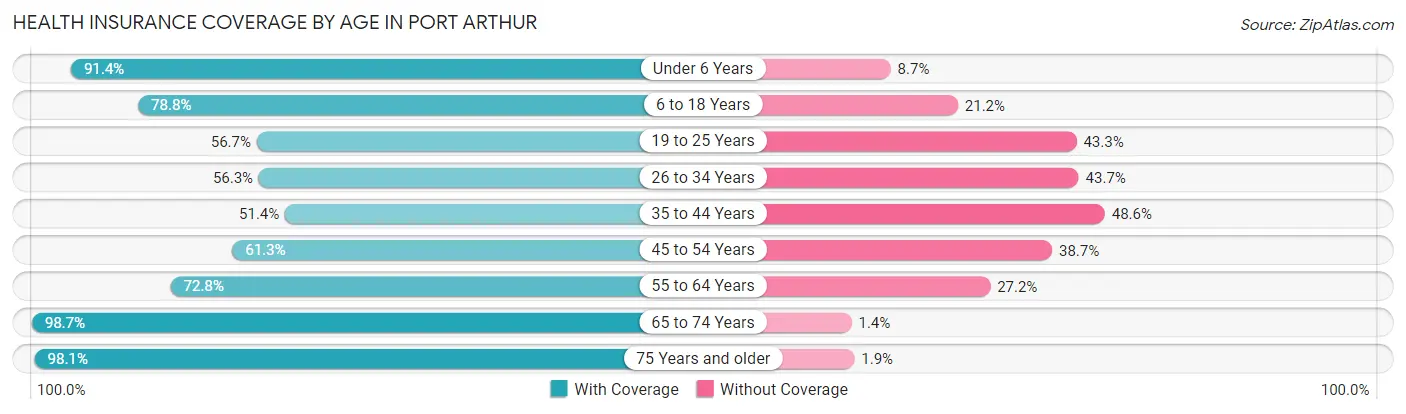
| Age Bracket | With Coverage | Without Coverage |
| Under 6 Years | 4,763 (91.3%) | 451 (8.6%) |
| 6 to 18 Years | 8,838 (78.8%) | 2,375 (21.2%) |
| 19 to 25 Years | 3,180 (56.7%) | 2,428 (43.3%) |
| 26 to 34 Years | 3,644 (56.3%) | 2,829 (43.7%) |
| 35 to 44 Years | 3,340 (51.4%) | 3,155 (48.6%) |
| 45 to 54 Years | 4,240 (61.3%) | 2,681 (38.7%) |
| 55 to 64 Years | 4,668 (72.8%) | 1,745 (27.2%) |
| 65 to 74 Years | 3,955 (98.7%) | 54 (1.3%) |
| 75 Years and older | 2,886 (98.1%) | 55 (1.9%) |
| Total | 39,514 (71.5%) | 15,773 (28.5%) |
Health Insurance Coverage by Citizenship Status in Port Arthur
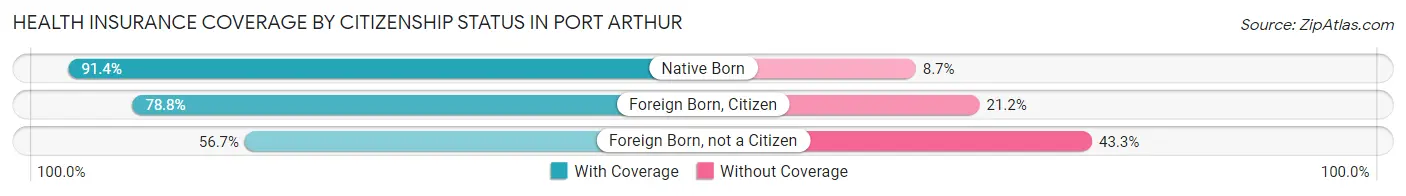
| Citizenship Status | With Coverage | Without Coverage |
| Native Born | 4,763 (91.3%) | 451 (8.6%) |
| Foreign Born, Citizen | 8,838 (78.8%) | 2,375 (21.2%) |
| Foreign Born, not a Citizen | 3,180 (56.7%) | 2,428 (43.3%) |
Health Insurance Coverage by Household Income in Port Arthur
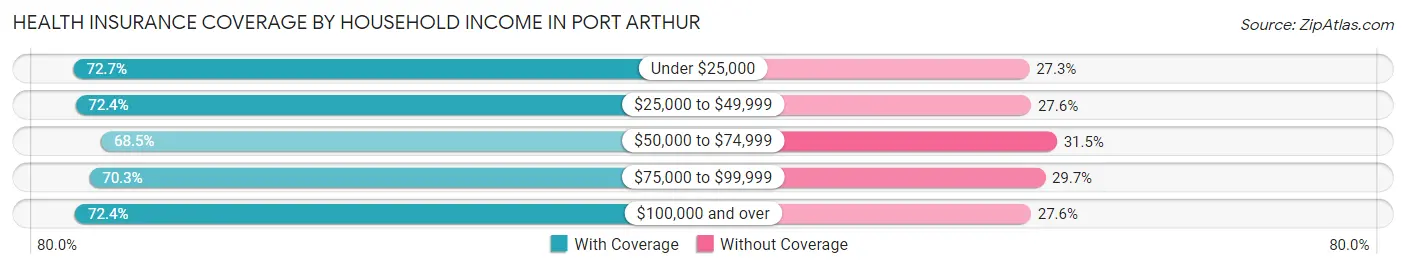
| Household Income | With Coverage | Without Coverage |
| Under $25,000 | 9,943 (72.7%) | 3,742 (27.3%) |
| $25,000 to $49,999 | 8,699 (72.4%) | 3,318 (27.6%) |
| $50,000 to $74,999 | 7,424 (68.5%) | 3,408 (31.5%) |
| $75,000 to $99,999 | 4,292 (70.3%) | 1,813 (29.7%) |
| $100,000 and over | 9,073 (72.4%) | 3,455 (27.6%) |
Public vs Private Health Insurance Coverage by Age in Port Arthur
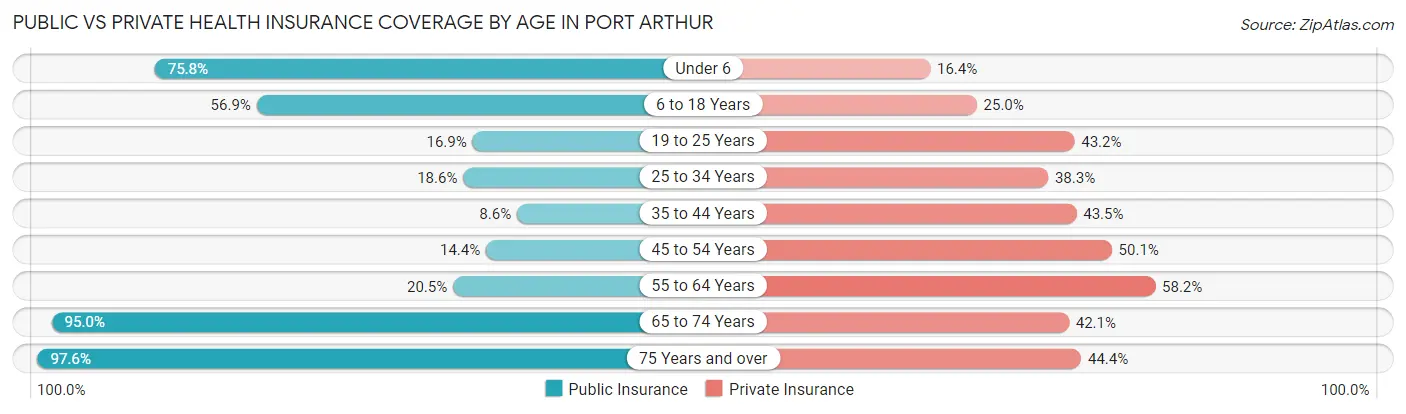
| Age Bracket | Public Insurance | Private Insurance |
| Under 6 | 3,954 (75.8%) | 854 (16.4%) |
| 6 to 18 Years | 6,384 (56.9%) | 2,805 (25.0%) |
| 19 to 25 Years | 945 (16.9%) | 2,420 (43.1%) |
| 25 to 34 Years | 1,203 (18.6%) | 2,477 (38.3%) |
| 35 to 44 Years | 559 (8.6%) | 2,827 (43.5%) |
| 45 to 54 Years | 993 (14.3%) | 3,467 (50.1%) |
| 55 to 64 Years | 1,313 (20.5%) | 3,729 (58.2%) |
| 65 to 74 Years | 3,808 (95.0%) | 1,689 (42.1%) |
| 75 Years and over | 2,870 (97.6%) | 1,306 (44.4%) |
| Total | 22,029 (39.8%) | 21,574 (39.0%) |
Disability Status by Sex by Age in Port Arthur
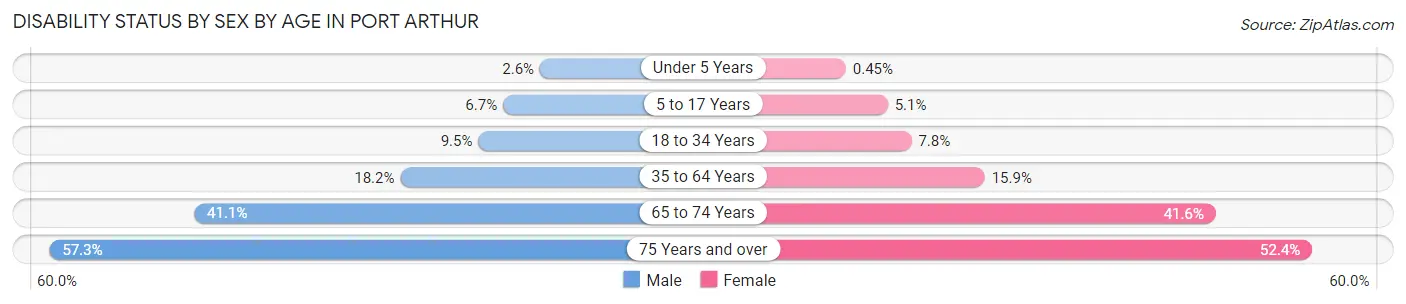
| Age Bracket | Male | Female |
| Under 5 Years | 58 (2.6%) | 10 (0.4%) |
| 5 to 17 Years | 368 (6.7%) | 294 (5.1%) |
| 18 to 34 Years | 612 (9.5%) | 494 (7.8%) |
| 35 to 64 Years | 1,727 (18.2%) | 1,643 (15.9%) |
| 65 to 74 Years | 835 (41.1%) | 824 (41.6%) |
| 75 Years and over | 687 (57.3%) | 912 (52.4%) |
Disability Class by Sex by Age in Port Arthur
Disability Class: Hearing Difficulty
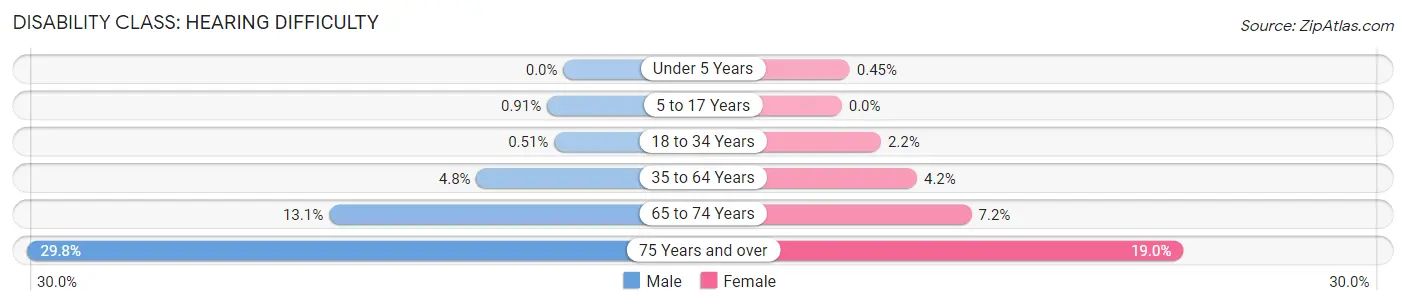
| Age Bracket | Male | Female |
| Under 5 Years | 0 (0.0%) | 10 (0.4%) |
| 5 to 17 Years | 50 (0.9%) | 0 (0.0%) |
| 18 to 34 Years | 33 (0.5%) | 139 (2.2%) |
| 35 to 64 Years | 460 (4.8%) | 432 (4.2%) |
| 65 to 74 Years | 265 (13.1%) | 143 (7.2%) |
| 75 Years and over | 358 (29.8%) | 331 (19.0%) |
Disability Class: Vision Difficulty
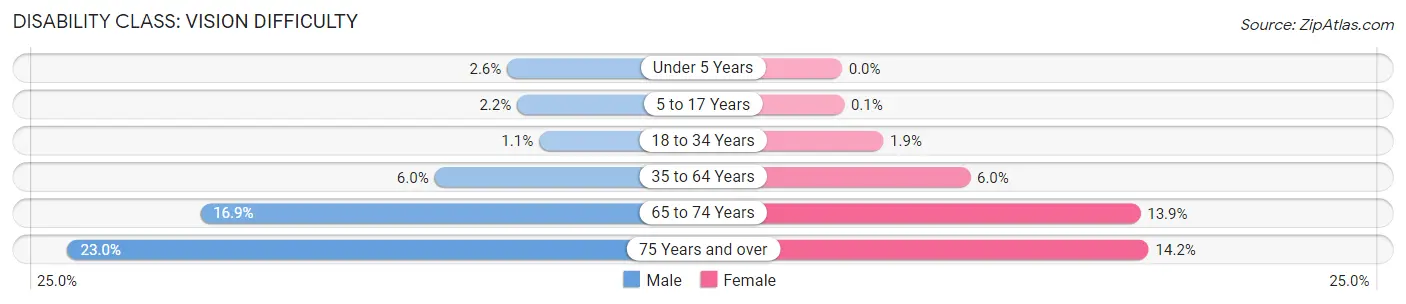
| Age Bracket | Male | Female |
| Under 5 Years | 58 (2.6%) | 0 (0.0%) |
| 5 to 17 Years | 118 (2.1%) | 6 (0.1%) |
| 18 to 34 Years | 73 (1.1%) | 122 (1.9%) |
| 35 to 64 Years | 569 (6.0%) | 614 (5.9%) |
| 65 to 74 Years | 342 (16.9%) | 274 (13.9%) |
| 75 Years and over | 276 (23.0%) | 248 (14.2%) |
Disability Class: Cognitive Difficulty
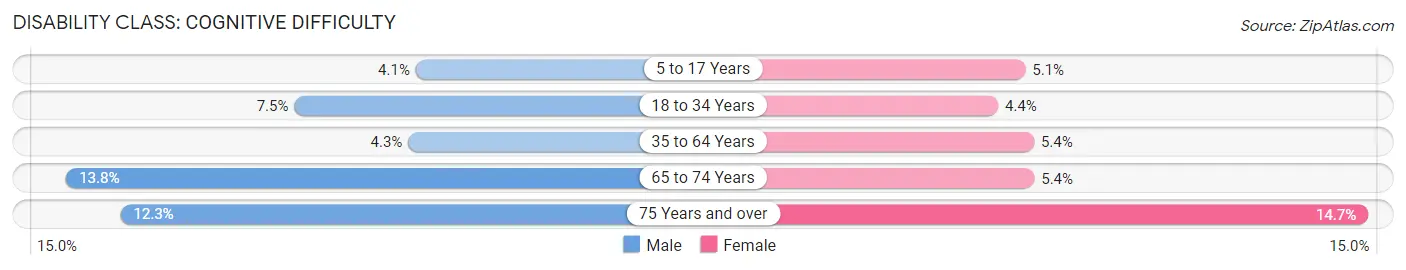
| Age Bracket | Male | Female |
| 5 to 17 Years | 225 (4.1%) | 294 (5.1%) |
| 18 to 34 Years | 484 (7.5%) | 277 (4.3%) |
| 35 to 64 Years | 411 (4.3%) | 552 (5.3%) |
| 65 to 74 Years | 281 (13.8%) | 106 (5.4%) |
| 75 Years and over | 148 (12.3%) | 255 (14.6%) |
Disability Class: Ambulatory Difficulty
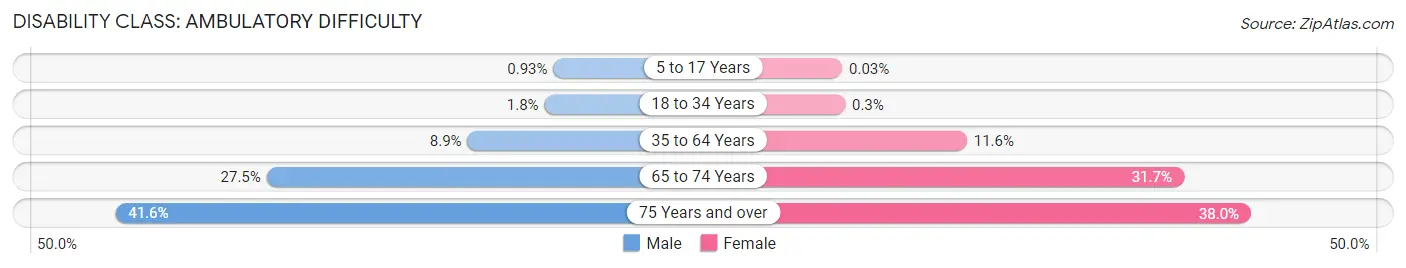
| Age Bracket | Male | Female |
| 5 to 17 Years | 51 (0.9%) | 2 (0.0%) |
| 18 to 34 Years | 114 (1.8%) | 19 (0.3%) |
| 35 to 64 Years | 846 (8.9%) | 1,197 (11.6%) |
| 65 to 74 Years | 559 (27.5%) | 628 (31.7%) |
| 75 Years and over | 499 (41.6%) | 661 (38.0%) |
Disability Class: Self-Care Difficulty
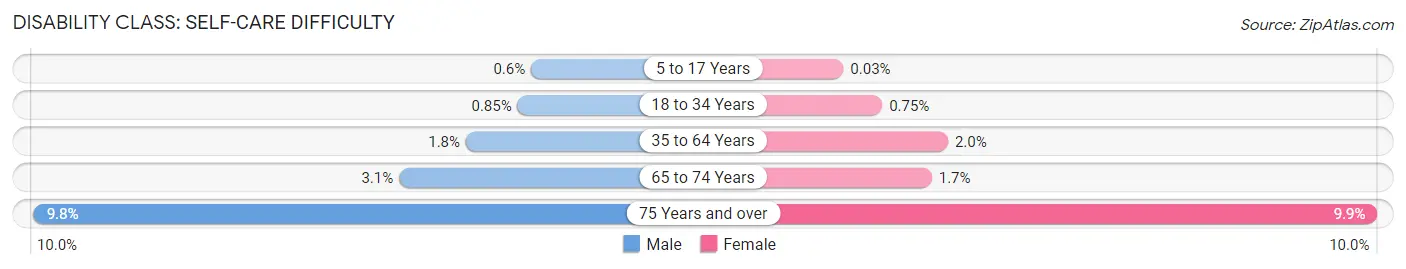
| Age Bracket | Male | Female |
| 5 to 17 Years | 33 (0.6%) | 2 (0.0%) |
| 18 to 34 Years | 55 (0.9%) | 48 (0.7%) |
| 35 to 64 Years | 172 (1.8%) | 203 (2.0%) |
| 65 to 74 Years | 62 (3.0%) | 33 (1.7%) |
| 75 Years and over | 118 (9.8%) | 173 (9.9%) |
Technology Access in Port Arthur
Computing Device Access in Port Arthur
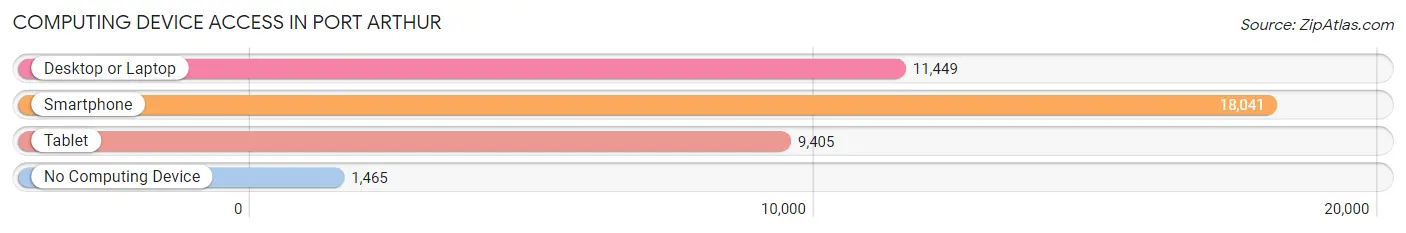
| Device Type | # Households | % Households |
| Desktop or Laptop | 11,449 | 56.2% |
| Smartphone | 18,041 | 88.6% |
| Tablet | 9,405 | 46.2% |
| No Computing Device | 1,465 | 7.2% |
| Total | 20,364 | 100.0% |
Internet Access in Port Arthur
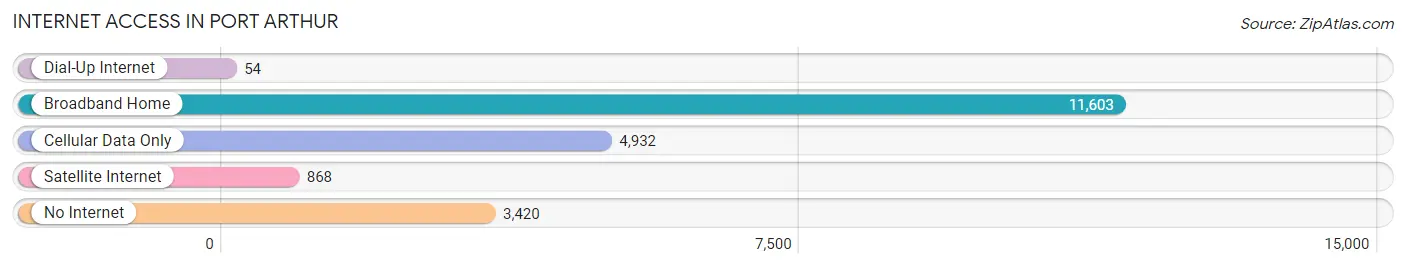
| Internet Type | # Households | % Households |
| Dial-Up Internet | 54 | 0.3% |
| Broadband Home | 11,603 | 57.0% |
| Cellular Data Only | 4,932 | 24.2% |
| Satellite Internet | 868 | 4.3% |
| No Internet | 3,420 | 16.8% |
| Total | 20,364 | 100.0% |
Port Arthur Summary
Port Arthur, Texas is a city located in Jefferson County, Texas, United States. It is situated on the Gulf Coast of Texas, approximately 90 miles east of Houston. The city is the largest in Jefferson County and is part of the Beaumont–Port Arthur metropolitan area. As of the 2010 census, the population of Port Arthur was 53,818.
History
Port Arthur was founded in 1837 by Arthur Stilwell, a railroad entrepreneur. Stilwell was looking for a deep-water port to serve as a terminus for his Kansas City, Pittsburg and Gulf Railroad. He chose the site of present-day Port Arthur because of its deep-water access and its proximity to the Gulf of Mexico. The city was incorporated in 1882 and was named after Stilwell.
In 1895, the city was devastated by a hurricane that destroyed much of the city. The city was rebuilt and by the early 1900s, it had become a major port and industrial center. During World War II, the city was home to a large shipbuilding industry and was a major supplier of oil and gas to the war effort.
In the 1950s, the city experienced a period of rapid growth and development. The city was home to a large petrochemical industry and was a major port for the import and export of oil and gas. The city also became a major tourist destination, with many people visiting the city to enjoy its beaches and attractions.
Geography
Port Arthur is located on the Gulf Coast of Texas, approximately 90 miles east of Houston. The city is situated on Sabine Lake, which is connected to the Gulf of Mexico by the Sabine-Neches Waterway. The city is bordered by the cities of Beaumont, Groves, and Port Neches.
The city has a total area of 33.3 square miles, of which 32.7 square miles is land and 0.6 square miles is water. The city is located at an elevation of 10 feet above sea level.
Economy
Port Arthur’s economy is largely based on the petrochemical industry. The city is home to several major oil refineries and chemical plants, including Valero Energy Corporation, Motiva Enterprises, and Total Petrochemicals USA. The city is also home to several major shipping ports, including the Port of Port Arthur and the Port of Sabine Pass.
The city is also home to several major employers, including the Port Arthur Independent School District, Lamar State College-Port Arthur, and the Port Arthur Health System. The city is also home to several major retail stores, including Walmart, Target, and Home Depot.
Demographics
As of the 2010 census, the population of Port Arthur was 53,818. The racial makeup of the city was 57.2% African American, 33.3% White, 0.7% Native American, 0.7% Asian, 0.1% Pacific Islander, 5.2% from other races, and 2.8% from two or more races. Hispanic or Latino of any race were 11.3% of the population.
The median income for a household in the city was $30,945, and the median income for a family was $37,945. The per capita income for the city was $17,845. About 22.2% of the population was below the poverty line.
Common Questions
What is Per Capita Income in Port Arthur?
Per Capita income in Port Arthur is $24,065.
What is the Median Family Income in Port Arthur?
Median Family Income in Port Arthur is $54,032.
What is the Median Household income in Port Arthur?
Median Household Income in Port Arthur is $45,357.
What is Income or Wage Gap in Port Arthur?
Income or Wage Gap in Port Arthur is 37.2%.
Women in Port Arthur earn 62.8 cents for every dollar earned by a man.
What is Family Income Deficit in Port Arthur?
Family Income Deficit in Port Arthur is $12,086.
Families that are below poverty line in Port Arthur earn $12,086 less on average than the poverty threshold level.
What is Inequality or Gini Index in Port Arthur?
Inequality or Gini Index in Port Arthur is 0.51.
What is the Total Population of Port Arthur?
Total Population of Port Arthur is 55,897.
What is the Total Male Population of Port Arthur?
Total Male Population of Port Arthur is 27,127.
What is the Total Female Population of Port Arthur?
Total Female Population of Port Arthur is 28,770.
What is the Ratio of Males per 100 Females in Port Arthur?
There are 94.29 Males per 100 Females in Port Arthur.
What is the Ratio of Females per 100 Males in Port Arthur?
There are 106.06 Females per 100 Males in Port Arthur.
What is the Median Population Age in Port Arthur?
Median Population Age in Port Arthur is 33.7 Years.
What is the Average Family Size in Port Arthur
Average Family Size in Port Arthur is 3.5 People.
What is the Average Household Size in Port Arthur
Average Household Size in Port Arthur is 2.7 People.
How Large is the Labor Force in Port Arthur?
There are 22,031 People in the Labor Forcein in Port Arthur.
What is the Percentage of People in the Labor Force in Port Arthur?
52.6% of People are in the Labor Force in Port Arthur.
What is the Unemployment Rate in Port Arthur?
Unemployment Rate in Port Arthur is 8.0%.